slovenia's report on demonstrable progress under the kyoto ... · pdf filerepublic of...
TRANSCRIPT

Republic of SloveniaMinistry of the Environment and Spatial Planning
July 2006
SLOVENIA’S REPORT ONDEMONSTRABLE PROGRESSUNDER THE KYOTO PROTOCOL

Published by:Ministry of the Environment and Spatial PlanningDunajska c. 48, SI-1000 Ljubljana, Slovenia
Co-ordinator:Andrej Kranjc, M.Sc.
Author of the report:Matjaž Česen, BSc (meteorology)
Design:Amela Špendl, ILLUSIO, d.o.o. Ljubljana
Printing:Medium, d.o.o., 600 copies
CIP - Catalogue-in-publicationNational and University Library, Ljubljana
504.3.05/.06(497.4)
ČESEN, Matjaž Slovenia's Report on Demonstrable Progress under the Kyoto Protocol / [author of the report Matjaž Česen]. - Ljubljana : Ministry of the Environment and Spatial Planning, 2006
ISBN 961-6392-43-3
227837952

INTRODUCTION.......................................................................7SUMMARY................................................................................9
1 POLICIES AND MEASURES
1.1 LEGISLATIVE AND INSTITUTIONAL STEPS TOWARDS ACHIEVING THE TARGETS OF THE KYOTO PROTOCOL ................................................. 131.1.1 Kyoto Target ........................................................... 131.1.2 Institutional Framework ........................................ 131.1.3 Legislative Framework .......................................... 131.2 NATIONAL POLICIES AND MEASURES .................. 161.2.1 Interdepartmental Measures ............................... 161.2.2 Energy Supply ........................................................ 171.2.3 Industry .................................................................. 191.2.4 Transport ............................................................... 201.2.5 Households and Services (Other Sectors) .......... 211.2.6 Waste ..................................................................... 231.2.7 Agriculture ............................................................. 241.2.8 Forestry .................................................................. 251.3 KYOTO MECHANISMS ........................................... 26
2 TRENDS AND PROJECTIONS OF GHG EMISSIONS
2.1 EMISSION INVENTORIES ...................................... 262.1.1 Total Emissions ..................................................... 272.1.2 Carbon Dioxide ...................................................... 282.1.3 Methane ................................................................ 292.1.4 Nitrous Oxide ......................................................... 292.1.5 F–gases ................................................................. 30
Table of Contents
Slovenia’s Report on Demonstrable Progress Under the Kyoto Protocol

Slovenia’s Report on Demonstrable Progress Under the Kyoto Protocol
2.2 DESCRIPTION OF SCENARIOS USED IN PROJECTIONS ........................................................ 302.2.1 Macroeconomic Scenario ..................................... 302.2.2 Scenarios for Implementing Policies and Measures ....................................................... 302.3 EMISSION PROJECTIONS BY SECTOR AND GAS ................................................................ 312.3.1 Emissions of CO2 ................................................... 312.3.2 Emissions of Other Greenhouse Gases ............... 322.3.3 Emissions by Sector .............................................. 342.3.4 Total Emissions ..................................................... 35
3 ASSESSMENT OF MEETING SLOVENIA'S KYOTO TARGET
3.1 EVALUATION OF TOTAL POTENTIAL OF MEASURES ....................................................... 373.2 ASSESSMENT OF MEETING SLOVENIA'S KYOTO TARGET ...................................................... 39
4.1 PROGRESS IN THE AREA OF NATIONAL GREENHOUSE GAS INVENTORIES ....................... 434.1.1 Institutional Framework ........................................ 434.1.2 Establishing a System for National Inventories .. 434.1.3 Standardisation of Energy Statistics ...................444.1.4 Establishing a System for Compiling Inventories 444.1.5 Improving Methods and Reducing Uncertainty ... 454.2 MEASURES FOR MITIGATION OF, AND ADAPTATION TO CLIMATE CHANGE ...................... 464.3 COOPERATION IN SCIENTIFIC AND TECHNOLOGICAL RESEARCH ............................... 474.4 CAPACITY BUILDING ESPECIALLY FOR
4 PROGRESS IN FULFILLING OTHER COMMITMENTS UNDER THE KYOTO PROTOCOL

Slovenia’s Report on Demonstrable Progress Under the Kyoto Protocol
DEVELOPING COUNTRIES IN THE FIELD OF CLIMATE CHANGE ............................................ 484.5 ASSISTANCE TO DEVELOPING COUNTRIES IN IMPLEMENTING THE CONVENTION ................. 48
APPENDIX I:ABBREVIATIONS................................................................... 49

Slovenia’s Report on Demonstrable Progress Under the Kyoto Protocol

Introduction
This report describes the progress made by Slovenia towards fulfi lling the requirements of the Kyoto Protocol to the United Nations Frame-work Convention on Climate Change, as required by paragraph 2, Article 3 of the Protocol. With the entry into force of the Kyoto Protocol on 16 February 2005, production of this report became obligatory. The content of the report is set out in the instructions adopted at the Con-ference of Parties in Marrakesh (Decision 22/CP.7), and comprises the following chapters:
• A description of domestic measures, including a description of leg-islative and institutional steps taken to fulfi l Slovenia’s commitments under the Kyoto Protocol.
• Trends and projections of greenhouse gas (GHG) emissions.
• An assessment of the contribution of domestic measures to achiev-ing Slovenia’s commitments under Article 3 of the Kyoto Protocol.
• A description of activities and programmes in Slovenia aimed at ful-fi lling the commitments under Articles 10 and 11 of the Kyoto Protocol.
The fourth national communication under the UN Framework Conven-tion on Climate Change, which contains the same information, was also drawn up parallel to this report. The difference lies in the fact that this report focuses on presenting the progress in fulfi lling the Kyoto Protocol commitments, while the fourth national communication offers a broader presentation of Slovenia’s activities in the area of climate change and GHG emissions.
Introduction
INTRODUCTION
7

Slovenia’s Report on Demonstrable Progress Under the Kyoto Protocol8

Summary
By ratifying the Kyoto Protocol Slovenia committed itself to reducing GHG emissions in the fi rst commitment period (2008–2012) by 8% compared to the base year (1986 for CO2, CH4 and N2O gases and 1995 for F-gases). GHG emissions in the base year were 20.24 Tg CO2 eq. In the period 2008–2012, therefore, Slovenia must achieve aver-age yearly emissions of 18.62 Tg CO2 eq. Slovenia will achieve this target by implementing domestic measures, through application of the Kyoto mechanisms and by including the sinks of CO2 through an in-crease of wood biomass. The permitted quota for sinks deriving from a growth in wood biomass for Slovenia amounts to 1.32 Tg CO2 pursuant to Decision 11/CP.7 adopted by the Conference of the Parties in Mar-rakesh. In order for the Kyoto target to be attained with the inclusion of sinks, average yearly emissions in the fi rst commitment period must not exceed 19.94 Tg CO2 eq.
In order to achieve the Kyoto target, Slovenia will implement numerous measures in all areas that contribute to greenhouse gas emissions. A broad selection of measures will be applied, ranging from legislative and fi scal measures to fi nancial assistance and voluntary agreements with those generating emissions. Most important here are the mea-sures in the Energy Supply sector, which is also the biggest source of GHG emissions. A reduction of emissions in this sector will be stimu-lated by replacing solid fossil fuels with natural gas, increasing the effi ciency of plants and installations, replacing old boilers with new ones and increasing the proportion of combined heat and power gen-eration, as well as by increasing the capacity for electricity and heat production from renewable energy sources, especially hydropower in the generation of electricity and wood biomass to produce heat. In the Energy Consumption sector, the measures of fi nancial incentives for implementing effi cient energy use (EEU) and renewable energy sourc-es (RES) stand out, along with more stringent requirements regarding the energy performance of buildings. In transport, emissions will be affected particularly by the increased effi ciency of vehicles and by the introduction of biodiesel. In the industrial sector, a further reduction in energy intensity is expected, along with a reduction in F-gas emissions, while the Waste sector should see a reduction in quantities of waste disposed in landfi lls, which will contribute to lower methane emissions. As for agriculture, the promotion of nature-friendly farming is expected, as well as the implementation of good agricultural practice in fertiliser
Summary
SUMMARY
9
use. An important place is also occupied by the interdepartmental measures of CO2 tax and International Emissions Trading, while in the future implementation of the Kyoto mechanisms Clean Development Mechanism (CDM) and Joint Implementation (JI) is also anticipated.
In 2003 GHG emissions were 2 % less than in 1986. Emissions of CO2 grew by 1 %, while emissions of other GHG fell by 12 %. Trends in CO2 emissions in the intervening period showed great variation, owing to numerous extraordinary events: independence and the transition to a new social order at the beginning of the nineties, the great growth in the sale of liquid fuels in the middle of the nineties owing to petrol tourism, termination of the export of half of the electricity generated by Slovenia’s nuclear power station at the end of the nineties and resumption of exports at the beginning of the new century, and at the same time the opening up of the electrical energy market. Alongside these extraordinary events, a reduction in CO2 emissions was spurred by the reduction in the energy intensity of the economy, the implemen-tation of EEU and RES measures and fuel switch in broad consump-tion, improvements in effi ciency and the replacement of fuels in the Energy Supply sector. The reduction in other emissions is a conse-quence of the reduced number of animals in farming, reduced quanti-ties of coal mined and technological improvements in the production of primary aluminium.
The projections of emissions were made on the basis of the most prob-able macroeconomic scenario and two scenarios for implementing measures and policies: “with measures”, which envisages a continua-tion of the current policy in the area of reducing GHG emissions, and “with additional measures”, which envisages an intensifi cation of the current policy and the introduction of new measures. According to both projections CO2 emissions will grow up to 2005, and then fall owing to fuel switch in the Energy Supply sector, and this will be followed by growth from 2008 to 2015 owing to the increased consumption of fi nal energy, with another decline after 2015 owing to fuel switch in the Energy Supply sector. According to both projections CH4 emissions will fall primarily through the reduced quantity of landfi lled waste, N2O emissions will remain practically unchanged, and according to the pro-jection with measures F-gas emissions will increase dramatically, with the projection with additional measures envisaging a dramatic reduc-tion owing to the implementation of regulations on F-gases. The total impact of all measures (implemented, adopted and additional) will amount to 2.6 Tg CO2 eq. in 2010, and to 5.3 Tg CO2 eq. in 2020. The
Summary10

largest proportion will be the effect of measures in the Energy sector, especially in Energy Supply.
Slovenia’s Kyoto target based on the emissions inventories presented in this report is 18.6 Tg CO2 eq. According to the projection with addi-tional measures, average yearly emissions in the period 2008–2012, without taking into account sinks, should amount to 19.92 Tg CO2 eq. Taking into account sinks in the amount of 1.3 Tg CO2, they amount to 18.6 Tg CO2 eq. Hence it follows that with an additional intensifi cation of measures as predicted in the scenario with additional measures, and by exploiting sinks, Slovenia will achieve its Kyoto target. How-ever, the following must be taken into consideration in drawing such a conclusion: in order to meet the Kyoto commitment, a revision of the Action Plan to Reduce GHG Emissions (AP-GHG) will be performed in 2006, where the additional measures will be defi ned in more detail, and this will include new projections. In addition to this, in the frame-work of the EU Emission trading scheme a new allocation plan of emission coupons for the period 2008–2012 will be drawn up this year, and this will set quotas for free emission coupons for the major-ity of the installations in the Energy Supply, Industrial Processes and Industry sectors.
In recent years the system of national greenhouse gas inventories has been radically improved, and further improvements are expected in 2006. Inventories are being compiled in accordance with UNFCCC and IPCC instructions.
An assessment of the impacts of climate change in Slovenia was made in 2003 for agriculture, forestry and water resources. At the same time, adaptation measures were also drawn up. At the end of 2005, a project entitled Vulnerability and Adaptation to Climate Change was initiated, and this will include all areas affected by climate change (such as energy, tourism, health and transport) at the national and regional levels.
Summary
SUMMARY
11

Slovenia’s Report on Demonstrable Progress Under the Kyoto Protocol12

CHAPTER 1
1 POLICIES AND MEASURES
1.1.1 Kyoto Target
In 2002 Slovenia ratifi ed the Kyoto Protocol which requires that Slovenia reduces its emissions in the period 2008–2012 by 8 % compared to the base year. For the gases CO2, CH4 and N2O the base year selected is 1986, while for F-gases (HFC, PFC and SF6) it is 1995. Slovenia is also a Member State of the European Union, within which it has retained its own individual target. The current assessment is that in the period 2008–2012 Slovenia will have to lower its emissions to 18.6 Tg CO2eq.
1.1.2 Institutional Framework
The umbrella institution for the area of reducing greenhouse gas emis-sions in Slovenia is the Ministry of the Environment and Spatial Plan-ning (MOP). The Ministry drafts strategic and operational documents and legal acts in the area of climate change, and is also in charge of reporting and monitoring implementation. The MOP is also competent for the area of waste management and spatial planning on the nation-al level (on the local level it confi rms plans). The area of transport falls within the competence of the Ministry of Transport, agriculture within the competence of the Ministry of Agriculture, Forestry and Food, and energy within that of the Ministry of the Economy.
1.1.3 Legislative Framework
The fi rst programme document in the area of reducing greenhouse gas (GHG) emissions in Slovenia was the Strategy with a short-term action plan for reducing greenhouse gas emissions, adopted in November 2000. The strategy set out the targets and basis for reducing GHG
1.1 Legislative and Institutional Steps Towards Achieving the Targets of the Kyoto Protocol
CHAPTER 1
Chapter One: Policies and Measures 13

emissions. It listed more than 120 measures for reducing emissions, although no time frame was given for the implementation of individual measures. The primary objective of the strategy was to draw up a basis for meeting the provisions of the Kyoto Protocol. The operational gap up until the adoption of the GHG emission reduction programme was fi lled by the short-term action plan to reduce GHG emissions, which was a component part of the strategy. It set out a concentration of 30 measures and activities that the Slovenian Government started to implement in 2001.
The Action Plan to Reduce GHG Emissions (AP-GHG) was adopted in July 2003 and supplemented in 2004. It represents Slovenia’s key programme document in the area of achieving the Kyoto target. It contains 22 instruments for implementing measures to reduce GHG emissions in all relevant sectors (energy, transport, industry, broad consumption, agriculture and forestry). This year a revision of the ac-tion plan will be performed, and this will include an assessment of the implementation of measures thus far and an assessment of progress towards achieving the Kyoto target, on the basis of which additional measures will be drawn up and the intensity of implementing existing measures will be adjusted. In addition to this, it is anticipated that responsibility for implementing measures will be allocated among ministries.
In 2004 Slovenia became a Member State of the European Union (EU). The process of joining also involved the harmonisation of Slovenia’s legal order with that of the EU. The result of this is that the majority of instruments for implementing the Kyoto Protocol and set out in the AP-GHG stem from the alignment of Slovenia’s legal order with the EU acquis. Moreover, since 2004, as a full Member State Slovenia has been bound to implement the common measures of European policy in the area of GHG emissions1.
Among the programme documents an important place is occupied by the Resolution on the National Environmental Action Programme for the Period 2005–2012 (ReNEAP), which was adopted in November 2005 and is the basic strategic document in the area of environmen-tal protection. For the area of climate change the following goals are important: treat climate change as a major challenge in the coming years, reduce emissions of greenhouse gases and in this way contrib-
1 Common measures are presented in the fourth national communication attachment.
Chapter One: Policies and Measures14

1.1.3.1 Sectoral Programmes
The goals and measures that contribute to reducing greenhouse gas emissions are included in sectoral programmes. Pursuant to the Energy Act this is a compulsory component of energy policy, and this was also accommodated in the Resolution on the National Energy Pro-gramme (OGRS 57/04) (ReNEP), which sets out the following goals: • Increasing the effi ciency of energy use by 10 % up to 2010 relative to 2004 in industry and service sector, in public sector by 15 %, in buildings by 10 %, and in transport by 10 %; a doubling of the propor-tion of electrical energy from cogeneration from 2000 to 2010.• Increasing the share of renewable energy sources in the primary energy balance from 8.8 % in 2001 to 12 % by 2010, in supplying heat from 22 % in 2002 to 25 % in 2010, electrical energy from RES from 32 % in 2002 to 33.6 % in 2010, and reaching a 2 % share of biofuels in transport by the end of 2005.
The Resolution on the Transport Policy of Slovenia, which is in parlia-mentary reading (the Government adopted it in July 2005), defi nes the principles and measures for attaining the goals and the key managers of transport policy, and envisages implementing documents with de-tailed defi nitions of goals and activities. Among the priority goals third place is occupied by effi cient energy use and a clean environment, in the area of passenger transport the priority goal is an entire system of public transport whose price attractiveness and quality of services will encourage the transfer of passengers from private to public transport, and in the area of goods transport the securing of a greater share of international and transit goods by the railways. The resolution for the fi eld of transport represents an important step towards sustainable mobility, since thus far in the transport area the emphasis has been mainly on constructing motorway transport infrastructure. For the area of agriculture we should highlight the Slovenian Agricultural Environ-mental Programme (SAEP), which in 2004 was included in the Rural Development Programme for Slovenia 2004–2006 (OGRS 116/04), and in which an important place is occupied by measures to promote sustainable forms of farming. In the area of waste the Government
ute to the long-term objective to stabilise greenhouse gase concentra-tions in the atmosphere, waste management and the use of renewable and non-renewable natural resources, which permit sustainable pro-duction and consumption, and contribute to reducing environmental pollution and energy consumption in such a way that does not exceed the loading capacity of the environment.
Chapter One: Policies and Measures
CHAPTER 1
15

adopted the Operational Programme for the Management of Packag-ing and Waste Packaging and the Operational Programme for Waste Disposal with the Aim of Reducing Quantities of Biodegradable Waste for the period up to the end of 2008. The former provides goals (50 % recycling of the entire mass of waste packaging by the end of 2007, 60 % mass proportion of recycling by the end of 2012) and measures for managing packaging, while the latter covers waste disposal sites and the construction of new infrastructure for waste management, separate collection of waste and recycling, waste incineration and dis-posal of biodegradable waste. It sets out the following goals: to direct into processes prior to waste removal at least 65 % or more of gener-ated quantities of municipal waste and (in the net amount) secure material use of at least 42 %, separate all cooking waste and process it biologically, treat the remaining waste in such a way that the total organic carbon content will not exceed 5 %, and reduce the quantities of landfi lled biodegradable waste from 47 % to 16 % by 2013 or 2015.
1.2 National Policies and Measures
This chapter provides a brief overview of the most important measures for reducing GHG emissions carried out up to 2005. The measures are presented by IPCC methodology sectors and by the gases that are most affected.
1.2.1 Interdepartmental Measures
Some measures affect several sectors simultaneously. These include the CO2 tax and emission trading.
CO2 tax (status: implemented; gas: CO2)The CO2 tax was the fi rst important measure in the area of reducing GHG emissions. It was introduced in 1997. The tax is paid for the use of fuels and incineration of combustible organic matter. The rate of this tax is SIT 3/kg CO2. The new Decree on the environmental tax for polluting the air with carbon dioxide emissions, published on 29 April 2005 in the Offi cial Gazette of the Republic of Slovenia No 43/05, allows a reduction in the payment of environmental tax only for those managers of plants that in connection with the operation of such plants have signed a contract with the ministry responsible for environ-mental protection on reducing the burden on the air from CO2 emis-sions for the period 2005–2009, on the basis of which in the target
Chapter One: Policies and Measures16

period up to 2009 companies will have to reduce specifi c CO2 emis-sions by at least 2.5 % relative to the specifi c annual CO2 emissions in the reference year, which for existing plants is the year between 1999 and 2002 in which the total annual specifi c CO2 emission from the use of fuel and consumption of electricity at the plant was greatest. This reduction will be achieved through the implementation of contractually defi ned measures which, however, will not be confi ned to direct emis-sion reduction, but might extend to the widest sphere of effi cient en-ergy use. The other new feature introduced by the new decree is that from now on energy intensive companies (where energy costs account for at least 3 % of the production price) that are included in the system of emission trading and have at the same time obtained permits to emit greenhouse gases will be exempt from payment of the CO2 tax.
Emission trading (status: implemented; gas: CO2)On 1 January 2005 the European Union saw the start of trading in carbon dioxide (CO2) emissions. The operation of the emission cou-pons market provides players with greater possibilities and more room for manoeuvre; consequently reductions in emissions will be achieved primarily among those where it will prove to be economically justi-fi ed, while the rest will buy additional emission coupons. In Slovenia, 96 installations in all are included in the trading system, accounting for roughly 55% of all CO2 emissions in Slovenia. In the second half of this year a new national allocation plan will be drawn up for the 2008– 2012 trading period.
1.2.2 Energy Supply
Energy supply is the biggest source of CO2 emissions in Slovenia. The objectives of measures in this sector are an increase in the propor-tion of renewable energy sources (RES) and cogeneration in electricity generation and more environmentally friendly production of electrical energy (fuel switching).
Emission trading is an important measure for the Energy sector, since all electricity generating plants are included in the emission trading system.
Chapter One: Policies and Measures
CHAPTER 1
17

Opening of the electricity and natural gas market (status: partly imple-mented; gas: CO2)The electrical energy market was opened up for all consumers ex-cept households in 2004, while the natural gas market was opened in 2003 for customers using 25 million m3 of natural gas or more annually, and in 2004 the market opened for all consumers except households. Final opening of both markets will be completed in 2007. Opening up the electricity market affects greenhouse gas emissions indirectly by changing the structure of electricity generation and through the greater scope for imports, if Slovenia’s own production is not competitive or environmentally appropriate. Opening up the market for natural gas infl uences the price of this energy product. With the construction of the necessary additional transmission capacities and a competitive market price for natural gas, we may realistically expect an increase in the current minimal share of natural gas in the generation of electricity, both through the partial transfer from coal to natural gas and through the construction of new power stations fuelled by natural gas.
Construction of large hydro power plants (status: in progress; gas: CO2)Since 2002 the construction of a chain of fi ve large hydro power plants (HE) has been under way on the Sava River. Construction of the fi rst is due to fi nish in the fi rst half of 2006. Mean annual production will be 115 GWh. Construction on the second began in 2005. Plans call for completion of the entire project in 2018. The total annual capacity of all the HE will be 720 GWh. Refurbishment of two existing HE (HE Med-vode on the Sava and HE Zlatoličje on the Drava) is also under way.
Removal of barriers for energy utilisation of wood biomass (status: implemented; gas: CO2)Under this project, which is being conducted with the assistance of the UNDP Regional Support Centre, the Department of Effi cient Energy
Promotion of electricity production from renewable sources and com-bined heat and power generation (status: implemented; gas: CO2)Promoting the production of electrical energy from RES and cogenera-tion is conducted via a feed-in tariff system for qualifi ed electricity generators. The Energy Act defi nes qualifi ed production of electricity as production from renewables, waste and in power stations with extra high effi ciency combustion of fossil fuels with combined heat and power generation. The Decree on prices and rules for purchasing elec-tricity from qualifi ed producers established the feed-in tariff system for the majority of qualifi ed producers.
Chapter One: Policies and Measures18

1.2.3 Industry
Measures in industry are geared primarily towards increasing energy effi ciency, which is also in the interest of the economy for reasons of competitiveness, while measures to increase the use of RES are also important.
A large section of industry is involved in emission trading, while the rest is involved in the CO2 tax system. These two measures encourage an increase in energy effi ciency. Another important measure in the Industry sector is the promotion of combined heat and power genera-tion with feed-in tariffs.
Measures to promote EEU and use of RES (status: implemented; gas: CO2)The Department of Effi cient Energy Use and Renewable Energy Sources at the Ministry of the Environment and Spatial Planning is subsidising energy check-ups at companies and feasibility studies for major energy supply projects and effi cient energy use. In addition to this it is also subsidising investment in the use of wood biomass and other RES. The Slovenian Ecological Fund is also promoting investment in the form of loans with favourable interest rates. A direct infl uence
Table 1-1: Impact of measures in the Energy Supply sector for 2010
Energy SupplyImpact of measure
in 2010[Gg CO2eq.]
Promotion of electricity production from renewable sources and combined heat and power generation
300
Opening of the electricity and natural gas market
660
Construction of large hydroelectric stations 180
TOTAL 1140
Use and Renewable Energy Sources is promoting the use of wood biomass for district heating. With the help of this project two district heating systems were completed in 2005, while three smaller systems are in the preparation phase. Cofi nancing of feasibility studies is also being provided. As part of this project numerous promotional and infor-mational activities have also been cofi nanced.
Chapter One: Policies and Measures
CHAPTER 1
19

Table 1-2: Impact of measures in the Industry sector for 2010
Industry2
Impact of mea-sure in 2010[Gg CO2eq.]
EEU in industry 460
2 The effect of increasing the proportion of cogeneration in industry is taken into ac-count in Table 1-1 within the impact of the measure Promoting electricity generation from renewable sources and combined heat and power generation.
1.2.4 Transport
Increased effi ciency of vehicles (status: implemented; gas: CO2)The following measures are aimed at increasing vehicle effi ciency: in-forming consumers of the fuel consumption and CO2 emissions of new personal vehicles; the agreement between the European Commission and car manufacturers on reducing CO2 emissions of new vehicles; compulsory control of the composition of exhaust gases and proper adjustment of motor vehicle engines.
Excise duties on fuels (status: implemented; gas: CO2)Alongside budget revenues, excise duties also represent a measure for reducing CO2 emissions by infl uencing the price of fuels. The level of excise is determined by the Government by aligning the prices of petroleum products with the trends in crude oil prices and the US dollar rate. Excise duty on unleaded petrol rose by 56 % in the pe-riod 2000– 2004, and that on diesel by 29 %. The excise policy has resulted in the increased difference between the price of petrols and gas oils and in approximating the price of motor fuels to the European average.
Promoting the use of biofuels (status: implemented; gas: CO2)Through the amendment to the Excise Duties Act adopted in De-cember 2003, biofuels used as motor fuels are defi ned as products subject to excise duty with an excise duty rate of 0%. The next step
on effi cient energy use in industry is also exerted by the environmental protection permit (IPPC), where in order to obtain a permit compa-nies must demonstrate that they are using energy effi ciently, and the ISO 14001 certifi cate, since certifi cate holders have drawn up pro-grammes of reduced energy use.
Chapter One: Policies and Measures20
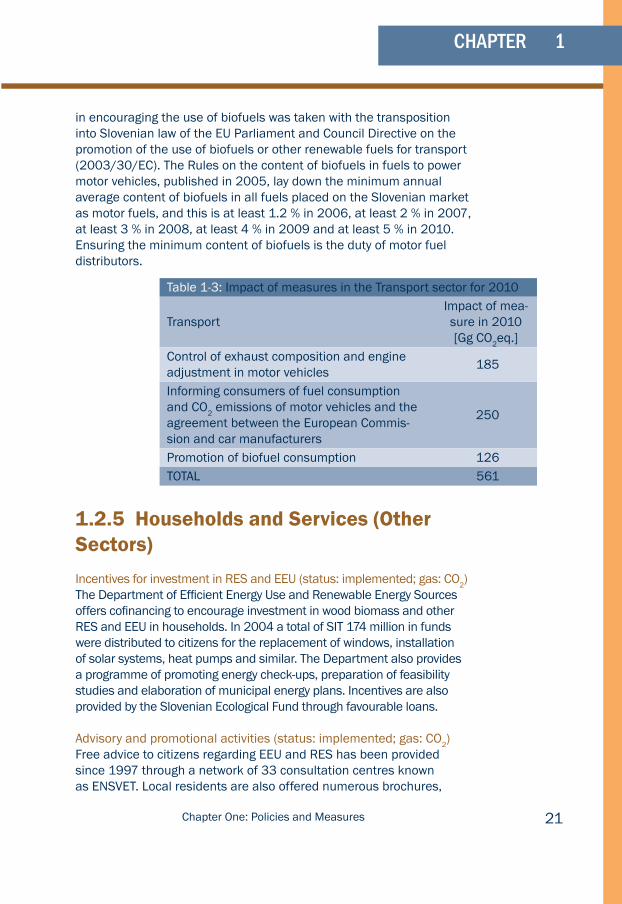
in encouraging the use of biofuels was taken with the transposition into Slovenian law of the EU Parliament and Council Directive on the promotion of the use of biofuels or other renewable fuels for transport (2003/30/EC). The Rules on the content of biofuels in fuels to power motor vehicles, published in 2005, lay down the minimum annual average content of biofuels in all fuels placed on the Slovenian market as motor fuels, and this is at least 1.2 % in 2006, at least 2 % in 2007, at least 3 % in 2008, at least 4 % in 2009 and at least 5 % in 2010. Ensuring the minimum content of biofuels is the duty of motor fuel distributors.
Table 1-3: Impact of measures in the Transport sector for 2010
TransportImpact of mea-sure in 2010[Gg CO2eq.]
Control of exhaust composition and engine adjustment in motor vehicles
185
Informing consumers of fuel consumption and CO2 emissions of motor vehicles and the agreement between the European Commis-sion and car manufacturers
250
Promotion of biofuel consumption 126TOTAL 561
1.2.5 Households and Services (Other Sectors)
Incentives for investment in RES and EEU (status: implemented; gas: CO2)The Department of Effi cient Energy Use and Renewable Energy Sources offers cofi nancing to encourage investment in wood biomass and other RES and EEU in households. In 2004 a total of SIT 174 million in funds were distributed to citizens for the replacement of windows, installation of solar systems, heat pumps and similar. The Department also provides a programme of promoting energy check-ups, preparation of feasibility studies and elaboration of municipal energy plans. Incentives are also provided by the Slovenian Ecological Fund through favourable loans.
Advisory and promotional activities (status: implemented; gas: CO2)Free advice to citizens regarding EEU and RES has been provided since 1997 through a network of 33 consultation centres known as ENSVET. Local residents are also offered numerous brochures,
Chapter One: Policies and Measures
CHAPTER 1
21

Raising the effi ciency of heating and air conditioning units and house-hold appliances (status: implemented; gas: CO2)Between 1996 and 2004 the purchase of high-effi ciency household appliances and windows with high heat insulation was tax-deductible. In 2001 legislation was adopted that requires sellers of household appliances to mark appliances with energy labels. In 2003 and 2004 the range of goods was extended to cover electric ovens and air con-ditioning units. Optimum functioning of central heating boilers and air conditioning systems is important from the aspect of EEU, since poor maintenance can drastically increase energy consumption. For this reason compulsory annual inspections of all small boilers and air con-ditioning units were introduced. An important measure for increasing EEU in apartment buildings is the charging of heating costs by actual consumption, whereby residents have an incentive to lower their con-sumption of heating energy.
Thermal protection of buildings (status: implemented; gas: CO2)In 2002 the Rules on thermal insulation and effi cient energy use in buildings were adopted, thereby laying down stricter technical require-ments for thermal insulation and effi cient use of energy in new and reconstructed buildings. In this way buildings constructed after 2002 require at least 30 % less heating compared to buildings constructed according to the earlier regulations from 1980. In 2006, pursuant to the Directive on the energy performance of buildings, more stringent minimum requirements are being drawn up for energy consumption, such that the heat demand in buildings will be reduced by at least 15 % compared to 2002, and total energy supplied for the function-ing of buildings will be 30 % less than the currently valid practice for buildings.
The 2002 Rules also introduced the obligatory building thermal char-acteristics certifi cate (a precursor of the building energy certifi cate), and compulsory certifi cation of buildings will be introduced in 2009.
Contracting (status: in progress; gas: CO2)Third party fi nancing and contracting for effi cient energy supply are measures that represent a possibility for renovating old energy sys-tems and improving living conditions, as well as reducing the detrimen-tal impact on the environment in cases where insuffi cient means are available for investing in new or improved energy systems, primarily in
information leafl ets and other publications in these two fi elds on the websites of the consultation network, the Department of EEU and RES and the portal energetika.net.
Chapter One: Policies and Measures22

the public sector and in small and medium sized enterprises. In 2001, a pilot project of contractual supply of energy savings was started in the City of Kranj, proving the possibility of reducing energy consump-tion in the public sector by up to 15 %. By 2005, there were several other minor examples of third party fi nancing in Slovenia.
Table 1-4: Impact of measures in the Households and Services sector for 2010
Households and Services (Other Sectors)Impact of mea-sure in 2010[Gg CO2eq.]
Incentives for implementing EEU measures and for investment in RES
300
Raising the effi ciency of heating and air condi-tioning units and household appliances
119
Thermal protection of buildings 310
Third party fi nancing 7
TOTAL 736
1.2.6 Waste
Reducing the quantity of waste (status: in progress; gas: CH4)Reducing the quantity of waste is Slovenia’s main goal in the area of waste. This will be achieved through various measures. A tax on waste disposal encourages landfi ll owners to reduce the quantities of waste disposed. Introducing systems of separate waste collection and collection centres will contribute to reducing the quantities of waste at source. Implementation of the Operational Programme for the Management of Packaging and Waste Packaging will also contribute dramatically to this.
Capture and energy use of landfi ll gas (status: implemented; gas: CH4)The Rules on waste disposal require all landfi lls to arrange the cap-ture and appropriate management of landfi ll gas by the end of 2005. In 2003 the capture and use of landfi ll gas was established only at the three biggest landfi lls (Ljubljana–Barje, Maribor–Pobrežje, Celje–Bukovžlak), which proportionally account for around 30 % of the total population. In 2003 15 % of the landfi ll gas was captured and used for energy. An incentive for the capture and energy use of landfi ll gas has
Chapter One: Policies and Measures
CHAPTER 1
23

Table 1-5: Impact of measures in the Waste sector for 2010
WasteImpact of mea-sure in 2010[Gg CO2eq.]
Reducing the amount of waste 29
Capture and energy use of landfi ll gas 74
TOTAL 103
1.2.7 Agriculture
Slovenian Agricultural Environmental Programme and Rural Develop-ment Programme (status: implemented; gas: CH4, N2O)In the area of farming the Slovenian Agricultural Environmental Pro-gramme 2001–2006 (SAEP) was adopted in 2001, and while it is not directly orientated towards reducing GHG emissions, it did contain cer-tain measures contributing to this (encouraging organic and integrated farming, preserving crop rotation, reducing erosion, greening of arable surfaces, encouraging mountain pasturing, nature-friendly breeding of domestic animals and the preservation of extensive grassland). Measures were implemented in the form of providing direct payments to farmers. The programme was voluntary. The Rural Development Pro-gramme (2004–2006) (RDP) was adopted in 2004, and this included agricultural environmental measures from the SAEP. Moreover under the RDP fi nancing is provided for the construction of storage facilities for animal manure.
Good agricultural practice in fertiliser application (status: implement-ed; gas: N2O)The Rules for the implementation of good agricultural practice in fertiliser use lay down detailed instructions for the storage of animal manure and fertiliser application, while the Decree on the input of haz-ardous substances and plant nutrients into the soil of 2005 declare the entire territory of Slovenia a sensitive area, whereby the annual input of nitrogen through animal manure is limited to 170 kg/ha. These two documents represent the basis for reducing N2O emissions in fertiliser application. An important part is also played by expert and advisory work.
also been provided in the form of a reduction in the waste disposal tax if the landfi ll is equipped with facilities for the capture and incineration or energy use of biogas.
Chapter One: Policies and Measures24

1.2.8 Forestry
Sustainable forest management (status: implemented; gas: CO2)In 1996 Slovenia’s forest development programme was adopted, and this sets out the national policy of co-natural forest management, the orientation towards preservation and development of forests, and the conditions for their exploitation or multi-purpose use. Taking into account the natural properties of forest ecosystems, public interests, the material capacity of the state and the needs and interests of forest owners, this programme lays the foundations for the preservation and development of all forests and their functions. It has formed the devel-opment strategy for individual areas of forest management, and it also indicates the expert orientations regarding cooperation with activities that interface with forestry. Owing to the relatively large share of forest in Slovenia (57 %), the programme focuses primarily on care for the existing forests and on better use of their growing potential, and also on preservation, and the designing and planning of individual trees and stands of forest trees outside forests.
Table 1-6: Impact of measures in the Agriculture sector for 2010
Agriculture and ForestryImpact of mea-sure in 2010[Gg CO2eq.]
Slovenian Agricultural Environmental Pro-gramme and Rural Development Programme
> 9
Good agricultural practice in fertiliser applica-tion
11
Promotion of biogas for electricity and heat production3 20
TOTAL > 40
3 This measure falls within the group Incentives for implementing EEU measures and for investing in RES.
Chapter One: Policies and Measures
CHAPTER 1
25

1.3 Kyoto MechanismsIn 2005 intensive preparations began for implementation of the Kyoto mechanisms of JI and CDM. Guidelines are being drawn up for the implementation of projects, and a designated national authority / focal point and contact person have been appointed. In addition to this, interest on the part of the commercial sector has been discernible, es-pecially regarding investment in the countries of the former Yugoslavia.
Chapter One: Policies and Measures26

2 TRENDS AND PROJECTIONS OF GHG EMISSIONS
2.1 Emission Inventories
2.1.1 Total Emissions
In 2003 a total of 19.8 Tg CO2 eq. of greenhouse gases were emitted in Slovenia into the atmosphere. The major contribution to total emis-sions came from carbon dioxide (81 %), followed by methane (10 %) nitrogen oxide (8 %) and F-gases (1 %). Emissions were 2 % lower compared to 1986, which was attributable mainly to a reduction in non-CO2 gases, while CO2 emissions rose slightly.
A breakdown of emissions by sector shows that the biggest source is the Energy sector (80 %), followed by Agriculture (10 %), Industrial Processes (6 %) and Waste (4 %).
0
5
10
15
20
25
1986 1990 1991 1992 1993 1994 1995 1996 1997 1998 1999 2000 2001 2002 2003
Year
GH
Gem
issi
ons
in T
g CO
2eq
.
CO2 CH4 N2O F-gases
Figure 2-1: GHG emissions by gas
Chapter Two: Trends and Projections of GHG Emissions
CHAPTER 2
27

2.1.2 Carbon Dioxide
In 2003 CO2 emissions were 1 % higher than in the base year. In the intervening period emission levels showed great variation. The marked reduction in emissions at the beginning of the nineties was the result of economic upheavals associated with the transition to a new social order and with independence. This is shown in the drastic reduction in emissions in the Energy Supply and Industry and Construction sec-tors. This was followed by a growth in emissions that peaked in 1997, a consequence of the growth in the consumption of liquid fuels in the areas of Transport and Other Sectors. There was especially intensive growth in the consumption of liquid fuels in the Transport sector, which resulted from the low price of motor fuels in Slovenia compared to neighbouring countries and the growth in the volume of road traffi c. The peak was followed by a drop in emissions owing to the reduced consumption of liquid fuels in transport. In 1999 and 2000 there were also lower emissions in the Energy Supply sector owing to a surplus of electrical energy from the Krško nuclear power station (NEK) upon the suspension of exports of half the electricity to Croatia, and this contrib-uted to lower consumption of solid fuels in thermal power stations. In 2000 there was a marked jump in emissions from the Energy Supply sector caused by greater use of solid fuels, which on the one hand was a consequence of resumed exports of half the electricity from NEK, and on the other hand a consequence of opening up the market for electrical energy and increased consumption of electricity. Alongside the above-described extraordinary events, which affected emission levels, a major impact on emissions was exerted by the reduction in energy intensiveness owing to restructuring (increasing the proportion of services in value added at the expense of industry, reducing the pro-portion of energy-intensive activities) and owing to the implementation of effi cient energy use measures, particularly in industry.
Chapter Two: Trends and Projections of GHG Emissions28

0
2
4
6
8
10
12
14
16
18
1986 1990 1991 1992 1993 1994 1995 1996 1997 1998 1999 2000 2001 2002 2003
Year
CO
2em
issi
ons
inTg
Other Other sectors Transport
Ind. and con. Energy supply
Figure 2-2: CO2 emission levels by sector
2.1.3 Methane
In 2003 methane emissions of 1,974 Gg CO2 eq. represented a reduc-tion of 12 % from the base year. This was a consequence of reducing fugitive emissions owing to the reduced quantities of coal mined and especially the reduced emissions from farming owing to the lower number of animals. On the other hand, emissions grew in the Waste sector owing to the increased quantity of waste disposed.
2.1.4 Nitrous Oxide
Emissions of N2O amounted to 1,503 Gg CO2 eq. in 2003. This is 9 % less than in the base year. The reduction in emissions is a conse-quence of lower emissions in agriculture owing to the reduced number of animals.
Chapter Two: Trends and Projections of GHG Emissions
CHAPTER 2
29

2.1.5 F–gases
Total emissions of F-gases amounted to 223 Gg CO2 eq. in 2003. In the period 1995–2003 emissions fell by 17 %. This is a consequence of lower PFC emissions owing to technological improvements in aluminium production. On the other hand, HFC emissions showed a dramatic rise owing to the increased use in cooling and air condition-ing units.
2.2 Description of Scenarios Used in Projections2.2.1 Macroeconomic Scenario
A scenario postulating moderate economic growth was used for emis-sion projections, assuming 3.6 % annual growth in GDP in the period 2000 to 2010, and a lower growth of 2.2 % for 2010 to 2020. The population will gradually fall in this scenario at a rate of 0.1 % per year. Fuel prices were taken from international studies (IEA).
2.2.2 Scenarios for Implementing Policies and Measures
The implementation of emission reduction policies and measures was modelled with two scenarios: “with measures” and “with additional measures”, and these are presented below by sector.
EnergyThe “with measures” scenario assumes the continuation of current policies, which are characterised by a low level of measure implemen-tation. For the Energy sector this means the slower replacement of coal with natural gas, the slower reduction in specifi c energy consump-tion and a lower rate of increase for capacities using renewable energy sources in comparison with the “additional measures” scenario. The latter only applies to Local Supply and Energy Use, while the produc-tion of electricity from large HE and JE is the same in both scenarios.
Transport For the Transport sector, the “with measures” scenario anticipates the
Chapter Two: Trends and Projections of GHG Emissions30

continued implementation of measures that are already in force (mea-sures to increase vehicle effi ciency and excise duties), with the excep-tion of the measure to promote the use of biofuel in transport. This measure is taken into account in the “additional measures” projection, which also anticipates an additional reduction in emissions owing to the increased use of public transport and rail transport.
Industrial ProcessesIn the Industrial Processes scenario, the “with measures” scenario foresees implementation of the IPPC directive, while the “additional measures” scenario also includes implementation of Regulations on F-gases.
WasteThe “with measures” scenario in the Waste sector anticipates the implementation of measures to reduce waste at source and a mea-sure for collection and combustion of landfi ll gas. The “additional measures” scenario also includes waste incineration, which will lead to a reduction in the quantity of landfi lled waste.
AgricultureIn Agriculture, the “with measures” scenario includes all the imple-mented measures (SAEP, RDP and Good agricultural practice in fertilis-er application), while in the “additional measures” scenario emissions are further reduced by 50 Gg CO2 eq., which will be achieved through additional measures.
Solvent UseNo measures are envisaged in the Solvent Use sector.
2.3 Emission Projections by Sector and Gas2.3.1 Emissions of CO2
In both projections CO2 emissions will increase until 2005, followed by a fall up to 2008, with growth again until 2015, and then another drop up until 2020. Emission trends are very similar in the two scenarios, with differences in emissions stemming mainly from the difference in 2005. In 2010 emissions in the additional measures scenario will be 1.2 % higher than emissions in 2003, and 4 % higher in 2020. The fi rst and second declines in emissions are the consequence of a fuel changeover (coal replaced by natural gas) in the Energy Supply sector,
Chapter Two: Trends and Projections of GHG Emissions
CHAPTER 2
31

while the growth in emissions from 2008–2015 is the consequence of growth in fi nal energy consumption in Transport, Industry and Other Sectors. According to the additional measures scenario, primary en-ergy use in 2010 will be 9.1 % higher than in 2003, and 13.7 % higher in 2020, while fi nal energy consumption will be 10.7 % and 14.9 % higher, respectively.
10
11
12
13
14
15
16
17
18
1980 1985 1990 1995 2000 2005 2010 2015 2020 2025
Year
CO2
emis
sion
s[T
g]
Existing measures Additional measures
Figure 2-3: Emissions of CO2 in 1986, 1990–2003 and projection up to 2020 without sinks.
2.3.2 Emissions of Other Greenhouse Gases
Figure 2-4 shows emissions of CH4, N2O and F-gases under the ad-ditional measures projection. CH4 emissions will fall according to both scenarios. According to the additional measures scenario, they will fall by 21 % by 2020, with a 12 % fall under the existing measures scenario compared to 2003. The reduction in emissions is due to a reduction in the quantity of landfi ll waste, and the collection and combustion of landfi ll gases, and to a lesser extent the reduction in fugitive emissions due to a reduction in domestic coal consumption. Under both scenarios N2O emissions remain virtually constant in the
Chapter Two: Trends and Projections of GHG Emissions32

period 2003–2020, amounting to 1.54 Tg CO2 eq. under the ad-ditional measures scenario and 1.56 Tg CO2 eq. under the scenario with measures. F-gas emissions in the existing measures scenario will grow by 109 % up to 2020, but will fall by 44 % under the additional measures scenario. The “with measures” scenario does not anticipate a measure to reduce F-gas emissions, while the additional measures scenario anticipates a reduction in emissions due to the implementa-tion of Regulations on F-gases.
Figure 2-4: Emissions of CH4, N2O and F-gases in 1986, 1990–2003 and projection up to 2020
Chapter Two: Trends and Projections of GHG Emissions
CHAPTER 2
0.0
0.5
1.0
1.5
2.0
2.5
1980 1985 1990 1995 2000 2005 2010 2015 2020 2025
Year
CH4 N2O F-gases
Emis
ije C
H4, N
2O
in F
-plin
ov [
Tg C
O2 e
kv.]
33

Figure 2-5: GHG emissions by sector4 in 1986, 1990–2003 and projec-tion up to 2020
4 Energy – Energy Supply and Fugitive Emissions (1A1 and 1B), Transport (1A3), Industry – Industry and Construction and Industrial Processes (1A2 and 2), Other Sectors (1A4), Solvents – Solvent and Other Product Use (3), Agriculture (4), Waste (6)
2.3.3 Emissions by Sector
Emissions from the Energy sector (Energy Supply and Fugitive Emis-sions) will signifi cantly decrease after 2005 due to the replacement of fuels. In 2020 emissions in this sector will be 2 % lower than in 2003 according to both projections. Emissions from the Waste sector will also signifi cantly decrease due to a marked reduction in the quantity of landfi lled waste. According to the “with measures” scenario, Waste sector emissions will be 41 % lower in 2020 than in 2003, while ac-cording to the additional measures scenario they will be 67 % lower in 2020 than in 2003. Increased emissions are expected in the Trans-port sector (18 % higher according to the “with measures” scenario, and 11 % according to the additional measures projection) due to an increase in transport activity. They are also expected in Agriculture (by 12% and 8% respectively) due to increasing numbers of animals, in Industry (Use of Fuel for Power and Industrial Processes – by 16 % and 5 %) due to increased production and also in the Other Sectors category (by 24 % and 5 %) due to increased fi nal energy consumption.
Chapter Two: Trends and Projections of GHG Emissions
0.0
1.0
2.0
3.0
4.0
5.0
6.0
7.0
8.0
1980 1985 1990 1995 2000 2005 2010 2015 2020 2025
Year
Energy Transport IndustryOther Sectors Solvents AgricultureWaste
GH
G e
mis
sion
s [T
g CO
2 e
q.]
34

2.3.4 Total Emissions
Total GHG emissions without considering sinks will amount to 21.2 Tg CO2 eq. in 2010 according to the scenario with measures, which is 7 % more than in 2003, while in 2020 they should amount to 21.5 Tg CO2 eq. According to the additional measures scenario, total GHG emis-sions in 2010 (19.9 Tg CO2 eq.), will be almost the same as in 2003, and will stand at 20 Tg CO2 eq. in 2020. The progress of emissions is shown in Figure 2-6.
Figure 2-6: Total GHG emissions in 1986, 1990–2003 and projection up to 2020
Chapter Two: Trends and Projections of GHG Emissions
CHAPTER 2
16,0
17,0
18,0
19,0
20,0
21,0
22,0
1980 1985 1990 1995 2000 2005 2010 2015 2020 2025
Year
GH
Gem
issi
ons
[Tg
CO2 e
q.]
Additional measuresExisting measures
35
Slovenia’s Report on Demonstrable Progress Under the Kyoto Protocol36

3 ASSESSMENT OF MEETING SLOVENIA’S KYOTO TARGET
3.1 Evaluation of Total Potential of MeasuresThe total potential of measures was defi ned by means of the models used for emission projection calculations. The models were used fi rst to defi ne the effect of individual measures, while the total potential was calculated by merging these effects. The difference between the estimate for the effect of measures for 2010 in chapter 1 and the esti-mate in this chapter arises from the method of evaluating the effects. The effects in the Policies and measures chapter were assessed on the basis of the current situation (in 2005) and the anticipated state in 2010 (e.g. the effect of incentives to implement EEU measures and in-vest in RES was assessed on the basis of reduced fossil fuel use owing to subsidised investment in EEU and RES in 2002 and 2003), while the model estimates of measure effects were calculated on the basis of assumptions within the model whereby measures were taken into account in the model. The estimate of the effect of additional mea-sures was calculated as the difference between the “with measures” projection and “additional measures” projection.
The table (Table 3-1) gives the total potential of measures imple-mented and adopted by sector and by gas. The table indicates that measures to reduce emissions in the Energy sector will make by far the largest contribution to reducing emissions in the “with measures” projection. Emissions will fall least in the Agriculture sector. By gas, measures will contribute most to reducing CO2 emissions. Table 3-2 shows the potential from planned measures. The total potential of all measures (implemented, adopted and planned) in 2010 amounts to 2.6 Tg CO2 eq., and to 5.3 Tg CO2 eq. in 2020.
Chapter Three: Assessment of Meeting Slovenia’s Kyoto Target
CHAPTER 3
37

Table 3-1: Estimate of the total effect of implemented and adopted measures (measures taken into account in the “with measures” projection) by individual sector and gas
2005 2010 2015 2020Gg CO2 eq.
Energy 242 1,234 1,923 3,489Ind. Pro-cesses
0 147 147 147
Agriculture 20 39 59 62Waste 23 103 198 276
Gg CO2 eq.CO2 232 1,246 1,905 3,421CH4 39 154 277 391N2O 14 30 50 68F–gases 0 94 94 94Total 285 1,523 2,327 3,974
Table 3-2: Estimate of the total effect of additional measures (measures taken into account in the additional measure pro-jection) by individual sector and gas
2005 2010 2015 2020Gg CO2 eq.
Energy 167 713 898 756 Ind. Pro-cesses
91 274 270 341
Agriculture 0 50 50 50Waste 0 82 158 197
Gg CO2 eq.CO2 166 726 910 771CH4 0 105 180 219N2O 0 15 16 13F–gases 91 274 270 341Total 258 1,119 1,375 1,344
Chapter Three: Assessment of Meeting Slovenia’s Kyoto Target38

3.2 Assessment of Meeting Slovenia’s Kyoto TargetBy signing the Kyoto protocol Slovenia committed itself to reducing GHG emissions over the period 2008 to 2012 by 8 % compared to the base year. The base year is 1986 for CO2, CH4 and N2O, and 1995 for F-gases. Projections under the additional measures scenario indicate that without including sinks, emissions in the Kyoto period will amount to 19.92 Tg CO2 eq. In accordance with decision 11/CP.7 from the Conference of Parties in Marrakesh, in achieving the Kyoto target Slovenia may use sinks for CO2 emissions provided by forests in the amount of 1.32 Tg CO2. In the previous report a conservative sink use estimate of 0.84 Tg CO2 was used to estimate Kyoto period emissions, while the latest studies from the Slovenian Forestry Institute indicated that Slovenia could use its entire quota, as the actual sink was higher than the quota. The Kyoto period emissions taking sinks into account total 18.60 Tg CO2 eq. Slovenia’s target taking into account GHG emissions in the base year is 18.62 Tg CO2 eq. Hence it follows that by implementing the measures as predicted in the additional measures scenario, and by continuing forest management to increase sinks, Slo-venia will achieve the Kyoto target. However, the following factors must be considered when drawing such a conclusion:
• In 2006 the Action Plan to Reduce GHG Emissions (AP-GHG) will undergo a revision that will include an analysis of AP-GHG measure implementation up to 2005, and new emission projections will be drawn up, which will fully take into account the new conditions regard-ing measure implementation, the macro-economic situation, and the corrected projections used in this report.
• In 2006 a new emission coupon allocation plan for 2008–2012 will also be drawn up. For the period 2005 to 2007 a total of 96 plants are involved in emission trading in Slovenia, which accounts for approximately 55% of all CO2 emissions in Slovenia. The proportion of emissions from plants included in emission trading in the period 2008–2012 will be similar. The allocation plan sets out a quota of free emission coupons distributed to plant operators. Administrators must buy cover for excess emissions or insuffi cient emission coupons on the market. Setting the quota for free coupons will take place simultane-ously with the audit of the Operational Programme.
Chapter Three: Assessment of Meeting Slovenia’s Kyoto Target
CHAPTER 3
39

Table 3-3: Base year emissions (CO2, CH4 and N2O in 1986; F-gases in 1995) and average emissions in the period 2008–2012 under the ad-ditional measures projection
Gg CO2 eq. Base year emissions
Averageemissions
2008–2012
Deviation from base
yearCO2 15,995 16,333 2.1 %CH4 2,247 1,903 – 15.3 %N2O 1,659 1,539 – 7.2 %F–gases 342 149 – 56.5 %Total 20,243 19,924 – 1.6 %
Energy 15,658 16,078 2.7 %Industrial Processes 1,364 1,098 – 19.5 %Solvent and Other Product Use 128 35 – 72.5 %Agriculture 2,367 2,145 – 9.4 %Waste 726 568 – 21.8 %Sinks – 1,320Total emissions with sinks 18,604 – 8.1 %Kyoto target 18,624 – 8.0 %
Chapter Three: Assessment of Meeting Slovenia’s Kyoto Target
GH
Gem
issi
ons
[Tg
CO2 e
q.]
16
17
18
19
20
21
22
1985 1990 1995 2000 2005 2010 2015 2020Year
Sinks1,320 Tg CO2 eq.
Kyoto commitment18,624 Tg CO2 eq.
Kyoto commitmentExisting measuresLinear progr. to Kyoto objective
SinksAdditional measures
Figure 3-1: Analysis of Kyoto target achievement
40

Chapter Three: Assessment of Meeting Slovenia’s Kyoto Target
CHAPTER 3
Figure 3-2: Comparison of average yearly emissions in the period 2008–2012 without taking into account sinks under the projection with measures and under the projec-tion with additional measures without sinks and with sinks
GH
Gem
issi
ons
2008
–20
12 [T
g CO
2 e
q.]
17.0
17.5
18.0
18.5
19.0
19.5
20.0
20.5
21.0
21.5
with measures(without sinks)
with add. measures(without sinks)
with add. measures(with sinks)
41

Slovenia’s Report on Demonstrable Progress Under the Kyoto Protocol42

4 PROGRESS IN FULFILLING OTHER COMMITMENTS UNDER THE KYOTO PROTOCOL
4.1 Progress in the Area of National Greenhouse Gas Inventories
4.1.1 Institutional Framework
The Slovenian Environment Agency (ARSO) is responsible for compil-ing GHG emission inventories. In line with its tasks and obligations towards international organisations, ARSO compiles inventories both for GHG and for other pollutants covered by the Convention on Long-Range Transboundary Air Pollution (CLRTAP), and in accordance with the prescribed time frames. In compiling inventories ARSO collabo-rates with numerous institutions and administrative bodies that supply the necessary.
4.1.2 Establishing a System for National Inventories
A cooperation agreement was reached with the institutions working with ARSO on compiling inventories, and this commits the institutions to report high-quality and verifi ed data in a timely manner. This is necessary since the deadlines for compiling inventories and reports on inventories have become shorter with Slovenia’s accession to the EU, whereby inventories and reports for the year prior to the previous year must be completed by 15 January of the current year. The agreement secured shorter timetables for the supply of data from collaborating institutions to ARSO. Given the complexity involved, this is especially important for energy data, which are collected through common ques-tionnaires by the Statistical Offi ce of the Republic of Slovenia (SORS).
CHAPTER 4
Chapter Four: Progress in Fulfi lling Other Commitments Under the Kyoto Protocol 43

4.1.3 Standardisation of Energy Statistics
The process of standardising the collection of data by the Energy Directorate, the Ministry of the Economy and SORS was completed in 2003. This brought an end to the parallel collection of data by two different institutions, which generated confusion among the users of energy statistics. In accordance with the law, competence for the col-lection of data was granted to SORS, which is responsible for the col-lection and checking of data. SORS must then send data to the Energy Directorate, which in turn publishes the data in the Slovenian energy supply sector yearbook.
4.1.4 Establishing a System for Compiling Inventories
In 2005 emission inventories and other calculations were made for the last time in the MS Excel and Visual Basic environment. The excep-tion to this is transport, where owing to the extensive nature of the sector, the database is already in the MS Access environment. In 2004 Slovenia established a uniform and high-quality system for compil-ing inventories, and this will make it possible to meet the demanding deadlines for producing inventories and reports on inventories. In 2005 the transition will be made in calculating inventories and report-ing from the MS Excel environment to the more robust MS Access and Oracle environment. All data from collaborating institutions are sent in the same form. They are saved on the web server, and access to them is restricted in line with the security policy. Backup copies are made at regular intervals in line with the demands of the system. An archive is stored at different locations on different media. All supporting re-search projects are stored in electronic and print versions.
Despite many improvements, work will still need to be done in future to improve the system. With the aim of improving the process of compil-ing inventories, the production of a QA/QC plan is being designed, along with the drafting of Instructions for compiling inventories.
Chapter Four: Progress in Fulfi lling Other Commitments Under the Kyoto Protocol44

4.1.5 Improving Methods and Reducing Uncertainty
The greatest advance in compiling inventories has been the addition of the emission factor for CO2 emissions from lignite from the IPCC default value to the national emission factor. The emission factor was determined on the basis of data on the content of carbon in fuel. This information is available only for the biggest coal mine in Slovenia, situated at Šoštanj. The carbon content was verifi ed through additional chemical analysis of coal samples from this mine at an accredited laboratory in accordance with EN ISO 17025. One of the main reasons for adding this factor was Slovenia’s cooperation in the system of Euro-pean trading in emission permits since 2005. One of the requirements in drawing up the national plan for allocation of emission coupons was that emissions from large heating units are calculated in accordance with the European Community decision on the manner of monitoring greenhouse gas emissions5 . The instructions accord with the IPCC methodology and contain criteria for deciding between calculation and measurement and for deciding between different approaches (“tier”) for the use of data on activities, emission factors, oxidation factors and transformation factors.
In 2003 there was a reduction in the uncertainty of data on activities and emission factors in sector 1.A.1.a Public Generation of Electricity and Heat. The uncertainty was reduced through the renewed verifi ca-tion of input data and procedures of determining fuel consumption, which was carried out during the preparations for trading in emission permits within the EU. Moreover the public power stations presented planned measures with which they will ensure more accurate mea-surement of consumption of fuel combusted, by installing new measurement apparatus with a maximum deviation of +/- 2.5 % per measuring process.
Numerous improvements have also been made in the calculation of emissions in the Industrial Processes sector. Current estimates of CO2 emissions from cement production use measurements of CaO and MgO in clinker, which enables the determining of the national emission factor. Data on the use of lime and dolomite were obtained directly
5 Commission Decision 2004/156/EC of 29 January 2004 establishing guidelines for the monitoring and reporting of greenhouse gas emissions pursuant to Directive 2003/87/EC of the European Parliament and of the Council
CHAPTER 4
Chapter Four: Progress in Fulfi lling Other Commitments Under the Kyoto Protocol 45

from steel and glass producers. Estimates of CO2 emissions from the production of metals also use data on the consumption of anodes and fuel as the reducing agent, which are reported by companies, for determining the national emission factor. Alongside this, data from the producer were used for determining PFC emissions from aluminium production.
In agriculture, use of the Tier 1b method was initiated for calculating N2O emissions from product residues and products that fi x nitrogen. Instead of the three-year average, for all years we used annual input data on the number of animals and on crop yields.
An improvement was also noted in the calculation of inventories in the Waste sector. Estimating CH4 emissions from the disposal of solid waste was enhanced by using the “First Order Decay” method. In calculating methane emissions from urban waste water treatment we used the correct value for the constant B0.
4.2 Measures for Mitigation of, and Adaptation to Climate changeThe policies and measures for mitigating climate change are present-ed in detail in Chapter 1.
Slovenia is at the early stage of analysing the possible effects of climate change and identifying adaptation measures. At the end of 2003, a project entitled Vulnerability of Agriculture and Forestry to Climate Change was concluded, and this project established that:• The effects of the changed climate on food production will be posi-tive (fertilising effect of CO2, longer vegetation period and potential for cultivating thermophilic plants), conditionally positive (location shifts of agricultural production, change in produce quality, changed variety selection and changing agrotechnical practices), and negative (shortening of growing period, increased intensity of evapotranspira-tion, higher frequency of extreme weather conditions and changes in attacks of pests and diseases). The negative effects will predominate.• Climate change will also affect animal husbandry, both indirectly (feedstuffs) and directly (higher temperatures, storm and weather damage). The negative effects will predominate.• Increased temperature, higher frequency of extreme weather condi-
Chapter Four: Progress in Fulfi lling Other Commitments Under the Kyoto Protocol46

tions and more frequent attacks of diseases and pests will also affect forest ecosystems.• The vulnerability of water sources, which are already highly vulner-able, will increase. The project also identifi ed measures for adapting to the anticipated changes in the area of agriculture and forestry.
At the end of 2005, a project entitled Vulnerability and Adaptation to Climate Change was initiated at the Slovenian Environment Agency (ARSO), and this will include all areas affected by climate change (such as energy, tourism, health and transport) at the national and regional levels. The main phases of the project are determination of vulnerabil-ity, assessment of adaptation capacities and formulation of the range of potential adaptation measures . The project should be concluded in 2007.
4.3 Cooperation in Scientifi c and Technological ResearchThe complexity and scope of the climate system are encouraging the intensive collaboration of Slovenian experts and organisations in numerous international research programmes and in systematic monitoring programmes. Owing to active cooperation with the EU, and since 2004 membership in the EU, the most extensive cooperation is in various European programmes, with a special prominence given to the 5th and 6th Framework Programmes.
In addition to this, Slovenia is actively participating in the Intergovern-mental Panel on Climate Change; it has a representative in working group II, which covers the area of the impacts of, and, vulnerability and adaptation to climate change.
CHAPTER 4
Chapter Four: Progress in Fulfi lling Other Commitments Under the Kyoto Protocol 47
4.5 Assistance to Developing Countries in Implementing the Convention
In the future assistance will be possible for developing countries in implementing the Convention, especially if certain CDM projects are carried out.
Chapter Four: Progress in Fulfi lling Other Commitments Under the Kyoto Protocol
4.4 Capacity Building Especially for Developing Countries in the Field of Climate Change
The Slovenian Government is investing considerable effort in build-ing its own capacities in the fi eld of climate change, where at the beginning, due to activities for national independence, there was a major defi cit. In past years much effort has been invested especially in compiling emission inventories and drawing up the programme of measures to reduce GHG emissions. In the future a more active role is anticipated in the area of analysing the effects of climate change and adaptation to it. With regard to capacity building in other countries, initiatives have been noted, especially in terms of assistance in the area of climate change for the less developed countries of the former Yugoslavia.
48

Appendix I: Abbereviations
Appendix I: Abbreviations
ARSO Environmental Agency of the Republic of Slovenia
AURE Agency for Renewable Energy Sources and Effi cient Energy Use6
CH4 methane
CLRTAP Convention on Long-Range Transboundary Air Pollution
COP Conference of Parties (to the United Nations Framework Convention on Climate Change)
CO2 carbon dioxide
CO2 eq. CO2 equivalent (greenhouse gas emissions expressed in a common unit; calculations are based on the global warming potential (GWP) of specifi c gases drawn up by the IPCC. The following values must be used in line with UNFCCC instructions to prepare national commu-nications and greenhouse gas emission inventories: GWPCO2 1, GWPCH4 21, GWPN2O 310, GWPHFC134a 1300, GWPCF4 6500, GWPC2F6 9200, GWPSF6 23900
ENSVET Energy Advice for Citizens
EU European Union
F–gases hydrofl uorocarbons (HFC), perfl uorocarbons (PFC) and sulphur hexafl uoride (SF6)
HE hydroelectric power plant
HFC hydrofl uorocarbons
HSE Holding Slovenske elektrarne – Slovenian Electric Power Plants holding company
IPCC Intergovernmental Panel on Climate Change
IPPC Integrated Pollution Prevention and Control (European Commission guideline)
JE nuclear power plant
MOP Ministry of the Environment and Spatial Planning
NEK Krško Nuclear Power Plant
NEP National Energy Programme
49
6 In 2005 the Department of Effi cient Energy Use and Renewable Energy Resources at the Ministry of the Environment and Spatial Planning took over most of the activi-ties of the AURE.

Appendix I: Abbereviations
N2O nitrous oxide
RES renewable energy sources
AP-GHG Action Plan to Reduce GHG Emissions (July 2004)
PFC perfl uorocarbons (CF4 and C2F6)
RDP Rural Development Programme (OGRS 116/2004)
ReNEP Resolution on the National Energy Programme (OGRS 57/2004)
ReNEAP Resolution on the National Environmental Action Pro-gramme 2005–2012 (OGRS 2/2006)
RS Republic of Slovenia
SF6 sulphur hexafl uoride
SAEP Slovenian Agricultural Environmental Programme
SORS Statistical Offi ce of the Republic of Slovenia
TE thermal power plant
TE–TOL Ljubljana thermal heat and power plant
TEŠ Šoštanj Thermal Power Plant
TET Trbovlje Thermal Power Plant
GHG greenhouse gas
UNFCCC United Nations Framework Convention on Climate Change
EEU effi cient energy use
UN United Nations
50