slo post test review inquiry. georgia’s bar is nearly halfway between the 0 and 50 mark for...
TRANSCRIPT

SLO Post Test REVIEWInquiry

1. According to the above graph, approximately how many shark attacks were reported in the state of Georgia?
A. 0 attacks B. 20 attacks C. 45 attacks D. 55 attacks
Georgia’s bar is nearly halfway between the 0 and 50 mark for numbers of attacks. 20 is the most logical answer.
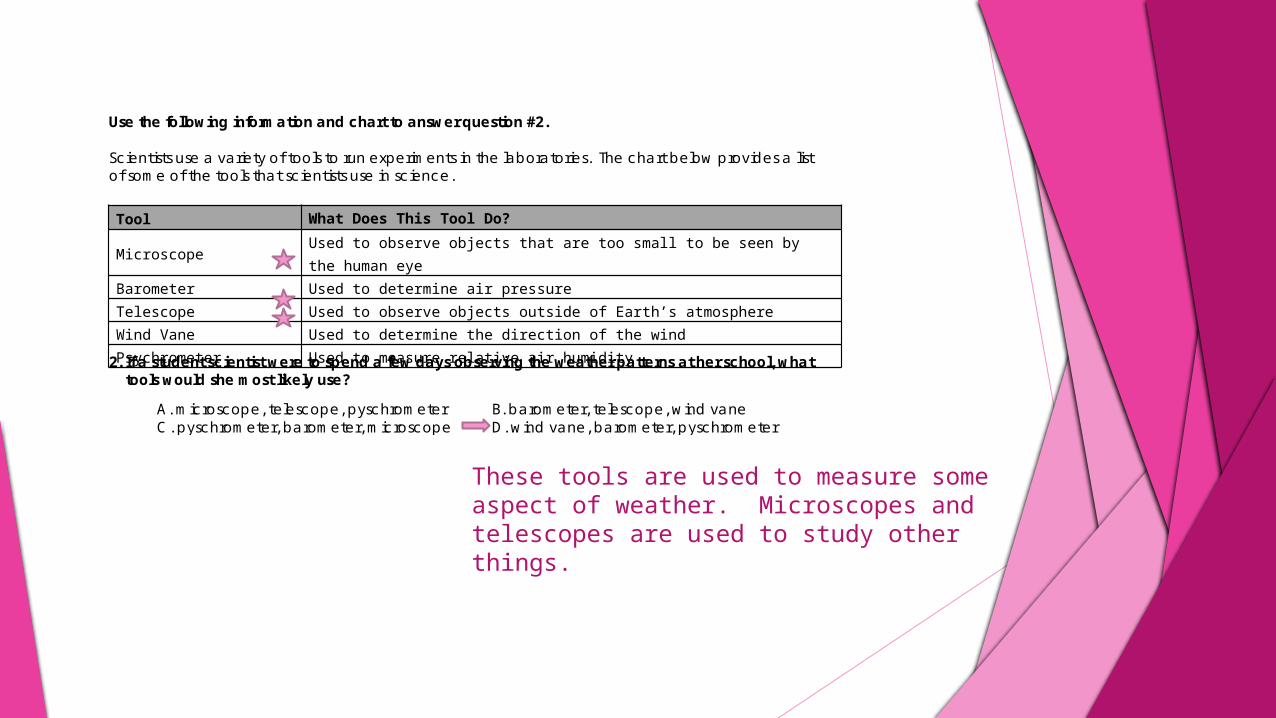
Use the following information and chart to answer question #2. Scientists use a variety of tools to run experiments in the laboratories. The chart below provides a list of some of the tools that scientists use in science.
Tool What Does This Tool Do?
MicroscopeUsed to observe objects that are too small to be seen by the human eye
Barometer Used to determine air pressureTelescope Used to observe objects outside of Earth’s atmosphereWind Vane Used to determine the direction of the windPsychrometer Used to measure relative air humidity
2. If a student scientist were to spend a few days observing the weather patterns at her school, what tools would she most likely use?
A. microscope, telescope, pyschrometer B. barometer, telescope, wind vane C. pyschrometer, barometer, microscope D. wind vane, barometer, pyschrometer
These tools are used to measure some aspect of weather. Microscopes and telescopes are used to study other things.

Use the following information and table to answer question #3. J ackie notices that when she leaves out a cup of hot chocolate, the hot chocolate always seems to disappear. She decides to use the scientific method to determine whether or not the mass of the water in the cup changes. She heats up the hot water in a measuring cup using a microwave. She pours the hot water into a beaker and places the beaker on a scale. She then inserts a thermometer and records the temperature and mass of the beaker as the water cools down. Her data is shown in the table below.
Time (seconds) Mass (grams)Temperature (degrees
Celsius)0 480 59
20 477 5540 473 5160 471 4980 470 47
100 469 46120 468 45
3. Which graph shows the trends in the mass (M) and temperature (T) changes as the hot water cools? M T T M A. Time Time B. Time Time M M T T
C. Time Time D. Time Time
decreasing
decreasing
C is the only choice where both mass and temperature are represented by decreasing lines.

Use the following information to answer question #4.
Plant Investigation
A group of students want to find out what things affect how well their classroom plants grow. They decide to investigate how fertilizer affects plant growth.
Their three setups are shown below. They used the same type of plant and soil in each setup, and they made sure each plant received the same amount of light from the sunlamp. They also gave each plant 4 drops of water each day.
Plant A Plant B Plant C Plant D
They record the results of their four setups in the table below.
Plant Plant HeightA 14 cmB 15.5 cmC 18 cmD 17.5 cm
4. The students want to know which setup makes their plants grow the tallest. Which setup should they use for their plants? A. 4 drops of water and 4 drops of fertilizer B. 4 drops of water and 2 drops of fertilizer C. 4 drops of water and 6 drops of fertilizer D. 4 drops of water and 0 drops of fertilizer
Plant C is the tallest. Plant C received four drops of fertilizer.

Use the following information and diagram to answer question #5. Students in a class predict that if they change the color of light, the plants will grow differently in terms of their height. The class plants seeds as shown in each planter below.
The class measures the heights of the plants each day. The average height for each group is recorded in the table shown below.
Day Red Light (cm) Blue Light (cm) Yellow Light (cm)1 0.4 0.2 0.72 1.2 0.8 1.33 1.7 1.1 1.84 1.9 1.3 2.55 2.3 1.5 2.9
Students continue to record data on plant height.
5. Why is it important to record data every day?
A. to observe bugs on the plants B. to see whether or not the data is correct C. to see whether plants grow more on Fridays D. to have equal amount of time between each measurement
All plants should be measured at regular intervals for the best results.

Use the following information and graph to answer question #6.
The following graph shows data for the population of Houston, Texas over the last 40 years. The population has continued to increase steadily.
6. According to this trend, what would be the estimated population for the year 2010?
A. 5,000,000 B. 5,500,000 C. 6,500,000 D. 8,500,000
If you look closely at the growth over the last couple decades, you would notice that the population has been growing by about 100,000 people (or a little more) every ten years. We could expect it to be more than 5,500,000 but not 8,500,000.
about 5,100,000
about 2,850,000
about 3,800,000
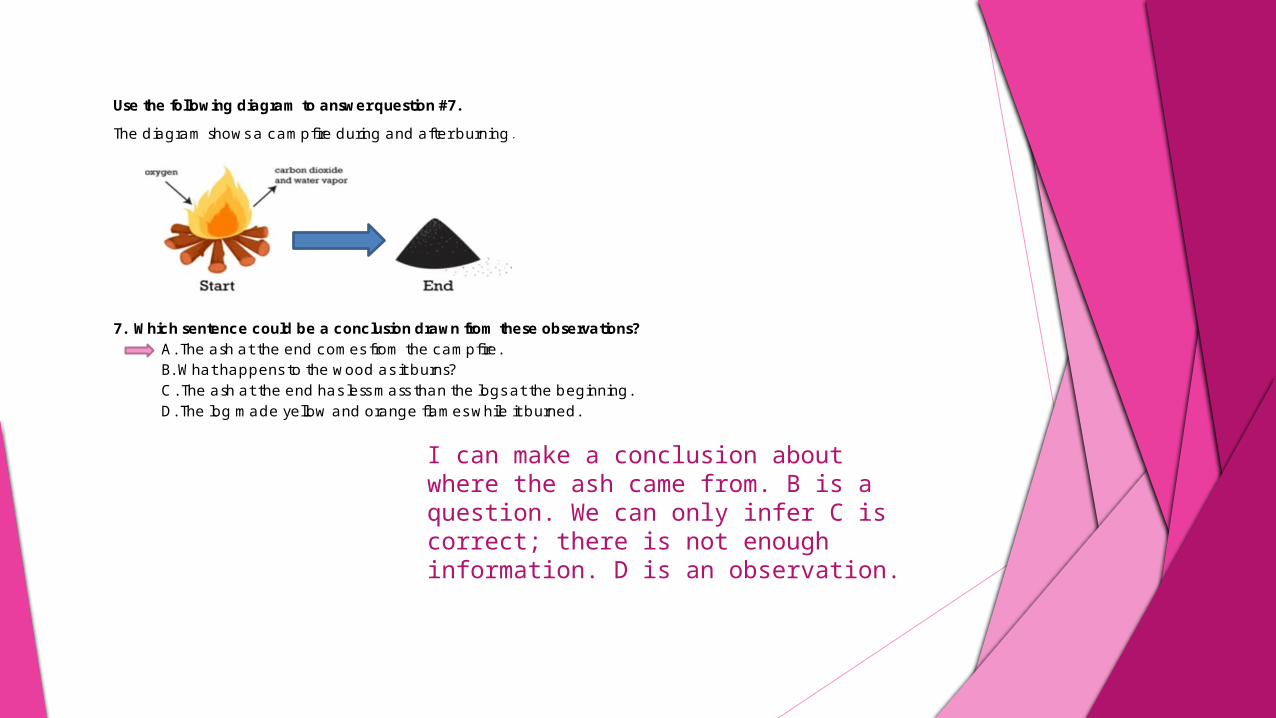
Use the following diagram to answer question #7.
The diagram shows a campfire during and after burning.
7. Which sentence could be a conclusion drawn from these observations? A. The ash at the end comes from the campfire. B. What happens to the wood as it burns? C. The ash at the end has less mass than the logs at the beginning. D. The log made yellow and orange flames while it burned.
I can make a conclusion about where the ash came from. B is a question. We can only infer C is correct; there is not enough information. D is an observation.
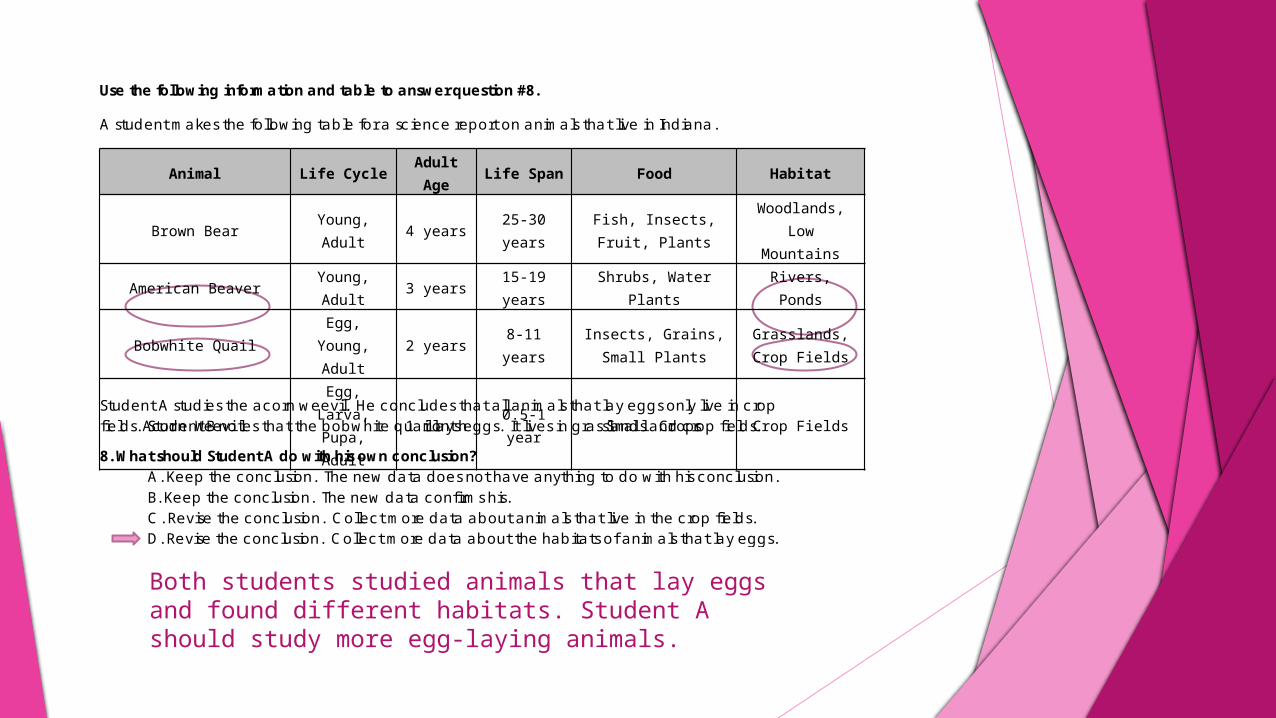
Use the following information and table to answer question #8.
A student makes the following table for a science report on animals that live in Indiana.
Animal Life CycleAdult Age
Life Span Food Habitat
Brown Bear Young, Adult 4 years25-30 years
Fish, Insects, Fruit, Plants
Woodlands, Low Mountains
American Beaver Young, Adult 3 years15-19 years
Shrubs, Water Plants
Rivers, Ponds
Bobwhite QuailEgg, Young,
Adult2 years 8-11 years
Insects, Grains, Small Plants
Grasslands, Crop Fields
Acorn WeevilEgg, Larva, Pupa, Adult
1 month 0.5-1 year Small Crops Crop Fields
Student A studies the acorn weevil. He concludes that all animals that lay eggs only live in crop fields. Student B notes that the bobwhite quail lays eggs. It lives in grasslands and crop fields.
8. What should Student A do with his own conclusion? A. Keep the conclusion. The new data does not have anything to do with his conclusion. B. Keep the conclusion. The new data confirms his. C. Revise the conclusion. Collect more data about animals that live in the crop fields. D. Revise the conclusion. Collect more data about the habitats of animals that lay eggs.
Both students studied animals that lay eggs and found different habitats. Student A should study more egg-laying animals.

Use the following information to answer question #9.
Weather Table and Maps
The following weather information was reported on Sunday, the 15th of the month, and two days later on Tuesday, the 17th of the month. The table includes conditions for Sunday are shown in the table. The maps below show weather conditions for Sunday and Tuesday.
You live in Ohio and you need two days of fair weather so that you can spread fertilizer on your garden so that it does not wash away. 9. Looking at the weather maps above, on which day should you start fertilizing?
A. Saturday, the 14th of the monthB. Sunday, the 15th of the monthC. Monday, the 16th of the monthD. Thursday, the 19th of the month
The weather maps show it might rain on Monday and that Tuesday should be clear. There is nothing in between Sunday’s front and Tuesday’s high pressure. You would not fertilize on Saturday or Sunday due to Sunday’s forecast. We can’t predict Thursday’s weather yet. Monday is the best choice.

Use the following diagram and information to answer question #10. A student noticed that his M&M candies always seem to melt in his pocket. He discusses this observation with a fellow student and the students come up with a hypothesis that the temperature of the material affects how quickly the M&M candies dissolve. To test their hypothesis, they design an experiment in which they measure how long it takes the M&M candies to dissolve by putting them in waters at three different temperatures. The results of the experiment are shown below.
Amount of Time it Takes for M&M Candies to Dissolve (seconds)
Temperature of Water (oC)
Trial 1 Trial 2 Average
65 10 7 8.523 35 39 3711 97 94 95.5
Based upon their collected data, one student concludes that as the temperature of the water increases, the amount of time it takes for the candies to dissolve decreases. The other student concludes that as the temperature of the water decreases, the amount of time it takes for the candies to dissolve increases.
10. Which of the following choices explains how both of the students’ conclusions can be correct? A. Both conclusions are incorrect because of the students’ faulty reasoning. B. Both conclusions are correct because there is more than one correct way to interpret data. C. Both conclusions are incorrect because they incorrectly gathered their data. D. Both conclusions cannot be correct because there is only one way to interpret data.
Both students are making the same conclusion. They are simply stating it differently.
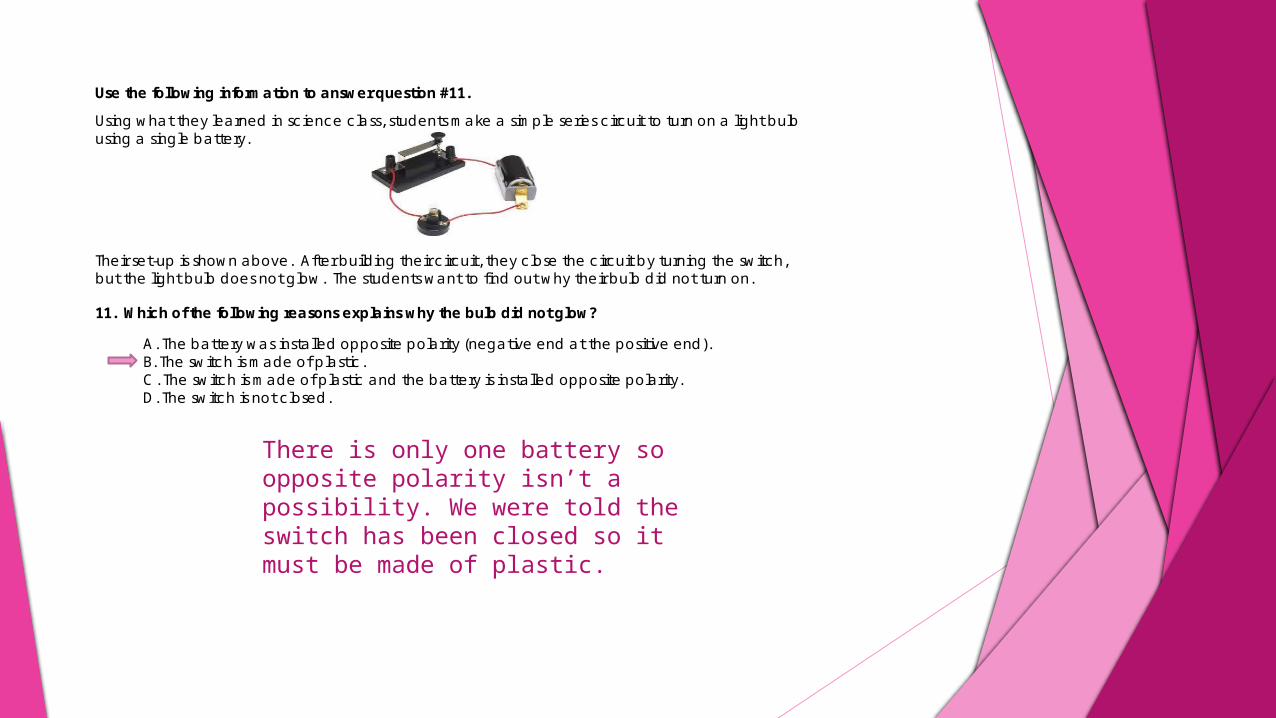
Use the following information to answer question #11.
Using what they learned in science class, students make a simple series circuit to turn on a light bulb using a single battery.
Their set-up is shown above. After building their circuit, they close the circuit by turning the switch, but the light bulb does not glow. The students want to find out why their bulb did not turn on. 11. Which of the following reasons explains why the bulb did not glow?
A. The battery was installed opposite polarity (negative end at the positive end). B. The switch is made of plastic. C. The switch is made of plastic and the battery is installed opposite polarity. D. The switch is not closed.
There is only one battery so opposite polarity isn’t a possibility. We were told the switch has been closed so it must be made of plastic.
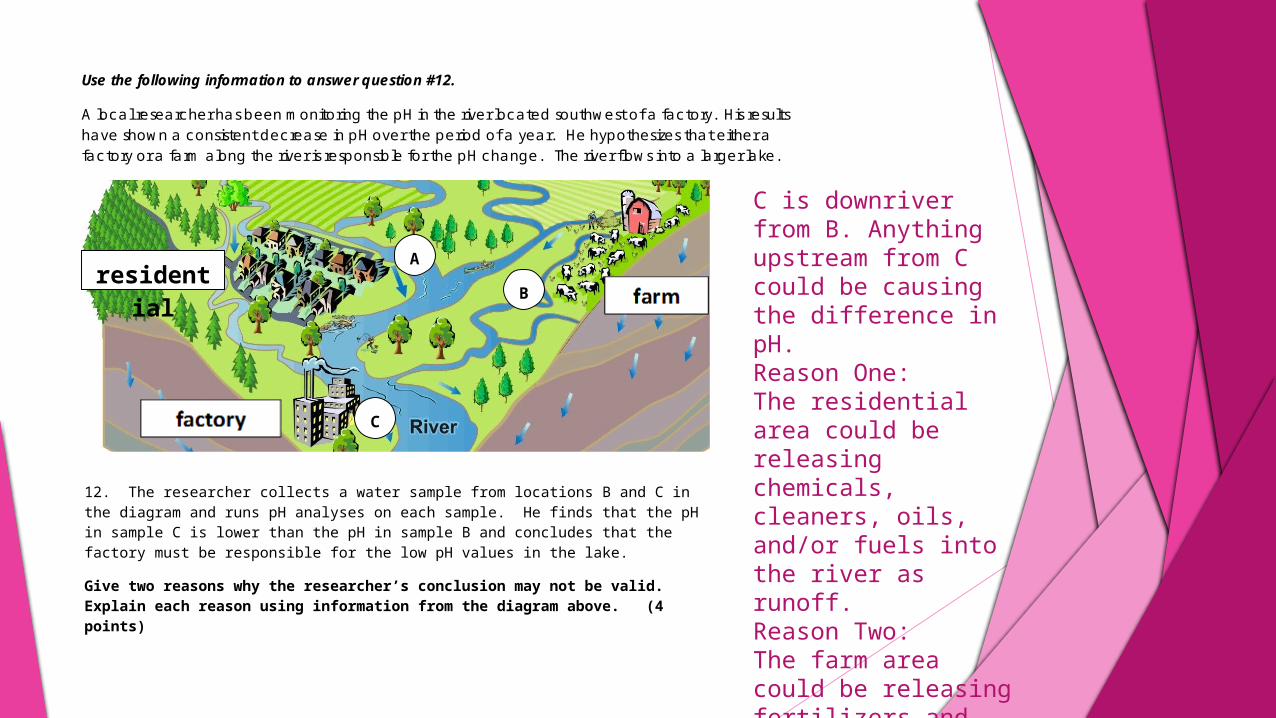
Use the following information to answer question #12.
A local researcher has been monitoring the pH in the river located southwest of a factory. His results have shown a consistent decrease in pH over the period of a year. He hypothesizes that either a factory or a farm along the river is responsible for the pH change. The river flows into a larger lake.
residentialA
B
C
12. The researcher collects a water sample from locations B and C in the diagram and runs pH analyses on each sample. He finds that the pH in sample C is lower than the pH in sample B and concludes that the factory must be responsible for the low pH values in the lake.
Give two reasons why the researcher’s conclusion may not be valid. Explain each reason using information from the diagram above. (4 points)
C is downriver from B. Anything upstream from C could be causing the difference in pH. Reason One: The residential area could be releasing chemicals, cleaners, oils, and/or fuels into the river as runoff. Reason Two:The farm area could be releasing fertilizers and pesticides into the water. All of these things would flow toward C.
13. A group of students does an experiment to see if different colors of sugar water affect the number of hummingbirds that come to their bird feeder. Their teacher gives them bird feeders, water, sugar, and three different colors of food coloring. The students decide to divide the materials equally.
What should be different for each bird feeder?
A. the temperature of the water B. the amount of water C. the color of the bird feeders D. the color of the sugar water
A controlled experiment should only test one variable at a time. The students want to see if different colors of sugar water affect the number of hummingbirds that come to their bird feeder so that is the ONLY thing that should be different in each experiment.
14. A group of students decides to investigate whether the amount of light affects mold growth. The students take three Ziploc sandwich bags and place two pumpkin seeds inside each one. They set their baggies in three different locations – one in a dark closet, one in direct sunlight, and one on a shelf in their classroom. They come back a few days later to check their pumpkin seeds and they realize that one of their bags was not sealed all of the way.
Why should this group of students repeat their pumpkin seed experiment?
A. to form a new hypothesis B. to rewrite procedures C. to collect accurate data D. to test a different question
The seeds in the unsealed bag were also exposed to air while the others were not. It is necessary to start over to properly collect data.
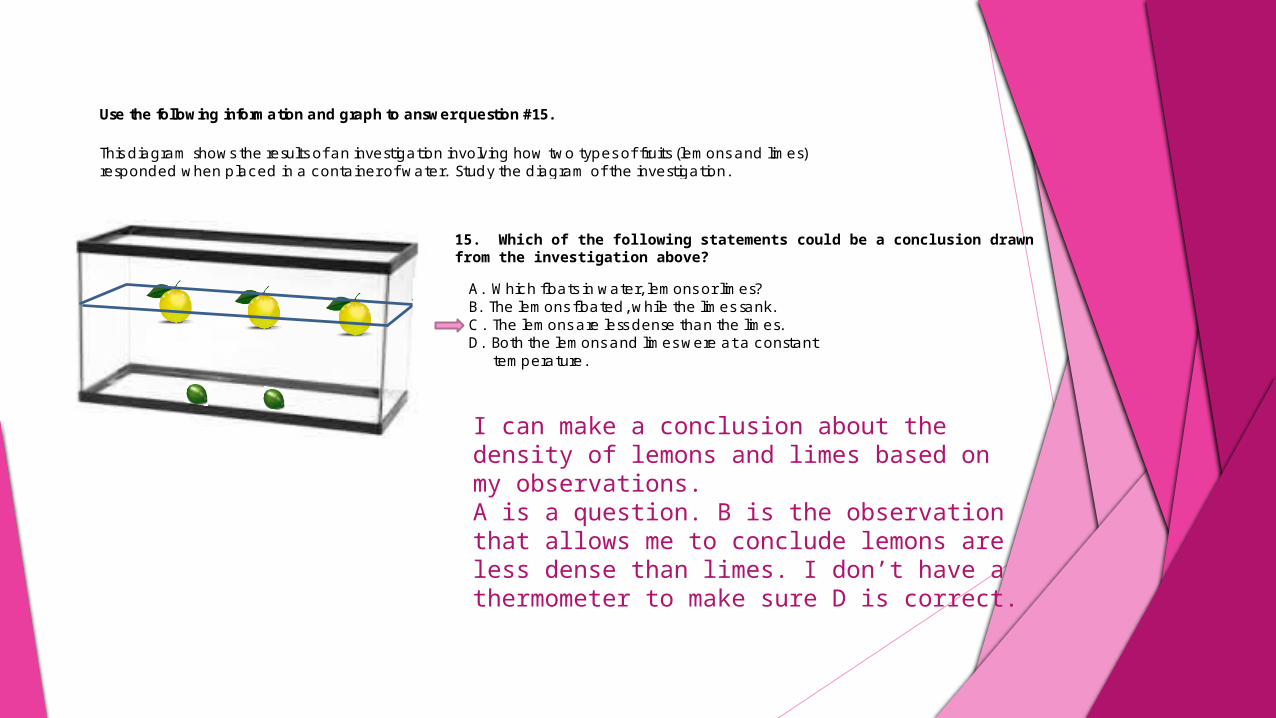
Use the following information and graph to answer question #15.
This diagram shows the results of an investigation involving how two types of fruits (lemons and limes) responded when placed in a container of water. Study the diagram of the investigation.
15. Which of the following statements could be a conclusion drawn from the investigation above?
A. Which floats in water, lemons or limes? B. The lemons floated, while the limes sank. C. The lemons are less dense than the limes. D. Both the lemons and limes were at a constant temperature.
I can make a conclusion about the density of lemons and limes based on my observations. A is a question. B is the observation that allows me to conclude lemons are less dense than limes. I don’t have a thermometer to make sure D is correct.