slides to accompany weathington, cunningham & pittenger (2010), chapter 3: the foundations of...
TRANSCRIPT
Slides to accompany Weathington, Cunningham & Pittenger (2010),
Chapter 3: The Foundations of Research
1
Objectives
• Hypotheses and research
• Utility of hypotheses
• Types of hypotheses
• Measurement
• Reliability of measurement
• Validity of measurement
• Populations and samples2
What is the difference between a theory and a hypothesis?
3
Hypotheses
• Are informed, specific predictions about how multiple variables will be related
• Based on theory or previous research
• Guide the progress of science
– What data to collect
– What research methods to use
– How to analyze the data4
A theory is…
• A broad set of general statements and/or claims that helps us to explain and predict events
• Not the same thing as a hypothesis
• May develop from a series of studies that test hypotheses
5
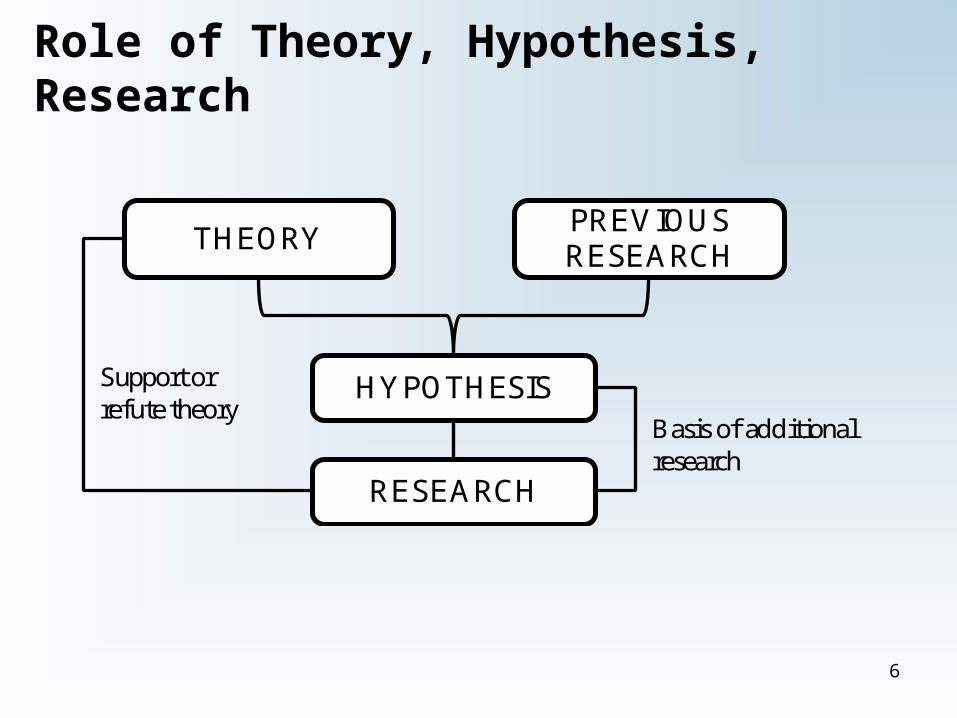
Role of Theory, Hypothesis, Research
THEORY
RESEARCH
HYPOTHESIS
PREVIOUS RESEARCH
Support or refute theory
Basis of additional research
6
Confirmatory Research
• When goal is to support or confirm the validity of an existing theory
• Hypotheses are used in these types of studies
– Helps to protect against the Idols of the Theatre
7
Exploratory Research
• Focus is on examining an interesting phenomenon
• Prior theory is not required
• Caution against Idols of the Cave
– Systemmatic observation can and should still be used
8
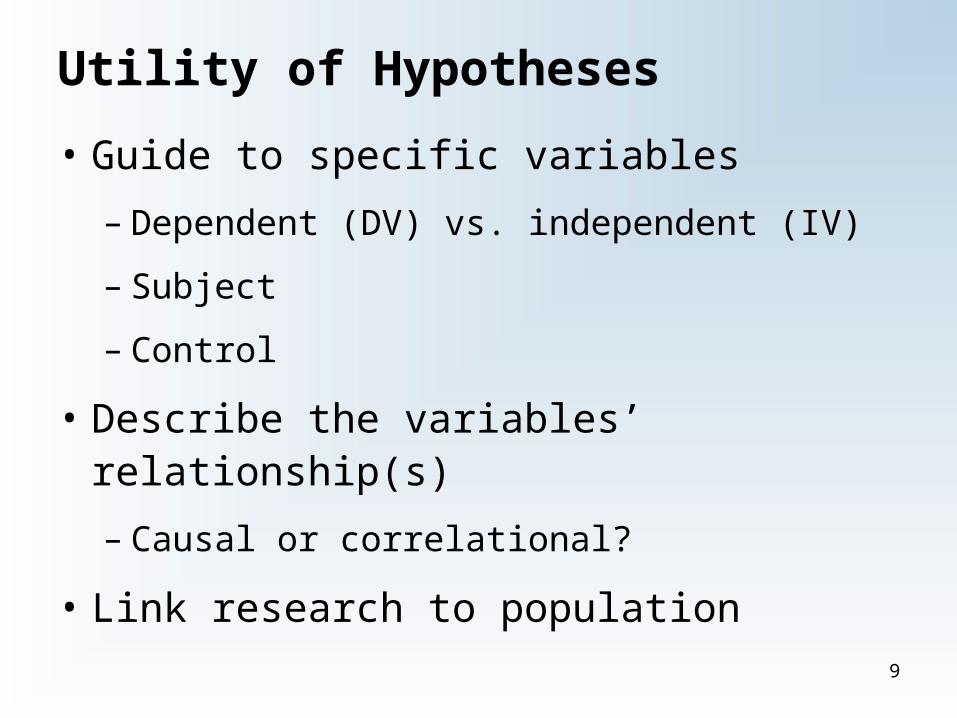
Utility of Hypotheses
• Guide to specific variables
– Dependent (DV) vs. independent (IV)
– Subject
– Control
• Describe the variables’ relationship(s)
– Causal or correlational?
• Link research to population
9
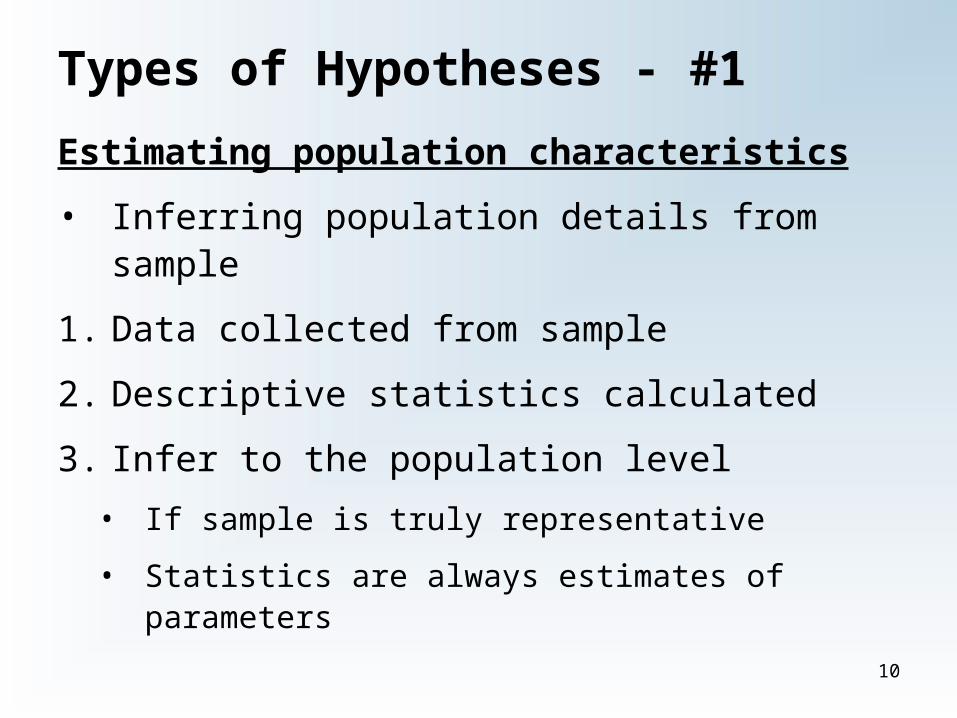
Types of Hypotheses - #1
Estimating population characteristics
• Inferring population details from sample
1. Data collected from sample
2. Descriptive statistics calculated
3. Infer to the population level
• If sample is truly representative
• Statistics are always estimates of parameters
10
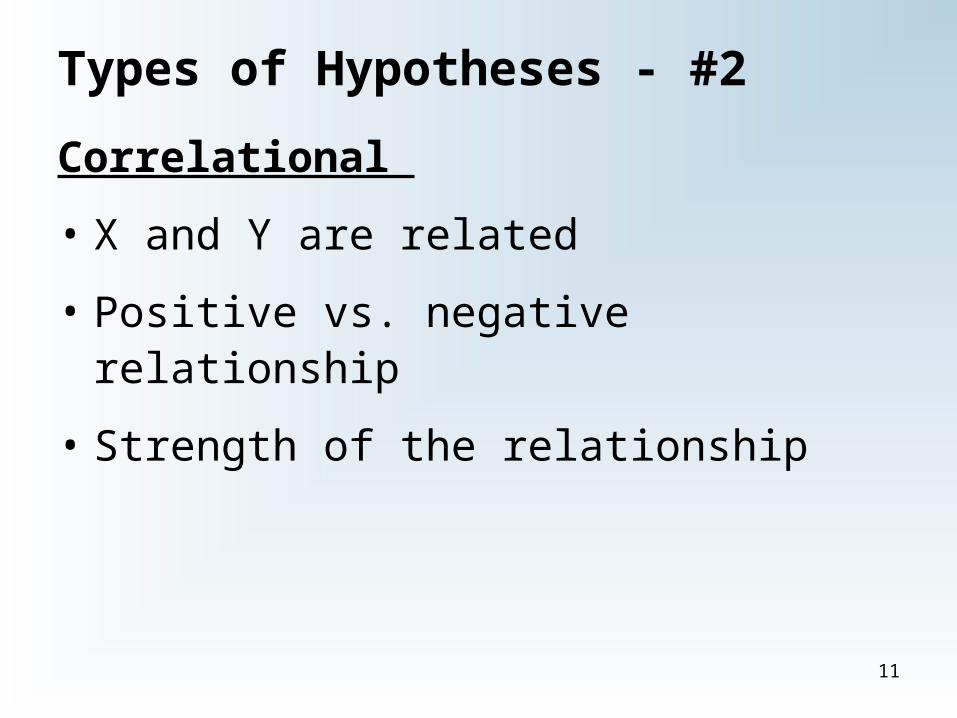
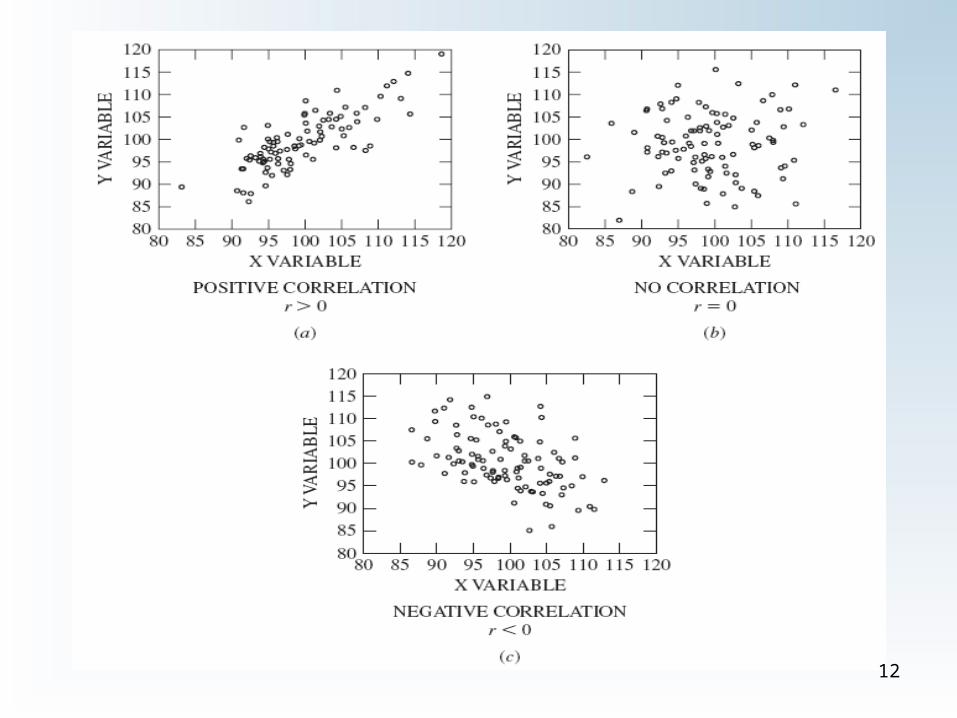
Types of Hypotheses - #2
Correlational
• X and Y are related
• Positive vs. negative relationship
• Strength of the relationship
11
12
Types of Hypotheses - #3
Difference among Populations
• Testing for differences between average members of separate populations
• 1 variable classifies members of groups, another variable is the DV of interest
• Sample statistics to make inferences about population-level differences
13
Types of Hypotheses - #4
Cause and effect
• X Y
• Causal relationship supported if:
1. X before Y in time
2. X, Y are correlated
3. No other variables explain X Y
14
Measurement is...
• a way of quantifying our observations
• objective
• replicable
15
Operational Definitions
• Formula for a construct that other scientists can use to duplicate it in future studies
– Focus on observable signs of constructs
– Not simple description
1. From hypothesis, identify the constructs
2. Choose a form(s) of measurement that allows us to address each construct best
16

Anxiety
OBSERVABLE EVENTS
HYPOTHESIZED CONSTRUCT
No opportunity for escape
Unfamiliar situation/change
Threat of aversive eventPhysiological measures:•Sweating•Increased heart rate•Increased blood pressure•Rapid, shallow breathing
Behavioral measures:•Inhibited behavior (unable to perform simple tasks)•Pacing, rapid eye movements, startle-reflex•Stammering, other speech problems
Other indicators:•Responses to “anxiety assessment”•Expressed need to be with others
17
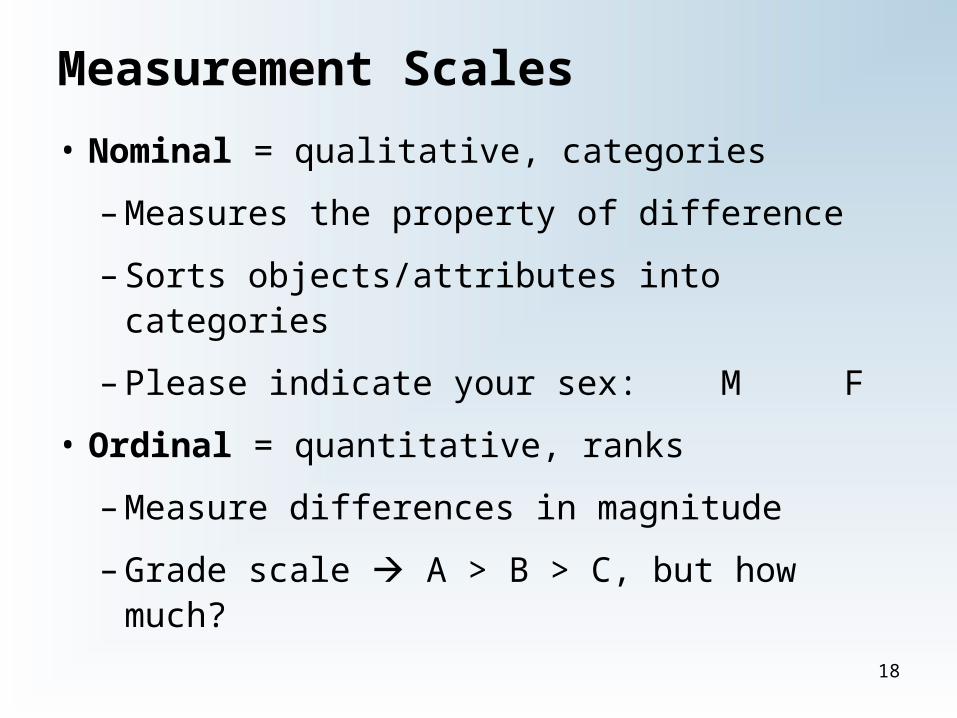
Measurement Scales
• Nominal = qualitative, categories
– Measures the property of difference
– Sorts objects/attributes into categories
– Please indicate your sex: M F
• Ordinal = quantitative, ranks
– Measure differences in magnitude
– Grade scale A > B > C, but how much?
18

Measurement Scales
• Interval, quantitative
– Different, magnitude, and equal interval
– Can add and subtract
– Personality test
• Ratio, quantitative
– Diff., magnit., equal ints., true 0
– Time on task19
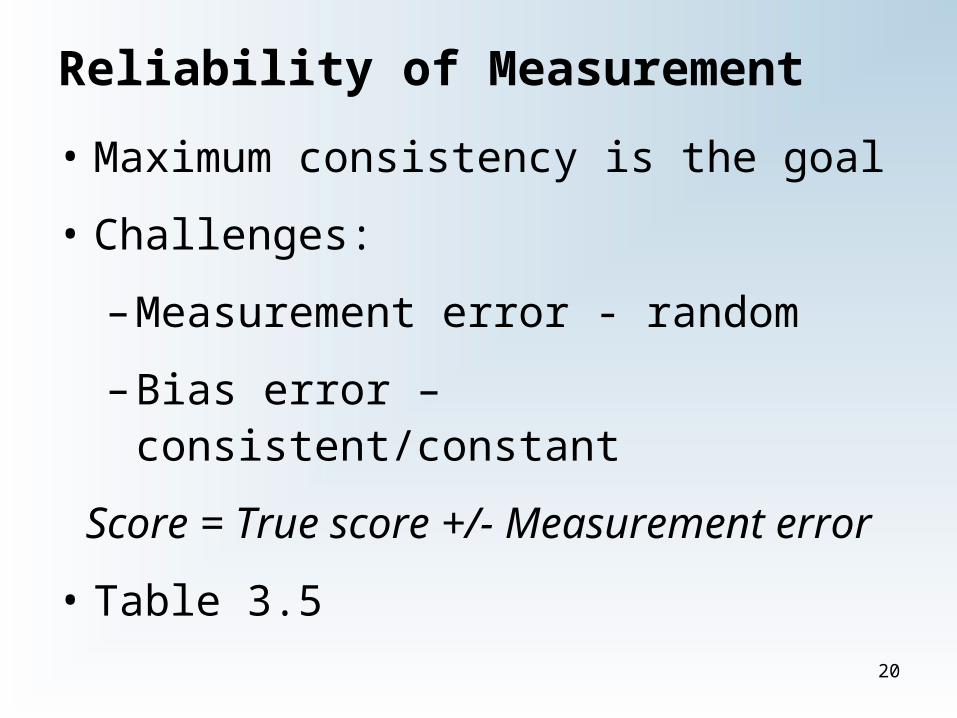
Reliability of Measurement
• Maximum consistency is the goal
• Challenges:
– Measurement error - random
– Bias error – consistent/constant
Score = True score +/- Measurement error
• Table 3.520
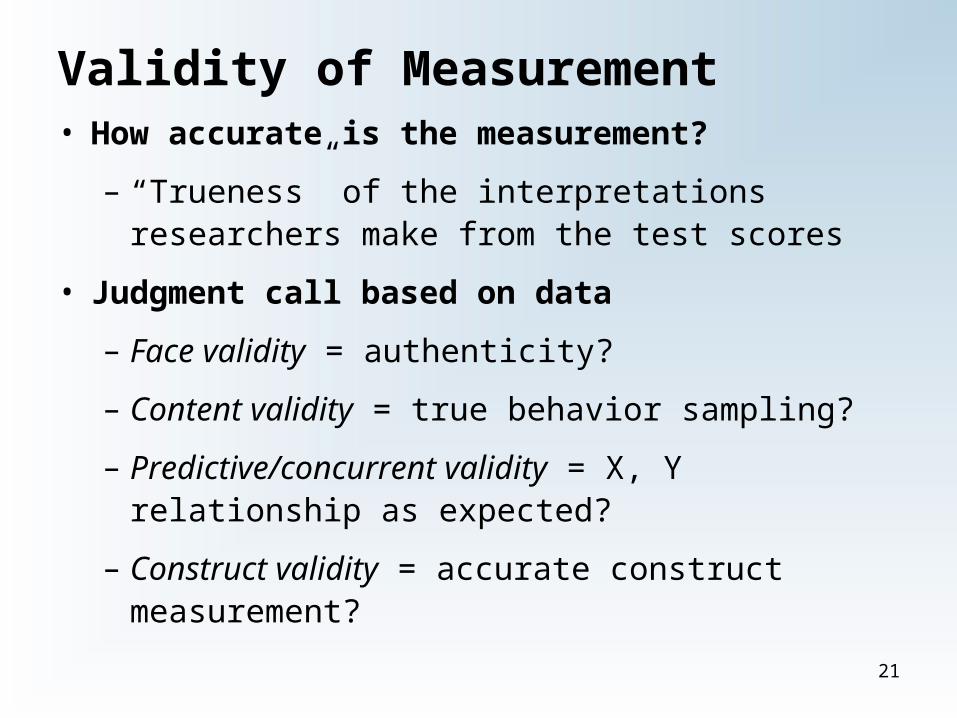
Validity of Measurement• How accurate is the measurement?
– “Trueness” of the interpretations researchers make from the test scores
• Judgment call based on data
– Face validity = authenticity?
– Content validity = true behavior sampling?
– Predictive/concurrent validity = X, Y relationship as expected?
– Construct validity = accurate construct measurement?
21
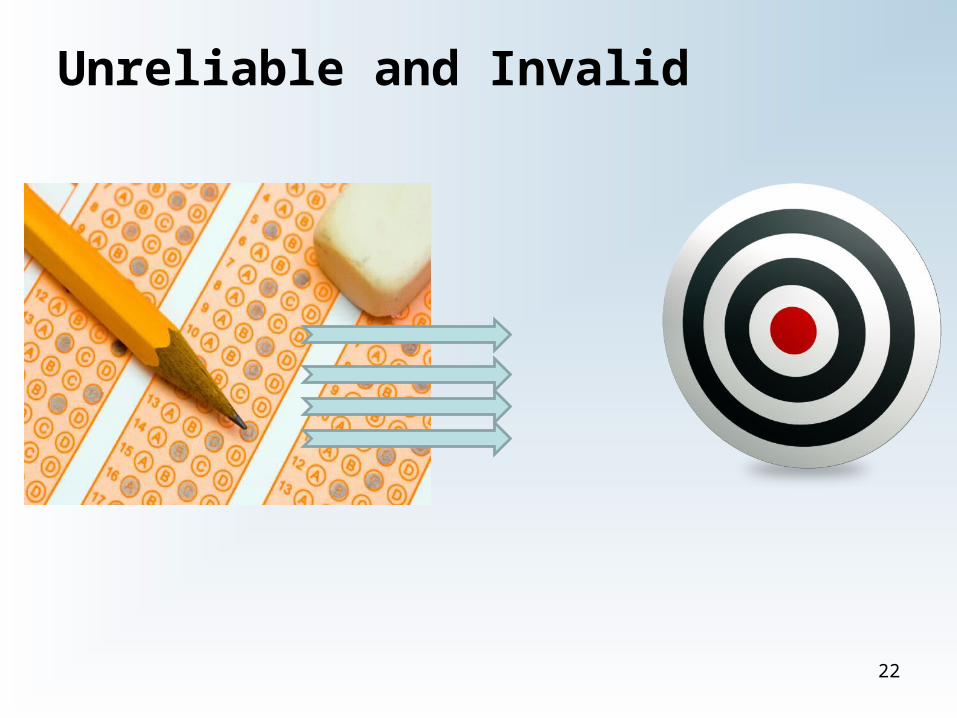
Unreliable and Invalid
22
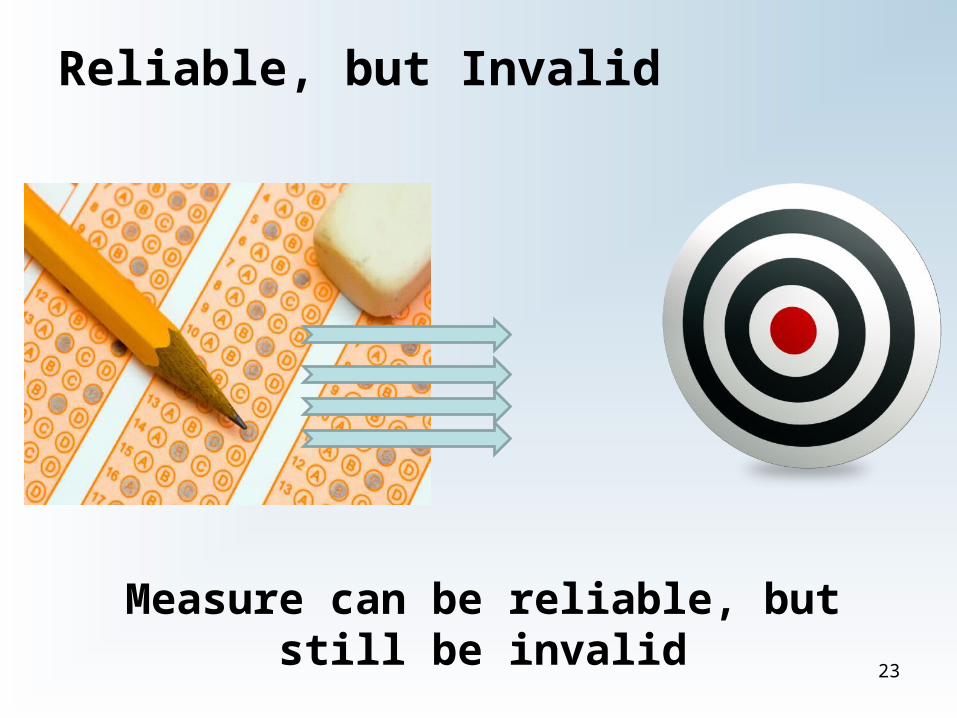
Reliable, but Invalid
Measure can be reliable, but still be invalid
23
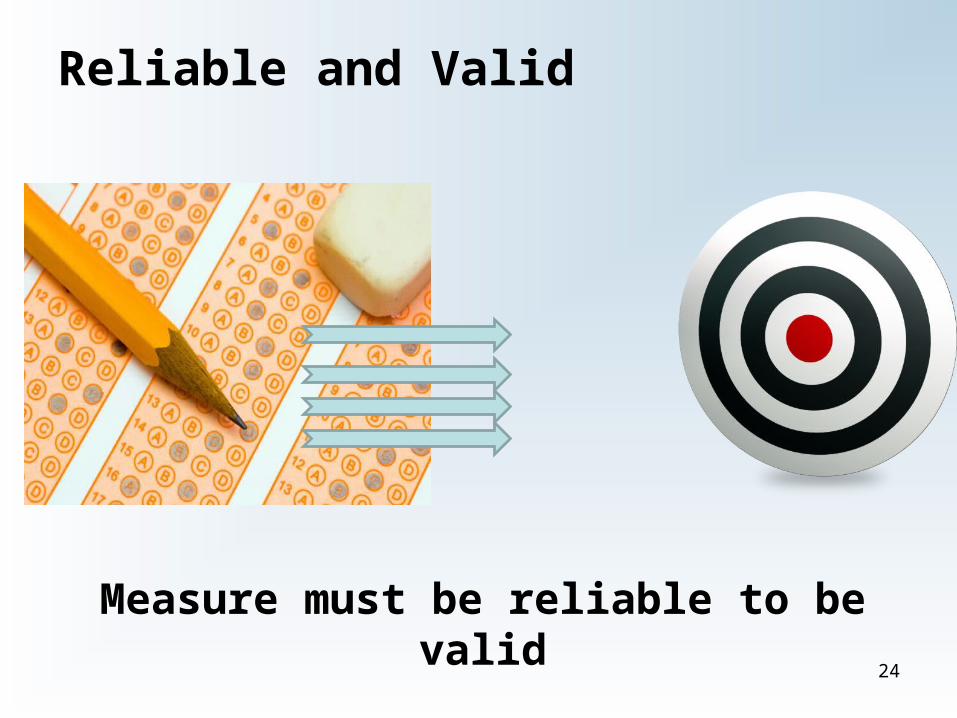
Reliable and Valid
Measure must be reliable to be valid
24
Relating Samples to Populations• Samples = smaller set of the larger
population of interest
– Representative vs. convenience
•Size and matching characteristics
– Manageability
•Resources and costs
25
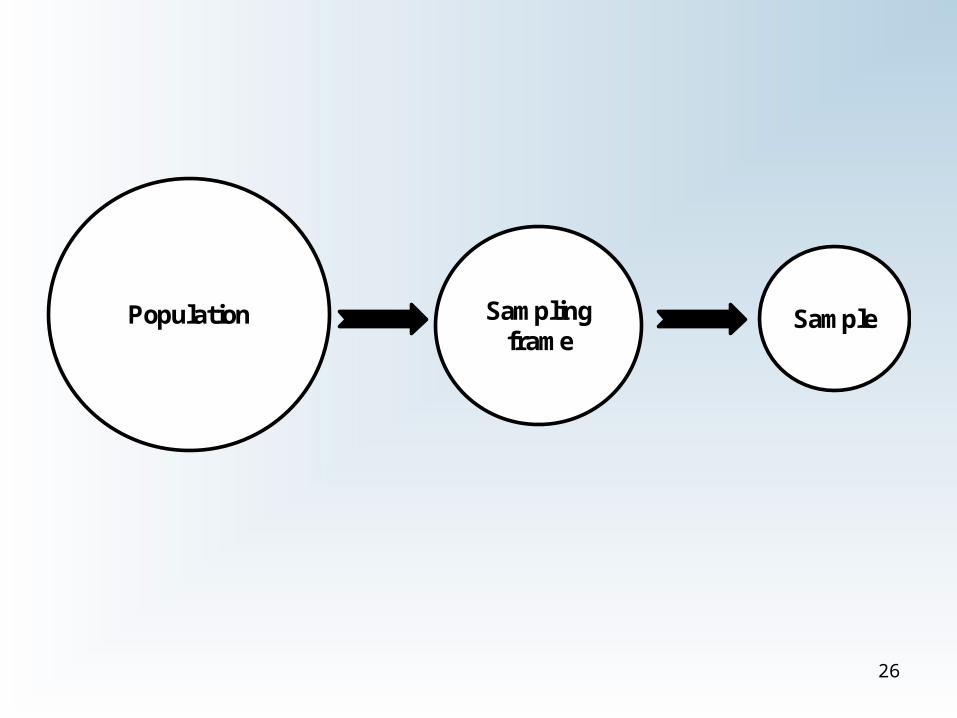
Population SampleSampling frame
26
Random Sampling
• Best way to generate a representative subset of a population
• Simple random sampling = Each member with an equal probability of being sampled
27
Random Sampling
• Essential when:
1. Goal is to estimate pop. characteristics
2. Trying to develop a test or intervention for a larger population
28
Random Sampling
• Not essential when we are interested in basic relationships among variables
• BUT,
– Risky generalization
– Requires multiple replications
29
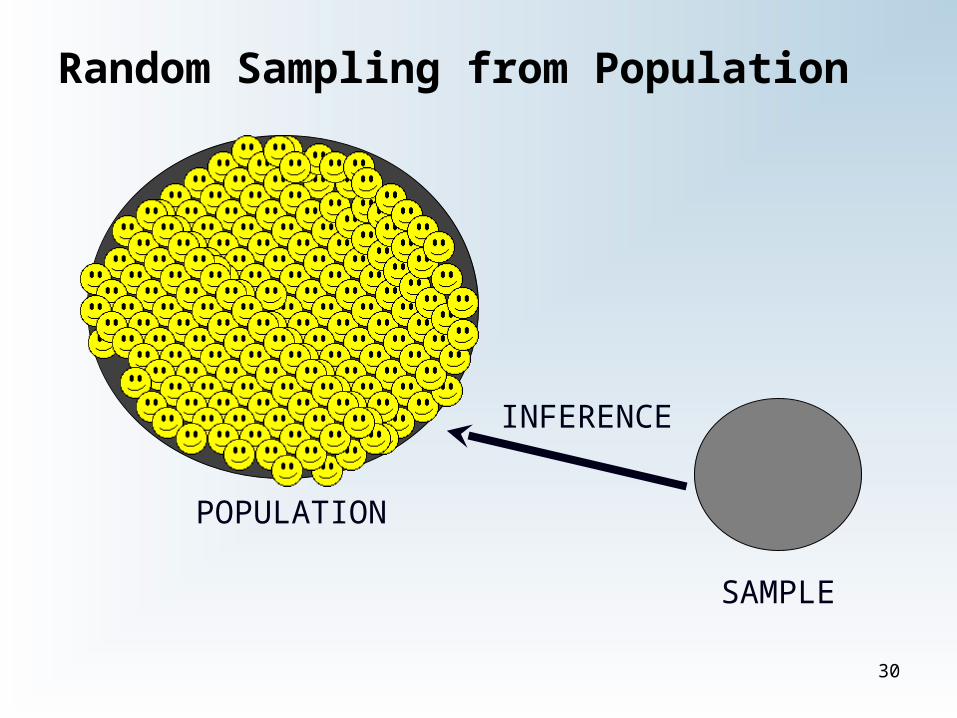
Random Sampling from Population
POPULATION
SAMPLE
INFERENCE
30
Random Assignment
• Not same as random sampling
• Assignment = actual placement in experimental groups
• Minimizes confounds and maximizes transfer of results to pop.
– Good for internal and external validity
31
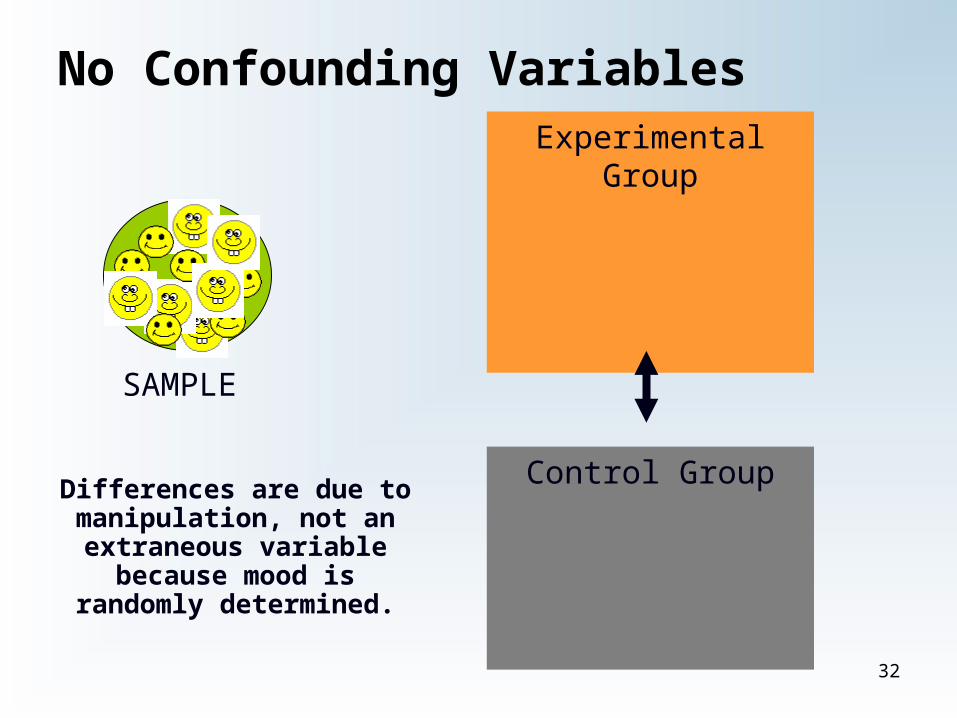
No Confounding Variables
SAMPLE
Control Group
Experimental Group
Differences are due to manipulation, not an extraneous variable
because mood is randomly determined.
32
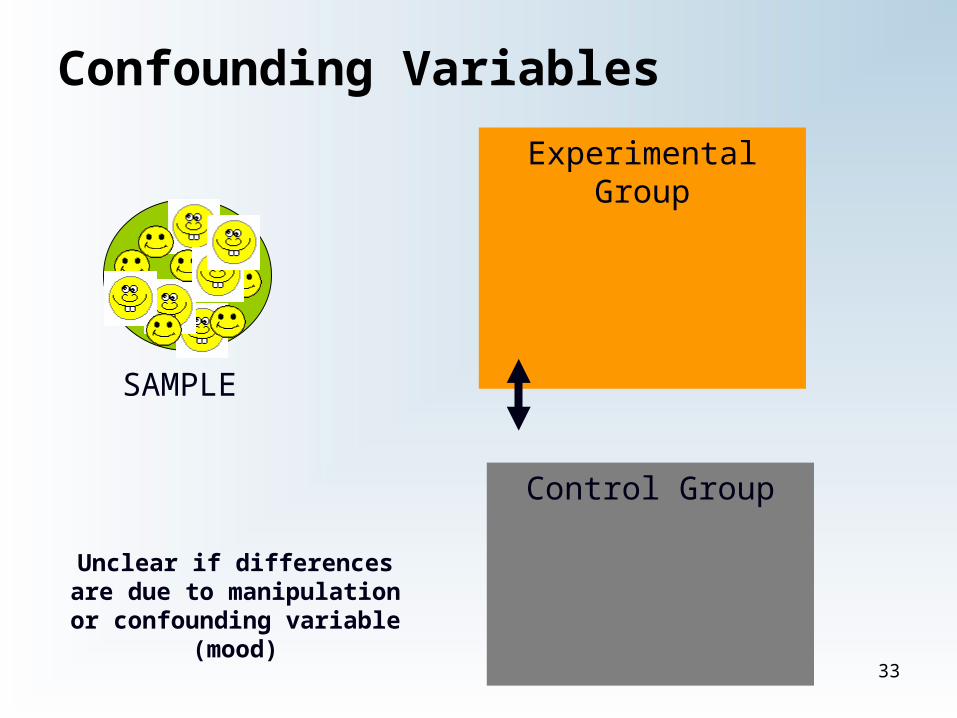
Confounding Variables
SAMPLE
Control Group
Experimental Group
Unclear if differences are due to manipulation or confounding variable
(mood)33
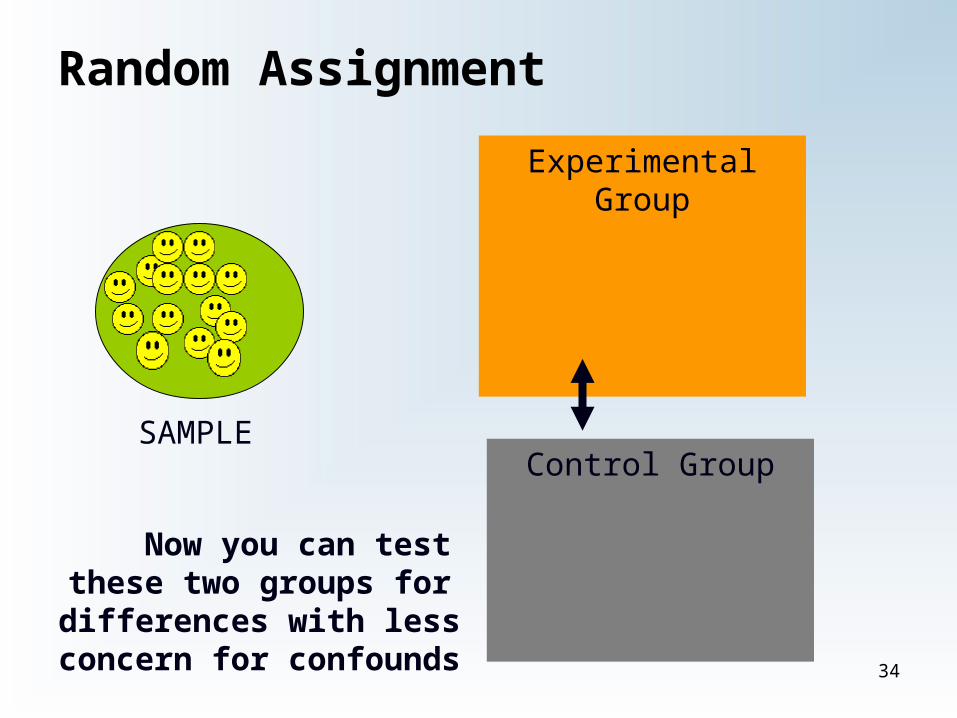
Random Assignment
SAMPLEControl Group
Experimental Group
Now you can test these two groups for differences with less
concern for confounds 34
Questions so far this chapter?
What about so far in this course?
35
What is Next?
• **instructor to provide details
36