slides for chapter 6: external adjustment in small and...
TRANSCRIPT

Slides for Chapter 6:
External Adjustment in Small and Large Economies
International Macroeconomics
Schmitt-Grohe Uribe Woodford
Columbia University
May 1, 2016
1

International Macroeconomics, Chapter 6 Schmitt-Grohe, Uribe, Woodford
A Graphical Approach to Studying External Adjustment in
Small and Large Economies
We will derive a current account schedule: CAt = CA(rt; . . . ). This
will be helpful to analyze adjustment in the current account to
macroeconomic disturbances.
2

International Macroeconomics, Chapter 6 Schmitt-Grohe, Uribe, Woodford
Recall the Investment Schedule from Chapter 5:
I1 = I( r1; A2,− +
. . . )
I1
r1
← I(r1;A2)
3

International Macroeconomics, Chapter 6 Schmitt-Grohe, Uribe, Woodford
Shifter of the Investment Schedule
• A2 ↑, then schedule shifts up and to the right
4

International Macroeconomics, Chapter 6 Schmitt-Grohe, Uribe, Woodford
Introduce the Savings Schedule Results of Chapters 3 and 5 imply...
S1 = S( r1; Q1 Q2,+ + −
. . . )
S1(r1;Q1,Q2)
S
r1
5

International Macroeconomics, Chapter 6 Schmitt-Grohe, Uribe, Woodford
Shifters of the Savings Schedule
• Q1 ↑, S(r) shifts right.
• Q2 ↑, S(r) shifts left.
6

International Macroeconomics, Chapter 6 Schmitt-Grohe, Uribe, Woodford
The Current Account Schedule
CA = S − I
CA(r) = S(r)− I(r)
7

International Macroeconomics, Chapter 6 Schmitt-Grohe, Uribe, Woodford
Draw the savings and investment schedule in the same graph:
Given r, horizontal difference gives: S − I, which is the current
account.
S(r1, Q
1)
I(r1)
S, I
r1
rc
ra
rb
(a)
CA(r1)
r1
CA0
rc
ra
rb
(b)
8
International Macroeconomics, Chapter 6 Schmitt-Grohe, Uribe, Woodford
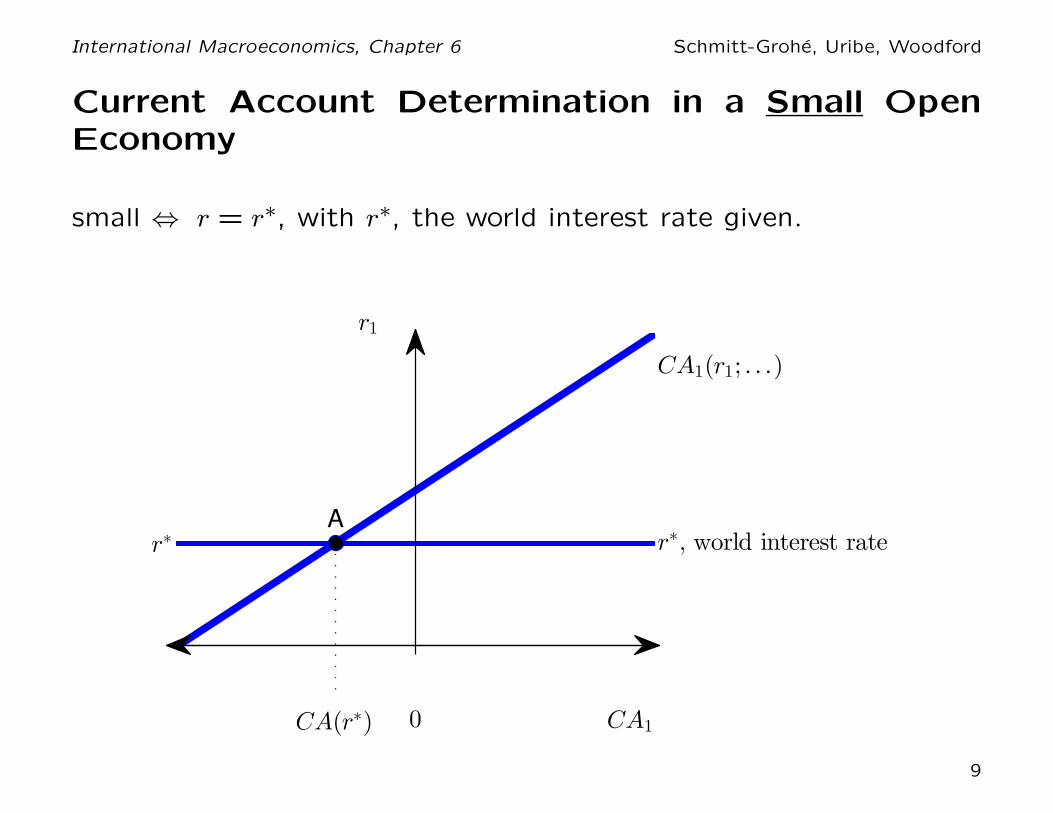
Current Account Determination in a Small OpenEconomy
small ⇔ r = r∗, with r∗, the world interest rate given.
A
CA(r∗)
CA1(r1; . . .)
r∗, world interest rater∗
CA10
r1
9

International Macroeconomics, Chapter 6 Schmitt-Grohe, Uribe, Woodford
Now use the graphical apparatus to analyze current account adjustment
to:
1. An increase in the world interest rate, r∗ ↑.
2. A temporary output shock, Q1 ↑.
3. A future productivity shock, A2 ↑.
4. Expected future terms of trade depreciation.
10

International Macroeconomics, Chapter 6 Schmitt-Grohe, Uribe, Woodford
1.) Current account adjustment to an increase in the world
interest rate
CA(r1, Q
1)
CA0
r*o
CA1
r*1
r1
CA0
11

International Macroeconomics, Chapter 6 Schmitt-Grohe, Uribe, Woodford
2.) Current account adjustment to a temporary increase in
output
S(r1, Q
0
1) S(r
1, Q
1
1)I(r
1)
S, I
r1
r*
So
1S
1
1Io
1
ro
c
r1
c
(a)
CA(r1, Q
1
0)
CAo
1
CA(r1, Q
1
1)
CA1
1
r1
CA0
r*
(b)
12

International Macroeconomics, Chapter 6 Schmitt-Grohe, Uribe, Woodford
3.) Current account adjustment to a future increase in productivity
So(r
1, Q
1)
S1(r
1, Q
1)I
o(r
1) I
1(r
1)
S, I
r1
r*
So
1S
1
1Io
1I1
1
ro
c
r1
c
(a)
CAo(r
1, Q
1)
CAo
1
CA1(r
1, Q
1)
CA1
1
r1
CA0
r*
(b)
13

International Macroeconomics, Chapter 6 Schmitt-Grohe, Uribe, Woodford
4.) Expected future terms of trade depreciation.
S(r1, Q
0
1) S(r
1, Q
1
1)I(r
1)
S, I
r1
r*
So
1S
1
1Io
1
ro
c
r1
c
(a)
CA(r1, Q
1
0)
CAo
1
CA(r1, Q
1
1)
CA1
1
r1
CA0
r*
(b)
14

International Macroeconomics, Chapter 6 Schmitt-Grohe, Uribe, Woodford
Current Account Determination in a
Small Open Economy with
an Interest Rate Risk Premium
15

International Macroeconomics, Chapter 6 Schmitt-Grohe, Uribe, Woodford
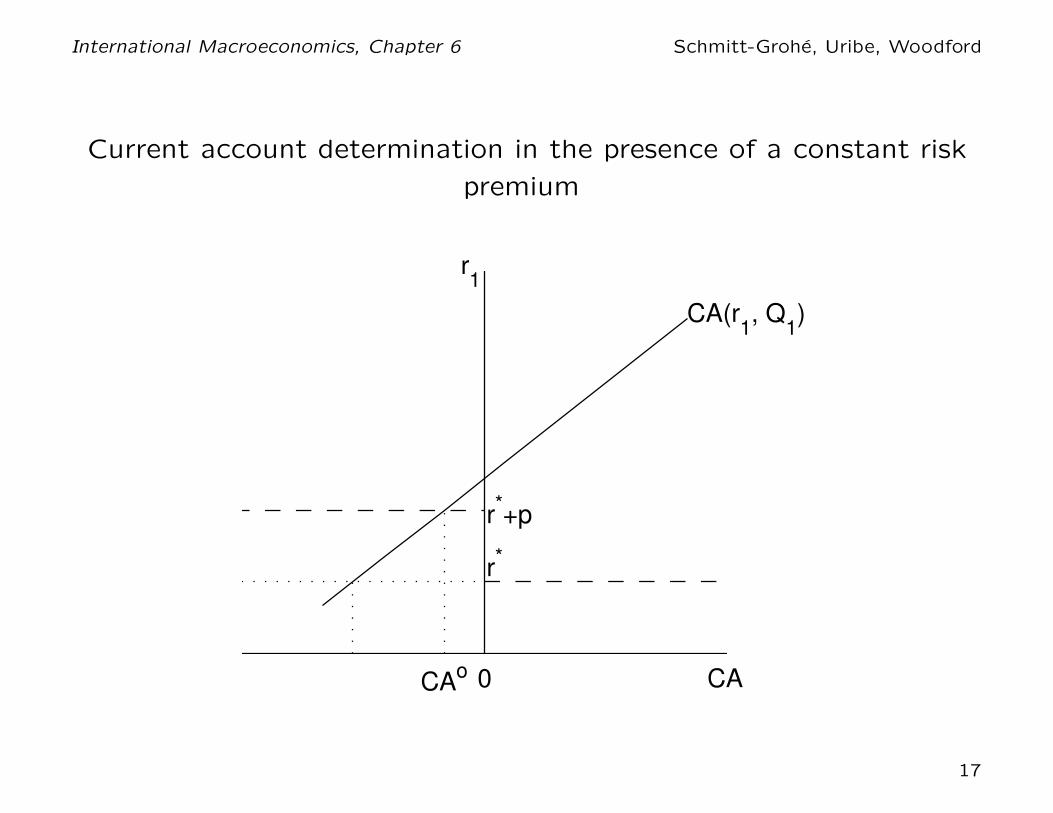
r1 = country interest rate
r∗ = world interest rate
Typically, r1 >> r∗ for emerging market debtors. Why? Because of
positive country risk premia.
p ≡ r1 − r∗ = country risk premium
or
r1 =
{
r∗ + p if country is a debtorr∗ if country is a creditor
16
International Macroeconomics, Chapter 6 Schmitt-Grohe, Uribe, Woodford
Current account determination in the presence of a constant risk
premium
CA(r1, Q
1)
r*
CAo
r*+p
r1
CA0
17

International Macroeconomics, Chapter 6 Schmitt-Grohe, Uribe, Woodford
Current account determination in the presence of an increasing risk
premium
CAo(r
1, Q
1)CA
1(r
1, Q
1)
r*
r*+p(−CA)
CA0
1CA
1
1
r1
CA0
18

International Macroeconomics, Chapter 6 Schmitt-Grohe, Uribe, Woodford
Equilibrium in a Large Open Economy
large → r 6= r∗.
Instead r is such that
CA(r) + CAROW(r) = 0
ROW = rest of the world
19

International Macroeconomics, Chapter 6 Schmitt-Grohe, Uribe, Woodford
Current account determination in a large open economy
CAUSCA
US′
CARW
AC
BD
D′
r
CAUS0CA
RW
20
International Macroeconomics, Chapter 6 Schmitt-Grohe, Uribe, Woodford
Bernanke’s Global Saving Glut Hypothesis
Ben S. Bernanke, “The Global Saving Glut and the U.S. Current
Account Deficit,” Homer Jones Lecture, St. Louis, Missouri, April
14, 2005.
21

International Macroeconomics, Chapter 6 Schmitt-Grohe, Uribe, Woodford
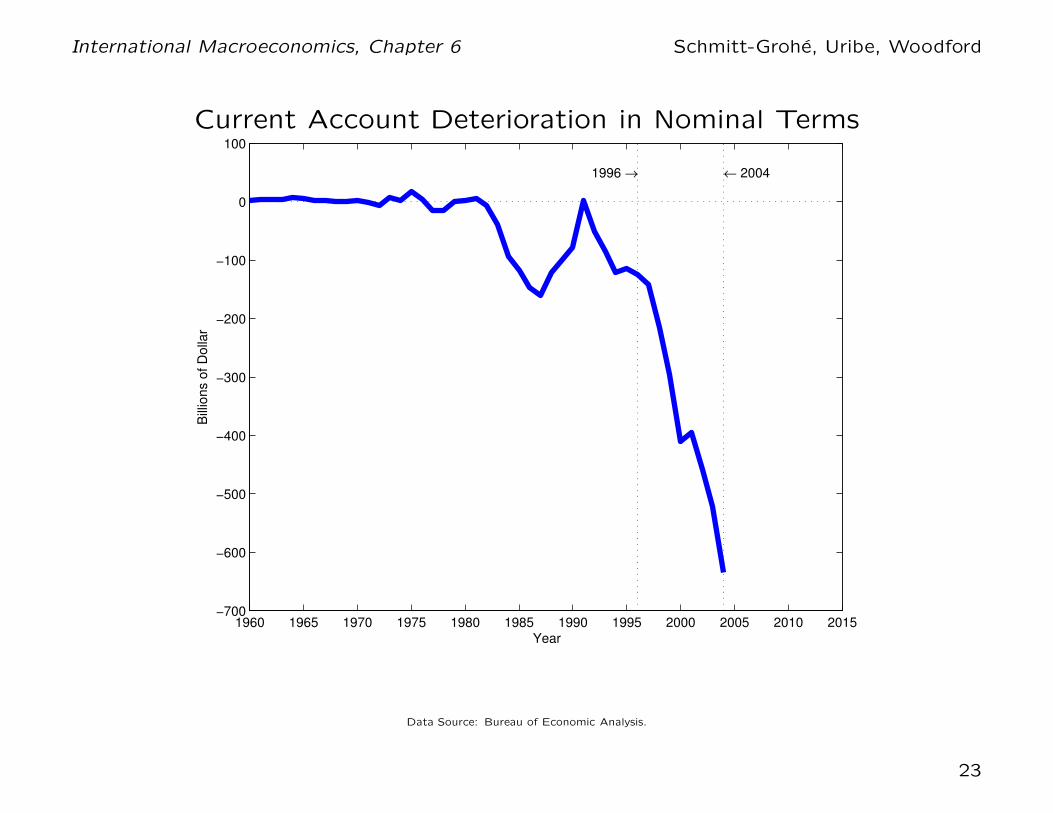
Bernanke observes that between 1996 and 2004 the U.S. current
account has greatly deteriorated:
CA ($ bn) CA/GDP (in %)
1996 -125 -1.52000 -411 -4.02004 -634 -5.2
Note. These numbers differ slightly from those reported in Bernanke’s speech, because the
numbers in the table are revised numbers from the March 19, 2015 release.
22
International Macroeconomics, Chapter 6 Schmitt-Grohe, Uribe, Woodford
Current Account Deterioration in Nominal Terms
1960 1965 1970 1975 1980 1985 1990 1995 2000 2005 2010 2015−700
−600
−500
−400
−300
−200
−100
0
100
1996 → ← 2004
Bill
ions o
f D
olla
r
Year
Data Source: Bureau of Economic Analysis.
23

International Macroeconomics, Chapter 6 Schmitt-Grohe, Uribe, Woodford
While not quite as dramatic as in nominal terms, current account
deterioration also large in real terms ...
1960 1965 1970 1975 1980 1985 1990 1995 2000 2005 2010 2015−6
−5
−4
−3
−2
−1
0
1
2
1996 → ← 2004
Pe
rce
nt
of
GD
P
Year
Data Source: Bureau of Economic Analysis.
24
International Macroeconomics, Chapter 6 Schmitt-Grohe, Uribe, Woodford
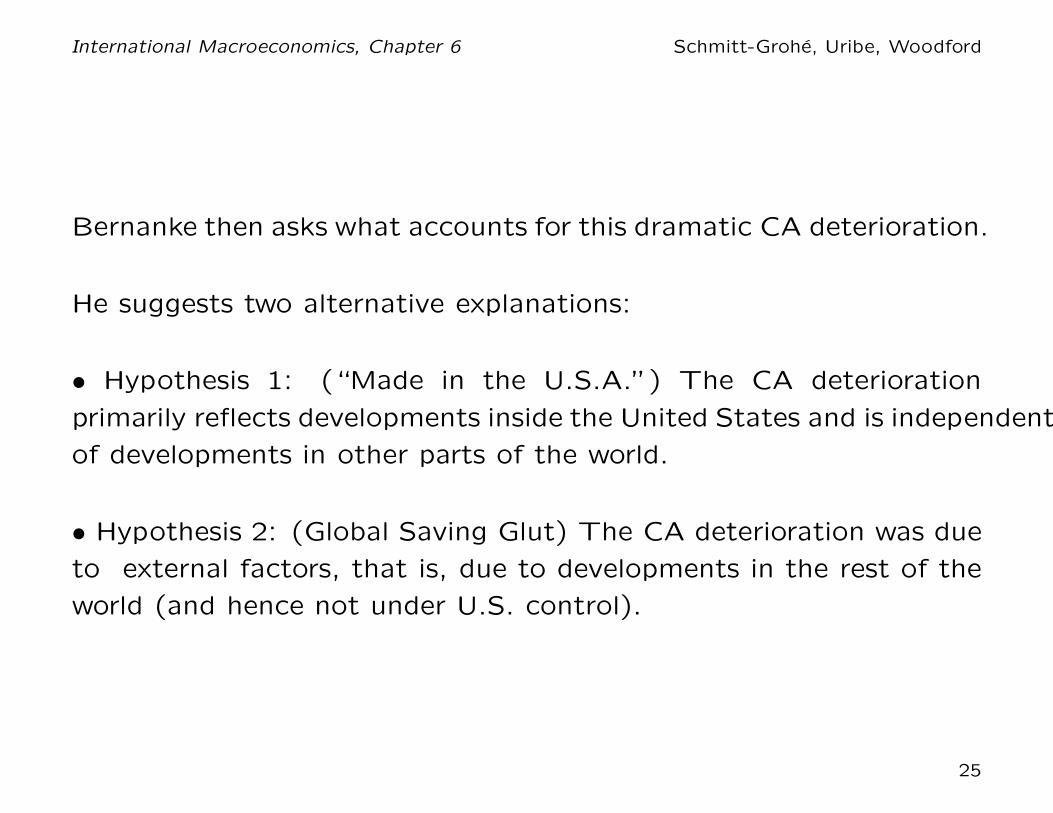
Bernanke then asks what accounts for this dramatic CA deterioration.
He suggests two alternative explanations:
• Hypothesis 1: (“Made in the U.S.A.”) The CA deterioration
primarily reflects developments inside the United States and is independent
of developments in other parts of the world.
• Hypothesis 2: (Global Saving Glut) The CA deterioration was due
to external factors, that is, due to developments in the rest of the
world (and hence not under U.S. control).
25
International Macroeconomics, Chapter 6 Schmitt-Grohe, Uribe, Woodford
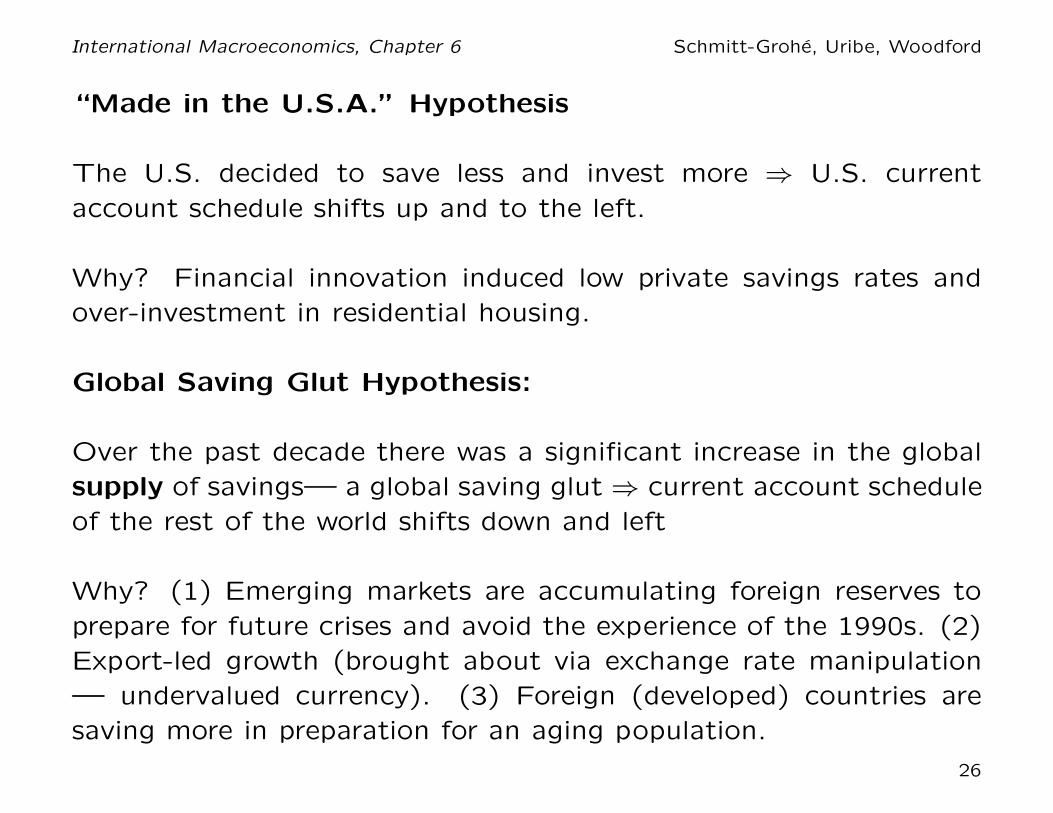
“Made in the U.S.A.” Hypothesis
The U.S. decided to save less and invest more ⇒ U.S. current
account schedule shifts up and to the left.
Why? Financial innovation induced low private savings rates and
over-investment in residential housing.
Global Saving Glut Hypothesis:
Over the past decade there was a significant increase in the global
supply of savings— a global saving glut ⇒ current account schedule
of the rest of the world shifts down and left
Why? (1) Emerging markets are accumulating foreign reserves to
prepare for future crises and avoid the experience of the 1990s. (2)
Export-led growth (brought about via exchange rate manipulation
— undervalued currency). (3) Foreign (developed) countries are
saving more in preparation for an aging population.
26
International Macroeconomics, Chapter 6 Schmitt-Grohe, Uribe, Woodford
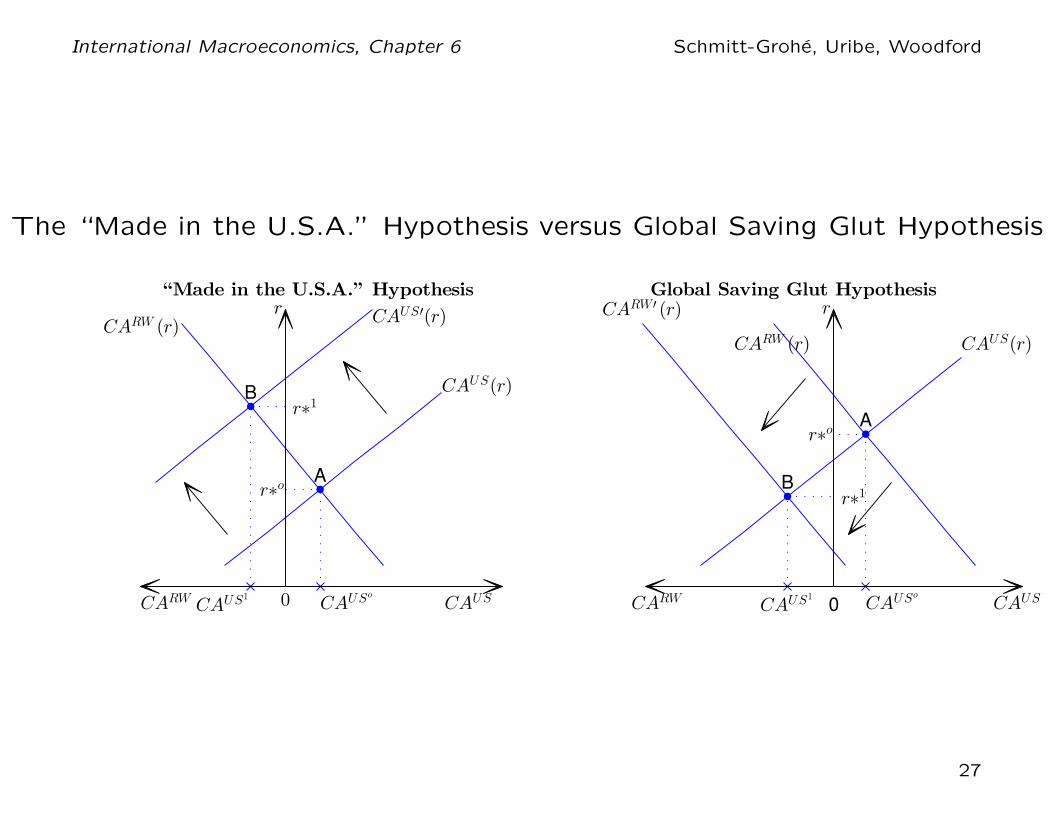
The “Made in the U.S.A.” Hypothesis versus Global Saving Glut Hypothesis
CAUS(r)CARW (r)
CARW′ (r)
A
CAUSo
r∗o
B
CAUS1
r∗1
r
CAUS0CARW
Global Saving Glut Hypothesis
CAUS(r)
CAUS′(r)CARW (r)
A
CAUSo
r∗o
B
CAUS1
r∗1
r
CAUS0CARW
“Made in the U.S.A.” Hypothesis
27
International Macroeconomics, Chapter 6 Schmitt-Grohe, Uribe, Woodford
How can we tell the Global Saving Glut Hypothesis and the
“Made in the U.S.A.” Hypothesis apart?
Both hypothesis imply that the U.S. current account deteriorates.
BUT
the global savings glut hypothesis predicts that interest rates fall
whereas the “Made in the U.S.A.” hypothesis predicts that interest
rates rise.
So we can use the observed behavior of interest rates to tell the two
hypotheses apart.
28

International Macroeconomics, Chapter 6 Schmitt-Grohe, Uribe, Woodford
How to construct the real interest rate?
rt = real rate between period t and t + 1
it = nominal interest rate between t and t + 1
πt+1 ≡ Pt+1/Pt = gross rate of inflation between t and t + 1
Et = expectations operator conditional on information in period t
Use the Fisher equation,
1 + rt =(1 + it)
Etπt+1,
which says that the real rate equals the nominal rate minus expected
inflation.
it measured by 1-year Treasury rate.
29

πt measured by annual CPI inflation rate.
How to measure expected inflation, Etπt+1? We assume that πt+1 =
Etπt+1 for simplicity.
Alternatively, one could run a regression of 1/πt on its own lags.

International Macroeconomics, Chapter 6 Schmitt-Grohe, Uribe, Woodford
The World Real Interest Rate: 1994-2004
1990 1992 1994 1996 1998 2000 2002 2004 2006 2008 2010−2
−1
0
1
2
3
4
Year
Perc
ent per
year
1996 → ← 2004
Note. The world real interest rate is approximated by the difference between the rate on 1-year U.S. Treasury securities and 1-year ex post CPI inflation.
30

International Macroeconomics, Chapter 6 Schmitt-Grohe, Uribe, Woodford
The World Real Interest Rate: 1992-2012
1995 2000 2005 2010−1
0
1
2
3
4
Year
Perc
ent per
year
Note. The world real interest rate is approximated by the difference between the rate on 10-year U.S. Treasury securities and 10-year expected inflation.
30

International Macroeconomics, Chapter 6 Schmitt-Grohe, Uribe, Woodford
The figure shows that real interest rates fell, which is consistent
with the Global Savings Glut Hypothesis and inconsistent with the
“Made in the U.S.A.” hypothesis.
31
International Macroeconomics, Chapter 6 Schmitt-Grohe, Uribe, Woodford
Finally, can the Saving Glut Hypothesis be used to rationalize the
improvement in the U.S. current account after 2006? The argument
would go as follows. After 2006 the rest of the world decided to
save less and invest more, hence the CA schedule of the ROW
would have shifted up and to the right. As a result the CA balance
of the U.S. would have improved. What would have happened to
interest rates? They should have gone up. However, this is not what
happened, interest rates fell even further during the Great Recession,
suggesting that a subsiding of the savings glut is not the reason for
the improvement in the U.S. current account post 2006.
32