slide 1 using globcolour and medspiration products to investigate marine animal migrations as part...
TRANSCRIPT
Slide 1
Using GLOBCOLOUR and MEDSPIRATION products to
investigate marine animal migrations as part of the DIVERSITY project
Philippe GasparCLS
Satellite Oceanography DivisionMEMMS Team
(Marine Ecosystem Modeling and Monitoring by Satellites)
Slide 2
ESA DUE DIVERSITY
OBJECTIVEOBJECTIVE
Defining & demonstrating EO-based products & services for Defining & demonstrating EO-based products & services for the user community involved in the implementation of the the user community involved in the implementation of the United NationsUnited Nations Convention on Biological Diversity (CBD) Convention on Biological Diversity (CBD)
FOCUS AREA Central America + Caribbean Sea and Tropical East Pacific
CHAMPION USERS UNESCO (Division of Ecological and Earth Sciences) Comisión Centro-Americana de Ambiente y Desarrollo (CCAD) CBD Secretariat MarViva : NGO promoting the safeguarding and creation of
Marine Protected Areas in Latin America and the Caribbean Malpelo Fundacion : the organisation representing MarViva in
Colombia – Focusses on Malpelo Island biodiversity protection
Slide 3
PRODUCTS AND SERVICES
1) LAND COVER Dry-land biodiversity indicators Maps of mesoamerican biological corridors
2) CORAL REEFS Maps of intact/bleaching coral Maps of relevant environmental information : sea water
quality & land sources of marine pollution
3) MANGROVE Maps of mangrove areas Maps of changes in mangrove areas
4) MARINE WILDLIFE MIGRATION AREAS
Slide 4
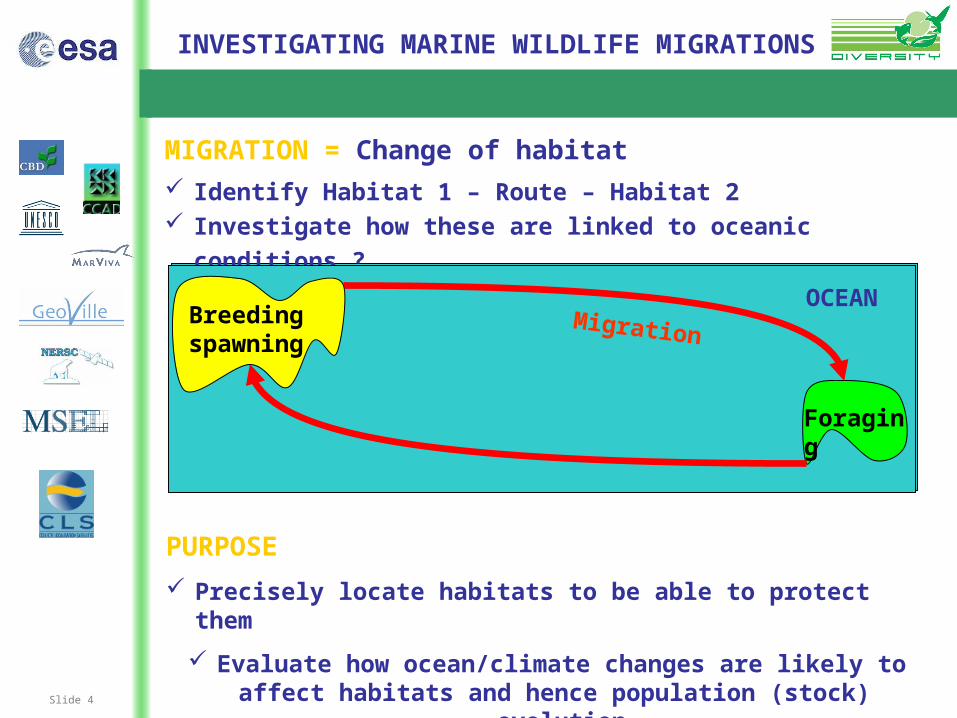
INVESTIGATING MARINE WILDLIFE MIGRATIONS
Breeding/spawning habitat
Foraging habitat
MigrationOCEAN
MIGRATION = Change of habitat Identify Habitat 1 – Route – Habitat 2 Investigate how these are linked to oceanic conditions ?
MigrationBreeding spawning
Foraging
OCEAN
PURPOSE
Precisely locate habitats to be able to protect them
Evaluate how ocean/climate changes are likely to affect habitats and hence population (stock) evolution
Slide 5
PRODUCTS & SERVICES
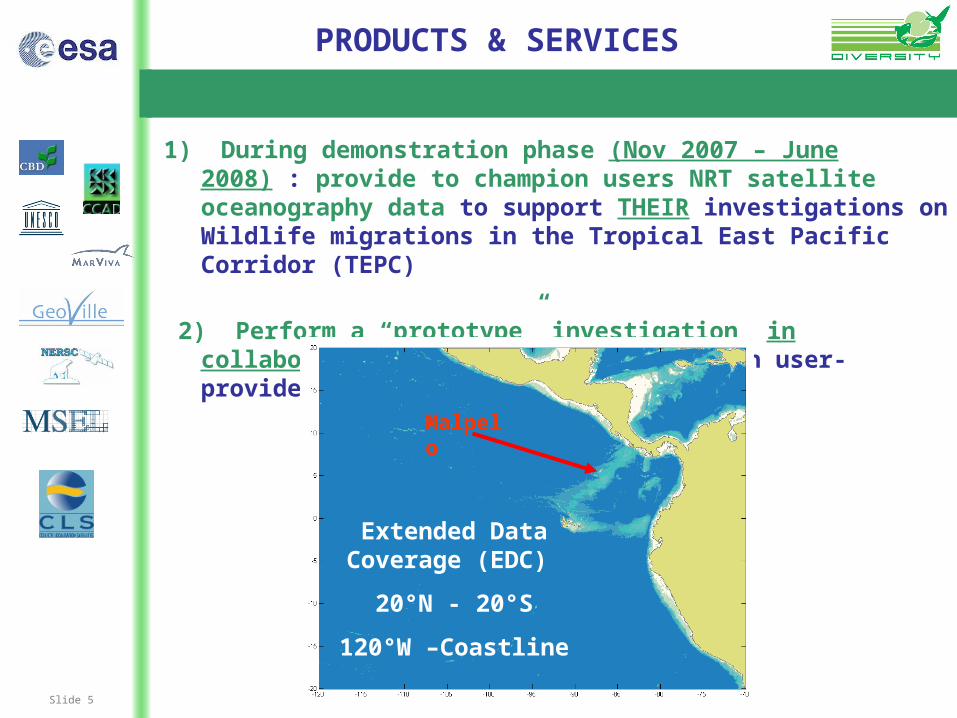
1) During demonstration phase (Nov 2007 – June 2008) : provide to champion users NRT satellite oceanography data to support THEIR investigations on Wildlife migrations in the Tropical East Pacific Corridor (TEPC)
2) Perform a “prototype” investigation in collaboration with the users & based on user-provided animal tracking data
Extended Data Coverage (EDC)
20°N - 20°S
120°W –Coastline
Malpelo
Slide 6
SATELLITE OCEANOGRAPHY DATA
Historical data : Jan 2006 Oct. 2007
Near Real-Time data : Nov. 2007 June 2008
SST
NRT : Dedicated daily MEDSPIRATION product over the EDC area Historical : UKMO GHRSTT data (OSTIA)
OCEAN COLOR
NRT : Chl-a (type I) from (prototype) GLOBCOLOUR processing chain developed & operated by ACRI
Historical : forthcoming GLOBCOLOUR Chl-a reanalysis
OCEAN CURRENTS
NRT & Historical : altimeter-derived surface current product (SURCOUF) from CLS
Slide 7
ANIMAL TRACKING DATA
EULERIAN OBSERVATIONS
= observations of marine animals at a fixed geographic location Observations by divers (species, behaviors, abundance) Acoustic (sonar) data : abundance & vertical distribution of
biomass
LAGRANGIAN OBSERVATIONS
= observations “following” marine animals
Biologgers = electronic devices (tags) attached to marine animals with positioning & data acquisition capabilities. ( + satellite data transmission)
2 main types of “lagrangian” tags Satellite positioning Light positioning
Slide 8
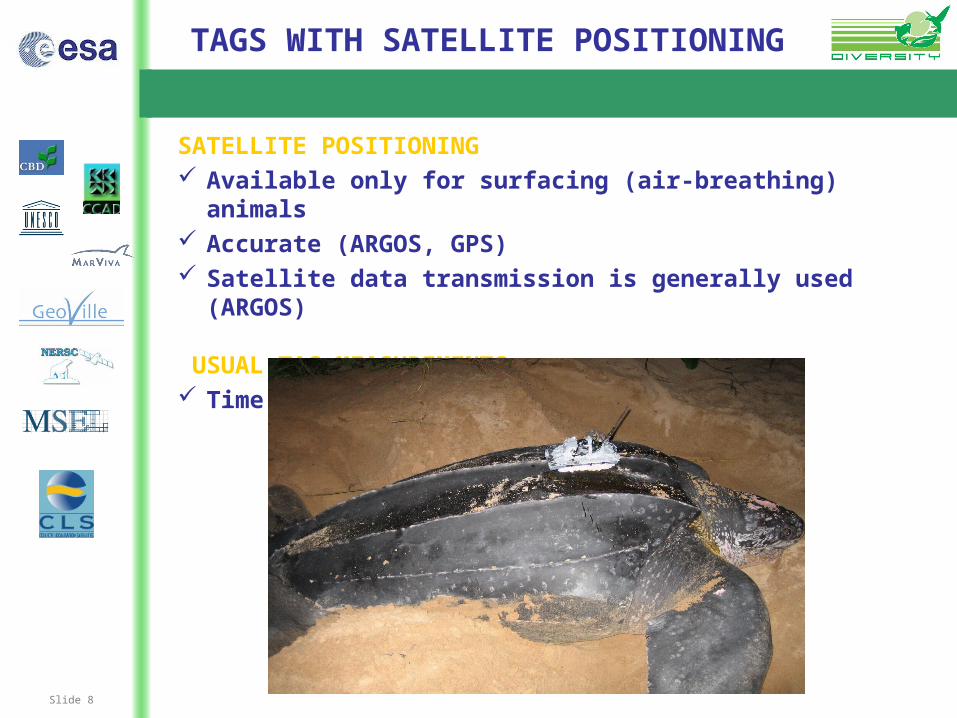
TAGS WITH SATELLITE POSITIONING
SATELLITE POSITIONING Available only for surfacing (air-breathing) animals Accurate (ARGOS, GPS) Satellite data transmission is generally used (ARGOS)
USUAL TAG MEASUREMENTS Time, position, temperature, depth
Slide 9
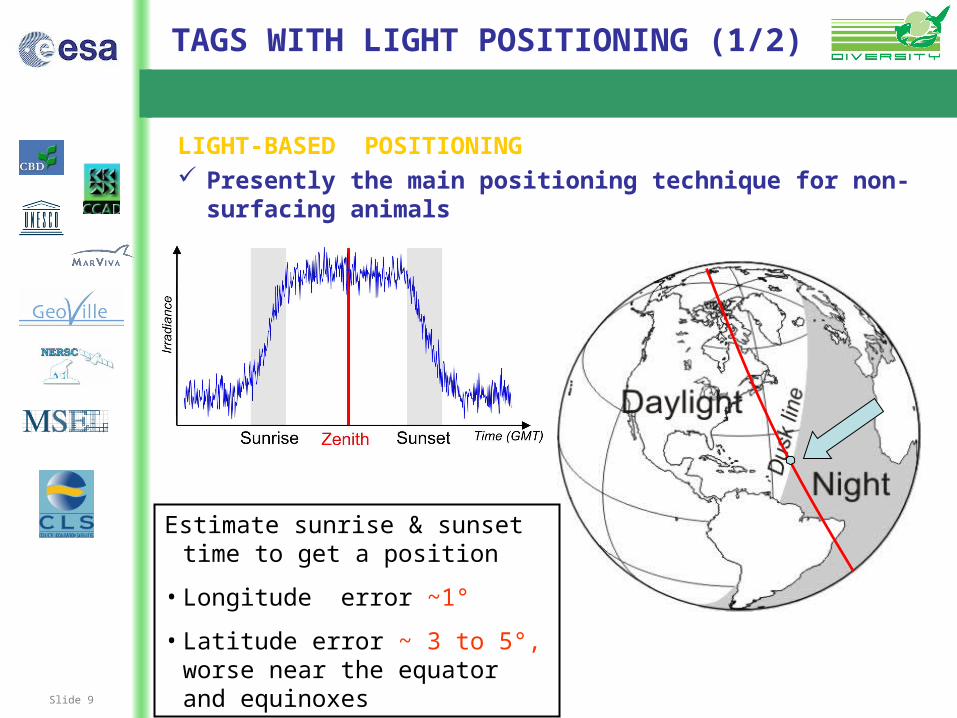
TAGS WITH LIGHT POSITIONING (1/2)
LIGHT-BASED POSITIONING Presently the main positioning technique for non-surfacing
animals
Estimate sunrise & sunset time to get a position
• Longitude error ~1°
• Latitude error ~ 3 to 5°, worse near the equator and equinoxes
Slide 10
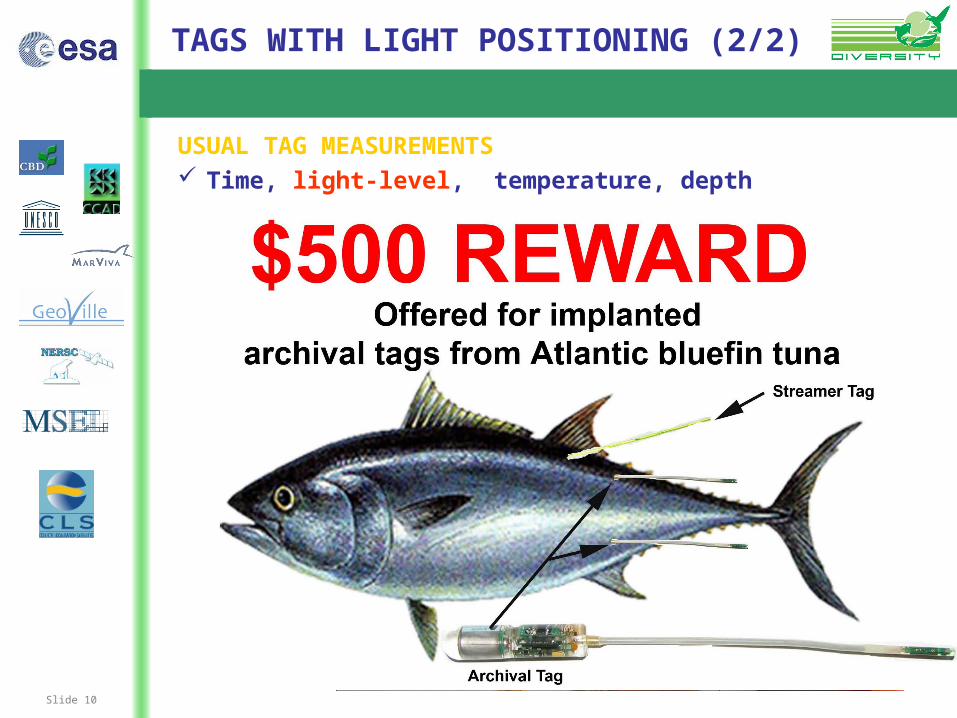
TAGS WITH LIGHT POSITIONING (2/2)
USUAL TAG MEASUREMENTS Time, light-level, temperature, depth
POP-UP TAG
Slide 11
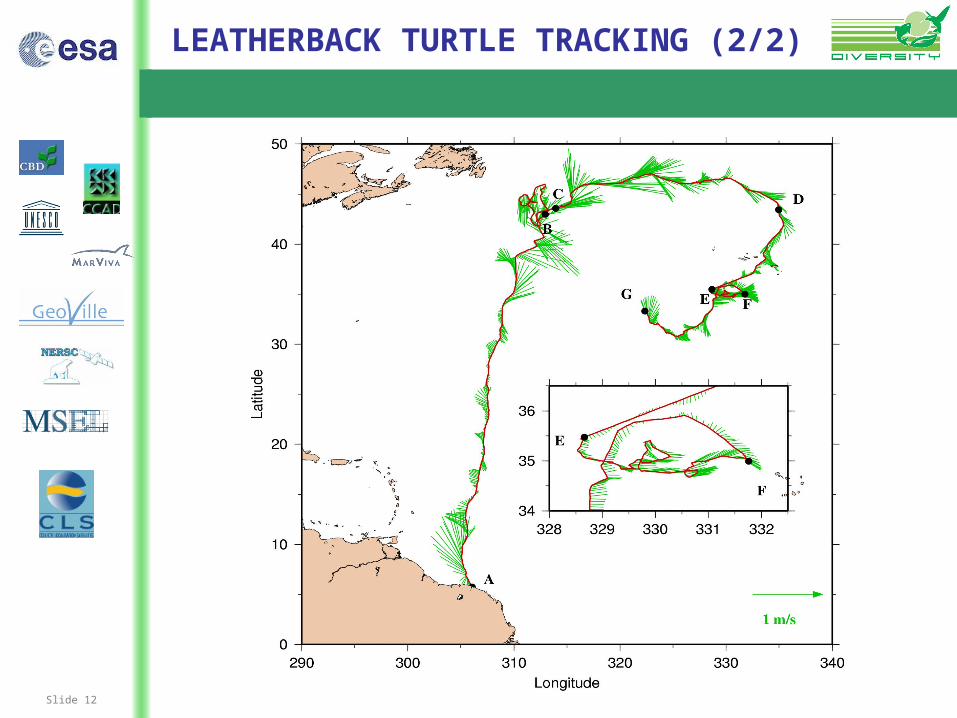
LEATHERBACK TURTLE TRACKING (1/2)
ORIGINAL PLAN 27 female ltb Argos-tracked in 2005 – 2006 the TEPC from
their nesting beaches in Costa Rica Data use restricted by data owner
ABAN
DONN
ED
A PITY……. A “large” pluri-annal data set with precise
positioning Ltb spend most of their time in the upper oceanic
layer (> 50% above 50 m) their behavior is linked with surface oceanic conditions
Forages at low trophic levels (salps, jelly fishes) “short” link to plankton and chl-a
Slide 12
LEATHERBACK TURTLE TRACKING (2/2)
Slide 13
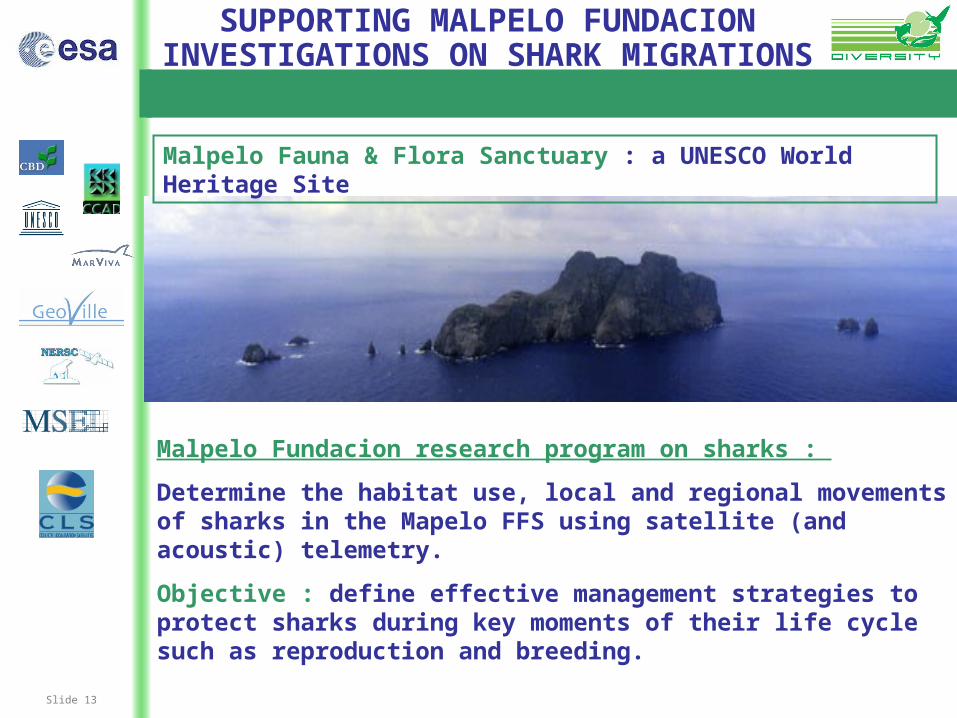
SUPPORTING MALPELO FUNDACION INVESTIGATIONS ON SHARK MIGRATIONS
Malpelo Fundacion research program on sharks :
Determine the habitat use, local and regional movements of sharks in the Mapelo FFS using satellite (and acoustic) telemetry.
Objective : define effective management strategies to protect sharks during key moments of their life cycle such as reproduction and breeding.
Malpelo Fauna & Flora Sanctuary : a UNESCO World Heritage Site
Slide 14
INVESTIGATING SHARK
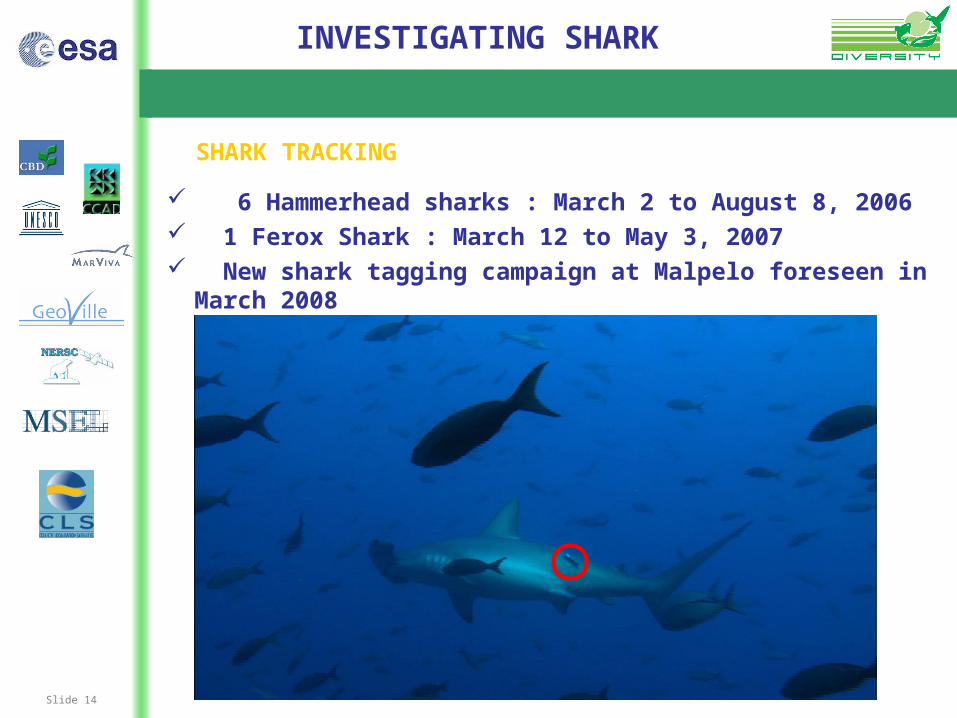
SHARK TRACKING
6 Hammerhead sharks : March 2 to August 8, 2006 1 Ferox Shark : March 12 to May 3, 2007 New shark tagging campaign at Malpelo foreseen in March 2008
Slide 15
SHARK DATA
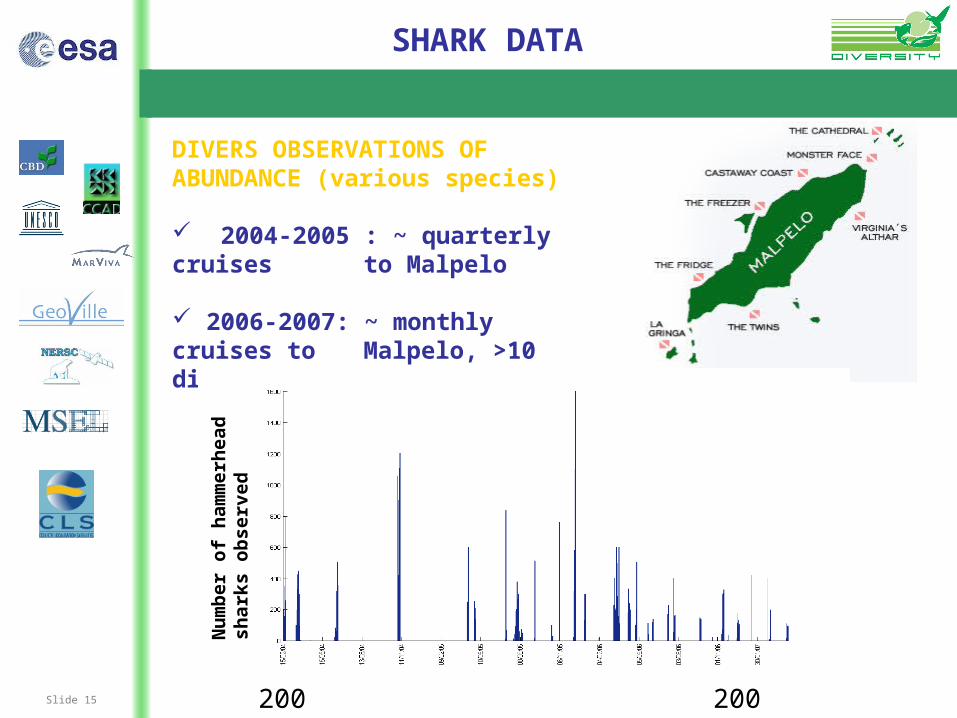
DIVERS OBSERVATIONS OF ABUNDANCE (various species)
2004-2005 : ~ quarterly cruises to Malpelo
2006-2007: ~ monthly cruises to Malpelo, >10 dives per cruise
Nu
mb
er o
f h
amm
erh
ead
sh
arks
ob
serv
ed
2004 2007
Slide 16
SHARK MIGRATIONS
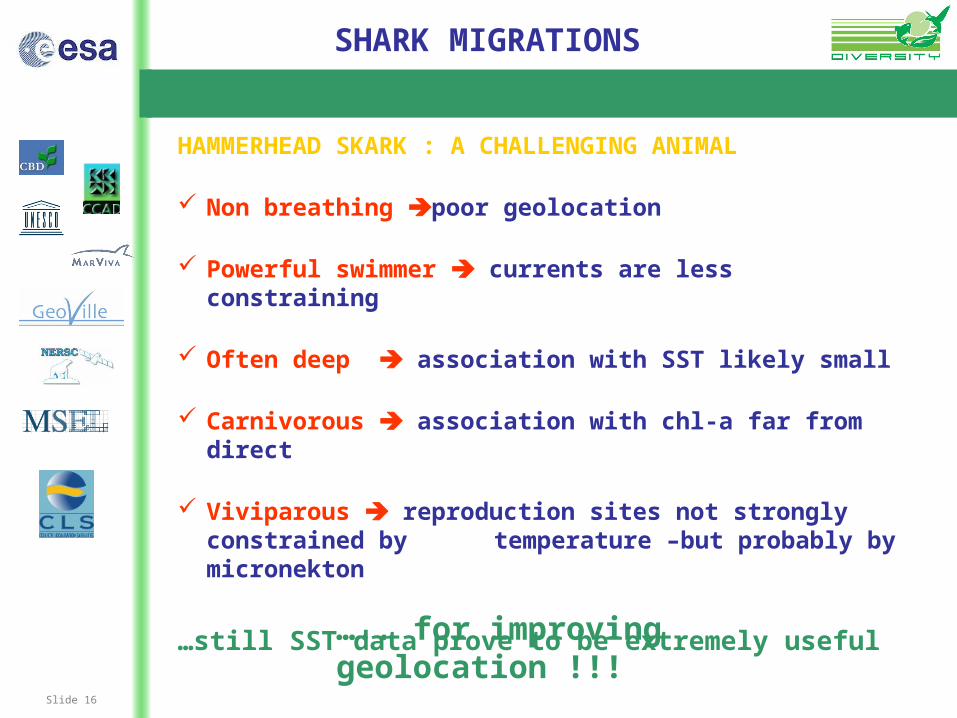
HAMMERHEAD SKARK : A CHALLENGING ANIMAL
Non breathing poor geolocation
Powerful swimmer currents are less constraining
Often deep association with SST likely small
Carnivorous association with chl-a far from direct
Viviparous reproduction sites not strongly constrained by temperature –but probably by micronekton
…still SST data prove to be extremely useful
….. for improving geolocation !!!
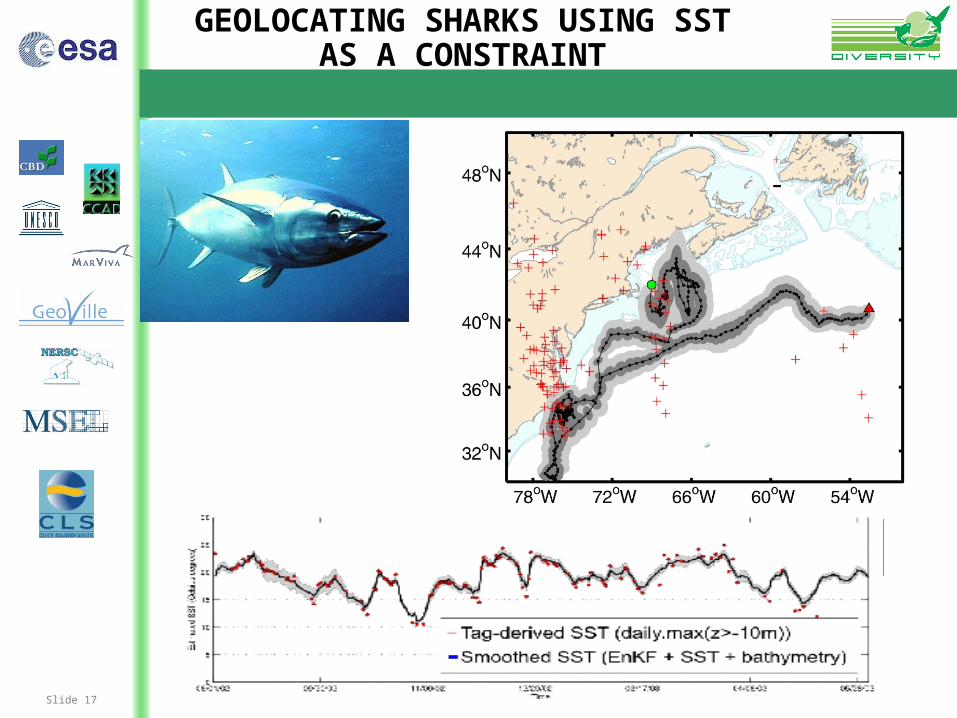
Slide 17
GEOLOCATING SHARKS USING SST AS A CONSTRAINT
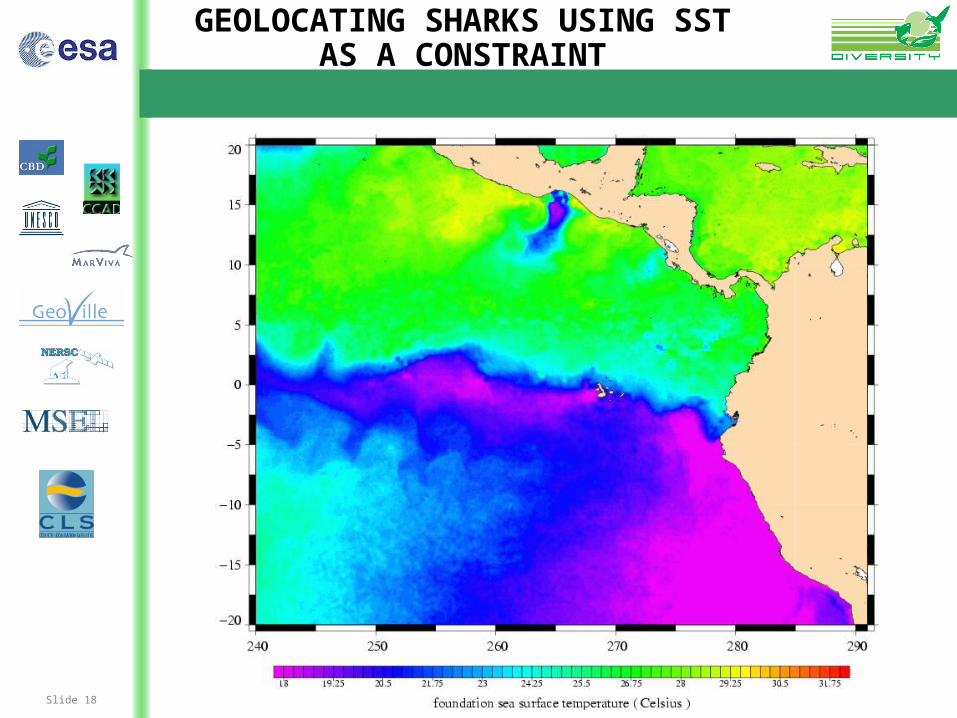
Slide 18
GEOLOCATING SHARKS USING SST AS A CONSTRAINT
Slide 19
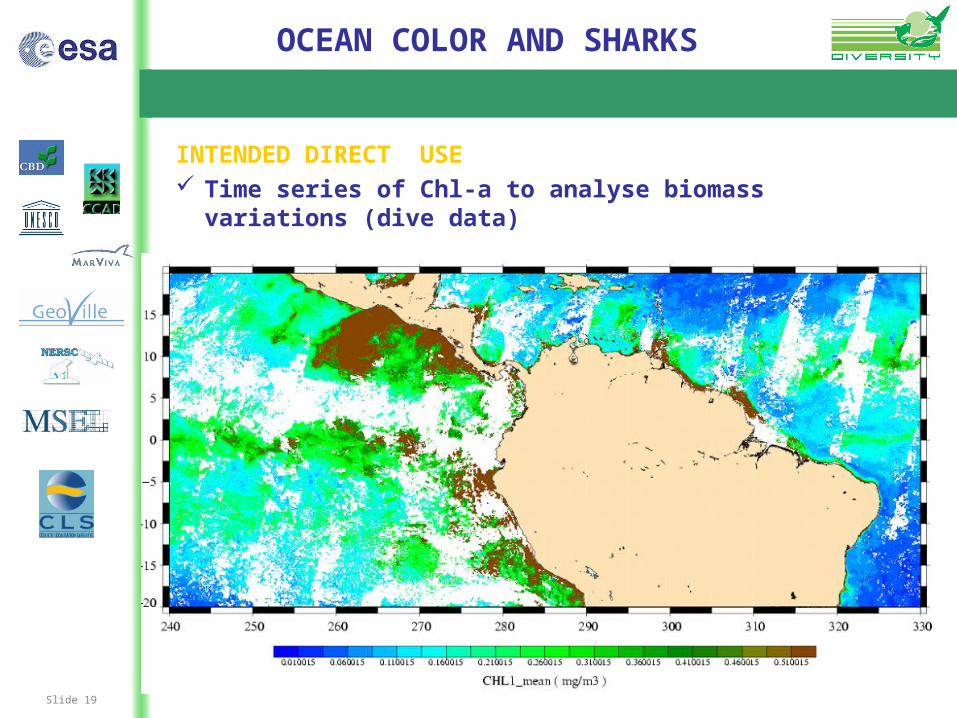
OCEAN COLOR AND SHARKS
INTENDED DIRECT USE Time series of Chl-a to analyse biomass variations (dive data)
Slide 20
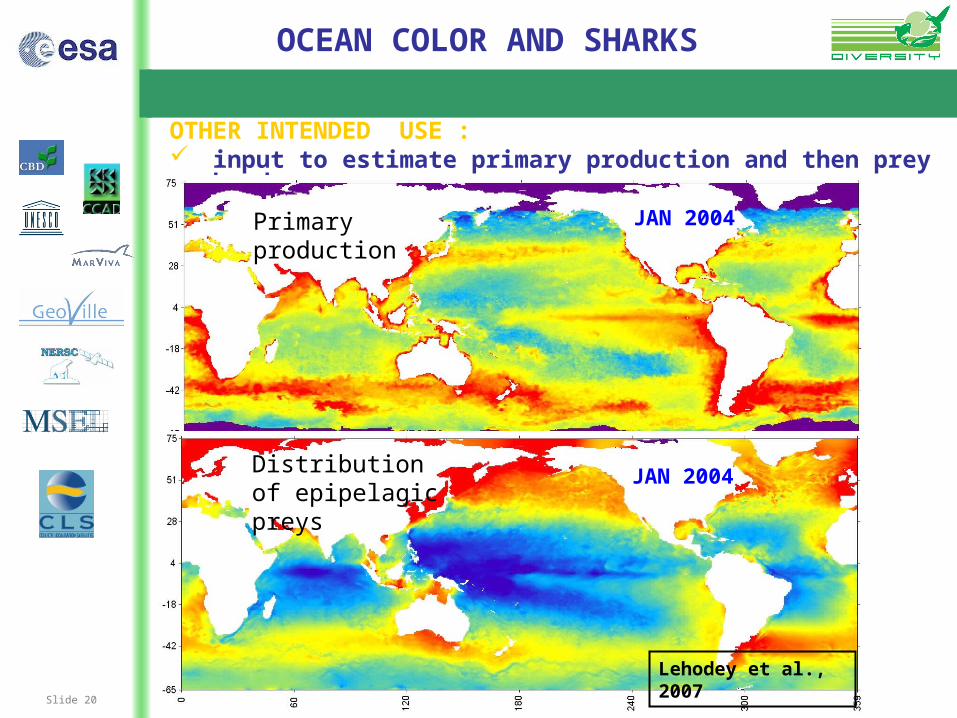
OCEAN COLOR AND SHARKS
OTHER INTENDED USE : input to estimate primary production and then prey abundance
Primary production
Distribution of epipelagic preys
JAN 2004
JAN 2004
Lehodey et al., 2007
Slide 21
SUMMARY
1) Satellite oceanography data are useful in different ways to help analyze marine biology data (tracking and others)
2) Direct use can be envisioned for analyzing some behaviours of some species
3) More generally satellite oceanography data are likely to be used “indirectly” as inputs for the creation of higher-level, more directly pertinent products :
- Light + SST based geolocation
- Primary & secondary production
- ………
Slide 22
SUMMARY
4) While DIVERSITY is still in the prototyping phase, a VERY preliminary evaluation of the GLOBCOLOUR & MEDSPIRATION products has been made
5) Both project teams have been reactive to our requests implemented and delivered dedicated products on our
EDC area provided reliable daily access to these products
6) The MEDSPIRATION SST product appears to be immediately usable
7) The (prototype) GLOBCOLOUR product still needs work before being easily usable for studies of marine animals’ migrations.
Slide 23
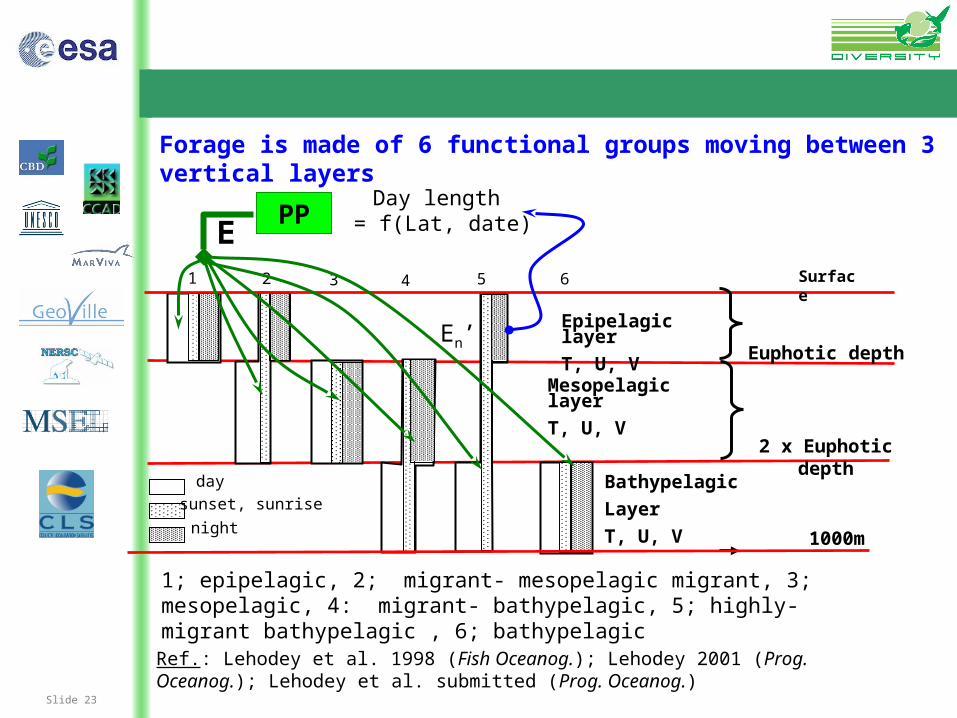
Forage is made of 6 functional groups moving between 3 vertical layers
day
night
sunset, sunrise
Epipelagic layer
T, U, V
1 2 3 4 5 6
Mesopelagic layer
T, U, V
Bathypelagic
Layer
T, U, V
1; epipelagic, 2; migrant- mesopelagic migrant, 3; mesopelagic, 4: migrant- bathypelagic, 5; highly-migrant bathypelagic , 6; bathypelagic
Day length = f(Lat, date)PP
E
En’Euphotic depth
2 x Euphotic depth
1000m
Ref.: Lehodey et al. 1998 (Fish Oceanog.); Lehodey 2001 (Prog. Oceanog.); Lehodey et al. submitted (Prog. Oceanog.)
Surface