sleep fragmentation and motor restlessness in a drosophila model of restless legs syndrome
TRANSCRIPT
Sleep Fragmentation and Mo
Current Biology 22, 1142–1148, June 19, 2012 ª2012 Elsevier Ltd All rights reserved DOI 10.1016/j.cub.2012.04.027
Reporttor
Restlessness in a DrosophilaModel of Restless Legs Syndrome
Amanda Freeman,1,2 Elaine Pranski,2 R. Daniel Miller,2
Sara Radmard,1 Doug Bernhard,2 H.A. Jinnah,2
Ranjita Betarbet,2 David B. Rye,2 and Subhabrata Sanyal1,2,*1Department of Cell Biology2Department of NeurologyEmory University School of Medicine, Atlanta, GA 30322, USA
Summary
Restless Legs Syndrome (RLS), first chronicled by Willis in
1672 and described in more detail by Ekbom in 1945 [1], isa prevalent sensorimotor neurological disorder (5%–10% in
the population) with a circadian predilection for the eveningand night. Characteristic clinical features also include
a compelling urge to move during periods of rest, reliefwith movement, involuntary movements in sleep (viz., peri-
odic leg movements of sleep), and fragmented sleep [2, 3].Although the pathophysiology of RLS is unknown, dopami-
nergic neurotransmission and deficits in iron availabilitymodulate expressivity [1, 4–9]. Genome-wide association
studies have identified a polymorphism in an intronic regionof the BTBD9 gene on chromosome 6 that confers substan-
tial risk for RLS [2, 3, 10–12]. Here, we report that loss of theDrosophila homologCG1826 (dBTBD9) appreciably disrupts
sleep with concomitant increases in waking and motoractivity. We further show that BTBD9 regulates brain dopa-
mine levels in flies and controls iron homeostasis through
the iron regulatory protein-2 in human cell lines. To ourknowledge, this represents the first reverse genetic analysis
of a ‘‘novel’’ or heretofore poorly understood gene impli-cated in an exceedingly common and complex sleep
disorder and the development of an RLS animal model thatclosely recapitulates all disease phenotypes.
Results and Discussion
A number of genetic loci confer risk for Restless LegsSyndrome (RLS), including a SNP marker (rs3923809) in thegene BTBD9 that accounts for approximately 50% of the pop-ulation-attributable risk [11–16]. To confirm these findings andtest the hypothesis that BTBD9 regulates sleep fragmentation,we examined the behavioral and metabolic consequences ofdisrupting BTBD9 function both in Drosophila and in humancell lines. BTBD9 is expressed widely in the mammaliannervous system and in human embryonic kidney (HEK) celllines (Figures 1A and 1B) and is a predominantly cytosolicprotein (Figures 1C and 1H–1K). A survey throughout the ratcentral nervous system (CNS) reveals a widespread, yetspecific, staining pattern for BTBD9 in circuits that regulatemotor activity, memory, and emotion (Figures 1I–1K; see alsoFigure S1A available online). CNS expression is conserved inthe Drosophila homolog dBTBD9 (CG1826) as seen with RT-PCR analysis of dBTBD9 messenger RNA (mRNA) and wholehead western blots (Figures 1D and 1E). In the absence of
*Correspondence: [email protected]
reliable antibodies for dBTBD9 immunohistochemistry, wefollowed transgenically expressed FLAG-tagged full-lengthdBTBD9 and visualized Drosophila BTBD9 as distinct punctain neuronal cytoplasm (Figure 1L; Figure S1B). Taken together,these results suggest that BTBD9 is a cytosolic protein that iswidely expressed in the nervous system.We hypothesized that BTBD9 belongs to a family of BTB
domain-containing substrate adaptors for the cullin-3 (Cul-3)class of E3 ubiquitin ligases [17] because homology modelingof both human and fly BTBD9 on the crystal structure of theMATH-BTB protein SPOP revealed the presence of a Cul-3binding ‘‘3-box’’ motif [18] (Figure 1G). Consistent with thisidea, FLAG-tagged dBTBD9 shows extensive colocalizationwith Drosophila GFP-tagged Cul-3 in neuronal soma (Fig-ure 1L). Interestingly, overexpression of dBTBD9 withoutCul-3 coexpression resulted in prominent aggregates that dis-appeared in the presence of excess Cul-3 (Figures 1M and 1N;Figures S3C and S3D). These data support BTBD9’s functionas a Cul-3 adaptor and suggest that stringent stoichiometricratios between BTBD9 and Cul-3 might be maintained underphysiological conditions.To examine phenotypic consequences resulting from loss of
BTBD9, we isolated Drosophila mutants for dBTBD9 byexcising a P element transposon inserted 47 base pairsupstream of the dBTBD9 transcription start site (P{SUPor-P}CG1826KG07859) using standard genetic methods [19]. Twoexcision lines that carried large deletions in the dBTBD9 locuswithout affecting the adjacent genes Atg8a and CG15211were selected for analysis (Figure 2A). These viable alleles,dBTBD9wlst1 and dBTBD9wlst2 (wlst is for ‘‘wanderlust’’because these animals show increased locomotor activity,see below), did not produce any detectable dBTBD9 mRNA(Figure 1F) and were designated as null alleles. Both alleleshad life spans that were significantly less than the geneticallymatched precise excision alleles that were used as controlssuggesting fitness deficits that result from the loss of dBTBD9(Figure S2B).Next, we monitored the Drosophila rest-activity cycle in
dBTBD9 mutants using the Drosophila Activity Monitor(DAM) [20–22]. Although the total duration of sleep per 24 hrperiod did not differ appreciably between control and mutantgroups, the average bout lengths were decreased, the numberof sleep bouts increased, and the amount of wake after sleeponset (WASO) increased (Figure 2B). Together, these pheno-types are emblematic of fragmented night-time sleep indBTBD9 mutants, as demonstrated in hypnograms fromindividual flies (Figure 2D), which closely parallel the sleepcontinuity disruptions in RLS patients. These putative dBTBD9mutations are allelic because they did not complement oneanother—rather, no sleep phenotypes were observed inheterozygotes (Figure S2A). Sleep phenotypes were unequiv-ocally mapped to dBTBD9 because pan-neuronal add backof dBTBD9 (using the elavC155-GAL4 driver; [23, 24]) in a nullbackground rescued all sleep phenotypes (Figure 2B). Finally,RNAi-mediated knockdown of dBTBD9 mRNA in the nervoussystem strongly phenocopied dBTBD9 null alleles (Figure 2C).These results clearly document sleep fragmentation indBTBD9 mutants and indicate that neuronal dBTBD9 function

Figure 1. BTBD9 Is a Cytosolic Cullin-3 Adaptor
that Is Expressed Widely in the Mammalian and
Drosophila Nervous System
(A) Western blots of two independent mouse and
human brain protein extracts probed for BTBD9.
(B) Protein extracts from HEK cells showing
basal, overexpression, and small interfering
RNA mediated knockdown of BTBD9.
(C) HEK cell transfected with Myc-tagged BTBD9
and stained for BTBD9, Myc, and actin. Arrows
indicate BTBD9 and Myc colocalization.
(D) Western blots from Drosophila adult brain
protein extracts probed for dBTBD9. dBTBD9
[8] is a precise excision control, dBTBD9[OE] is
pan-neuronal overexpression of dBTBD9, and
dBTBD9[wlst1] and dBTBD9[wlst2] are null
alleles.
(E) PCR using cDNA and genomic DNA extracted
from the adult Drosophila brain as template with
intron-spanning primers for dBTBD9.
(F) RT-PCR frommRNA isolated from control and
excision alleles of dBTBD9. The ribosomal gene
rp49 is used as a control.
(G) Homology model of the N-terminal half of
BTBD9 based on the crystal structure of SPOP
showing the Cul-3 interacting 3-box.
(H–K) BTBD9 staining in human nucleus basalis
demonstrates cytoplasmic localization. Scale bar
represents 20 mm. BTBD9 staining (I) throughout
the gray matter of the rat spinal cord including
motor neurons (inset shows enlarged view), rat
hippocampus (J) (enlarged inset shows neurons
of theCA1region), andPurkinjecells (K)of thecere-
bellum (inset shows enlarged view). Scale bar
represents 200mmin (I)–(K) and20mm(I)–(K) insets.
(L) A single neuron in the adult fly CNS stained for
dBTBD9 (FLAG-tagged dBTBD9) and Cul-3
(GFP-tagged Cul-3) showing extensive colocali-
zation (arrows). Scale bar represents 2 mm.
(M) CNS of an adult fly expressing FLAG-tagged
dBTBD9 (enlarged inset shows dBTBD9 aggre-
gates).
(N) CNSof a fly expressing both dBTBD9 andCul-
3, (inset shows enlarged view). Scale bar repre-
sents 100 mm (see also Figure S1).
Sleep Fragmentation in a Drosophila Model of RLS1143
is required for normal sleep architecture and consolidationin Drosophila.
A key endophenotype of RLS is the presence of periodiclimb movements (PLMs) in patients both during wakefulnessand sleep [11, 25–27]. To evaluate motor behavior in dBTBD9mutants, we measured flight and negative geotaxis, but thesewere normal (Figure S2C) [28]. However, when mutant flieswere enclosed within a restricted space, they were hyperloco-motive (Figure 2E; Movie S1). This phenotype bears anuncanny resemblance to the ‘‘restlessness’’ observed in RLSpatients asked to remain immobile in the ‘‘suggested immo-bility test’’ (SIT) [29]. Next, we turned to the visuomotorBuridan’s assay [30] to measure locomotion with greateranalytical power. Such experiments revealed that mutant flieswalked at the same speed as controls but spent more timemoving with fewer pauses (Figures 2F and 2G), resulting inlonger uninterrupted bouts of walking. These experimentsdemonstrate that loss of dBTBD9, although not affectinggeneral locomotion, upregulates the duration of motor activity,recapitulating the motor restlessness in RLS patients that ulti-mately impairs sleep consolidation.
How does BTBD9 regulate sleep? Clinical informationon RLS suggests aberrant dopamine signaling and iron
homeostasis in RLS [3, 31–34]. In the mammalian brain,BTBD9 is strongly expressed in dopaminergic neurons of thesubstantia nigra and A11 neurons (Figure 3C). Although wecould not determine dBTBD9 expression in fly dopaminergicneurons, RNAi-mediated knockdown of dBTBD9 in largesubsets of dopaminergic neurons (using either the tyrosinehydroxylase (TH) or HL9-GAL4 driver; [35, 36]) reproduceddBTBD9 mutant sleep fragmentation phenotypes (Figures 3Dand 3E). This is consistent with expression of these twoGAL4 drivers in dopaminergic neurons that are presumed tocontrol locomotion [36]. Interestingly, we did not observesimilar fragmentation when dBTBD9 was knocked down ina more restricted subset of dopaminergic neurons using theHL5-GAL4 line, a domain that does not influence ethanol-induced hyperactivity [37] (Figures 3D and 3E). Therefore,either BTBD9 mediates sleep phenotypes by altering neuro-transmission in a small group of dopaminergic neuronstargeted by both TH and HL9-GAL4, or dBTBD9 knockdownin a substantial number of dopaminergic neurons is requiredto induce sleep fragmentation. Given the central role ofdopamine in sleep and arousal, we assessed dopamine levelsin mutant and control fly brains using high-performanceliquid chromatography (HPLC) measurements. We found

Figure 2. dBTBD9 Mutants Display Sleep Fragmentation and Increased Locomotor ‘‘Restlessness’’
(A) Schematic of the dBTBD9 (CG1826) genomic region and also showing the extent of deletions in dBTBD9 null mutants.
(B) Sleep phenotypes in two dBTBD9 null alleles (wlst1 and wlst2) compared with precise excision control and a pan-neuronal rescue with the wild-type
dBTBD9 transgene (wlst1-resc). Total sleep time in a 24 hr period, mean number of sleep bouts at night, mean bout length at night and mean WASO are
shown. More than 32 flies are tested for each genotype in this and other experiments.
(C) Sleep phenotypes following pan-neuronal knockdown of dBTBD9 using a dBTBD9-specific RNAi and an elavC155-GAL4 driver. Total sleep time (TST),
mean sleep bout number at night (Bout #), mean length of night-time sleep bout (Length), and WASO are shown.
(D) Hypnograms, plots of sleep-wake transitions, over a 24 hr period are shown for two representative control and mutant (wlst1) animals.
(E) The total distance walked by single flies within a restricted space (polycarbonate tube 5 mm in external diameter, 10 mm in length) in 1 min. Represen-
tative tracks are shown for one animal for each genotype.
(F and G) Control animals compared to dBTBD9[wlst1] animals in the Buridan’s assay. Speed of walking, total distance covered in 5 min, number of
walks between the two black bars, total amount of time spent walking (activity), the number of pauses, and the average length for a single uninterrupted
walk (bout distance) are plotted. Single representative tracks and a heat map of the cumulative occupancy in the arena from nine independent
trials per genotype are shown. (p values: * < 0.05; ** < 0.01). All graphs are plotted as a percentage of control with error bars representing SEM (see also
Figure S2 and Movie S1).
Current Biology Vol 22 No 121144

Figure 3. BTBD9 Regulates Dopaminergic Neurotransmission to Control Sleep Consolidation
(A) Sleep phenotypes in dBTBD9 mutants when fed 1 mM Pramipexole as compared to control animals.
(B) HPLC-based measurements of dopamine, homovanillic acid (HVA), and 5-hydroxyindoleacetic acid (5-HIAA) from control and dBTBD9mutant adult fly
heads (p values: ** < 0.01).
(C) Double labeled neurons expressing both tyrosine hydroxylase (DAB; brown) and BTBD9 (NiDAB; black) in the substantia nigra pars compacta (SNpc;
scale bar represents 200 mm) and A11 (scale bar represents 80 mm). Enlarged images of double labeled neurons in each nucleus are shown in the insets.
Scale bar represents 20 mm.
(D) Schematic showing the type and number of dopaminergic neurons that are targeted by TH, HL9, and HL5-GAL4 lines.
(E) Sleep phenotypes following RNAi-mediated dBTBD9 knockdown in dopaminergic neurons using the TH-GAL4, HL9-GAL4, and HL5-GAL4 drivers. Total
sleep time (TST), mean number of night-time sleep bouts (Bout #), mean night-time sleep bout length (Length), andWASO are shown. All graphs are plotted
as a percentage of control with error bars representing SEM (see also Figure S3).
Sleep Fragmentation in a Drosophila Model of RLS1145
a 50% reduction in total dopamine that further affirmedamechanistic link betweendBTBD9anddopamine (Figure 3B).A parsimonious explanation for reductions in dopamineincludes reductions in TH, the rate-limiting enzyme in
dopamine biosynthesis, but this was not observed in dBTBD9mutants (Figures S3A and S3B). However, these results dosuggest that a principle mechanism by which BTBD9 modifiesmotor activity and sleep architecture is by ensuring normal
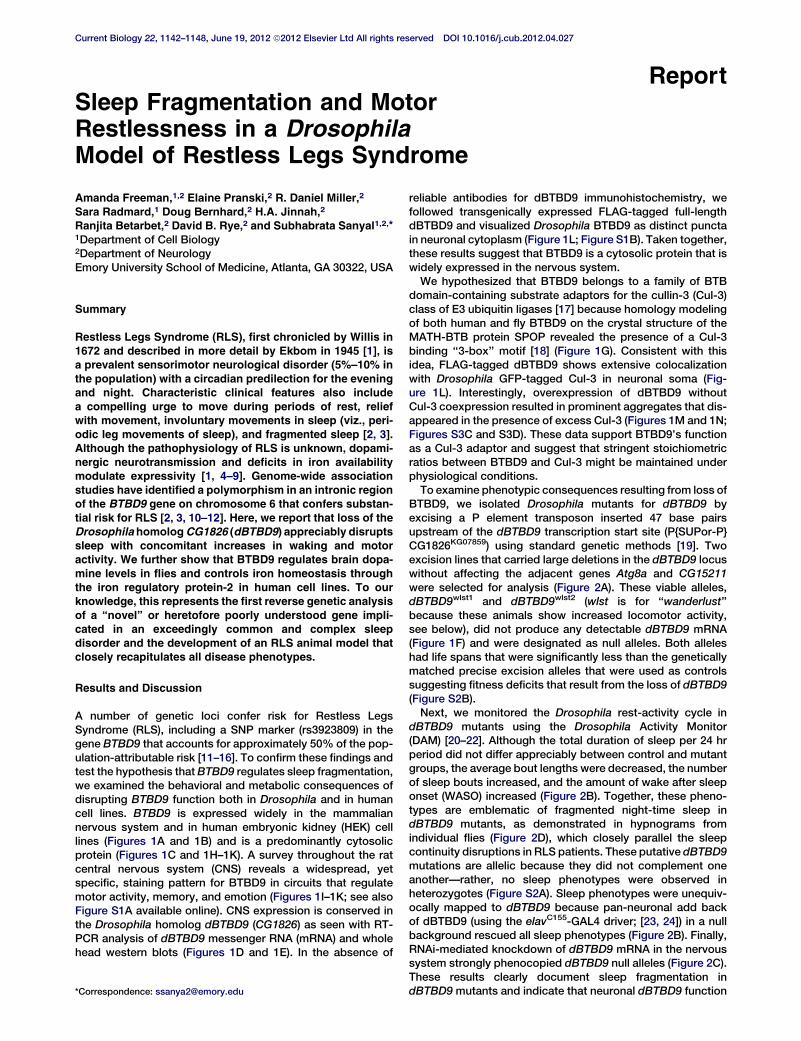
Figure 4. BTBD9 Regulates Iron Metabolism by Control-
ling Ferritin Expression via IRP2
(A) Western blots of HEK cell protein lysates probed for
ferritin light chain and actin (loading control). Ferritin
levels are compared between untreated (control), defer-
oxamine mesylate (DFO), or ferric ammonium citrate
(FAC)-treated cells and BTBD9 transfected cells that are
either untreated (BTBD9-OE) or treated with DFO or FAC.
(B) BTBD9 and ferritin immunocytochemistry on HEK
cells transfected with BTBD9 that are either untreated
or treated with DFO or FAC. Asterisks mark BTBD9
transfected cells. Scale bar represents 10 mm.
(C) Western blot of HEK cell lysates probed for IRP2.
DFO-treated and untreated cells are compared with
cells that are processed similarly but also overexpress
transgenic BTBD9.
(D)Model of BTBD9 function under normal and patholog-
ical conditions. BTBD9 acts together with cullin-3 to
regulate IRP2 levels in the cell. This in turn controls
ferritin expression and iron metabolism. Under normal
conditions, BTBD9 inhibits IRP2 and promotes ferritin
expression. BTBD9 also maintains dopamine biosyn-
thesis either directly or indirectly through iron, by
currently unknown mechanisms. Together, this ensures
normal motor drive and sleep consolidation. However,
in RLS, loss of BTBD9 leads to increased IRP2, and
reduced ferritin, thereby altering iron metabolism. It
also negatively impacts dopamine synthesis leading to
inappropriate motor activity and sleep fragmentation.
Current Biology Vol 22 No 121146
dopamine biosynthesis. To test this idea, we augmenteddopaminergic neurotransmission by feeding flies the nonergo-line dopamine agonist Pramipexole at a concentration of 1mMin normal fly food (Pramipexole preferentially targets dopa-mine D2-like receptors and is used clinically to treat RLS).Mutant flies treated with Pramipexole for 3 days showedmarked improvement in sleep consolidation such that night-time bout number, bout length, and WASO were all rescuedto control levels (Figure 3A). Note that the effect of Pramipex-ole increased incrementally with the duration of feeding (Fig-ure S3C shows the difference in rescue between days 3 and1 of Pramipexole feeding for controls and dBTBD9 mutants).
Low ferritin levels, reflecting impairments in the mobilizationof iron stores, have been associated with RLS and the risk-conferring SNP in BTBD9 [10, 11]. Whether these findingsimplicate an extra-genetic role for iron, or rather, that BTBD9influences iron metabolism is a critical question that has notbeen previously addressed [11, 38]. Because investigation ofiron metabolism in flies is in its infancy, we turned to HEK cells(which express BTBD9 endogenously) to determine the rela-tionship between BTBD9 and iron storage. OverexpressionofBTBD9 in HEK cells increased ferritin expression both underbasal conditions and in the presence of the iron chelatingsiderophore deferoxamine mesylate (DFO) (Figures 4A and4B). Mechanistically, the iron-responsive element-bindingprotein IREB2 or iron regulatory protein-2 (IRP2) inhibits ferritintranslation in response to changes in cellular iron, such thatiron abundance leads to IRP2 degradation and a resultant
increase in ferritin translation [39]. We there-fore tested whether BTBD9 controls levels ofIRP2. Western blots in Figure 4C show thatboth under basal and iron-chelation condi-tions, BTBD9 reduces IRP2 levels. This obser-vation is consistent with the effect of BTBD9on ferritin and proffers a pathway by which
BTBD9 modulates ferritin levels through regulation of IRP2(Figure 4D). A relationship between BTBD9 and IRP2 alsopoints to strongly conserved genetic and biochemical path-ways that are central to a number of physiological contextsand pathological conditions and might also help to identifydistinct causalities underlying RLS.In sum, this study validates the genome-wide association
study (GWAS) for RLS by establishing a powerful animal modelof RLS in Drosophila based on the genetic risk factorBTBD9. Our results support the idea that genetic regulationof dopamine and iron metabolism constitute the core patho-physiology of at least some forms of RLS (Figure 4D). Theextent to which this applies to RLS patients and indeed themolecular nature of the human at-risk SNP in BTBD9 remainto be clarified. Together with the recent demonstration thatcullin-3 modulates sleep architecture in flies [40], our resultsfurther confirm and highlight the relevance of this pathway insleep regulation. Finally, this study reiterates the utility ofsimple model systems such as Drosophila in unraveling thegenetics of sleep and sleep disorders and opens up the possi-bility for querying additional phenotypes that are difficult todecipher in human populations.
Experimental Procedures
Drosophila Husbandry, Stocks, Genetics, and Transgenesis
For stock information and genetics, see Supplemental Experimental Proce-
dures. To create UAS-CG1826::FLAG animals, we cloned the CG1826
complementary DNA (cDNA) (DGRC gold clone) into the pENTR/D-TOPO

Sleep Fragmentation in a Drosophila Model of RLS1147
entry vector (Invitrogen) followed by sequence verification and recombina-
tion into the pTWF destination vector. Transgenic animals were created by
standard embryo microinjection (Bestgene).
Drosophila Sleep Measurements
Sleep measurements were carried out as described previously [20, 21] (for
details see Supplemental Experimental Procedures). WASO was calculated
as the amount of time the fly was active following the first sleep period after
lights off (ZT12) until lights on (ZT0). Statistical significance was determined
with an unpaired Student’s t test and ANOVA.
Drosophila Locomotor Assays
Restricted Space
Three- to 4-day-old flies were individually placed into the polycarbonate
tubes used for sleep measurements (TriKinetics) and confined to a space
10mm in lengthwith cotton plugs. After a 30min acclimation period, a series
of five 1 min videos were recorded with an HD webcam (Logitech.com).
Movements were analyzed using the SpotTracker plugin for ImageJ, and
total distance traveled for each fly was averaged across the five trials.
Buridan’s Assay
Three-day-old flies were collected and their wings cut close to the thorax.
These flies were then allowed to recover for an additional 3 days. Flies
were individually placed on a circular platform 10 cm in diameter and sur-
rounded by a moat of water 2 cm in width. Flies normally walked back
and forth between two diametrically opposite vertical black bars within
a brightly illuminated cylinder. A camera mounted centrally above the plat-
form recorded their movement for a period of 5 min. These recordings were
then analyzed using custom designed software from Bjorn Brembs.
HPLC Measurements and Biochemistry
For HPLC measurements, fly heads were dissected from live animals
under anesthesia, immediately frozen, and homogenized in chilled 0.1 M
perchloric acid. After centrifugation, the supernatant was eluted through
a C18 column (ESA) with the mobile phase containing 75 mM NaH2PO4,
1.5 mM Octanesulfonic acid and 5% Acetonitrile (pH 3.0). Western blotting
was carried out following standard procedures (see Supplemental Experi-
mental Procedures). Primary antibody dilutions were as follows: mouse
anti-BTBD9 full-length (Abnova B01P, 1:1,000), mouse anti-actin (Millipore,
1:50,000), rabbit anti-ferritin light chain (Abcam, 1:2,000), mouse anti-IRP2
(4G11) (Santa Cruz Biotechnology, 1:1,000), and rabbit anti-TH (Wendi
Neckameyer, 1:2,000).
Anatomy, Immunohistochemistry, and Microscopy
Mammalian and Drosophila Neuroanatomy
Anatomical experiments were carried out on fixed tissue followed by either
brightfield or laser scanning confocal microscopy (see Supplemental Exper-
imental Procedures for details). Antibody dilutions were as follows: mouse
anti-BTBD9 1:1,000 (Abnova), mouse anti-Elav 1:25 (DSHB), Phalloidin 543
(Molecular Probes 1:50), rabbit anti-GFP 1:400 (Invitrogen) and rabbit anti-
TH (1:1000) (Wendi Neckameyer). Secondary antibody dilutions are as
follows: anti-rabbit IgG-Alexa Fluor 488 and 563 (MolecularProbes 1:500),
and anti-mouse IgG-Alexa Fluor 488 and 568 (MolecularProbes 1:500).
Statistical Analysis
Unpaired Student’s t test and ANOVA were used for statistical analysis of
sleep and locomotion data.
Supplemental Information
Supplemental Information includes three figures, Supplemental Experi-
mental Procedures, and one movie and can be found with this article online
at doi:10.1016/j.cub.2012.04.027.
Acknowledgments
We thank members of the Betarbet, Jinnah, Rye, and Sanyal laboratory for
technical assistance, comments, and criticisms; Diana Woodall and Sonya
Patel for initial characterization of fly phenotypes; Paul Shaw for sharing his
sleep analysis software; Bjorn Brembs for the Buridan analysis software;
and Wendi Neckameyer for sharing the anti-TH antibody. This work is sup-
ported by a FIRST fellowship and a Neurology National Institutes of Health
T32 fellowship to A.F. and Emory Neuroscience Initiative, Sleep Research
Society, and Restless Legs Foundation grants to S.S.
Received: March 29, 2012
Revised: April 16, 2012
Accepted: April 16, 2012
Published online: May 31, 2012
References
1. Ekbom, K.A. (1945). Restless legs. Acta Med. Scand. 158, 1–123.
2. Trotti, L.M., and Rye, D.B. (2011). Restless legs syndrome. Handb. Clin.
Neurol. 100, 661–673.
3. Trenkwalder, C., and Paulus, W. (2010). Restless legs syndrome: path-
ophysiology, clinical presentation and management. Nat Rev Neurol 6,
337–346.
4. Allen, R.P., and Earley, C.J. (2007). The role of iron in restless legs
syndrome. Mov. Disord. 22 (Suppl 18 ), S440–S448.
5. Aul, E.A., Davis, B.J., and Rodnitzky, R.L. (1998). The importance of
formal serum iron studies in the assessment of restless legs syndrome.
Neurology 51, 912.
6. Sun, E.R., Chen, C.A., Ho, G., Earley, C.J., and Allen, R.P. (1998). Iron
and the restless legs syndrome. Sleep 21, 371–377.
7. Montplaisir, J., Lorrain, D., and Godbout, R. (1991). Restless legs
syndrome and periodic leg movements in sleep: the primary role of
dopaminergic mechanism. Eur. Neurol. 31, 41–43.
8. Hening, W.A. (1999). Restless Legs Syndrome. Curr. Treat. Options
Neurol. 1, 309–319.
9. Turjanski, N., Lees, A.J., and Brooks, D.J. (1999). Striatal dopaminergic
function in restless legs syndrome: 18F-dopa and 11C-raclopride PET
studies. Neurology 52, 932–937.
10. Allen, R. (2004). Dopamine and iron in the pathophysiology of restless
legs syndrome (RLS). Sleep Med. 5, 385–391.
11. Stefansson, H., Rye, D.B., Hicks, A., Petursson, H., Ingason, A.,
Thorgeirsson, T.E., Palsson, S., Sigmundsson, T., Sigurdsson, A.P.,
Eiriksdottir, I., et al. (2007). A genetic risk factor for periodic limb move-
ments in sleep. N. Engl. J. Med. 357, 639–647.
12. Winkelmann, J., Schormair, B., Lichtner, P., Ripke, S., Xiong, L.,
Jalilzadeh, S., Fulda, S., Putz, B., Eckstein, G., Hauk, S., et al. (2007).
Genome-wide association study of restless legs syndrome identifies
common variants in three genomic regions. Nat. Genet. 39, 1000–1006.
13. Kemlink, D., Polo, O., Frauscher, B., Gschliesser, V., Hogl, B., Poewe,
W., Vodicka, P., Vavrova, J., Sonka, K., Nevsimalova, S., et al. (2009).
Replication of restless legs syndrome loci in three European popula-
tions. J. Med. Genet. 46, 315–318.
14. Yang, Q., Li, L., Chen, Q., Foldvary-Schaefer, N., Ondo,W.G., andWang,
Q.K. (2011). Association studies of variants in MEIS1, BTBD9, and
MAP2K5/SKOR1 with restless legs syndrome in a US population.
Sleep Med. 12, 800–804.
15. Schormair, B., Plag, J., Kaffe, M., Gross, N., Czamara, D., Samtleben,
W., Lichtner, P., Strohle, A., Stefanidis, I., Vainas, A., et al. (2011).
MEIS1 and BTBD9: genetic association with restless leg syndrome in
end stage renal disease. J. Med. Genet. 48, 462–466.
16. Perez-Dıaz, H., Iranzo, A., Rye, D.B., and Santamarıa, J. (2011). Restless
abdomen: a phenotypic variant of restless legs syndrome. Neurology
77, 1283–1286.
17. Pintard, L., Willems, A., and Peter, M. (2004). Cullin-based ubiquitin
ligases: Cul3-BTB complexes join the family. EMBO J. 23, 1681–1687.
18. Zhuang, M., Calabrese, M.F., Liu, J., Waddell, M.B., Nourse, A.,
Hammel, M., Miller, D.J., Walden, H., Duda, D.M., Seyedin, S.N., et al.
(2009). Structures of SPOP-substrate complexes: insights into molec-
ular architectures of BTB-Cul3 ubiquitin ligases. Mol. Cell 36, 39–50.
19. Rubin, G.M., Kidwell, M.G., and Bingham, P.M. (1982). The molecular
basis of P-M hybrid dysgenesis: the nature of induced mutations. Cell
29, 987–994.
20. Shaw, P.J., Cirelli, C., Greenspan, R.J., and Tononi, G. (2000). Correlates
of sleep and waking in Drosophila melanogaster. Science 287, 1834–
1837.
21. Hendricks, J.C., Finn, S.M., Panckeri, K.A., Chavkin, J., Williams, J.A.,
Sehgal, A., and Pack, A.I. (2000). Rest in Drosophila is a sleep-like state.
Neuron 25, 129–138.
22. Agosto, J., Choi, J.C., Parisky, K.M., Stilwell, G., Rosbash, M., and
Griffith, L.C. (2008). Modulation of GABAA receptor desensitization
uncouples sleep onset and maintenance in Drosophila. Nat. Neurosci.
11, 354–359.

Current Biology Vol 22 No 121148
23. Rebay, I., and Rubin, G.M. (1995). Yan functions as a general inhibitor of
differentiation and is negatively regulated by activation of the Ras1/
MAPK pathway. Cell 81, 857–866.
24. Brand, A.H., and Perrimon, N. (1993). Targeted gene expression as
a means of altering cell fates and generating dominant phenotypes.
Development 118, 401–415.
25. Trenkwalder, C., Walters, A.S., and Hening, W. (1996). Periodic limb
movements and restless legs syndrome. Neurol. Clin. 14, 629–650.
26. Vetrugno, R., Provini, F., and Montagna, P. (2006). Restless legs
syndrome and periodic limb movements. Rev. Neurol. Dis. 3, 61–70.
27. Coleman, R.M., Pollak, C.P., andWeitzman, E.D. (1980). Periodic move-
ments in sleep (nocturnal myoclonus): relation to sleep disorders. Ann.
Neurol. 8, 416–421.
28. Benzer, S. (1967). Behavioral mutants ofDrosophila isolated by counter-
current distribution. Proc. Natl. Acad. Sci. USA 58, 1112–1119.
29. Montplaisir, J., Boucher, S., Nicolas, A., Lesperance, P., Gosselin, A.,
Rompre, P., and Lavigne, G. (1998). Immobilization tests and periodic
leg movements in sleep for the diagnosis of restless leg syndrome.
Mov. Disord. 13, 324–329.
30. Gotz, K.G. (1980). Visual guidance in Drosophila. Basic Life Sci. 16,
391–407.
31. Clemens, S., Rye, D., and Hochman, S. (2006). Restless legs syndrome:
revisiting the dopamine hypothesis from the spinal cord perspective.
Neurology 67, 125–130.
32. Varga, L.I., Ako-Agugua, N., Colasante, J., Hertweck, L., Houser, T.,
Smith, J., Watty, A.A., Nagar, S., and Raffa, R.B. (2009). Critical review
of ropinirole and pramipexole - putative dopamine D(3)-receptor
selective agonists - for the treatment of RLS. J. Clin. Pharm. Ther. 34,
493–505.
33. Earley, C.J., Kuwabara, H., Wong, D.F., Gamaldo, C., Salas, R., Brasic,
J., Ravert, H.T., Dannals, R.F., and Allen, R.P. (2011). The dopamine
transporter is decreased in the striatum of subjects with restless legs
syndrome. Sleep 34, 341–347.
34. Montplaisir, J., Godbout, R., Poirier, G., and Bedard, M.A. (1986).
Restless legs syndrome and periodic movements in sleep: physiopa-
thology and treatment with L-dopa. Clin. Neuropharmacol. 9, 456–463.
35. Friggi-Grelin, F., Coulom, H., Meller, M., Gomez, D., Hirsh, J., and
Birman, S. (2003). Targeted gene expression in Drosophila dopami-
nergic cells using regulatory sequences from tyrosine hydroxylase.
J. Neurobiol. 54, 618–627.
36. Claridge-Chang, A., Roorda, R.D., Vrontou, E., Sjulson, L., Li, H., Hirsh,
J., and Miesenbock, G. (2009). Writing memories with light-addressable
reinforcement circuitry. Cell 139, 405–415.
37. Kong, E.C., Woo, K., Li, H., Lebestky, T., Mayer, N., Sniffen, M.R.,
Heberlein, U., Bainton, R.J., Hirsh, J., and Wolf, F.W. (2010). A pair of
dopamine neurons target the D1-like dopamine receptor DopR in the
central complex to promote ethanol-stimulated locomotion in
Drosophila. PLoS ONE 5, e9954.
38. Earley, C.J., Connor, J.R., Beard, J.L., Malecki, E.A., Epstein, D.K., and
Allen, R.P. (2000). Abnormalities in CSF concentrations of ferritin and
transferrin in restless legs syndrome. Neurology 54, 1698–1700.
39. Samaniego, F., Chin, J., Iwai, K., Rouault, T.A., and Klausner, R.D.
(1994). Molecular characterization of a second iron-responsive element
binding protein, iron regulatory protein 2. Structure, function, and post-
translational regulation. J. Biol. Chem. 269, 30904–30910.
40. Stavropoulos, N., and Young, M.W. (2011). insomniac and Cullin-3
regulate sleep and wakefulness in Drosophila. Neuron 72, 964–976.