sleep and sleep-wake rhythmicity: impact on (shift) work dr. gerard a. kerkhof, prof. em. university...
TRANSCRIPT

Sleep and Sleep-Wake rhythmicity: impact on (shift) work
dr. Gerard A. Kerkhof, prof. em.University of Amsterdam & MCH Sleep Center, The Hague
Seminar ‘Safety in Seafisheries’ – Oct 3, 2013
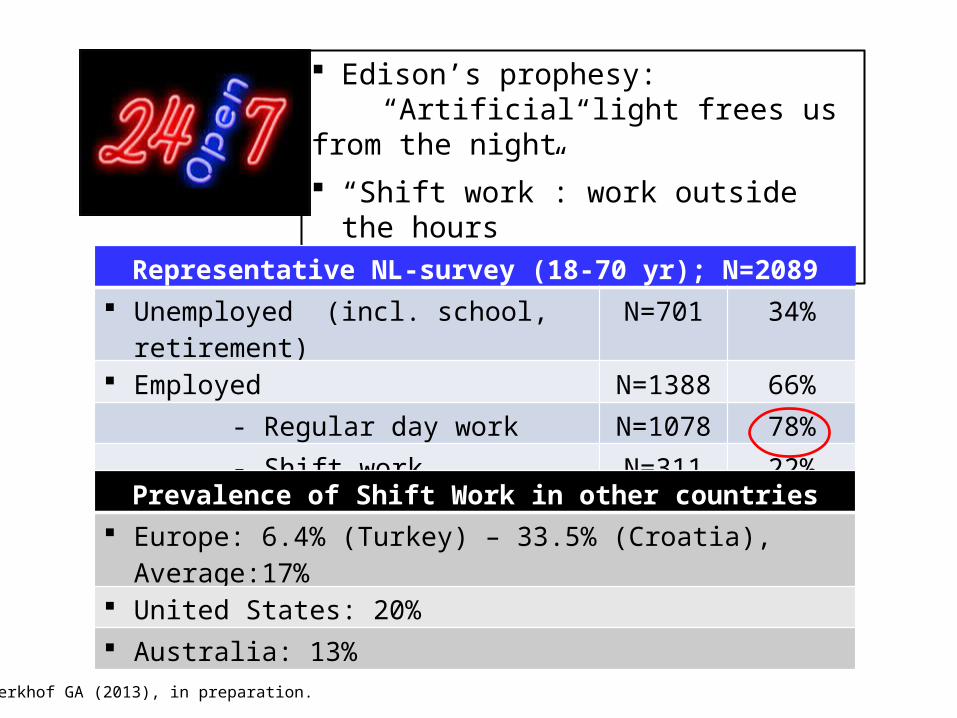
Edison’s prophesy: “Artificial light frees us from the night”
“Shift work”: work outside the hours 7 a.m. - 7 p.m.
Representative NL-survey (18-70 yr); N=2089
Unemployed (incl. school, retirement) N=701 34%
Employed N=1388 66%
- Regular day work N=1078 78%
- Shift work N=311 22%
Prevalence of Shift Work in other countries
Europe: 6.4% (Turkey) – 33.5% (Croatia), Average:17%
United States: 20%
Australia: 13%
Kerkhof GA (2013), in preparation.

A day (and night) in the life of 18-24 yr adolescents:
% mobile text traffic over 24 hours
Yesterday newspaper (Volkskrant):Day and night young people are busywith their mobile: ‘Socialbesitas’?

Carpe diem has become carpe noctem for me

(Kerkhof GA, in preparation, 2013)
Unemployed & Retired
Shift work
Other regular work hours
Regular day work
0 5 10 15 20 25 30 35 40 45
% Sleep disorder
Shift work increases the risk of a sleep disorder
Risks: Accident
s Illness

‘Fatigue’ is often synonymous with ‘Sleepiness’
(“Are you also so tired?”)

Crash Airbus, Tripoli May 12, 2010,
06:01a.m.
Accumulation of: Miscommunication (captain & co-pilot & Tower) Unexpected poor visibility (fog patches) No Instrument Landing System No evaluation of landing errors 2 wk earlier Fatigue (2nd night shift, early morning)
Conclusion: ‘Pilot error’ (i.e. Fatigue)
Risk analysis:‘Swiss cheese model’
(holes = risks)
Accident
Fail-Safe

Bhopal, India,12.03.1984, 1 a.m.
Chernobyl, Russia,04.26.1986, 1.30 a.m.
Exxon Valdez, Alaska03.24.1989, 1 a.m.
0 3 6 9 12
15
18
21
24
-25
-15
-5
5
15
Time of Day (h)
Avg
sco
re
Disasters during the night
Three Mile Island, U.S.A.,03.28.1979, 4 a.m.

(Mustard et al, Occup Environ Med, 2013)
1 2 3 4 5 6 7 8 9
10
11
12
13
14
15
16
17
18
19
20
21
22
23
24
0
1
2
3
4
5
6
7
Time of Day (h)
Rate of work injury per 200,000 h worked
(Ontario, 2004 – 2008; N=707933)

Impaired motor coordination and accuracy
Other: Growth suppression Risk of Alzheimer’s disease
Health risks of shiftwork
Insuline resistance Obesity Diabetes type 2
Gastro-intestinal disease
“Metabolic syndrome”
Sleep disorder Fatigue (chronic) Cognitive disfunctioning: errors in perception, concentration, memory, decision making, etc. Emotional disregulation Irritability Anxiety
Disrupted immune system
Impaired motor coordination and precision
In addition: Breast cancer Growth suppression Alzheimer’s disease
Cardiovascular disease Increased cholesterol level Hypertension

BiologicalClock
Sleep
Shift work
Family

Circadian pacemaker
3rd ventrikel
Chiasma
Cross section of brainNerve impulses
Network of Clock genes
Suprachiasmatic nuclei

12 24 h00
The Biological Clock is tuned
to the day/night cycle
Michel Siffre, 1962 Sleep periods
Freerunning
Synchronized

10 12 14 16 18 20 22 24 2 4 6 8 10 u0
20
40
60
80
100
Metabolism Body temperature AlertnessPerformance Lymphocytes Growth hormoneMelatonin Cortisol
%
The Biological Clock conductsan orchestra of 24-h rhythms
Sleep

May 25th 2009: start Plymouth, UK Newport, USAappr. 3000 miles, 5 time zones
One sailor, one boat, one ocean
UK
USA

Plot of wrist activity (black) superimposed upon plot of daylight (yellow), from the start in Plymouth UK until the finish in Newport USA. Time axis: clock time in NL.
Start
Finish
Mean sleep duration/24h: 6.5 h, 2 hours less than baseline
46% sleep/8h dark (baseline: 73%)
Sleep bouts: mean 12’
Periodogram analysis: 24h amplitude equivalent peaks: 13h, 17h
Activity recording of solo sailor

08 08 0816 24 2416
1. Circadian process
2. Sleep process
Time of Day (h)
Sleep Sleep
(GA Kerkhof, 2013)
Two processes for Fatigue modeling
3. Sum

08 08 0816 24 2416
Circadian process
Sleep process
Time of Day (h)
Wake Sleep
(GA Kerkhof, 2013)
One night sleep deprivation increases the sleep process
Sum

(Kerkhof GA et al. 2003)
Long distance coach driving
Activity monitor
Sleep cabin
NL > Sp Spain Sp > NL Home0
2
4
6
8
Mean sleep duration (N=30)
h
15 21 03 09 15 21 03 09 15 21 03 090
0.25
0.5
0.75
1
Subj. sleepiness (N=30))
Time of Day (h)
Avg
. Sco
re
Ride Ride

(Folkard & Tucker, 2003)
Risk of accidents increases over successive nights
1 2 3 40.9
1
1.1
1.2
1.3
1.4
NachtDag
Successive days
Re
lativ
e r
isk
NightDay

BiologicalClock
Sleep
Shift work
Family

18 22 02 06 10 14 18
Time of Day (h)
↔ ↔
sleepworkNight shift
Early shift
Late shift
(Knauth & Rutenfranz, 1981)
Sleep duration for different shifts

Deep sleep
Hypnogram: sleep stages
REM-sleep
Electroencephalogram

Deep sleep
Growth hormone
Prolactin
Sleep: period of recovery and consolidation
REM-sleep

18 22 02 06 10 14 18
Wake1/REM234
Wake1/REM234
Time of Day (h)
Day sleep differs from Night sleep

Successive days of sleep restriction
4h
6h
8h
(Van Dongen et al, 2003)
TIB:
Daily averages of number of PVT lapses over two successive weeks of sleep restriction (N = 36)
Psychomotor Vigilance Test

1 4 7 10 13 16 19 22 25 28 31 34 37 40 43 46 49 52 55 58 61 64 67 70
1 4 7 10 13 16 19 22 25 28 31 34 37 40 43 46 49 52 55 58 61 64 67 70
1 4 7 10 13 16 19 22 25 28 31 34 37 40 43 46 49 52 55 58 61 64 67 70
1 4 7 10 13 16 19 22 25 28 31 34 37 40 43 46 49 52 55 58 61 64 67 70
0
200 0
400 0
600 0
800 0
RESPONSE NUMBER
60 Hours Awake
36 Hours Awake
12 Hours Awake
84 Hours Awake
0
200 0
400 0
600 0
800 0
0
200 0
400 0
600 0
800 0
0
200 0
400 0
600 0
800 0
10 min Psychomotor Vigilance Test (PVT)
Doran SM, Van Dongen HPA, Dinges DF (2001). Sustained attention performance during sleep deprivation: Evidence of state instability. Archives of Italian Biology 139: 253-267.
With increasing sleep deficit performance becomes
more unstable and unpredictable

Meetmomenten Measurements
(Kerkhof GA & Hofman P, 2010)
0
2
4
6
8
10Lapses of attention (N=6)
#
0
2
4
6
8
10Day (M = 1.81)
#
1 3 5 7 9 11 13 15 17 19 21 23 25 27 290
2
4
6
8
10 Night (M = 2.03)
#
Variability of lapses at night

0 4 8 12 16 20 24 28 32 36 40
hours awake
1
2
3
4
5
Sta
nfo
rdS
lee
pin
ess
Sca
le
08 12 16 20 00 04 08 12 16 20 00time of day
0 4 8 12 16 20 24 28 32 36 40
hours awake
0
5
10
15
20
25
PV
Tla
pse
s
08 12 16 20 00 04 08 12 16 20 00time of day
Lapses of attention
n=8
n=7
Van Dongen HPA, Maislin G, Dinges DF (2004). Dealing with inter-individual differences in the temporal dynamics of fatigue and performance: Importance and techniques. Aviation, Space, and Environmental Medicine 75(3, Section II): A147-A154.
Individual differences in vulnerability to sleep loss Subjective sleepiness is unreliable indicator of impact
Subjective sleepiness

Empirical Best Linear Unbiased Predictors
-0.8
-0.6
-0.4
-0.2
0.0
0.2
0.4
0.6
0.8
0 1 2 3 4 5 6 7 8 9 10 11
subjects
rela
tiv
e p
erfo
rm
an
ce
Individual Differences in Vulnerability to Sleep Loss
in Active-Duty F-117A (Night Hawk) Fighter Pilotsleft 720 degrees turn
roll performance
0.0
0.2
0.4
0.6
0.8
1.0
1.2
1.4
1.6
1.8
-6 -1 4 9 14 19 24
time of day
N=10
fligh
t pat
h de
viati
on
left 720 degrees turnroll angle performance
pilots
rela
tive
perf
orm
ance
(Self-)selection mechanisms do not eliminate individual differences
in vulnerability to sleep loss
38-hour extended mission time
Van Dongen HPA, Caldwell JA Jr, Caldwell JL. Investigating systematicindividual differences in sleep-deprived performance on a high-fidelityflight simulator. Behavior Research Methods, 2006; 38(2): 333–343.

Recap 1. Fatigue/Sleepiness is a major risk factor and sum of a circadian rhythm with its maximum at night, and a sleep process that increases as a function of time awake
2. The vulnerability to sleep loss is an individual trait
3. Subjective sleepiness is an unreliable predictor of the risks of sleep loss
4. Sleep loss induces impaired and unpredictable performance
5. Shift work increases health risks
6. Consider preventive measures