sky brightness levels before and after the creation of the first international dark sky reserve,...
TRANSCRIPT
Contents lists available at ScienceDirect
Journal of Quantitative Spectroscopy &Radiative Transfer
Journal of Quantitative Spectroscopy & Radiative Transfer 139 (2014) 52–63
http://d0022-40
n CorrE-m
johanne
journal homepage: www.elsevier.com/locate/jqsrt
Sky brightness levels before and after the creation of the firstInternational Dark Sky Reserve, Mont-Mégantic Observatory,Québec, Canada
Martin Aubé n, Johanne RobyCégep de Sherbrooke, 475, rue du Cégep, Sherbrooke, QC, Canada J1E 4K1
a r t i c l e i n f o
Article history:Received 31 August 2013Received in revised form23 January 2014Accepted 28 January 2014Available online 4 February 2014
Keywords:Light pollutionSky brightnessModelingAerosol optical depthArtificial light at nightSecond order of scatteringDark sky reserveMont-Mégantic
x.doi.org/10.1016/j.jqsrt.2014.01.02173 & 2014 Elsevier Ltd. All rights reserved.
esponding author. Tel.: þ1 819 564 6350x4ail addresses: [email protected]@cegepsherbrooke.qc.ca (J. Roby).
a b s t r a c t
In 2007, the area around the Mont-Mégantic Observatory (MMO) was officially certified bythe International Dark-Sky Association and the Royal Astronomy Association of Canada as thefirst International Dark Sky Reserve (IDSR). In order to be able to investigate the impact ofArtificial Light at Night on night sky brightness before and after the establishment of theIDSR, we used a heterogeneous artificial sky brightness model including an implicitcalculation of 2nd order scattering (ILLUMINA) developed by Martin Aubé's group. Thismodel generates three kinds of outputs: the sky radiance at the given site, observing angleand wavelength and the corresponding contribution and sensitivity maps. The maps allowfor the identification of the origin of the sky radiance according to each part of thesurrounding territory. For summer clear sky conditions, the results show that replacing lightfixtures within a 25 km radius around the MMO with cut-off High Pressure Sodium devicesand reducing the total installed radiant power to �40% of its initial level are very efficientways of reducing artificial sky brightness. The artificial sky brightness reduction at zenithobserved after the establishment of the IDSR was �50% in the 546 nm mercury spectralline, while the reduction obtained in the 569 nm sodium line was �30%. A large part of thatreduction can be associated to the reduction in radiant power. The contribution andsensitivity maps highlight critical zones where any changes in the lighting infrastructurehave the most important impact on sky brightness at the MMO. Contribution and sensitivitymaps have been used to analyze the detailed origin of sky brightness reduction. The resultsof this study are intended to support authorities in the management of their lightinginfrastructure with the goal of reducing sky brightness. The results have been shared withMMO officials and are being used as a tool to improve sky quality at the observatory.
& 2014 Elsevier Ltd. All rights reserved.
1. Introduction
Dark sky areas are now increasingly rare in the worldand this is due to the constant growth of artificial lightat night (ALAN). This phenomenon is largely the result of
146..qc.ca (M. Aubé),
human activities and its primary sources are street lamps,advertising panels and lighted buildings. Astronomerswere the first to point out that dark skies are disappearingwhen they realized that sky observation was becomingmore difficult because of the bright halos caused by ALAN.It is only in the past decade that the multiple negativeimpacts of ALAN on fauna, flora and human health havebeen documented more intensively in the literature [1–3].
Artificial light produced by street lights has been identi-fied as one of the major sources of night sky brightness.
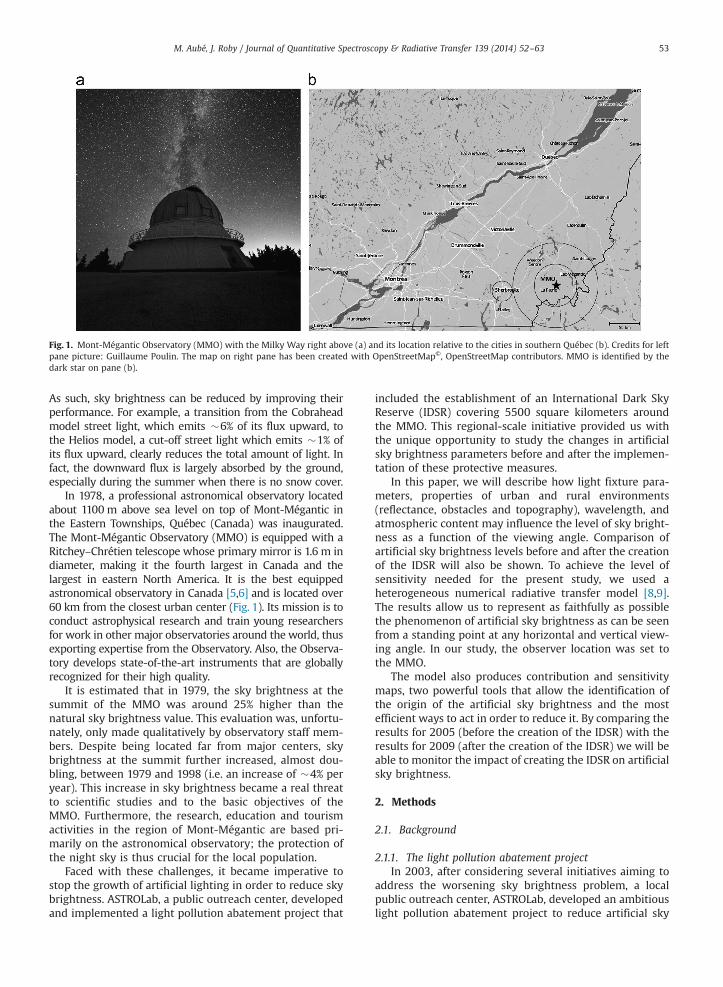
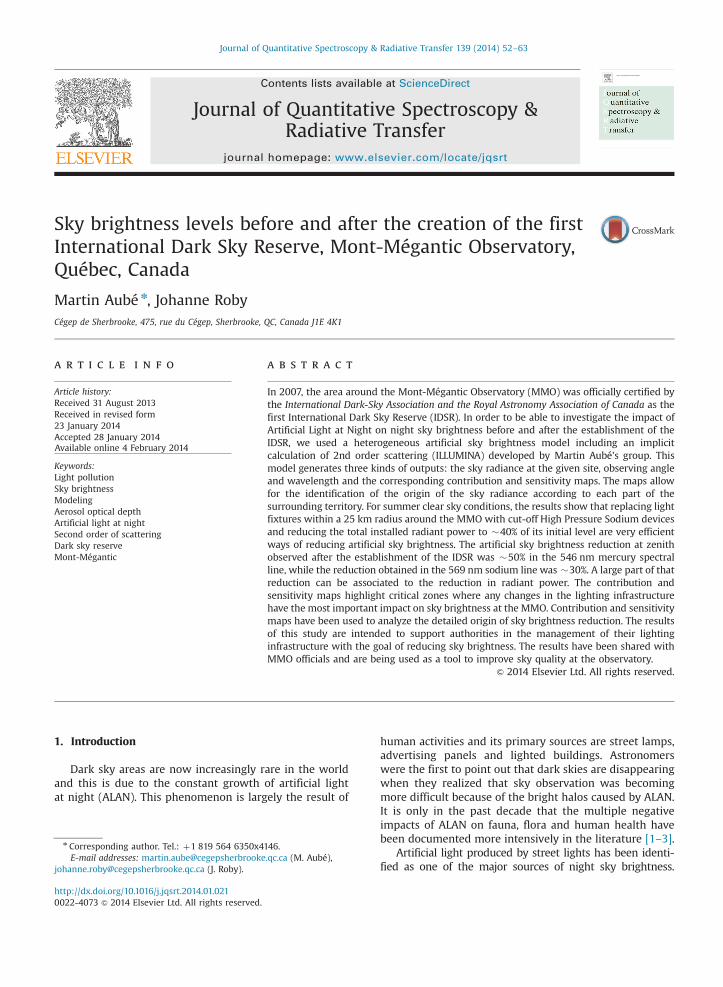
Fig. 1. Mont-Mégantic Observatory (MMO) with the Milky Way right above (a) and its location relative to the cities in southern Québec (b). Credits for leftpane picture: Guillaume Poulin. The map on right pane has been created with OpenStreetMap©, OpenStreetMap contributors. MMO is identified by thedark star on pane (b).
M. Aubé, J. Roby / Journal of Quantitative Spectroscopy & Radiative Transfer 139 (2014) 52–63 53
As such, sky brightness can be reduced by improving theirperformance. For example, a transition from the Cobraheadmodel street light, which emits �6% of its flux upward, tothe Helios model, a cut-off street light which emits �1% ofits flux upward, clearly reduces the total amount of light. Infact, the downward flux is largely absorbed by the ground,especially during the summer when there is no snow cover.
In 1978, a professional astronomical observatory locatedabout 1100 m above sea level on top of Mont-Mégantic inthe Eastern Townships, Québec (Canada) was inaugurated.The Mont-Mégantic Observatory (MMO) is equipped with aRitchey–Chrétien telescope whose primary mirror is 1.6 m indiameter, making it the fourth largest in Canada and thelargest in eastern North America. It is the best equippedastronomical observatory in Canada [5,6] and is located over60 km from the closest urban center (Fig. 1). Its mission is toconduct astrophysical research and train young researchersfor work in other major observatories around the world, thusexporting expertise from the Observatory. Also, the Observa-tory develops state-of-the-art instruments that are globallyrecognized for their high quality.
It is estimated that in 1979, the sky brightness at thesummit of the MMO was around 25% higher than thenatural sky brightness value. This evaluation was, unfortu-nately, only made qualitatively by observatory staff mem-bers. Despite being located far from major centers, skybrightness at the summit further increased, almost dou-bling, between 1979 and 1998 (i.e. an increase of �4% peryear). This increase in sky brightness became a real threatto scientific studies and to the basic objectives of theMMO. Furthermore, the research, education and tourismactivities in the region of Mont-Mégantic are based pri-marily on the astronomical observatory; the protection ofthe night sky is thus crucial for the local population.
Faced with these challenges, it became imperative tostop the growth of artificial lighting in order to reduce skybrightness. ASTROLab, a public outreach center, developedand implemented a light pollution abatement project that
included the establishment of an International Dark SkyReserve (IDSR) covering 5500 square kilometers aroundthe MMO. This regional-scale initiative provided us withthe unique opportunity to study the changes in artificialsky brightness parameters before and after the implemen-tation of these protective measures.
In this paper, we will describe how light fixture para-meters, properties of urban and rural environments(reflectance, obstacles and topography), wavelength, andatmospheric content may influence the level of sky bright-ness as a function of the viewing angle. Comparison ofartificial sky brightness levels before and after the creationof the IDSR will also be shown. To achieve the level ofsensitivity needed for the present study, we used aheterogeneous numerical radiative transfer model [8,9].The results allow us to represent as faithfully as possiblethe phenomenon of artificial sky brightness as can be seenfrom a standing point at any horizontal and vertical view-ing angle. In our study, the observer location was set tothe MMO.
The model also produces contribution and sensitivitymaps, two powerful tools that allow the identification ofthe origin of the artificial sky brightness and the mostefficient ways to act in order to reduce it. By comparing theresults for 2005 (before the creation of the IDSR) with theresults for 2009 (after the creation of the IDSR) we will beable to monitor the impact of creating the IDSR on artificialsky brightness.
2. Methods
2.1. Background
2.1.1. The light pollution abatement projectIn 2003, after considering several initiatives aiming to
address the worsening sky brightness problem, a localpublic outreach center, ASTROLab, developed an ambitiouslight pollution abatement project to reduce artificial sky
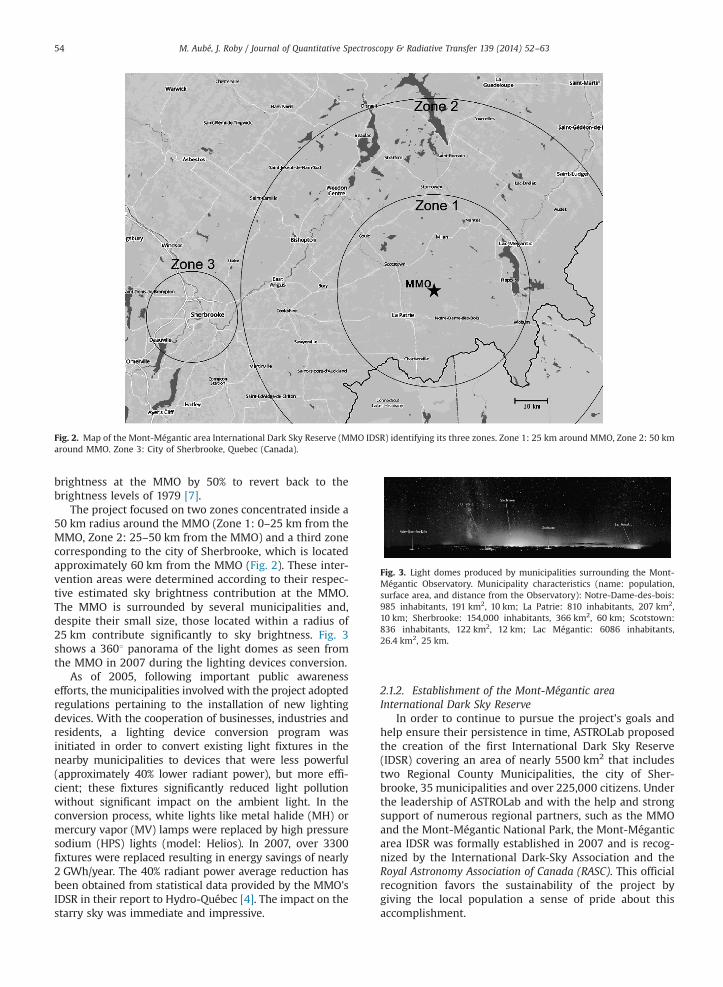
Fig. 2. Map of the Mont-Mégantic area International Dark Sky Reserve (MMO IDSR) identifying its three zones. Zone 1: 25 km around MMO, Zone 2: 50 kmaround MMO. Zone 3: City of Sherbrooke, Quebec (Canada).
Fig. 3. Light domes produced by municipalities surrounding the Mont-Mégantic Observatory. Municipality characteristics (name: population,surface area, and distance from the Observatory): Notre-Dame-des-bois:985 inhabitants, 191 km2, 10 km; La Patrie: 810 inhabitants, 207 km2,10 km; Sherbrooke: 154,000 inhabitants, 366 km2, 60 km; Scotstown:836 inhabitants, 122 km2, 12 km; Lac Mégantic: 6086 inhabitants,26.4 km2, 25 km.
M. Aubé, J. Roby / Journal of Quantitative Spectroscopy & Radiative Transfer 139 (2014) 52–6354
brightness at the MMO by 50% to revert back to thebrightness levels of 1979 [7].
The project focused on two zones concentrated inside a50 km radius around the MMO (Zone 1: 0–25 km from theMMO, Zone 2: 25–50 km from the MMO) and a third zonecorresponding to the city of Sherbrooke, which is locatedapproximately 60 km from the MMO (Fig. 2). These inter-vention areas were determined according to their respec-tive estimated sky brightness contribution at the MMO.The MMO is surrounded by several municipalities and,despite their small size, those located within a radius of25 km contribute significantly to sky brightness. Fig. 3shows a 3601 panorama of the light domes as seen fromthe MMO in 2007 during the lighting devices conversion.
As of 2005, following important public awarenessefforts, the municipalities involved with the project adoptedregulations pertaining to the installation of new lightingdevices. With the cooperation of businesses, industries andresidents, a lighting device conversion program wasinitiated in order to convert existing light fixtures in thenearby municipalities to devices that were less powerful(approximately 40% lower radiant power), but more effi-cient; these fixtures significantly reduced light pollutionwithout significant impact on the ambient light. In theconversion process, white lights like metal halide (MH) ormercury vapor (MV) lamps were replaced by high pressuresodium (HPS) lights (model: Helios). In 2007, over 3300fixtures were replaced resulting in energy savings of nearly2 GWh/year. The 40% radiant power average reduction hasbeen obtained from statistical data provided by the MMO'sIDSR in their report to Hydro-Québec [4]. The impact on thestarry sky was immediate and impressive.
2.1.2. Establishment of the Mont-Mégantic areaInternational Dark Sky Reserve
In order to continue to pursue the project's goals andhelp ensure their persistence in time, ASTROLab proposedthe creation of the first International Dark Sky Reserve(IDSR) covering an area of nearly 5500 km2 that includestwo Regional County Municipalities, the city of Sher-brooke, 35 municipalities and over 225,000 citizens. Underthe leadership of ASTROLab and with the help and strongsupport of numerous regional partners, such as the MMOand the Mont-Mégantic National Park, the Mont-Méganticarea IDSR was formally established in 2007 and is recog-nized by the International Dark-Sky Association and theRoyal Astronomy Association of Canada (RASC). This officialrecognition favors the sustainability of the project bygiving the local population a sense of pride about thisaccomplishment.
M. Aubé, J. Roby / Journal of Quantitative Spectroscopy & Radiative Transfer 139 (2014) 52–63 55
2.2. Modeling experiment
2.2.1. Light pollution numerical model: ILLUMINAThe radiative transfer model used for this study is
ILLUMINA [8,9] version 2. This model is distributed underGnu Public License and can be downloaded from GoogleCode [10]. In version 2, a statistical optimization procedurehas been added for the selection of ground pixels and lineof sight voxels to reduce computing time.
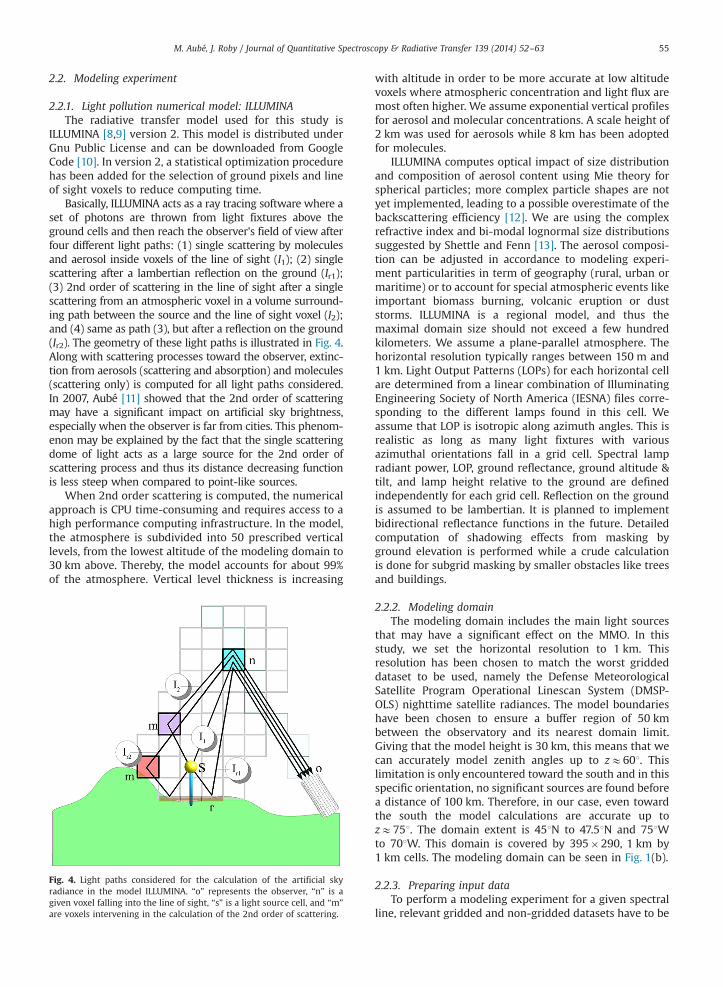
Basically, ILLUMINA acts as a ray tracing software where aset of photons are thrown from light fixtures above theground cells and then reach the observer's field of view afterfour different light paths: (1) single scattering by moleculesand aerosol inside voxels of the line of sight (I1); (2) singlescattering after a lambertian reflection on the ground (Ir1);(3) 2nd order of scattering in the line of sight after a singlescattering from an atmospheric voxel in a volume surround-ing path between the source and the line of sight voxel (I2);and (4) same as path (3), but after a reflection on the ground(Ir2). The geometry of these light paths is illustrated in Fig. 4.Along with scattering processes toward the observer, extinc-tion from aerosols (scattering and absorption) and molecules(scattering only) is computed for all light paths considered.In 2007, Aubé [11] showed that the 2nd order of scatteringmay have a significant impact on artificial sky brightness,especially when the observer is far from cities. This phenom-enon may be explained by the fact that the single scatteringdome of light acts as a large source for the 2nd order ofscattering process and thus its distance decreasing functionis less steep when compared to point-like sources.
When 2nd order scattering is computed, the numericalapproach is CPU time-consuming and requires access to ahigh performance computing infrastructure. In the model,the atmosphere is subdivided into 50 prescribed verticallevels, from the lowest altitude of the modeling domain to30 km above. Thereby, the model accounts for about 99%of the atmosphere. Vertical level thickness is increasing
Fig. 4. Light paths considered for the calculation of the artificial skyradiance in the model ILLUMINA. “o” represents the observer, “n” is agiven voxel falling into the line of sight, “s” is a light source cell, and “m”
are voxels intervening in the calculation of the 2nd order of scattering.
with altitude in order to be more accurate at low altitudevoxels where atmospheric concentration and light flux aremost often higher. We assume exponential vertical profilesfor aerosol and molecular concentrations. A scale height of2 km was used for aerosols while 8 km has been adoptedfor molecules.
ILLUMINA computes optical impact of size distributionand composition of aerosol content using Mie theory forspherical particles; more complex particle shapes are notyet implemented, leading to a possible overestimate of thebackscattering efficiency [12]. We are using the complexrefractive index and bi-modal lognormal size distributionssuggested by Shettle and Fenn [13]. The aerosol composi-tion can be adjusted in accordance to modeling experi-ment particularities in term of geography (rural, urban ormaritime) or to account for special atmospheric events likeimportant biomass burning, volcanic eruption or duststorms. ILLUMINA is a regional model, and thus themaximal domain size should not exceed a few hundredkilometers. We assume a plane-parallel atmosphere. Thehorizontal resolution typically ranges between 150 m and1 km. Light Output Patterns (LOPs) for each horizontal cellare determined from a linear combination of IlluminatingEngineering Society of North America (IESNA) files corre-sponding to the different lamps found in this cell. Weassume that LOP is isotropic along azimuth angles. This isrealistic as long as many light fixtures with variousazimuthal orientations fall in a grid cell. Spectral lampradiant power, LOP, ground reflectance, ground altitude &tilt, and lamp height relative to the ground are definedindependently for each grid cell. Reflection on the groundis assumed to be lambertian. It is planned to implementbidirectional reflectance functions in the future. Detailedcomputation of shadowing effects from masking byground elevation is performed while a crude calculationis done for subgrid masking by smaller obstacles like treesand buildings.
2.2.2. Modeling domainThe modeling domain includes the main light sources
that may have a significant effect on the MMO. In thisstudy, we set the horizontal resolution to 1 km. Thisresolution has been chosen to match the worst griddeddataset to be used, namely the Defense MeteorologicalSatellite Program Operational Linescan System (DMSP-OLS) nighttime satellite radiances. The model boundarieshave been chosen to ensure a buffer region of 50 kmbetween the observatory and its nearest domain limit.Giving that the model height is 30 km, this means that wecan accurately model zenith angles up to zE601. Thislimitation is only encountered toward the south and in thisspecific orientation, no significant sources are found beforea distance of 100 km. Therefore, in our case, even towardthe south the model calculations are accurate up tozE751. The domain extent is 451N to 47.51N and 751Wto 701W. This domain is covered by 395�290, 1 km by1 km cells. The modeling domain can be seen in Fig. 1(b).
2.2.3. Preparing input dataTo perform a modeling experiment for a given spectral
line, relevant gridded and non-gridded datasets have to be
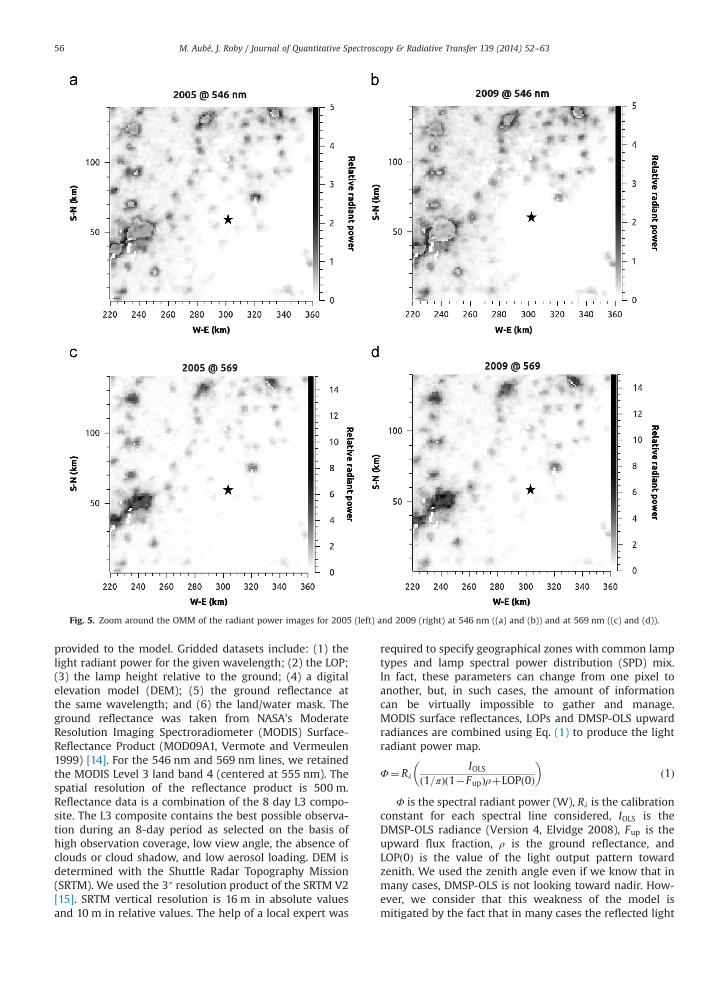
Fig. 5. Zoom around the OMM of the radiant power images for 2005 (left) and 2009 (right) at 546 nm ((a) and (b)) and at 569 nm ((c) and (d)).
M. Aubé, J. Roby / Journal of Quantitative Spectroscopy & Radiative Transfer 139 (2014) 52–6356
provided to the model. Gridded datasets include: (1) thelight radiant power for the given wavelength; (2) the LOP;(3) the lamp height relative to the ground; (4) a digitalelevation model (DEM); (5) the ground reflectance atthe same wavelength; and (6) the land/water mask. Theground reflectance was taken from NASA's ModerateResolution Imaging Spectroradiometer (MODIS) Surface-Reflectance Product (MOD09A1, Vermote and Vermeulen1999) [14]. For the 546 nm and 569 nm lines, we retainedthe MODIS Level 3 land band 4 (centered at 555 nm). Thespatial resolution of the reflectance product is 500 m.Reflectance data is a combination of the 8 day L3 compo-site. The L3 composite contains the best possible observa-tion during an 8-day period as selected on the basis ofhigh observation coverage, low view angle, the absence ofclouds or cloud shadow, and low aerosol loading. DEM isdetermined with the Shuttle Radar Topography Mission(SRTM). We used the 3″ resolution product of the SRTM V2[15]. SRTM vertical resolution is 16 m in absolute valuesand 10 m in relative values. The help of a local expert was
required to specify geographical zones with common lamptypes and lamp spectral power distribution (SPD) mix.In fact, these parameters can change from one pixel toanother, but, in such cases, the amount of informationcan be virtually impossible to gather and manage.MODIS surface reflectances, LOPs and DMSP-OLS upwardradiances are combined using Eq. (1) to produce the lightradiant power map.
Φ¼ RλIOLS
ð1=πÞð1�FupÞρþLOPð0Þ
� �ð1Þ
Φ is the spectral radiant power (W), Rλ is the calibrationconstant for each spectral line considered, IOLS is theDMSP-OLS radiance (Version 4, Elvidge 2008), Fup is theupward flux fraction, ρ is the ground reflectance, andLOPð0Þ is the value of the light output pattern towardzenith. We used the zenith angle even if we know that inmany cases, DMSP-OLS is not looking toward nadir. How-ever, we consider that this weakness of the model ismitigated by the fact that in many cases the reflected light
M. Aubé, J. Roby / Journal of Quantitative Spectroscopy & Radiative Transfer 139 (2014) 52–63 57
is dominant in this equation. In a future version of ourmodel, we plan to account for the mean viewing angle ofthe satellite and then use the relevant angle instead of 0.The DMSP-OLS dataset is maintained by the Earth Obser-vation Group of the National Geophysical Data Center(NGDC) which is a part of the US National Oceanic andAtmospheric Administration (NOAA). DMSP-OLS data arecoded from 0 to 63 on a linear, but relative sensitivityscale. Some pixels may be saturated and in that case areset as numerical value 63. This dataset is a yearly compo-site were only the cloud screened and stable values areused. To minimize the potential impact of sensitivitychanges from one satellite to another, we used the datafrom the same DMSP satellite (satellite F16). We assumethat variations in the satellite radiances from one year toanother are directly linked to real ground based variations.Our use of uncalibrated data is not a limitation in thisstudy, given the entire analysis is based on relativecomparisons from one year to another.
Fig. 5 gives four examples of radiant power maps createdwith Eq. (1) for two spectral lines, 546 nm and 569 nm,associated to specific lamps. The 546 nm line is a mercuryline (Hg) produced by MV lamps and MH lamps. The569 nm line is a sodium line (Na) produced by HPS. Themaximal radiant power in the 546 nm line appears lowerthan that in the 569 nm line. We can explain this by the factthat the highest installed radiant power per square kilo-meter occurs in cities while MV and MH lamps are morecommon in the countryside. According to spectral skyradiance measurements made in 2006 at the MMO by Aubéand available from the Sky spectral radiance database [16],the two lines are typically of the same magnitude. But, ofcourse, the MMO is far from city lights and thus moredependent on countryside sources. It is easy to notice thatthe radiant power at 546 nm shows a significant reduction
Table 1Lamp angular photometry and spectrum distribution in the zones surrounding thof the International Dark Sky Reserve.
Zones Environment type Distribution of light fixtu
Before IDSR (2005)
MMO (25 km) Urban – 95%a
Rural – 66%b
Cookshire and Lac-Mégantic Urban – 95%a
Rural – 66%b
Sherbrooke Urban – 95%a
Rural – 66%b
Elsewhere in Québec Urban – 95%a
Rural – 66%b
a Representing 86% sodium (Na) and 14% mercury (Hg).b Representing 66% sodium (Na) and 34% mercury (Hg).c Representing 89% sodium (Na) and 11% mercury (Hg).d Representing 80% sodium (Na) and 20% mercury (Hg).e Representing 90% sodium (Na) and 10% mercury (Hg).
in 2009 compared to 2005 around the MMO (identified bythe black star). A lower but significant reduction is alsovisible over the city of Sherbrooke located around coordi-nate 240 W–E and 50 S–N. We also observed a generalincrease in the installed radiant power both in the 546 nmand 569 nm lines for all other sites.
Table 1 summarizes the characteristics of the lightinginfrastructure both in 2005 and 2009. In this table, it ispossible to find the proportion of each lamp type fordifferent regions. Lamps are distinguished by their mix ofphotometric types and their mix of spectral types. Thelighting inventory was simplified to retain only the threemost common photometric types. In fact, in southernQuébec, most light fixtures can be associated to one ofthe three models shown, even if they are not exactly thesame. The percentage of each photometric type wasdetermined using Street View in Google Maps. We firstchose a set of random locations inside each region (MMO,Cookshire and Lac Mégantic, Sherbrooke, and elsewhere inQuébec) and then determined the number of fixturescorresponding to each photometric type present usingStreet View. We distinguished urban from rural environ-ments as it is shown in Table 1. For the percentage of eachspectral type, we visited each region at night to count thenumber of white and yellow lamps (respectively lampsemitting a 546 nm Hg line and lamps emitting a 569 nmNa line). Resultant LOPs for each region shown in Table 1were computed by doing a linear combination of each ofthe three individual lamp LOPs with respect to thepercentage given in Table 1's legend.
Finally, the model requires some non gridded parametersthat are considered constant over the entire geographicaldomain: (1) the wavelength used; (2) the aerosol opticaldepth (AOD); (3) the aerosol scattering and absorption crosssections at the given wavelength and relative humidity; (4)
e Mont-Mégantic Observatory (MMO) before and after the establishment
re types
After IDSR (2009)
5%a 67%c 22%c 11%c
34%b
5%a 40%d 40%d 20%d
34%b
5%a 7%e 93%e –
34%b
5%a – 95%a 5%a
34%b – 66%b 34%b
Table 2Non gridded modeling parameter values.
Parameter Values
Wavelengths (in nm) 436 (Hg), 498 (Na), 546 (Hg), 569 (Na), 616 (Na)Aerosol optical depth (no units) 0.05, 0.1, 0.2 (low turbidity, clear sky)
0.5, 1 (high turbidity, hazy sky)Aerosol model RuralRelative humidity 70%Ground level atmospheric pressure 101.3 kPaAverage obstacle height 9 mAverage distance between obstacles 13 mObserver position MMOZenith angles (degrees) 0, 30, 50, 60, 70, 75Azimuthal angles (degrees) 0–3451 at 151 intervals
M. Aubé, J. Roby / Journal of Quantitative Spectroscopy & Radiative Transfer 139 (2014) 52–6358
the aerosol scattering phase function (aerosol model) at thegivenwavelength and relative humidity; (5) the ground levelatmospheric pressure and the average height and distancebetween subgrid obstacles; (6) the observer position; and (7)the viewing angles. The values of non gridded parametersused for this study are listed in Table 2.
3. Results and discussion
3.1. Output data
ILLUMINA generates three different outputs. The firstone is the artificial sky radiance calculated for a givenviewing angle and observer position in a given spectralline. The model also generates two gridded outputs: thecontribution map and the sensitivity map. The contribu-tion map indicates fromwhere and in what proportion thecalculated artificial sky radiance originates from. Thesensitivity map indicates how sensitive the artificial skyradiance values are to any change in the installed radiantpower at a given model cell containing at least one lightdevice. Contribution and sensitivity maps for differentsites and periods can be accessed via an interactive webportal developed and maintained by our group [17].
3.1.1. All sky radiance ratio mapsThese maps illustrate changes in artificial sky bright-
ness by taking the ratio of the artificial sky radiancesobserved after the light conversion project over theartificial sky radiances observed before the conversionproject. Each plot is composed of 121 ratios for differentviewing angles (six zenithal angles (751, 701, 601, 501, 301,01) and twenty four azimuthal angles (0–3451 at 151intervals)). A single all sky radiance ratio map requires242 model runs to be accomplished.
3.1.2. Sky radiance contribution mapThe contribution maps illustrate how each square kilo-
meter of land contributes to artificial sky brightnessdetected at a given viewing angle from the MMO. Thismap is normalized so that the sum of all pixels equals100%. The values are expressed in term of percentagepoints per square kilometer.
3.1.3. Sky radiance sensitivity mapThe sensitivity maps illustrate the impact on artificial
sky brightness measured at the MMO of an hypotheticalgeneric street lamp installed on each square kilometer. Thesensitivity map is only calculated for pixels containing anon-zero radiant power. This map is also normalized sothat the sum of all pixels equals 100%. This map is veryuseful for local decision-makers as it allows them toidentify the places where intervention is necessary toefficiently reduce sky brightness.
3.2. Sky radiance contribution and sensitivity maps analysis
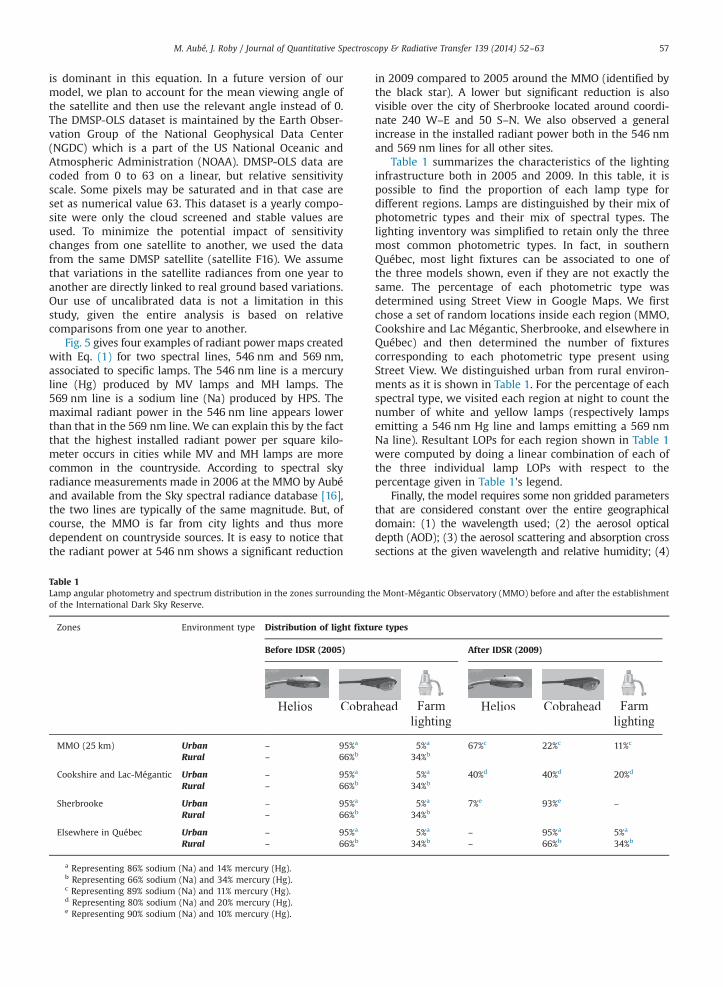
All the contribution and sensitivity maps are georefer-enced and published in a web portal [17]. There is onecontribution and one sensitivity map for each modelconfiguration (121 viewing angles, five wavelengths, fiveaerosol optical depths, and two night periods). The mapscorresponding to zenith viewing angle are reported inFigs. 6 and 7. Panes (a) and (b) in Fig. 6 show a comparisonof summer zenith contribution maps before and after thecreation of the Mont-Mégantic area IDSR under the sameconditions (clear sky and 546 nm Hg line). Artificial skyradiance has decreased significantly around the MMO.We found a relative reduction of 50% at zenith. Thereplacement of MV and MH lamps to HPS Helios lampsin zone 1 was efficient. Panes (a) and (b) of Fig. 6 show thatin 2005, the zenith 546 nm Hg line radiance came mainlyfrom closer and small towns surrounding the MMO. In2009, the 546 nm Hg line radiance comes from farther.This change is clearly illustrated by the greater spread incontribution of pane (b) compared to pane (a). We haveintegrated all contributions from different IDSR zones andalso for some nearby villages. Table 3 gives a compilationof these integrations. In zone 1 (less than 25 km from theMMO), the total contribution to the zenith 546 nm Hg lineradiance in 2005 was 57.2%; this was reduced to 12.1% in2009. In zone 2 (25 km to 50 km from the MMO), the totalcontribution to the zenith 546 nm Hg line radiance was23.3% in 2005 and 45.7% in 2009. Interestingly, under clearsky, zone 3 shows a very low contribution to the 546 nmHg line in 2005 and in 2009 (0.9% and 1.1% respectively;see Table 3). The same remark stands for the 569 nm Naline for both years (2.3% and 3.3% respectively). DespiteSherbrooke being the largest city in the region (154,000inhabitants), it is quite far from the MMO (60 km away)
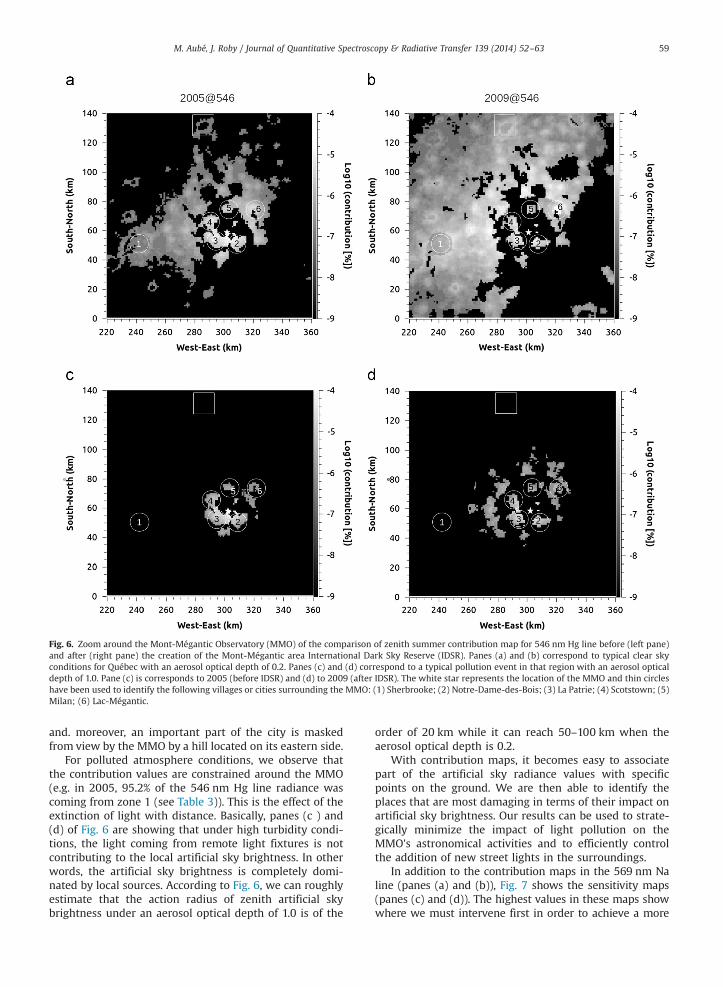
Fig. 6. Zoom around the Mont-Mégantic Observatory (MMO) of the comparison of zenith summer contribution map for 546 nm Hg line before (left pane)and after (right pane) the creation of the Mont-Mégantic area International Dark Sky Reserve (IDSR). Panes (a) and (b) correspond to typical clear skyconditions for Québec with an aerosol optical depth of 0.2. Panes (c) and (d) correspond to a typical pollution event in that region with an aerosol opticaldepth of 1.0. Pane (c) is corresponds to 2005 (before IDSR) and (d) to 2009 (after IDSR). The white star represents the location of the MMO and thin circleshave been used to identify the following villages or cities surrounding the MMO: (1) Sherbrooke; (2) Notre-Dame-des-Bois; (3) La Patrie; (4) Scotstown; (5)Milan; (6) Lac-Mégantic.
M. Aubé, J. Roby / Journal of Quantitative Spectroscopy & Radiative Transfer 139 (2014) 52–63 59
and. moreover, an important part of the city is maskedfrom view by the MMO by a hill located on its eastern side.
For polluted atmosphere conditions, we observe thatthe contribution values are constrained around the MMO(e.g. in 2005, 95.2% of the 546 nm Hg line radiance wascoming from zone 1 (see Table 3)). This is the effect of theextinction of light with distance. Basically, panes (c ) and(d) of Fig. 6 are showing that under high turbidity condi-tions, the light coming from remote light fixtures is notcontributing to the local artificial sky brightness. In otherwords, the artificial sky brightness is completely domi-nated by local sources. According to Fig. 6, we can roughlyestimate that the action radius of zenith artificial skybrightness under an aerosol optical depth of 1.0 is of the
order of 20 km while it can reach 50–100 km when theaerosol optical depth is 0.2.
With contribution maps, it becomes easy to associatepart of the artificial sky radiance values with specificpoints on the ground. We are then able to identify theplaces that are most damaging in terms of their impact onartificial sky brightness. Our results can be used to strate-gically minimize the impact of light pollution on theMMO's astronomical activities and to efficiently controlthe addition of new street lights in the surroundings.
In addition to the contribution maps in the 569 nm Naline (panes (a) and (b)), Fig. 7 shows the sensitivity maps(panes (c) and (d)). The highest values in these maps showwhere we must intervene first in order to achieve a more
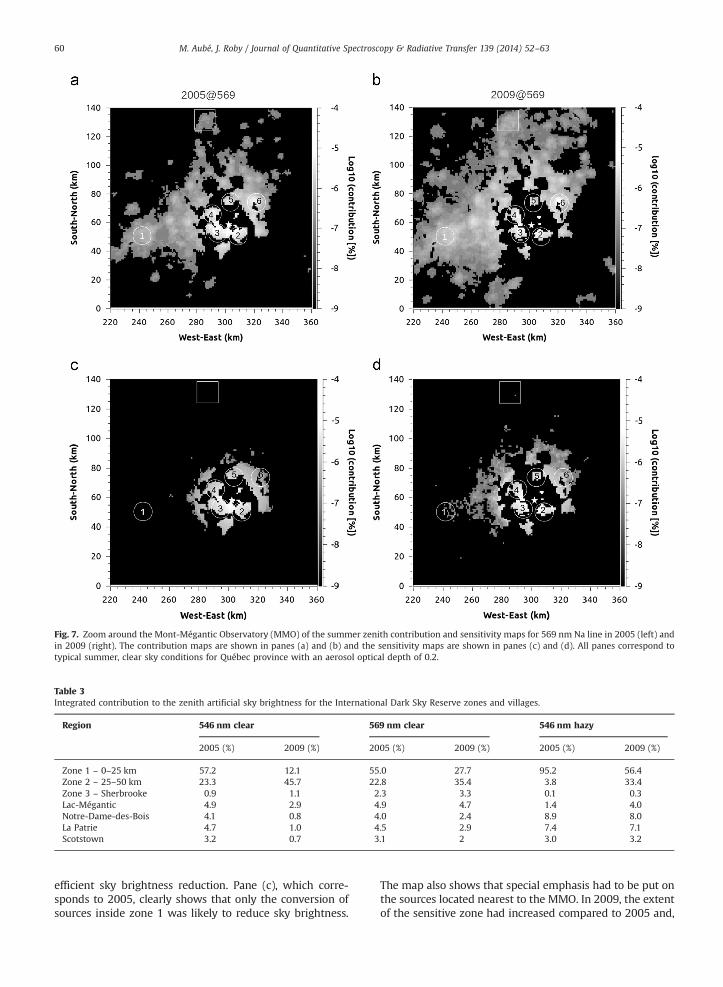
Fig. 7. Zoom around the Mont-Mégantic Observatory (MMO) of the summer zenith contribution and sensitivity maps for 569 nm Na line in 2005 (left) andin 2009 (right). The contribution maps are shown in panes (a) and (b) and the sensitivity maps are shown in panes (c) and (d). All panes correspond totypical summer, clear sky conditions for Québec province with an aerosol optical depth of 0.2.
Table 3Integrated contribution to the zenith artificial sky brightness for the International Dark Sky Reserve zones and villages.
Region 546 nm clear 569 nm clear 546 nm hazy
2005 (%) 2009 (%) 2005 (%) 2009 (%) 2005 (%) 2009 (%)
Zone 1 – 0–25 km 57.2 12.1 55.0 27.7 95.2 56.4Zone 2 – 25–50 km 23.3 45.7 22.8 35.4 3.8 33.4Zone 3 – Sherbrooke 0.9 1.1 2.3 3.3 0.1 0.3Lac-Mégantic 4.9 2.9 4.9 4.7 1.4 4.0Notre-Dame-des-Bois 4.1 0.8 4.0 2.4 8.9 8.0La Patrie 4.7 1.0 4.5 2.9 7.4 7.1Scotstown 3.2 0.7 3.1 2 3.0 3.2
M. Aubé, J. Roby / Journal of Quantitative Spectroscopy & Radiative Transfer 139 (2014) 52–6360
efficient sky brightness reduction. Pane (c), which corre-sponds to 2005, clearly shows that only the conversion ofsources inside zone 1 was likely to reduce sky brightness.
The map also shows that special emphasis had to be put onthe sources located nearest to the MMO. In 2009, the extentof the sensitive zone had increased compared to 2005 and,
M. Aubé, J. Roby / Journal of Quantitative Spectroscopy & Radiative Transfer 139 (2014) 52–63 61
in the context of a future conversion program, efforts wouldhave to target a larger zone with an approximate radius of40 km. In that case also, the most important sources tocheck or reduce are those closest to the MMO. In a certainsense, this result is showing that during the IDSR conver-sion project, it was more efficient to focus on reducing theradiant power in zone 1 than making any conversions inzone 2. Here, it is important to understand that sensitivitiesare only computed for pixels having non-zero radiantpower. This also contributes to the increased geographicalextent of sensitivity from 2005 to 2009. In fact, in 2009, theextent is larger because light fixtures have been added inplaces where there were none in 2005.
3.3. All sky radiance ratio maps
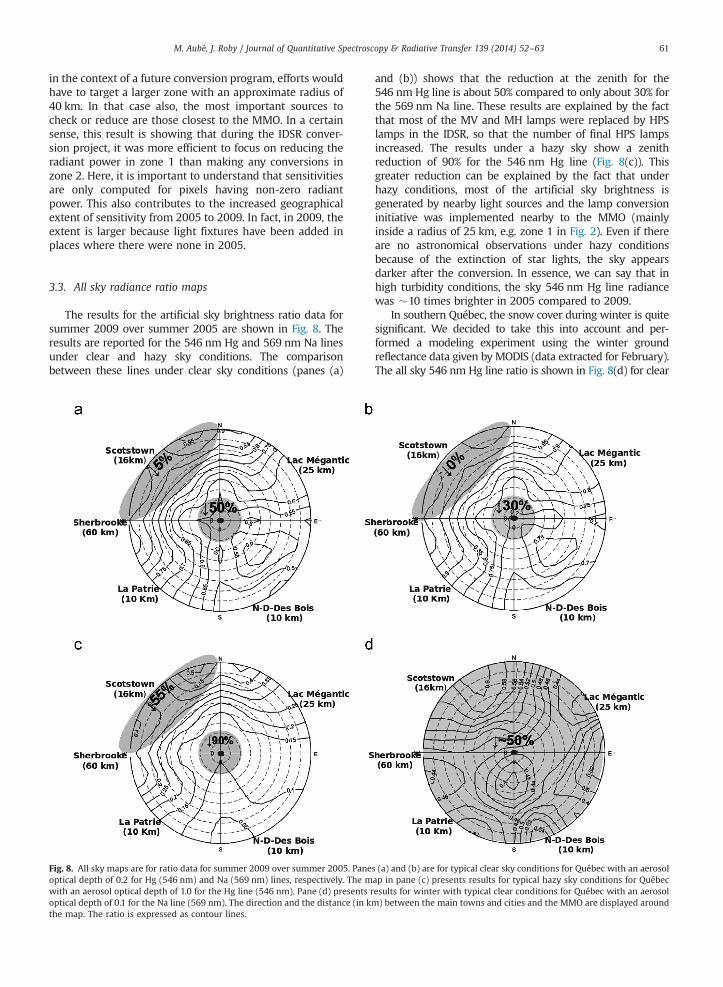
The results for the artificial sky brightness ratio data forsummer 2009 over summer 2005 are shown in Fig. 8. Theresults are reported for the 546 nm Hg and 569 nm Na linesunder clear and hazy sky conditions. The comparisonbetween these lines under clear sky conditions (panes (a)
Fig. 8. All sky maps are for ratio data for summer 2009 over summer 2005. Paneoptical depth of 0.2 for Hg (546 nm) and Na (569 nm) lines, respectively. The mwith an aerosol optical depth of 1.0 for the Hg line (546 nm). Pane (d) presents roptical depth of 0.1 for the Na line (569 nm). The direction and the distance (in kthe map. The ratio is expressed as contour lines.
and (b)) shows that the reduction at the zenith for the546 nm Hg line is about 50% compared to only about 30% forthe 569 nm Na line. These results are explained by the factthat most of the MV and MH lamps were replaced by HPSlamps in the IDSR, so that the number of final HPS lampsincreased. The results under a hazy sky show a zenithreduction of 90% for the 546 nm Hg line (Fig. 8(c)). Thisgreater reduction can be explained by the fact that underhazy conditions, most of the artificial sky brightness isgenerated by nearby light sources and the lamp conversioninitiative was implemented nearby to the MMO (mainlyinside a radius of 25 km, e.g. zone 1 in Fig. 2). Even if thereare no astronomical observations under hazy conditionsbecause of the extinction of star lights, the sky appearsdarker after the conversion. In essence, we can say that inhigh turbidity conditions, the sky 546 nm Hg line radiancewas �10 times brighter in 2005 compared to 2009.
In southern Québec, the snow cover during winter is quitesignificant. We decided to take this into account and per-formed a modeling experiment using the winter groundreflectance data given by MODIS (data extracted for February).The all sky 546 nm Hg line ratio is shown in Fig. 8(d) for clear
s (a) and (b) are for typical clear sky conditions for Québec with an aerosolap in pane (c) presents results for typical hazy sky conditions for Québecesults for winter with typical clear conditions for Québec with an aerosolm) between the main towns and cities and the MMO are displayed around
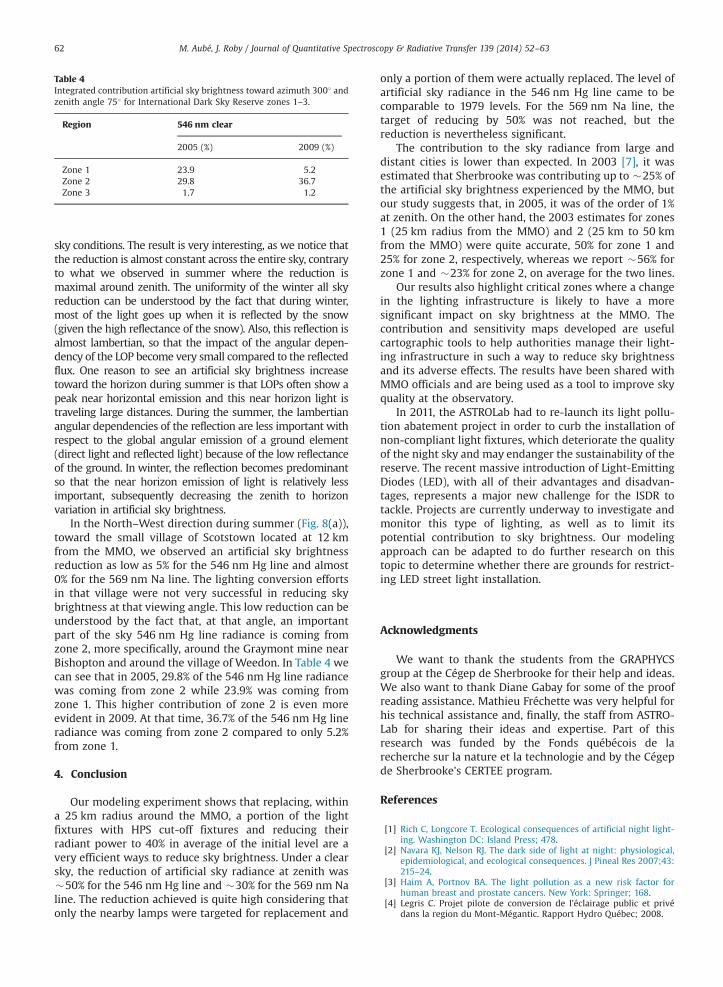
Table 4Integrated contribution artificial sky brightness toward azimuth 3001 andzenith angle 751 for International Dark Sky Reserve zones 1–3.
Region 546 nm clear
2005 (%) 2009 (%)
Zone 1 23.9 5.2Zone 2 29.8 36.7Zone 3 1.7 1.2
M. Aubé, J. Roby / Journal of Quantitative Spectroscopy & Radiative Transfer 139 (2014) 52–6362
sky conditions. The result is very interesting, as we notice thatthe reduction is almost constant across the entire sky, contraryto what we observed in summer where the reduction ismaximal around zenith. The uniformity of the winter all skyreduction can be understood by the fact that during winter,most of the light goes up when it is reflected by the snow(given the high reflectance of the snow). Also, this reflection isalmost lambertian, so that the impact of the angular depen-dency of the LOP become very small compared to the reflectedflux. One reason to see an artificial sky brightness increasetoward the horizon during summer is that LOPs often show apeak near horizontal emission and this near horizon light istraveling large distances. During the summer, the lambertianangular dependencies of the reflection are less important withrespect to the global angular emission of a ground element(direct light and reflected light) because of the low reflectanceof the ground. In winter, the reflection becomes predominantso that the near horizon emission of light is relatively lessimportant, subsequently decreasing the zenith to horizonvariation in artificial sky brightness.
In the North–West direction during summer (Fig. 8(a)),toward the small village of Scotstown located at 12 kmfrom the MMO, we observed an artificial sky brightnessreduction as low as 5% for the 546 nm Hg line and almost0% for the 569 nm Na line. The lighting conversion effortsin that village were not very successful in reducing skybrightness at that viewing angle. This low reduction can beunderstood by the fact that, at that angle, an importantpart of the sky 546 nm Hg line radiance is coming fromzone 2, more specifically, around the Graymont mine nearBishopton and around the village of Weedon. In Table 4 wecan see that in 2005, 29.8% of the 546 nm Hg line radiancewas coming from zone 2 while 23.9% was coming fromzone 1. This higher contribution of zone 2 is even moreevident in 2009. At that time, 36.7% of the 546 nm Hg lineradiance was coming from zone 2 compared to only 5.2%from zone 1.
4. Conclusion
Our modeling experiment shows that replacing, withina 25 km radius around the MMO, a portion of the lightfixtures with HPS cut-off fixtures and reducing theirradiant power to 40% in average of the initial level are avery efficient ways to reduce sky brightness. Under a clearsky, the reduction of artificial sky radiance at zenith was�50% for the 546 nm Hg line and �30% for the 569 nm Naline. The reduction achieved is quite high considering thatonly the nearby lamps were targeted for replacement and
only a portion of them were actually replaced. The level ofartificial sky radiance in the 546 nm Hg line came to becomparable to 1979 levels. For the 569 nm Na line, thetarget of reducing by 50% was not reached, but thereduction is nevertheless significant.
The contribution to the sky radiance from large anddistant cities is lower than expected. In 2003 [7], it wasestimated that Sherbrooke was contributing up to �25% ofthe artificial sky brightness experienced by the MMO, butour study suggests that, in 2005, it was of the order of 1%at zenith. On the other hand, the 2003 estimates for zones1 (25 km radius from the MMO) and 2 (25 km to 50 kmfrom the MMO) were quite accurate, 50% for zone 1 and25% for zone 2, respectively, whereas we report �56% forzone 1 and �23% for zone 2, on average for the two lines.
Our results also highlight critical zones where a changein the lighting infrastructure is likely to have a moresignificant impact on sky brightness at the MMO. Thecontribution and sensitivity maps developed are usefulcartographic tools to help authorities manage their light-ing infrastructure in such a way to reduce sky brightnessand its adverse effects. The results have been shared withMMO officials and are being used as a tool to improve skyquality at the observatory.
In 2011, the ASTROLab had to re-launch its light pollu-tion abatement project in order to curb the installation ofnon-compliant light fixtures, which deteriorate the qualityof the night sky and may endanger the sustainability of thereserve. The recent massive introduction of Light-EmittingDiodes (LED), with all of their advantages and disadvan-tages, represents a major new challenge for the ISDR totackle. Projects are currently underway to investigate andmonitor this type of lighting, as well as to limit itspotential contribution to sky brightness. Our modelingapproach can be adapted to do further research on thistopic to determine whether there are grounds for restrict-ing LED street light installation.
Acknowledgments
We want to thank the students from the GRAPHYCSgroup at the Cégep de Sherbrooke for their help and ideas.We also want to thank Diane Gabay for some of the proofreading assistance. Mathieu Fréchette was very helpful forhis technical assistance and, finally, the staff from ASTRO-Lab for sharing their ideas and expertise. Part of thisresearch was funded by the Fonds québécois de larecherche sur la nature et la technologie and by the Cégepde Sherbrooke's CERTEE program.
References
[1] Rich C, Longcore T. Ecological consequences of artificial night light-ing. Washington DC: Island Press; 478.
[2] Navara KJ, Nelson RJ. The dark side of light at night: physiological,epidemiological, and ecological consequences. J Pineal Res 2007;43:215–24.
[3] Haim A, Portnov BA. The light pollution as a new risk factor forhuman breast and prostate cancers. New York: Springer; 168.
[4] Legris C. Projet pilote de conversion de l’éclairage public et privédans la region du Mont-Mégantic. Rapport Hydro Québec; 2008.
M. Aubé, J. Roby / Journal of Quantitative Spectroscopy & Radiative Transfer 139 (2014) 52–63 63
[5] ⟨http://astrolab-parc-national-mont-megantic.org/en/welcome.htm⟩
[accessed 12.06.13].[6] Giguère S. Le parc national du Mont Mégantic. De la terre aux
étoiles. Muséologie In Situ; 2012.[7] Legris C, Goulet P. Plan d’action: projet de lutte contre la pollution
lumineuse dans la région du Mont Mégantic; august 2003.[8] Aubé M, Franchomme-Fossé L, Robert-Staehler P. Light pollution
modelling and detection in a heterogeneous environment: toward atnight time aerosol optical depth retrieval method. In: SPIE’S annualmeeting proceedings, San Diego, CA; 2005 (paper 5890-40, 1.1Mb).
[9] Aubé M. Heterogeneous modeling of artificial sky radiance: ⟨http://www.cegepsherbrooke.qc.ca/�aubema/index.php/Prof/IllumEn⟩[accessed 16.06.13].
[10] Aubé M. Illumina Google Code project: ⟨https://code.google.com/p/illumina/⟩ [accessed 07.01.14].
[11] Aubé M. Light pollution modeling and detection in a heterogeneousenvironment. In: Proceedings of starlight 2007 conference, La Palma,Spain; 2007.
[12] Aubé M, Kocifaj M. Using two light-pollution models to investigateartificial sky radiances at Canary Islands observatories. Mon Not RAstron Soc 2012;422(1):819–30.
[13] Shettle EP, Fenn RW. Models for the aerosols of the lower atmo-sphere and the effects of humidity variations on their opticalproperties; 1979. AFGL-TR-79-0214.
[14] Vermote EF, Vermeulen A. Atmospheric correction algorithm: spectralreflectances (MOD09). ATBD version 4.0. NASA contract NAS5-96062.⟨http://mod09val.ltdri.org/publications/atbd_mod09.pdf⟩; 1999 [accessed11.01.14].
[15] Farr T, Rosen PA, Caro E, Crippen R, Duren R, Hensley S, et al. Theshuttle radar topography mission. Rev Geophys 2007;45 (33p).
[16] Aubé M. Sky spectral radiance database: ⟨http://www.cegepsherbrooke.qc.ca/�graphycs/aubema/recherches/data_usage.html⟩[accessed 30.08.13].
[17] Aubé M. Light pollution data server: ⟨http://galileo.graphycs.cegepsherbrooke.qc.ca/lpds/⟩ [accessed 30.08.13].