skull and tooth morphology of finnish and japanese raccoon dogs
TRANSCRIPT

Ann. Zool. Fennici 35: 1–16 ISSN 0003-455XHelsinki 4 June 1998 © Finnish Zoological and Botanical Publishing Board 1998
Skull and tooth morphology of Finnish andJapanese raccoon dogs
Kaarina Kauhala, Suvi Viranta, Mayumi Kishimoto, Eero Helle & Iwao Obara
Kauhala, K. & Helle, E., Finnish Game and Fisheries Research Institute, P.O. Box 6,FIN-00721 Helsinki, FinlandViranta, S., Department of Geology, P.O. Box 11, FIN-00014 University of Helsinki,Finland.Kishimoto, M., Wildlife Management Office, 5-8 Fuda Tama-ku, Kawasaki 214, JapanObara, I., Department of Education, National Science Museum, Tokyo, Ueno Park,Taito-Ku, Tokyo 110, Japan
Received 16 February 1998, accepted 14 April 1998
The skull and tooth morphometrics of Finnish and Japanese raccoon dogs (Nyctereutesprocyonoides ussuriensis and N. p. viverrinus, respectively) were examined and com-pared. The skulls of Finnish raccoon dogs were larger overall than those of Japaneseraccoon dogs (tanukis) and were also larger relative to occipital condyle breadth, i.e.body size. Almost all measurements differed among samples in relation to skull size,indicating differences in skull shape. Mandible width and jaw height were the bestmeasurements for discriminating among populations; the mandible is both absolutelyand relatively more robust and the jaws more powerful among Finnish than amongJapanese raccoon dogs. Japanese raccoon dogs have a relatively longer rostrum andlonger tooth rows than Finnish raccoon dogs. Although the absolute measurements ofmost teeth of Finnish raccoon dogs were larger than those of Japanese raccoon dogs, therelative measurements of molars in particular were larger in Japan than in Finland,indicating a larger grinding surface among Japanese raccoon dogs. We suggest thatviverrinus has adapted to a milder climate and less carnivorous diet than ussuriensis.The Japanese raccoon dog is smaller and, due to its less carnivorous diet, its head hasbecome decreased in size and the jaws less powerful; however, since its diet consistslargely of invertebrates and coarse plant material, its molars have increased relative toskull size.
1. Introduction
The raccoon dog (Nyctereutes procyonoides) orig-inates from eastern Asia. At present, six subspe-cies are known in various parts of Asia: N. p. pro-
cyonoides in many parts of China and northernVietnam, N. p. ussuriensis originally in southeast-ern parts of Russia and eastern China, N. p. orestesin Yunnan Province of China, N. p. viverrinus inJapan (except Hokkaido), N. p. albus in Hokkaido,

Kauhala et al. • ANN. ZOOL. FENNICI Vol. 352
and N. p. koreensis in Korea (Ellerman & Morri-son-Scott 1951). Russians introduced N. p. ussu-riensis to European Russia during the first half ofthis century (Lavrov 1971). From these introduc-tions raccoon dogs have spread to other Europeancountries, including Finland (Nowak 1984, Helle& Kauhala 1991). Finnish raccoon dogs, thus, be-long to the subspecies ussuriensis.
Raccoon dogs have probably occurred in Ja-pan for about 18 000 years, and the Japanese popu-lation has been isolated from the mainland popula-tion for about 12 000 years since the Sea of Japanopened (Ward et al. 1987). Due to a different envi-ronment and long isolation, evolutionary changemay have occurred in the Japanese population.
Some differences exist among populations:Finnish raccoon dogs (N. p. ussuriensis) have 54chromosomes as does N. p. procyonoides, but Jap-anese raccoon dogs (N. p. viverrinus) have only38 chromosomes (Mäkinen et al. 1986, Ward etal. 1987). There are 10 homologous autosomesand the remaining chromosome arms are homolo-gous because the chromosome number has de-creased in Japan via Robertsonian translocations(Mäkinen et al. 1986, Ward et al. 1987), whichoften occurs when new species evolve (Mayr1976). This suggests that viverrinus is a more re-cent form than procyonoides or ussuriensis. Finn-ish raccoon dogs are also larger, able to accumu-late larger fat reserves during autumn, dormantduring winter, and have thicker fur than Japaneseraccoon dogs or tanukis (Korhonen et al. 1990).The Japanese raccoon dogs may live in groups, atleast in some areas (Ikeda et al. 1979, Ward &Wurster-Hill 1989), whereas Finnish raccoon dogsappear to be strictly monogamous (Kauhala et al.1993a). The subspecies viverrinus and ussuriensisare, thus, rather different and probably should beclassified as distinct species. The aim of thepresent study was to compare the skull and toothmorphometrics of Finnish and Japanese raccoondogs to obtain more information on the speciesstatus of viverrinus.
2. Material and methods
Raccoon dog skulls were collected from hunters in south-ern Finland during 1986–1992 (n = 65). The skulls of Japa-nese raccoon dogs were collected between 1974 and 1992from several regions in Honshu, the main island of Japan(n = 104), and were kept in the National Science Museum,
Tokyo, and in Tochigi Prefectural Museum. Age was deter-mined from the incremental lines in the tooth cementum(Morris 1972); we used longitudinal sections of canines(Kauhala & Helle 1990), and all specimens < 1 year of agewere excluded to be sure that the skull is fully grown. Theskulls were cleaned and 22 measurements taken to the near-est 0.1 mm (Fig. 1). Jaw thickness (JT) was measured astransversal width of the lower jaw beneath m1. Measure-ment error was estimated by measuring 5 skulls for 5 timesand calculating mean measurement error (CV %).
Differences between the Finnish and Japanese samplesand between sexes within each sample were analyzed usingthe t-test (two-tailed), discriminant analysis, and principalcomponent analysis (Ranta et al. 1989). The significancelevel was 0.05, and it was tested using the sequential Bonfer-roni technique according to Rice (1989). We first exam-ined the differences in the absolute measurements betweenthe samples, using log transformated measurements in thediscriminant and principal component analyses (on corre-lation matrix). We then examined the differences betweensamples in relative measurements: ln(a/size) or lna –ln(size), and ln(a/OCB) or lna – ln(OCB) (occipital con-dyle breadth), where a refers to each measurement, and ‘size’to (CL) – (RL) (condylobasal length and rostrum length,respectively), i.e. a measurement for skull size that is inde-pendent of RL. By dividing the measurements with the sizeof the skull we obtained information on the differences inskull shape, and by dividing the measurements with OCBwe obtained information on the size of the measurements inrelation to body weight (see Martin 1980).
We also compared some other relative measurementsto determine possible differences in relative lengths of toothrows between Finnish and Japanese raccoon dogs. Thesemeasurements included: ln(UT) – ln(CL), ln(RL) – ln(CL),and ln(LT) – ln(ML), where UT = length of upper tooth row,LT = length of lower tooth row, and ML = mandible length.
We measured all teeth, except canines, of the 2 sam-ples; canines were omitted because they had been removedfrom most skulls for age determination. For the incisorsand premolars only total lengths were measured, while to-tal lengths and widths were measured for the molars. Forthe lower carnassial (m1), the length of the trigonid, con-sisting of the 3 anteriormost cusps (para-, proto- and meta-conid), was also measured.
Means and standard deviations were calculated for eachsex in both groups, and both differences between Finnishand Japanese samples and between the sexes were studiedusing the t-test. Ratio diagrams were used to visualize theresults (see Simpson, 1941). Discriminant and principalcomponent analyses similar to those run for the cranialmeasurements were applied to the dental measurements.
3. Results
3.1. Absolute measurements
The skulls of Finnish raccoon dogs were largerthan those of Japanese raccoon dogs. All meas-

ANN. ZOOL. FENNICI Vol. 35 • Skull and tooth morphology of raccoon dogs 3
NPL
FPL
SH
UT ACP
MW
LT
MH
ML
RL
CL
OCBZB
PCIC
PB
PL
NL
RB
JH
SIZE
Fig. 1. Measurements taken from Finnish and Japanese raccoon dog skulls. PL = profile length, CL = condylobasallength, Size = (CL) – (RL), ZB = zygomatic breadth, RB = rostrum breadth, IC = interorbital constriction, PB =postorbital breadth, PC = postorbital constriction, SH = skull height, FPL = frontal + parietal length, NPL = nasal+ premaxillary length, UT = length of upper tooth row, NL = nasal length, RL = rostrum length, OCB = occipitalcondyle breadth, ML = mandible length, MH = mandible height, LT = length of lower tooth row, ACP = fromangular process to coronoid process, MW = mandible width, and JH = jaw height.

Kauhala et al. • ANN. ZOOL. FENNICI Vol. 354
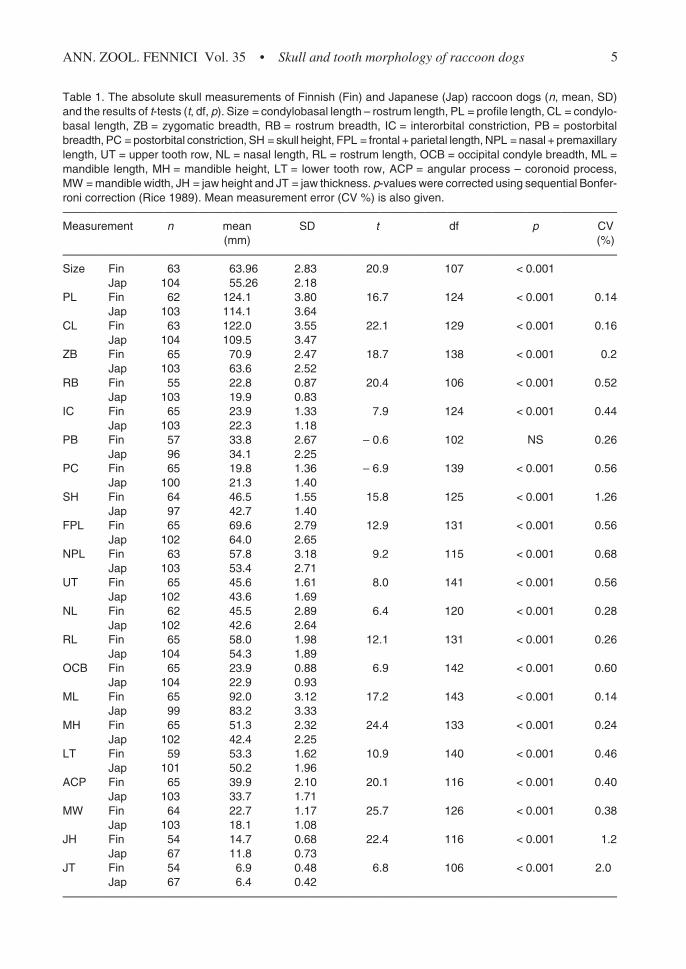
urements, except postorbital breadth (PB) andpostorbital constriction (PC), of Finnish raccoondogs were larger than those of tanukis (Table 1).PB did not differ between populations, and PCwas larger in Japan than in Finland. All meas-urements overlapped, however, to some extent(Fig. 2). According to discriminant analysis, man-dible width (MW) and jaw height (JH) were thebest measurements for identifying the origin ofthe skulls, and 100% of the skulls could be cor-rectly classified using these criteria (Fig. 3A). Ac-cording to principal component analysis, the skullscould also be correctly identified as belonging toFinnish or Japanese populations (Fig. 3B). Thefirst 2 principal components explained 77% of thetotal variance. The most important measurementsaffecting the 1st component were profile length(PL), CL and ML, and those affecting the 2ndcomponent were interorbital constriction (IC), PB,and PC.
The relative measurement ln(RL) – ln(CL) wasgreater in Japan (t = – 10.2, df = 98, p < 0.001),as was ln(UT) – ln(CL) (t = – 12.5, df = 96, p <0.001) and ln(LT) – ln(ML) (t = – 9.3, df = 151,p < 0.001), indicating that tooth rows were rela-tively longer in Japan than in Finland. The man-dible is more curved in Japanese raccoon dogsthan among Finnish raccoon dogs (Fig. 4).
Most teeth of Finnish raccoon dogs were alsolarger in their absolute measurements than thoseof Japanese raccoon dogs; only the postcarnassiallower dentition differed from this pattern (espe-cially m2; Fig. 5, Table 2). The 2 posterior lowermolars (m2 and m3) were longer in Japanese malesand m2 also in Japanese females than in the Finn-ish sample; the width of m2 was similar to that ofthe Finnish sample. According to discriminantanalysis, the lengths of the lower premolars p1and p2 were the best dental measurements foridentifying the origin of the lower dentition (Ei-genvalue = 3.56, Wilks’ lambda = 0.220, F = 4.82,df = 14, p = 0.001), and P1 was the best dentalmeasurement to identify the origin of the upperdentition (Eigenvalue = 2.48, Wilks’ lambda =0.287, F = 5.91, df = 13, p < 0.001).
3.2. Measurements relative to occipital condylebreadth (OCB)
Most measurements relative to OCB weresmaller in Japanese raccoon dogs, which indi-
cates that the skull of tanukis is smaller in rela-tion to body size (Table 3). Only PB and PC werelarger among Japanese than among Finnish rac-coon dogs. UT, LT, IC and RL relative to OCBdid not differ among populations, indicating thatalthough the skull was relatively smaller in Ja-pan, the tooth rows were not shorter in relationto body weight.
Premolars and m1 were larger relative to OCBin Finland, but m2 and M2 were relatively largerin Japan; M1 and m3 did not differ in size relativeto OCB among populations (Table 4). Accordingto discriminant analysis, the lengths of p1 and P1appeared to be the best indicators for the origin ofthe dentitions (lower dentition: Eigenvalue = 2.71,Wilks’ lambda = 0.270, F = 3.94, df = 11, p =0.007; upper dentition: Eigenvalue = 3.24, Wilks’lambda = 0.236, F = 13.6, df = 10, p < 0.001).
3.3. Measurements relative to skull size
All cranial measurements relative to skull size,except rostrum breadth (RB), differed among pop-ulations, indicating differences in skull shape (Ta-ble 5). Mandible height (MH), mandible width(MW), jaw height (JH) and ACP (from angularprocess to coronoid process; see Fig. 1) were rela-tively larger in Finland, which suggests that themandible is more robust in Finland than in Japan.All other measurements were relatively larger inJapan than in Finland; most of these measurementswere connected with the length of tooth rows,again indicating the relatively longer tooth rowsof the Japanese raccoon dog.
Discriminant analysis again resulted in 100%correct classification of skulls (Fig. 6A); the bestmeasurements for identification proved to be JHand MW. The skulls could also be well classifiedon the basis of principal component analysis (Fig. 6B).The first 2 principal components explained 69%of the total variance. The most important meas-urements affecting the 1st component were PL,RL, and CL, and those affecting the 2nd compo-nent were ACP, MH and MW.
Dental measurements relative to skull size dif-fered less between the 2 samples than the abso-lute measurements; however, the molars espe-cially were relatively larger in Japan than in Fin-land (Table 6), indicating a larger grinding sur-face among Japanese raccoon dogs. According to
ANN. ZOOL. FENNICI Vol. 35 • Skull and tooth morphology of raccoon dogs 5
Table 1. The absolute skull measurements of Finnish (Fin) and Japanese (Jap) raccoon dogs (n, mean, SD)and the results of t-tests (t, df, p). Size = condylobasal length – rostrum length, PL = profile length, CL = condylo-basal length, ZB = zygomatic breadth, RB = rostrum breadth, IC = interorbital constriction, PB = postorbitalbreadth, PC = postorbital constriction, SH = skull height, FPL = frontal + parietal length, NPL = nasal + premaxillarylength, UT = upper tooth row, NL = nasal length, RL = rostrum length, OCB = occipital condyle breadth, ML =mandible length, MH = mandible height, LT = lower tooth row, ACP = angular process – coronoid process,MW = mandible width, JH = jaw height and JT = jaw thickness. p-values were corrected using sequential Bonfer-roni correction (Rice 1989). Mean measurement error (CV %) is also given.—————————————————————————————————————————————————Measurement n mean SD t df p CV
(mm) (%)—————————————————————————————————————————————————Size Fin 63 63.96 2.83 20.9 107 < 0.001
Jap 104 55.26 2.18PL Fin 62 124.1 3.80 16.7 124 < 0.001 0.14
Jap 103 114.1 3.64CL Fin 63 122.0 3.55 22.1 129 < 0.001 0.16
Jap 104 109.5 3.47ZB Fin 65 70.9 2.47 18.7 138 < 0.001 0.2
Jap 103 63.6 2.52RB Fin 55 22.8 0.87 20.4 106 < 0.001 0.52
Jap 103 19.9 0.83IC Fin 65 23.9 1.33 7.9 124 < 0.001 0.44
Jap 103 22.3 1.18PB Fin 57 33.8 2.67 – 0.6 102 NS 0.26
Jap 96 34.1 2.25PC Fin 65 19.8 1.36 – 6.9 139 < 0.001 0.56
Jap 100 21.3 1.40SH Fin 64 46.5 1.55 15.8 125 < 0.001 1.26
Jap 97 42.7 1.40FPL Fin 65 69.6 2.79 12.9 131 < 0.001 0.56
Jap 102 64.0 2.65NPL Fin 63 57.8 3.18 9.2 115 < 0.001 0.68
Jap 103 53.4 2.71UT Fin 65 45.6 1.61 8.0 141 < 0.001 0.56
Jap 102 43.6 1.69NL Fin 62 45.5 2.89 6.4 120 < 0.001 0.28
Jap 102 42.6 2.64RL Fin 65 58.0 1.98 12.1 131 < 0.001 0.26
Jap 104 54.3 1.89OCB Fin 65 23.9 0.88 6.9 142 < 0.001 0.60
Jap 104 22.9 0.93ML Fin 65 92.0 3.12 17.2 143 < 0.001 0.14
Jap 99 83.2 3.33MH Fin 65 51.3 2.32 24.4 133 < 0.001 0.24
Jap 102 42.4 2.25LT Fin 59 53.3 1.62 10.9 140 < 0.001 0.46
Jap 101 50.2 1.96ACP Fin 65 39.9 2.10 20.1 116 < 0.001 0.40
Jap 103 33.7 1.71MW Fin 64 22.7 1.17 25.7 126 < 0.001 0.38
Jap 103 18.1 1.08JH Fin 54 14.7 0.68 22.4 116 < 0.001 1.2
Jap 67 11.8 0.73JT Fin 54 6.9 0.48 6.8 106 < 0.001 2.0
Jap 67 6.4 0.42—————————————————————————————————————————————————

Kauhala et al. • ANN. ZOOL. FENNICI Vol. 356
Fig. 2. Examples of skull measurements of Finnish and Japanese raccoon dogs. Mandible width and jaw heightwere the best measurements for identifying the origin of skulls, and skull size (CL – RL) also differed betweenpopulations, but postorbital breadth overlapped largely among populations.
– 3 – 2 – 1 0 1 2 3PC1
– 3
– 2
– 1
0
1
2
PC
2
– 10 – 5 0 5 10Score
10
20
30
Cou
nt
FinlandJapan
AB
Japan Finland
Fig. 3. The results of dis-criminant (A) and princi-pal component (B) analy-ses, based on skullmeasurements of Finnishand Japanese raccoondogs. Eigenvalue for dis-criminant analysis =19.6, Wilks’ lambda =0.049, F = 60.7, df = 21,p < 0.001.

ANN. ZOOL. FENNICI Vol. 35 • Skull and tooth morphology of raccoon dogs 7
Fig. 4. Photographs of skulls of Finnish and Japanese raccoon dogs. The smaller is Japanese and the larger isFinnish. Both are 1-year-old females.
Fig. 5. Ratio diagrams comparing the lower (left panel) and upper (right panel) dentition of Japanese andFinnish raccoon dogs (Finnish females as zero line).
– 0.08 – 0.06 – 0.04 – 0.02 0 0.02 0.04 0.06
i1l
i2l
i3l
p1l
p2l
p3l
p4l
p4w
m1l
m1w
m1trig.
m2l
m2w
m3l
Fin. females Fin. males Jap. females Jap. males
I1l
I2l
I3l
P1l
P2l
P3l
P4l
P4w
P4w, min.
M1l
M1w
M2l
M2w
– 0.08 – 0.06 – 0.04 – 0.02 0 0.02 0.04 0.06

Kauhala et al. • ANN. ZOOL. FENNICI Vol. 358
Table 2. Dental measurements of Finnish (Fin) and Japanese (Jap) raccoon dogs (n, mean, SD) and results ofthe t-tests (t, df, p). Upper teeth indicated with upper cases, maximum lengths (l) for all the teeth and widths (w)for carnassials and postcarnassials are provided; p-values were corrected using sequential Bonferroni correction(Rice 1989). Mean measurement error (CV %) is also given.—————————————————————————————————————————————————Measurement n mean SD t df p CV %—————————————————————————————————————————————————i1l Fin 42 2.00 0.37 2.06 63 NS 10.0
Jap 23 1.80 0.37i2l Fin 42 2.68 0.48 2.87 65 < 0.005 2.9
Jap 25 2.36 0.36i3l Fin 41 3.28 0.46 1.19 64 NS 8.4
Jap 25 3.09 0.46p1l Fin 58 3.30 0.33 6.66 77 < 0.001 5.0
Jap 21 2.70 0.46p2l Fin 57 5.69 0.46 7.44 96 < 0.001 2.9
Jap 41 4.82 0.71p3l Fin 58 6.20 0.45 6.69 98 < 0.001 2.6
Jap 42 5.64 0.36p4l Fin 59 7.31 0.56 6.99 112 < 0.001 1.5
Jap 55 6.64 0.45p4w Fin 58 3.71 0.26 6.49 88 < 0.001 2.3
Jap 32 3.34 0.26m1l Fin 60 12.62 0.51 10.26 127 < 0.001 1.2
Jap 69 11.61 0.59m1w Fin 60 5.18 0.26 4.87 127 < 0.001 2.2
Jap 69 4.95 0.27m1trig. Fin 57 7.57 0.65 9.37 124 < 0.001 1.8
Jap 69 6.64 0.47m2l Fin 60 6.28 0.46 – 5.75 126 < 0.001 3.1
Jap 68 6.77 0.49m2w Fin 59 4.35 0.32 1.24 125 NS 4.5
Jap 68 4.28 0.30m3 Fin 42 2.93 0.53 – 0.91 56 NS 7.3
Jap 16 3.06 0.43I1l Fin 33 2.75 0.34 2.07 60 NS 2.2
Jap 29 2.60 0.24I2l Fin 33 3.41 0.41 4.22 61 < 0.001 2.0
Jap 30 3.03 0.29I3l Fin 33 3.93 0.46 2.52 61 NS 2.0
Jap 30 3.66 0.38P1l Fin 54 3.71 0.32 7.96 77 < 0.001 0.8
Jap 25 3.15 0.21P2l Fin 59 5.64 0.46 4.50 85 < 0.001 1.9
Jap 28 5.19 0.40P3l Fin 59 5.64 0.46 4.67 97 < 0.001 0.8
Jap 40 6.19 0.38P4l Fin 58 10.43 0.61 7.70 121 < 0.001 1.2
Jap 65 9.66 0.51P4w Fin 58 5.62 0.41 9.01 121 < 0.001 1.9
Jap 65 4.98 0.38P4 (min) Fin 58 4.80 0.35 10.22 120 < 0.001 1.1
Jap 64 4.25 0.24M1l Fin 60 8.71 0.45 6.30 123 < 0.001 1.9
Jap 65 8.19 0.46M1w Fin 60 9.25 0.52 2.13 123 NS 1.4
Jap 65 9.06 0.47M2l Fin 60 5.19 0.46 – 1.75 123 NS 2.3
Jap 65 5.34 0.50M2w Fin 60 5.97 0.59 1.83 123 NS 1.2
Jap 65 6.13 0.39—————————————————————————————————————————————————

ANN. ZOOL. FENNICI Vol. 35 • Skull and tooth morphology of raccoon dogs 9
Table 3. The relative skull measurements against occipital condyle breadth [ln(measurement) – ln(condylebreadth)] of Finnish (Fin) and Japanese (Jap) raccoon dogs (n, mean, SD) and the results of t-tests (t, df, p).Size = condylobasal length – rostrum length, PL = profile length, CL = condylobasal length, ZB = zygomaticbreadth, RB = rostrum breadth, IC = interorbital constriction, PB = postorbital breadth, PC = postorbital cons-triction, SH = skull height, FPL = frontal + parietal length, NPL = nasal + premaxillary length, UT = upper toothrow, NL = nasal length, RL = rostrum length, ML = mandible length, MH = mandible height, LT = lower toothrow, ACP = angular process – coronoid process, MW = mandible width, JH = jaw height and JT = jaw thickness;p-values were corrected using sequential Bonferroni correction (Rice 1989).—————————————————————————————————————————————————Measurement n mean SD t df p—————————————————————————————————————————————————Size Fin 63 0.98 0.052 13.1 112 < 0.001
Jap 104 0.88 0.043PL Fin 62 1.64 0.053 4.4 119 < 0.001
Jap 103 1.61 0.048CL Fin 64 1.63 0.058 7.7 120 < 0.001
Jap 104 1.56 0.051ZB Fin 65 1.09 0.056 8.1 124 < 0.001
Jap 103 1.02 0.049RB Fin 55 – 0.05 0.057 8.8 112 < 0.001
Jap 103 – 0.14 0.058IC Fin 65 0.00 0.064 2.8 141 NS
Jap 103 – 0.03 0.067PB Fin 57 0.35 0.095 – 3.1 94 < 0.002
Jap 96 0.40 0.071PC Fin 65 – 0.19 0.081 – 9.3 139 < 0.001
Jap 100 – 0.07 0.083SH Fin 64 0.66 0.058 3.8 131 < 0.001
Jap 97 0.63 0.055FPL Fin 65 1.07 0.061 3.9 132 < 0.001
Jap 102 1.03 0.058NPL Fin 63 0.89 0.065 4.7 133 < 0.001
Jap 103 0.84 0.066UT Fin 65 0.65 0.056 1.1 138 NS
Jap 102 0.64 0.057NL Fin 62 0.65 0.072 3.0 124 < 0.003
Jap 102 0.61 0.068RL Fin 65 0.88 0.057 2.1 126 NS
Jap 104 0.86 0.052ML Fin 65 1.35 0.059 6.7 133 < 0.001
Jap 99 1.29 0.057MH Fin 65 0.76 0.060 15.9 139 < 0.001
Jap 102 0.61 0.062LT Fin 59 0.80 0.056 1.94 120 NS
Jap 102 0.78 0.055ACP Fin 65 0.52 0.073 12.4 115 < 0.001
Jap 103 0.39 0.058MW Fin 64 – 0.05 0.067 17.5 133 < 0.001
Jap 103 – 0.24 0.066JH Fin 54 – 0.48 0.063 15.6 117 < 0.001
Jap 67 – 0.67 0.069JT Fin 54 – 1.24 0.090 3.3 110 < 0.001
Jap 67 – 1.29 0.084—————————————————————————————————————————————————
discriminant analysis the length of m2 was themost helpful for discriminating among populations(lower dentition: Eigenvalue = 2.23, Wilks’lambda = 0.310, F = 7.14, df = 10, p < 0.001;upper dentition: Eigenvalue = 2.63, Wilks’lambda = 0.275, F = 11.1, df = 10, p < 0.001).
3.4. Sexual dimorphism
3.4.1. Skull measurements
Only zygomatic breadth (ZB) differed betweensexes in Finland and ZB, nasal + premaxillary

Kauhala et al. • ANN. ZOOL. FENNICI Vol. 3510
Table 4. Dental measurements relative to occipital condyle breadth; p-values were corrected using sequentialBonferroni correction (Rice 1989).—————————————————————————————————————————————————Measurement n mean SD t df p—————————————————————————————————————————————————p1l Fin 37 – 0.86 0.047 5.17 56 < 0.001
Jap 21 – 0.93 0.065p2l Fin 36 – 0.62 0.036 4.68 75 < 0.001
Jap 41 – 0.69 0.076p3l Fin 37 – 0.51 0.036 4.01 77 < 0.001
Jap 42 – 0.61 0.026p4l Fin 38 – 0.51 0.042 3.84 91 < 0.001
Jap 55 – 0.54 0.030p4w Fin 37 – 0.81 0.029 3.47 67 < 0.001
Jap 32 – 0.84 0.033m1l Fin 39 – 0.28 0.025 4.09 106 < 0.001
Jap 69 – 0.30 0.025m1w Fin 39 – 0.63 0.216 1.48 107 < 0.001
Jap 69 – 0.67 0.026m1trig. Fin 37 – 0.50 0.039 5.16 104 < 0.001
Jap 69 – 0.54 0.033m2l Fin 39 – 0.58 0.031 – 7.15 105 < 0.001
Jap 68 – 0.53 0.032m2w Fin 38 – 0.74 0.034 – 1.35 104 NS
Jap 68 – 0.73 0.031m3 Fin 26 – 0.91 0.086 – 1.26 40 NS
Jap 16 – 0.88 0.060P1l Fin 35 – 0.81 0.040 6.02 57 < 0.001
Jap 24 – 0.87 0.033P2l Fin 39 – 0.62 0.041 2.67 63 < 0.010
Jap 26 – 0.65 0.035P3l Fin 39 – 0.55 0.039 3.06 74 < 0.003
Jap 27 – 0.57 0.027P4l Fin 37 – 0.36 0.028 2.61 98 < 0.011
Jap 63 – 0.38 0.025P4w Fin 37 – 0.63 0.034 5.62 98 < 0.001
Jap 63 – 0.67 0.035P4w (min) Fin 37 – 0.70 0.033 6.20 97 < 0.001
Jap 62 – 0.73 0.025M1l Fin 39 – 0.44 0.026 1.55 100 NS
Jap 63 – 0.45 0.027M1w Fin 39 – 0.41 0.030 – 1.50 100 NS
Jap 63 – 0.40 0.025M2l Fin 39 – 0.66 0.042 – 3.14 100 < 0.002
Jap 63 – 0.64 0.039M2W Fin 39 – 0.61 0.055 – 3.86 100 < 0.001
Jap 63 – 0.57 0.031—————————————————————————————————————————————————
length (NPL), nasal length (NL), ML and MH inJapan (Table 7). When dimorphism existed, themeasurements of males were always larger thanthose of females.
Discriminant analysis could correctly classify69% of the Japanese, but only 31% of the Finn-ish skulls; thus, all measurements overlapped be-tween the sexes, especially in Finland, but slight
sexual dimorphism was present in Japan (Japan:Eigenvalue = 1.38, Wilks’ lambda = 0.42, F =1.91, df = 21, p = 0.054; Finland: Eigenvalue =0.73, Wilks’ lambda = 0.58, F = 0.48, df = 21,p = 0.936).
According to principal component analysis,sexual dimorphism is very slight among raccoondogs (Fig. 7). However, the difference in PC1 scores

ANN. ZOOL. FENNICI Vol. 35 • Skull and tooth morphology of raccoon dogs 11
Table 5. The relative skull measurements against skull size [ln(measurement) – ln(size)] of Finnish (Fin) andJapanese (Jap) raccoon dogs (n, mean, SD) and the results of t-tests (t, df, p). PL = profile length, CL =condylobasal length, ZB = zygomatic breadth, RB = rostrum breadth, IC = interorbital constriction, PB = postorbitalbreadth, PC = postorbital constriction, SH = skull height, FPL = frontal + parietal length, NPL = nasal + premaxillarylength, UT = upper tooth row, NL = nasal length, RL = rostrum length, OCB = occipital condyle breadth, ML =mandible length, MH = mandible height, LT = lower tooth row, ACP = angular process – coronoid process,MW = mandible width, JH = jaw height and JT = jaw thickness; p-values were corrected using sequential Bon-ferroni correction (Rice 1989).—————————————————————————————————————————————————Measurement n mean SD t df p—————————————————————————————————————————————————PL Fin 61 0.66 0.028 – 14.4 114 < 0.001
Jap 103 0.73 0.025CL Fin 63 0.65 0.025 – 10.3 108 < 0.001
Jap 104 0.68 0.020ZB Fin 63 0.10 0.040 – 6.2 112 < 0.001
Jap 103 0.14 0.033RB Fin 53 – 1.03 0.043 – 1.6 107 NS
Jap 103 – 1.02 0.043IC Fin 63 – 0.99 0.055 – 9.1 122 < 0.001
Jap 103 – 0.91 0.050PB Fin 56 – 0.64 0.075 – 13.1 101 < 0.001
Jap 96 – 0.49 0.064PC Fin 63 – 1.18 0.077 – 18.1 131 < 0.001
Jap 100 – 0.95 0.076SH Fin 62 – 0.32 0.043 – 8.9 120 < 0.001
Jap 97 – 0.26 0.038FPL Fin 63 0.09 0.039 – 9.9 128 < 0.001
Jap 102 0.15 0.038NPL Fin 62 – 0.10 0.051 – 8.1 122 < 0.001
Jap 103 – 0.04 0.048UT Fin 63 – 0.34 0.037 – 16.3 133 < 0.001
Jap 102 – 0.24 0.038NL Fin 61 – 0.34 0.061 – 8.3 124 < 0.001
Jap 102 – 0.26 0.059RL Fin 62 – 0.09 0.047 – 10.7 110 < 0.001
Jap 104 – 0.02 0.039OCB Fin 63 – 0.98 0.052 – 13.3 111 < 0.001
Jap 104 – 0.88 0.043ML Fin 62 0.37 0.026 – 9.7 132 < 0.001
Jap 99 0.41 0.027MH Fin 63 – 0.22 0.040 7.1 136 < 0.001
Jap 102 – 0.27 0.042LT Fin 58 – 0.18 0.036 – 13.7 131 < 0.001
Jap 102 – 0.10 0.040ACP Fin 63 – 0.47 0.040 3.7 138 < 0.001
Jap 103 – 0.50 0.043MW Fin 62 – 1.03 0.043 10.7 153 < 0.001
Jap 103 – 1.12 0.056JH Fin 54 – 1.47 0.054 7.3 115 < 0.001
Jap 67 – 1.55 0.055JT Fin 54 – 2.23 0.063 – 4.8 117 < 0.001
Jap 67 – 2.17 0.069—————————————————————————————————————————————————
between sexes was significant both in Finland andin Japan (Finland: t = – 2.7, df = 34, p = 0.011,Japan: t = – 2.9, df = 47, p = 0.006). When we ana-lysed the PC1 scores with a two-way ANOVA,
using population and sex as factors, we found amajor difference between populations, a minor dif-ference between sexes and no difference in thedegree of sexual dimorphism between populations

Kauhala et al. • ANN. ZOOL. FENNICI Vol. 3512
– 10 – 5 0 5 10Score
10
20
Cou
nt
FinlandJapan
A
– 3 – 2 – 1 0 1 2 3PC1
– 3
– 2
– 1
0
1
2
3
PC
2
Japan Finland
B
Fig. 6. Results of discrimi-nant (A) and principal com-ponent (B) analyses, basedon relative skull measure-ments [ln(measurement) –ln(skull size)] of Finnish andJapanese raccoon dogs.Eigenvalue for discriminantanalysis = 16.9, Wilks’ lamb-da = 0.056, F = 51.5, df = 21,p < 0.001.
(sex: F = 14.6, p < 0.001, area: F = 345.9, p < 0.001,sex × area: F = 0.008, NS). Male: female ratio was1.01 for skull size both in Finland and in Japan,and male: female ratio was 1.00 for OCP both inFinland and Japan, indicating no sexual dimorphismin skull or body size.
3.4.2. Tooth measurements
In Japan, no dimorphism existed, whereas 2/27dental measurements were dimorphic in Finland(Table 8). When we analysed the PC1 scores witha two-way ANOVA, we found a major differencebetween populations, no difference between sexesand no difference in the degree of sexual dimor-phism between populations (sex: F = 2.2, NS, area:F = 33.3, p < 0.001, sex × area: F = 0.06, NS).
4. Discussion
Finnish raccoon dogs are larger and have largerskulls than Japanese raccoon dogs; 20/22 abso-lute measurements were larger in Finland than inJapan. Ward and Wurster-Hill (1990) reported thatthe mean CL of viverrinus was 108.7 mm formales and 108.1 mm for females, which is some-what less than that reported here (mean 109.5mm). According to Ward and Wurster-Hill (1990),the mean CL for procyonoides males is 112.2 mmand for females 108.0 mm, and the mean CL fororestes males is 106.0 mm and for females 108.5mm. According to Stroganov (1969), ussuriensisis somewhat larger, with a mean CL of 122.0 mmfor males and 116.6 mm for females. All othersubspecies are thus probably smaller than ussuri-ensis, which has adapted to colder areas than the
– 2 – 1 0 1 2 3PC1
0
1
2
PC
2
Finland
– 3 – 2 – 1 0 1 2PC1
– 3
– 2
– 1
0
1
2
3
PC
2
MalesFemales
Japan
– 3
– 2
– 1
Fig. 7. Sexual dimorphism inFinnish and Japanese rac-coon dog skulls based onprincipal component analy-sis.

ANN. ZOOL. FENNICI Vol. 35 • Skull and tooth morphology of raccoon dogs 13
others. Adaptation to cold climate and monogamymay also explain the lack of sexual dimorphismin size; natural selection may have favored largefemales due to advantages in thermoregulation.Since ussuriensis is apparently strictly monoga-mous, natural selection has probably not favoredlarger males; in fact, larger size in males would
be disadvantageous, because large animals needmore food than smaller animals. Consequently,the optimum size for males might be the same asfor females.
The skulls of Finnish raccoon dogs are alsolarger relative to body weight; 15/21 measure-ments were larger in Finland than in Japan, rela-
Table 6. Dental measurements relative to size; p-values were corrected using sequential Bonferroni correction(Rice 1989).—————————————————————————————————————————————————Measurement n mean SD t df p—————————————————————————————————————————————————p1l Fin 37 – 1.29 0.044 1.42 56 NS
Jap 21 – 1.31 0.064p2l Fin 37 – 1.07 0.125 – 0.26 76 NS
Jap 41 – 1.06 0.082p3l Fin 37 – 1.01 0.033 – 3.39 77 < 0.001
Jap 42 – 0.99 0.028p4l Fin 38 – 0.94 0.040 – 2.79 91 NS
Jap 55 – 0.92 0.030p4w Fin 36 – 1.24 0.033 0.44 67 NS
Jap 32 – 0.84 0.033m1l Fin 39 – 0.71 0.023 – 5.45 106 < 0.001
Jap 69 – 0.68 0.027m1w Fin 39 – 1.09 0.023 – 8.37 106 < 0.001
Jap 69 – 1.05 0.028m1trig. Fin 37 – 0.93 0.041 – 1.27 104 NS
Jap 69 – 0.92 0.034m2l Fin 39 – 1.10 0.031 – 4.78 106 < 0.001
Jap 69 – 0.93 0.105m2w Fin 36 – 1.17 0.037 – 3.21 103 < 0.002
Jap 69 – 1.12 0.083m3 Fin 27 – 1.35 0.121 – 2.63 40 NS
Jap 15 – 1.27 0.063P1l Fin 35 – 1.24 0.042 0.45 57 NS
Jap 24 – 1.24 0.037P2l Fin 39 – 1.05 0.045 – 2.80 63 NS
Jap 26 – 1.03 0.036P3l Fin 39 – 0.98 0.037 – 3.73 75 < 0.001
Jap 38 – 0.95 0.024P4l Fin 37 – 0.79 0.028 – 5.83 98 < 0.001
Jap 63 – 0.76 0.026P4w Fin 37 – 1.05 0.034 – 1.62 97 NS
Jap 62 – 1.48 0.037P4 (min) Fin 37 – 1.13 0.034 – 0.90 98 NS
Jap 62 – 1.11 0.028M1l Fin 39 – 0.87 0.025 – 6.99 100 < 0.001
Jap 63 – 0.83 0.029M1w Fin 39 – 0.84 0.028 – 10.33 100 < 0.001
Jap 63 – 0.79 0.026M2l Fin 39 – 1.09 0.040 – 8.89 100 < 0.001
Jap 63 – 1.02 0.041M2w Fin 39 – 1.04 0.050 – 9.93 100 < 0.001
Jap 63 – 0.96 0.032—————————————————————————————————————————————————

Kauhala et al. • ANN. ZOOL. FENNICI Vol. 3514
tive to OCB. OCB has been shown to correlatewell with body weight (Martin 1980). The relative-ly smaller head of Japanese raccoon dogs may berelated to their less carnivorous diet (Fig. 8).
Differences were also apparent, however, inthe skull shape between Finnish and Japanese rac-coon dogs; 20/21 of the measurements relative tothe skull size differed among populations. Themandibles of the Finnish raccoon dogs were morerobust than those of the Japanese raccoon dogs,again indicating differences in diet. UT and LTand RL were, however, relatively longer in Japanthan in Finland, an indication of the very large
molars of Japanese raccoon dogs.PC was larger in Japan, both in absolute and
relative scale, than in Finland. The anterior fibersof the temporalis muscle are attached to the skullin the postorbital area in carnivores (Ewer 1985).When the postorbital area is concave (curved in-side) and consequently PC is small, the anteriorpart of the temporalis muscle is large. This meansan increase in the force of the fully opened jaw(Wiig 1982); thus, the small PC in Finnish rac-coon dogs correlates with the robust mandible andmore powerful jaws. The sagittal (interparietal)crest is also much more pronounced in Finnishthan in Japanese raccoon dogs (Fig. 4).
The absolute sizes of most teeth were largerin Finnish than in Japanese raccoon dogs. Theteeth of Japanese raccoon dogs were, however,larger relative to skull size, indicating that the teethprobably decrease in size more slowly than doesthe rest of the skull. This has resulted in the morecurved mandible in Japanese raccoon dogs; if the
Table 7. Sexual dimorphism in absolute skull mea-surements of Finnish and Japanese raccoon dogs.Size = condylobasal length – rostrum length, PL = pro-file length, CL = condylobasal length, ZB = zygomaticbreadth, RB = rostrum breadth, IC = interorbital cons-triction, PB = postorbital breadth, PC = postorbitalconstriction, SH = skull height, FPL = frontal + parietallength, NPL = nasal + premaxillary length, UT = uppertooth row, NL = nasal length, RL = rostrum length,OCB = condyle breadth, ML = mandible length, MH =mandible height, LT = lower tooth row, ACP = angularprocess – coronoid process, MW = mandible width,JH = jaw height and JT = jaw thickness; p-values werecorrected using sequential Bonferroni correction (Rice1989).————————————————————————Measurement Finland Japan————————————————————————Size – –PL – –CL – –ZB + +RB – –IC – –PB – –PC – –SH – –FPL – –NPL – +UT – –NL – +RL – –OCB – –ML – +MH – +LT – –ACP – –MW – –JH – –JT – –————————————————————————
Table 8. Sexual dimorphism in dental measurementsof Finnish and Japanese raccoon dogs; p-values werecorrected using sequential Bonferroni correction (Rice1989).————————————————————————Measurement Finland Japan————————————————————————i1l – –i2l – –i3l – –p1l – –p2l – –p3l – –p4l – –p4w – –m1l – –m1w + –m1trig. – –m2l – –m2w – –m3 – –I1l – –I2l – –I3l – –P1l – –P2l – –P3l – –P4l – –P4w – –P4 min w + –M1l – –M1w – –M2l – –M2w – –————————————————————————

ANN. ZOOL. FENNICI Vol. 35 • Skull and tooth morphology of raccoon dogs 15
mandible were not curved, not enough space wouldbe available for the relatively larger teeth. An in-teresting analogy exists between this and the evo-lution of the domestic dog (Canis familiaris):when domestic dogs evolved from wolves (C. lu-pus) the skulls also decreased in size, but the teethdecreased at a slower rate resulting in a morecurved mandible in the dog compared with thewolf (Clutton-Brock 1995).
The molars of Japanese raccoon dogs are es-pecially large compared with those of Finnish rac-coon dogs, and particularly the m2. The molarsare needed for grinding the chitinous exoskeletonsof insects and other invertebrates and coarse plantmaterial which are consumed more by Japanesethan by Finnish raccoon dogs (Ikeda 1985, Kauha-la et al. 1993b, Sasaki & Kawabata 1994, Fig. 8).
In conclusion, the differences in skull size andshape and tooth size most probably result fromdifferences in the diet; in Finland about 76% ofraccoon dog scats contained remains of mammals(Kauhala et al. 1993b), whereas Japanese raccoondogs rarely eat mammals (Ikeda 1985), i.e. theFinnish raccoon dogs are more carnivorous thanJapanese raccoon dogs. Japanese raccoon dogshave adapted to a milder climate, are smaller, andhave less powerful jaws but larger molars forgrinding insects and fruits than Finnish raccoondogs.
Acknowledgements: We are very grateful to R. Koivu-nen for assistance in cleaning the raccoon dog skulls. Wealso thank the hunters who provided us raccoon dog car-
casses. We are also very grateful to Juha Merilä and HannuPöysä for advice in the statistics.
References
Clutton-Brock, J. 1995: Origins of the dog: domesticationand early history. — In: Serpell, J. (ed.), The domesticdog, its evolution, behaviour and interactions with peo-ple. Cambridge University Press, Cambridge: 7–20.
Ellerman, J. R. & Morrison-Scott, T. C. S. 1951: Checklistof Palearctic and Indian Mammals 1758 to 1946. —The British Museum, London.
Ewer, R. F. 1985: The carnivores. — Cornell UniversityPress, Ithaca.
Helle, E. & Kauhala, K. 1991: Distribution history and pre-sent status of the raccoon dog in Finland. — HolarcticEcology 14: 278–286.
Ikeda, H. 1985: Regime alimentaire et domaine vital duchien viverrin au Japon. — Revue d’Ecologie la Terreet la Vie 40: 165–169.
Ikeda, H., Eguchi, K. & Ono, Y. 1979: Home range utiliza-tion of a raccoon dog. Nyctereutes procyonoides viver-rinus, Temminck, in a small islet in western Kyushu.— Japanese Journal of Ecology 29: 35–48.
Kauhala, K. & Helle, E. 1990: Age determination of theraccoon dog in Finland. — Acta Theriologica 35: 321–329.
Kauhala, K., Helle, E. & Taskinen, K. 1993a: Home rangeof the raccoon dog (Nyctereutes procyonoides) in south-ern Finland. — Journal of Zoology, London 231: 95–106.
Kauhala, K., Kaunisto, M. & Helle, E. 1993b: Diet of theraccoon dog, Nyctereutes procyonoides, in Finland. —Zeitschrift für Säugetierkunde 58: 129–136.
Korhonen, H., Mononen, J., Harri, M. & Aho, J. 1990: Supi-koiran evoluutio: Sattumaa vai sopeutumista? — Tur-kistalous 11/1990: 244–245.
mam
mals
birdseggs
lizards
frogsfish
insects
clams
crabsfruit
other plants
20
40
60
80
Finland Japan(n = 51)(n = 206)
Fre
quen
cy o
f occ
urre
nce
(%)
Fig. 8. Frequency of occur-rence of various food itemsin raccoon dog faeces dur-ing early summer in Finlandand Japan. Data for Finlandare from Kauhala et al.(1993b), and data for Japanare from Ikeda (1985).

Kauhala et al. • ANN. ZOOL. FENNICI Vol. 3516
Lavrov, N. P. [Lavrov, N. P.] 1971: [The results of intro-ductions of the raccoon dog (Nyctereutes procyonoides)in different provinces of the USSR]. — Trudy kafedrybiologii MGZPI 29: 101–166. [In Russian].
Mäkinen, A., Kuokkanen, M. T. & Valtonen, M. 1986: Achromosome-banding study in the Finnish and Japa-nese raccoon dog. — Hereditas 105: 97–105.
Martin, R. A. 1980: Body mass and basal metabolism ofextinct mammals. — Comp. Biochem. Physiol. 66A:307–314.
Mayr, E. 1976: Populations, species and evolution. An A-bridgment of animal species and evolution. — The Bel-knap Press of Harvard University Press, Massachusetts.
Morris, P. 1972: A review of mammalian age determina-tion methods. — Mammal Review 2: 69–101.
Nowak, E. 1984: Verbreitungs- und Bestandsentwicklungdes Marderhundes, Nyctereutes procyonoides (Gray,1834) in Europa. — Zeitschrift für Jagdwissenschaft30: 137–154.
Ranta, E., Rita, H. & Kouki, J. 1989: Biometria. Tilastotie-dettä biologeille. — Yliopistopaino, Helsinki.
Rice, W. R. 1989: Analyzing tables of statistical tests. —Evolution 43: 223–225.
Sasaki, H. & Kawabata, M. 1994: Food habits of the rac-coon dog Nyctereutes procyonoides viverrinus in amountaineous area of Japan. — Journal of Mammal-ogical Society of Japan 19: 1–8.
Simpson, G. G. 1941: Large Pleistocene felines of NorthAmerica. — American Museum Novitates 1136: 1–27.
Stroganov, S. U. 1969: Carnivorous Mammals of Siberia.— Israel Program for Scientific Translations, Jerusa-lem.
Ward, O. G. & Wurster-Hill, D. H. 1989: Ecological stud-ies of Japanese raccoon dogs, Nyctereutes proconoidesviverrinus. — Journal of Mammalogy 70: 330–334.
Ward O. G. & Wurster-Hill, D. H. 1990: Nyctereutes pro-cyonoides. — Mammalian Species 358:1–5.
Ward, O. G., Wurster-Hill, D. H., Ratty, F. J. & Song, Y.1987: Comparative cytogenetics of Chinese and Japa-nese raccoon dogs, Nyctereutes procyonoides. — Cyto-genet. Cell genet. 45: 177–186.
Wiig, O. 1982: Bone resorption in the skull of Mustela vison.— Acta Theriologica 27: 358–360.