skill premium divergence: the roles of trade, capital and demographics
TRANSCRIPT

Skill Premium Divergence: The Roles of Trade, Capital andDemographics
Sang-Wook (Stanley) Cho Julian P. DıazSchool of Economics Department of Economics
Australian School of Business Quinlan School of BusinessUniversity of New South Wales Loyola University Chicago
Prepared for the Bank of EstoniaOctober 2017
dslfkajsjk hjgjasgdasgdhasghjasg

What drives the patterns of the skill premium?
– No unanimous consensus reached on which factors definitively drivethe patterns of the skill premium (ws/wu), but a few hypotheseshave emerged as prime candidates:
– Technological change that favors skilled workers that arecomplementary to capital than unskilled workers.
– The expansion of trade that encourages production in sectorsthat use a particular type of labor intensively.
– Changes in the skill composition of the population that makeskilled/unskilled labor more abundant/scarce.
– Problem: most articles focus on one factor at a time, neglectingtheir potential interactions.
– Aimed at accounting episodes of skill premium increases ordecreases.
dslfkajsjk hjgjasgdasgdhasghjasg

What Do We Do?
– We construct a static general equilibrium model that incorporatesall three factors simultaneously.
– Our model allows us to assess the individual and joint effects ofeach factor on the skill premium.
– Since our framework includes factors that affect the demand andsupply for each type of labor, their overall effect could theoreticallylead to skill premium increases or decreases.
– To assess whether our model’s predictions are in line with the data,we apply it to account for the patterns of the skill premium in thethree Baltic states: Estonia, Latvia and Lithuania.
dslfkajsjk hjgjasgdasgdhasghjasg

Why the Baltics?
– As they transitioned from centrally-planned to free-market systems:
– Aggressively opened their economies to the rest of the world.
– Experienced rapid expansions in their stocks of capital.
– Went through significant changes in the skill composition oftheir labor forces.
– Moreover, they displayed very similar levels of the skill premium in1995 (around 1.8).
– Since then, the Baltic skill premia took divergent patterns.
dslfkajsjk hjgjasgdasgdhasghjasg

1.2
1.5
1.8
2.1
2.4
1995 1996 1997 1998 1999 2000 2001 2002 2003 2004 2005 2006 2007 2008
SkillPremiumEstonia,LatviaandLithuania
Latvia
Lithuania
Estonia
“Skill” definition is educational attainment: skilled workers are those with tertiaryeducation, unskilled workers are those with non-tertiary education.
Data from World Input Output Database (WIOD).
dslfkajsjk hjgjasgdasgdhasghjasg

70
80
90
100
110
120
130
1995 1996 1997 1998 1999 2000 2001 2002 2003 2004 2005 2006 2007 2008
SkillPremium (1995=100)
Latvia
Lithuania
Estonia
By 2008: skill premium in Latvia had increased by approximately 16%, while in Estonia
and Lithuania it had declined by around 20% and 13%, respectively.
dslfkajsjk hjgjasgdasgdhasghjasg

Although the Baltics are usually referred to as a homogeneous bloc, there are some
crucial differences along capital accumulation:
0
100
200
300
400
500
600
700
800
900
1995 1996 1997 1998 1999 2000 2001 2002 2003 2004 2005 2006 2007 2008
Equipment Capital Stock (1995 = 100) Estonia, Latvia and Lithuania
Latvia
Lithuania
Estonia
0
100
200
300
400
500
600
1995 1996 1997 1998 1999 2000 2001 2002 2003 2004 2005 2006 2007 2008
Structure Capital Stock (1995 = 100) Estonia, Latvia and Lithuania
Latvia
Lithuania
Estonia
Changes in Capital Stock (1995-2008)
Equipment Structures
Estonia Latvia Lithuania Estonia Latvia Lithuania431.0% 774.5% 620.5% 254.3% 387.7% 184.0%
Source: PWT and author’s calculations.
dslfkajsjk hjgjasgdasgdhasghjasg

Although the Baltics are usually referred to as a homogeneous bloc, there are some
crucial differences in the relative skill supply:
0
50
100
150
200PopulationwithTertiaryEducation(1995=100)
Series1 Series2 Series3 Series4
Estonia Latvia Lithuania
1995 2000 2005 20081995 2000 2005 20081995 2000 2005 200860
80
100
120PopulationwithoutTertiaryEducation (1995=100)
Series1 Series2 Series3 Series4 1995 2000 2005 20081995 2000 2005 20081995 2000 2005 2008
Estonia Latvia Lithuania
Changes in Skill Composition of Population Ages 15+ (1995-2008)
Tertiary Education Non-Tertiary Education
Estonia Latvia Lithuania Estonia Latvia Lithuania53.0% 31.0% 91.1% -15.3% -5.8% -12.7%
Source: Barro and Lee educational attainment database.
Estonia’s tertiary educated population increased from 0.21 to 0.32 million during this period.
dslfkajsjk hjgjasgdasgdhasghjasg

Although the Baltics are usually referred to as a homogeneous bloc, there are some
crucial differences in the patterns of terms of trade:
60
80
100
120
140
160
1995 1996 1997 1998 1999 2000 2001 2002 2003 2004 2005 2006 2007 2008
TermsofTrade(Goods)(1995=100)
Lithuania
Latvia
Estonia
60
80
100
120
140
160
1995 1996 1997 1998 1999 2000 2001 2002 2003 2004 2005 2006 2007 2008
TermsofTrade(Services)(1995=100)
Lithuania
Latvia
Estonia
Changes in Terms of Trade (1995-2008)
Goods Services
Estonia Latvia Lithuania Estonia Latvia Lithuania14.5% -10.9% 29.9% 34.0% 8.3% 41.8%
Source: AMECO database
dslfkajsjk hjgjasgdasgdhasghjasg

– Summarizing:
– Equipment capital grew at the fastest rate in Latvia and theslowest in Estonia.
– Skilled population grew faster in Lithuania and Estonia and moreslowly in Latvia.
– Unskilled population shrank faster in Estonia and Lithuania andmore slowly in Latvia.
– Terms of trade in the goods sector improved in Estonia andLithuania, but worsened in Latvia.
dslfkajsjk hjgjasgdasgdhasghjasg

The Model
– Main ingredients:
– Two-country static general equilibrium model: Baltic state andROW.
– Impose small-economy assumption on Baltic state.
– Agents: households, firms, government, rest of the world.
– Two types of labor: skilled (`s) and unskilled (`u).Two types of capital: equipment (ke) and structures (kz).
– Multi-sector model: goods and services with different skillintensities.
dslfkajsjk hjgjasgdasgdhasghjasg

Flow chart aggregate economy
Households Producers
Government
Rest of theWorld
direct taxes
capital (equipment and structures)labor (skilled and unskilled)
goods and services
indirect taxestariffs
goods and services
inter/intraindustry
transactions
goods and services
importedcomponentssavings
(trade balance)
dslfkajsjk hjgjasgdasgdhasghjasg

Production plans
domesticproduction
firms
finalproduction
firms
intermediateinputs
labor(skilled and unskilled)
importedgoods(m)
capital (equipment and structure)
dslfkajsjk hjgjasgdasgdhasghjasg
Final goods production
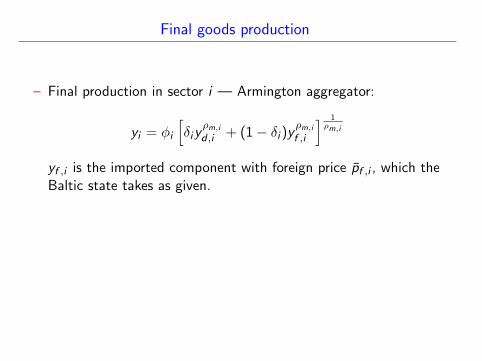
– Final production in sector i — Armington aggregator:
yi = φi
[δiy
ρm,id ,i + (1− δi )y
ρm,if ,i
] 1ρm,i
yf ,i is the imported component with foreign price pf ,i , which theBaltic state takes as given.
– ρm,i is the parameter that governs the elasticity of substitutionbetween domestic and imported components in sector i
– Imports of commodity i are subject to ad-valorem tariff rate τf ,i(negligible for the Baltics)
dslfkajsjk hjgjasgdasgdhasghjasg

Final goods production
– Final production in sector i — Armington aggregator:
yi = φi
[δiy
ρm,id ,i + (1− δi )y
ρm,if ,i
] 1ρm,i
yf ,i is the imported component with foreign price pf ,i , which theBaltic state takes as given.
– ρm,i is the parameter that governs the elasticity of substitutionbetween domestic and imported components in sector i
– Imports of commodity i are subject to ad-valorem tariff rate τf ,i(negligible for the Baltics)
dslfkajsjk hjgjasgdasgdhasghjasg

Domestic goods production
– Domestic component production in sector i — Nested CES:
yd,i = min
x1,ia1,i
, . . . ,xn,ian,i
, βikαi
z,i
[λi
[µik
ρe,i + (1− µi )`
ρs,i
]σρ
+ (1− λi )`σu,i] 1−αi
σ
– αi , µi and λi are the share parameters of inputs in value added
– ρ captures the elasticity of substitution between equipment andskilled labor; and σ governs the elasticity of substitution betweenunskilled labor and equipment or skilled labor
– “Capital-skill complementarity” when σ > ρ (or 11−σ >
11−ρ)
dslfkajsjk hjgjasgdasgdhasghjasg

Household
– Utility function of household of type j :
Uj =
ζj(∑
i∈Iθji c
ηi ,j + θjinv (cinv ,j + cb,j)
η
)ψη
+ (1− ζj)(Lj − `j)ψ
1ψ
subject to
∑i∈I
pici ,j + pinv (cinv ,j + cb,j) = (1− t jd)(wj`j + re ke,j + rz kz,j)
– cinv ,j and cb,j refer to domestic savings and government-issuedbonds.
dslfkajsjk hjgjasgdasgdhasghjasg

Skill Premium in the Model
– Using the FOCs, we can derive the expression for the skill premium:
ws
wu=
λi (1− µi )
1− λi
[µi
(ke,i`s,i
)ρ+ (1− µi )
]σ−ρρ
(`s,i`u,i
)σ−1
– Expressing in growth rates terms (γ):
γSP ' µi (σ − ρ)
(ke,i`s,i
)ρ(γke,i − γ`s,i ) + (σ − 1)(γ`s,i − γ`u,i )
– First term: if σ > ρ, increases in equipment capital lead toincreases in the skill premium in presence of equipment-skillcomplementarity.
– Second term: relative growth rates of skilled and unskilled laboraffect the skill premium.
– Cross-sector reallocation of factors—due to trade shocks, forexample—will also affect skill premium.
dslfkajsjk hjgjasgdasgdhasghjasg

Calibration and Data
– Our model is calibrated so that it matches Estonian, Latvian andLithuanian data in 1995.
– Most of the parameters can be directly calibrated from SocialAccounting Matrices we construct for each country using theoptimality and market-clearing conditions. SAM
– Elasticity parameters taken from the literature. We later runsensitivity checks on those values.
Parameter Value Corresponding Elasticity Implied Elasticity
ρm,i 0.827 Import elasticity of substitution 5.78ρx 0.9 Export elast. of subst. 10ρ -0.5 Equipment-skilled labor elast. 0.67σ 0.4 Equipment-unskilled labor elast. 1.67η -1 Consumption goods elast. of subst. 0.5ψ -0.25 Consumption-leisure elast. of subst. 0.8
dslfkajsjk hjgjasgdasgdhasghjasg

Numerical Experiments: Description
– Comparative statics experiments:
– ToT experiment: replicates changes in ToT experienced byBaltic states between 1995 and 2008 by varying foreign prices.
– Capital-deepening experiment: replicates increases in both typesof capital stocks by increasing their endowments.
– Skill supply experiment: increase endowments of skilled andunskilled labor to match those observed in the Baltics.
– Joint experiment: simulates all three shocks simultaneously.
– In each instance, we compare original and new equilibria and assessthe effects of each shock on the skill premium.
dslfkajsjk hjgjasgdasgdhasghjasg

Results - SP changes
Estonia Latvia Lithuania
Data -20.2 16.3 -13.1Experiment
ToT -2.2 -1.9 -1.3Capital deepeningSkill composition
– ToT experiment predicts skill premium declines due to H-O type reallocation ofresources towards unskilled-intensive sectors where Baltics enjoy comparativeadvantages. ToT
– Capital deepening predicts skill premium increases due to equipment-skillcomplementarity. Note that the effect is the strongest in Latvia, which recordedthe largest increase in equipment capital.
– Skill composition predicts skill premium decreases due to skilled labor becomingmore abundant and unskilled labor scarcer.
– Joint experiment: skill premium decreases in Estonia and Lithuania, andincrease in Latvia.
– Overall, our model is able to replicate Baltic divergence. Qualitative results arein line with data. Moreover, quantitative predictions fairly accurate.
dslfkajsjk hjgjasgdasgdhasghjasg

Results - SP changes
Estonia Latvia Lithuania
Data -20.2 16.3 -13.1Experiment
ToTCapital deepening 27.0 49.3 28.9Skill composition
– ToT experiment predicts skill premium declines due to H-O type reallocation ofresources towards unskilled-intensive sectors where Baltics enjoy comparativeadvantages.
– Capital deepening predicts skill premium increases due to equipment-skillcomplementarity. Note that the effect is the strongest in Latvia, which recordedthe largest increase in equipment capital. capital
– Skill composition predicts skill premium decreases due to skilled labor becomingmore abundant and unskilled labor scarcer.
– Joint experiment: skill premium decreases in Estonia and Lithuania, andincrease in Latvia.
– Overall, our model is able to replicate Baltic divergence. Qualitative results arein line with data. Moreover, quantitative predictions fairly accurate.
dslfkajsjk hjgjasgdasgdhasghjasg

Results - SP changes
Estonia Latvia Lithuania
Data -20.2 16.3 -13.1Experiment
ToTCapital deepeningSkill composition -41.5 -28.2 -53.6
– ToT experiment predicts skill premium declines due to H-O type reallocation ofresources towards unskilled-intensive sectors where Baltics enjoy comparativeadvantages.
– Capital deepening predicts skill premium increases due to equipment-skillcomplementarity. Note that the effect is the strongest in Latvia, which recordedthe largest increase in equipment capital.
– Skill composition predicts skill premium decreases due to skilled labor becomingmore abundant and unskilled labor scarcer. skill
– Joint experiment: skill premium decreases in Estonia and Lithuania, andincrease in Latvia.
– Overall, our model is able to replicate Baltic divergence. Qualitative results arein line with data. Moreover, quantitative predictions fairly accurate.
dslfkajsjk hjgjasgdasgdhasghjasg

Results - SP changes
Estonia Latvia Lithuania
Data -20.2 16.3 -13.1Joint experiment -22.4 9.8 -35.3
ToT -2.2 -1.9 -1.3Capital deepening 27.0 49.3 28.9Skill composition -41.5 -28.2 -53.6
– ToT experiment predicts skill premium declines due to H-O type reallocation ofresources towards unskilled-intensive sectors where Baltics enjoy comparativeadvantages.
– Capital deepening predicts skill premium increases due to equipment-skillcomplementarity. Note that the effect is the strongest in Latvia, which recordedthe largest increase in equipment capital.
– Skill composition predicts skill premium decreases due to skilled labor becomingmore abundant and unskilled labor scarcer.
– Joint experiment: skill premium decreases in Estonia and Lithuania, andincrease in Latvia.
– Overall, our model is able to replicate Baltic divergence. Qualitative results arein line with data. Moreover, quantitative predictions fairly accurate.
dslfkajsjk hjgjasgdasgdhasghjasg

Results - SP changes
Estonia Latvia Lithuania
Data -20.2 16.3 -13.1Joint experiment -22.4 9.8 -35.3
ToT -2.2 -1.9 -1.3Capital deepening 27.0 49.3 28.9Skill composition -41.5 -28.2 -53.6
– ToT experiment predicts skill premium declines due to H-O type reallocation ofresources towards unskilled-intensive sectors where Baltics enjoy comparativeadvantages.
– Capital deepening predicts skill premium increases due to equipment-skillcomplementarity. Note that the effect is the strongest in Latvia, which recordedthe largest increase in equipment capital.
– Skill composition predicts skill premium decreases due to skilled labor becomingmore abundant and unskilled labor scarcer.
– Joint experiment: skill premium decreases in Estonia and Lithuania, andincrease in Latvia.
– Overall, our model is able to replicate Baltic divergence. Qualitative results arein line with data. Moreover, quantitative predictions fairly accurate.
dslfkajsjk hjgjasgdasgdhasghjasg
Sensitivity Analysis 1 – Model Performance in Shorter Horizons
1995-2000 2000-2008
SP changes Estonia Latvia Lithuania Estonia Latvia Lithuania
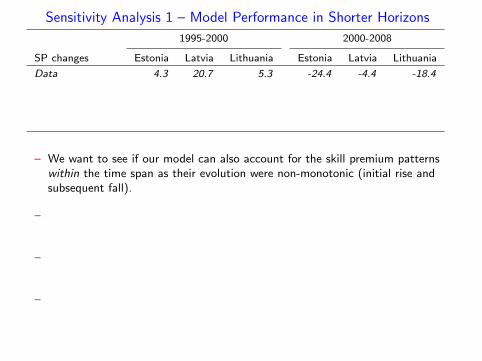
Data 4.3 20.7 5.3 -24.4 -4.4 -18.4Joint -18.0 31.3 3.5 1.4 -8.6 -34.4ToT -1.0 -2.6 -0.7 -0.5 0.5 0.5Capital deepening 12.0 22.7 14.4 26.8 39.5 23.9Skill supply -27.1 10.1 -9.5 -21.2 -37.0 -49.9
– We want to see if our model can also account for the skill premium patternswithin the time span as their evolution were non-monotonic (initial rise andsubsequent fall).
– Our model reproduces an inverse U-shaped evolution of the skill premium inLatvia and Lithuania, but not in Estonia.
– In fact, the labor supply factors seem to have a lagged effect on the skillpremium in Estonia, which our model cannot capture.
– Country-specific institutional factors in the labor market – Toomet (2011)
dslfkajsjk hjgjasgdasgdhasghjasg

Sensitivity Analysis 1 – Model Performance in Shorter Horizons
1995-2000 2000-2008
Experiment Estonia Latvia Lithuania Estonia Latvia Lithuania
Data 4.3 20.7 5.3 -24.4 -4.4 -18.4Joint -18.0 31.3 3.5 1.4 -8.6 -34.4
ToT -1.0 -2.6 -0.7 -0.5 0.5 0.5Capital deepening 12.0 22.7 14.4 26.8 39.5 23.9Skill supply -27.1 10.1 -9.5 -21.2 -37.0 -49.9
– We want to see if our model can also account for the skill premium patternswithin the time span as their evolution were non-monotonic (initial rise andsubsequent fall).
– Our model reproduces an inverse U-shaped evolution of the skill premium inLatvia and Lithuania, but not in Estonia.
– In fact, the labor supply factors seem to have a lagged effect on the skillpremium in Estonia, which our model cannot capture.
– Country-specific institutional factors in the labor market – Toomet (2011)
dslfkajsjk hjgjasgdasgdhasghjasg

Sensitivity Analysis 2 – Changes in Technology ParametersChange in Skill Premium
(Cobb-Douglas) (Benchmark) (Polgreen-Silos)
Country Experimentρ = 0 ρ = −0.5 ρ = −0.357σ = 0 σ = 0.4 σ = 0.659
Estonia Joint -49.6 -22.4 -4.8ToT -3.3 -2.2 -1.3Capital deepening -0.8 27.0 33.2Skill supply -48.7 -41.5 -31.1
Latvia Joint -34.5 9.8 37.2ToT -2.4 -1.9 -1.4Capital deepening -1.7 49.3 71.7Skill supply -31.3 -28.2 -22.5
Lithuania Joint -59.4 -35.3 -15.4ToT -2.1 -1.3 -0.7Capital deepening -0.4 28.9 39.5Skill supply -59.4 -53.6 -43.6
– With the Cobb-Douglas specification, we abstract from capital-skillcomplementarity and the skill premium only depends on the relative skill supplyand trade channels.
– Our qualitative results crucially hinge on the capital-skill complementaritychannel.
dslfkajsjk hjgjasgdasgdhasghjasg

Sensitivity Analysis 3 – Changes in Preference ParametersChange in Skill Premium
(Log utility) (Benchmark) (Cobb-Douglas) (Inel. labor)
Country Experimentη = 0 η = −1 η = −1 η = −1
ψ = −0.25 ψ = −0.25 ψ = 0 ψ = −1.5 ζj = 1
Estonia Joint -22.4 -22.4 -21.0 -26.3 -17.9ToT -2.2 -2.2 -2.2 -2.1 -2.5Capital Deepening 27.0 27.0 24.1 35.8 25.0Skill Supply -41.5 -41.5 -38.5 -49.0 -36.4
Latvia Joint 10.0 9.8 9.0 13.1 22.4ToT -1.8 -1.9 -1.7 -2.6 -2.3Capital Deepening 49.3 49.3 44.2 67.5 59.2Skill Supply -28.2 -28.2 -25.7 -35.1 -25.3
Lithuania Joint -35.4 -35.3 -32.7 -42.8 -24.2ToT -1.5 -1.3 -1.4 -0.6 -1.9Capital Deepening 28.9 28.9 25.3 40.8 32.8Skill Supply -53.6 -53.6 -49.5 -63.4 -47.4
– The lower the elasticity between consumption and leisure, the larger thechanges in the skill premium.
– Labor-leisure margin changes the relative magnitude of the skill premiumchanges. Our qualititavie results are still maintained under an inelastic laborsupply assumption.
dslfkajsjk hjgjasgdasgdhasghjasg

Conclusions
– We construct a static general equilibrium model to account for theevolution of the skill premium.
– Our model incorporates forces that have a biased effect on thedemand for skilled and unskilled labor: international trade andcapital-skill complementarity.
– Unlike the large majority of recent articles, our model alsoincorporate factors that affect the supply of labor.
– To assess the quantitative validity of the model’s predictions, weapply it to account for the divergent patterns of the skill premiumin the Baltic states between 1995 and 2008.
dslfkajsjk hjgjasgdasgdhasghjasg

Conclusions
– Incorporating all forces together, we can qualitatively account forthe Baltic skill premium divergence with a fair degree ofquantitative success.
– For shorter horizons, our model is able to replicate the initial riseand subsequent fall of the skill premium in Latvia and Lithuania,although not for Estonia.
– Our results are robust to the choices of trade and preferenceelasticities, while the sensitivity analyses highlight the capital-skillcomplementarity channel.
dslfkajsjk hjgjasgdasgdhasghjasg

SAM Estonia 1995 (Unit: Euro, Millions)
(Unskilled) (Skilled)Goods 1544.9 948.5 0.0 0.0 0.0 1109.8 734.2 375.6 443.3 24.9 1199.0 5270.3Service 981.8 4495.3 0.0 0.0 0.0 541.1 342.4 198.7 336.7 676.3 466.4 7497.5Labor 483.0 1100.6 0.0 0.0 0.0 0.0 0.0 0.0 0.0 0.0 0.0 1583.6
(Unskilled) 351.9 473.1 0.0 0.0 0.0 0.0 0.0 0.0 0.0 0.0 0.0 825.0(Skilled) 131.1 627.5 0.0 0.0 0.0 0.0 0.0 0.0 0.0 0.0 0.0 758.6
Capital equipment 50.0 147.1 0.0 0.0 0.0 0.0 0.0 0.0 0.0 0.0 0.0 197.1(Unskilled) 41.4 121.8 0.0 0.0 0.0 0.0 0.0 0.0 0.0 0.0 0.0 163.1(Skilled) 8.6 25.4 0.0 0.0 0.0 0.0 0.0 0.0 0.0 0.0 0.0 34.0
Capital structure 166.4 489.8 0.0 0.0 0.0 0.0 0.0 0.0 0.0 0.0 0.0 656.2(Unskilled) 137.7 405.3 0.0 0.0 0.0 0.0 0.0 0.0 0.0 0.0 0.0 543.0(Skilled) 28.7 84.5 0.0 0.0 0.0 0.0 0.0 0.0 0.0 0.0 0.0 113.2
Households 0.0 0.0 1583.6 197.1 656.2 0.0 0.0 0.0 0.0 0.0 0.0 2437.0Government 291.6 37.8 0.0 0.0 0.0 402.1 252.6 149.5 0.0 0.0 0.0 731.4
Direct Tax 0.0 0.0 0.0 0.0 0.0 402.1 252.6 149.5 0.0 0.0 0.0 402.1Indirect Tax 291.2 37.8 0.0 0.0 0.0 0.0 0.0 0.0 0.0 0.0 0.0 329.0Tariff 0.3 0.0 0.0 0.0 0.0 0.0 0.0 0.0 0.0 0.0 0.0 0.3
Leisure 0.0 0.0 0.0 0.0 0.0 2623.1 1423.1 1200.0 0.0 0.0 0.0 2623.1Capital (Saving) 0.0 0.0 0.0 0.0 0.0 384.0 201.9 182.1 0.0 30.3 365.7 780.0Import 1752.7 278.4 0.0 0.0 0.0 0.0 0.0 0.0 0.0 0.0 0.0 2031.1Total 5270.3 7497.5 1583.6 197.1 656.2 5060.1 2954.2 2105.8 780.0 731.4 2031.1 0.0
C I G X TotalCK (structure)
Goods Service LK
(equipment)
back
dslfkajsjk hjgjasgdasgdhasghjasg
ToT Experiment back
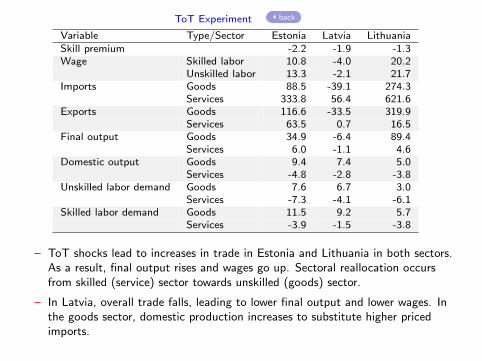
Variable Type/Sector Estonia Latvia LithuaniaSkill premium -2.2 -1.9 -1.3Wage Skilled labor 10.8 -4.0 20.2
Unskilled labor 13.3 -2.1 21.7Imports Goods 88.5 -39.1 274.3
Services 333.8 56.4 621.6Exports Goods 116.6 -33.5 319.9
Services 63.5 0.7 16.5Final output Goods 34.9 -6.4 89.4
Services 6.0 -1.1 4.6Domestic output Goods 9.4 7.4 5.0
Services -4.8 -2.8 -3.8Unskilled labor demand Goods 7.6 6.7 3.0
Services -7.3 -4.1 -6.1Skilled labor demand Goods 11.5 9.2 5.7
Services -3.9 -1.5 -3.8
– ToT shocks lead to increases in trade in Estonia and Lithuania in both sectors.As a result, final output rises and wages go up. Sectoral reallocation occursfrom skilled (service) sector towards unskilled (goods) sector.
– In Latvia, overall trade falls, leading to lower final output and lower wages. Inthe goods sector, domestic production increases to substitute higher pricedimports.
dslfkajsjk hjgjasgdasgdhasghjasg

Capital Deepening Experiment
Variable Type/Sector Estonia Latvia LithuaniaSkill premium 27.0 49.3 28.9Wage Skilled labor 82.9 175.8 114.2
Unskilled labor 44.0 84.8 66.2Rental price Equipment capital -85.7 -88.1 -88.3Final output Goods 42.3 83.2 60.7
Services 51.5 97.3 68.7Domestic output Goods 49.9 96.9 74.7
Services 52.8 99.1 69.3Equipment capital demand Goods 494.9 1064.5 799.4
Services 409.3 671.7 544.9Unskilled labor demand Goods -3.1 -10.5 -10.8
Services -1.7 -6.4 -4.0Skilled labor demand Goods 8.9 42.9 29.3
Services -6.7 -5.3 -7.3
– Increases in the stock of capital drive down the rental prices of capital which inturn raise the demand for capital in all sectors.
– With larger stocks of capital, both domestic and final output increase in allsectors. Wages increase too.
– Equipment capital deepening affects the demands of the two types of labordifferently, favoring skilled over unskilled labor. back
dslfkajsjk hjgjasgdasgdhasghjasg

Skill Composition Experiment
Variable Type/Sector Estonia Latvia LithuaniaSkill premium -41.5 -28.2 -53.6Wage Skilled labor -30.1 -23.2 -45.1
Unskilled labor 19.5 7.1 18.3Final output Goods 2.9 0.1 4.1
Services 9.0 4.3 11.7Domestic output Goods 1.4 -1.1 2.6
Services 9.6 4.6 12.1All sectors 6.9 2.9 8.9
Hours worked Unskilled labor -21.8 -4.7 -8.5Skilled labor 58.7 29.4 84.4Total labor 16.7 4.4 30.6
Unskilled labor demand Goods -16.8 -6.8 -12.6Services -25.5 -11.2 -27.3
Skilled labor demand Goods 64.8 30.5 100.9Services 57.4 34.1 105.5
– Despite mixed effects in the hours worked by different skill types, total hoursworked rise for all countries. This leads to higher aggregate output – final anddomestic.
– As unskilled labor become scarcer, its wage rises. Vice versa for skilled labor.
– Changes in the relative wages translate into changes in the relative demand forskilled and unskilled workers. back
dslfkajsjk hjgjasgdasgdhasghjasg