skf half-year results 2014 tom johnstone, president and ceo 15 july 2014
TRANSCRIPT
SKF Half-year results 2014Tom Johnstone, President and CEO
15 July 2014
© SKF Group 15 July 2014
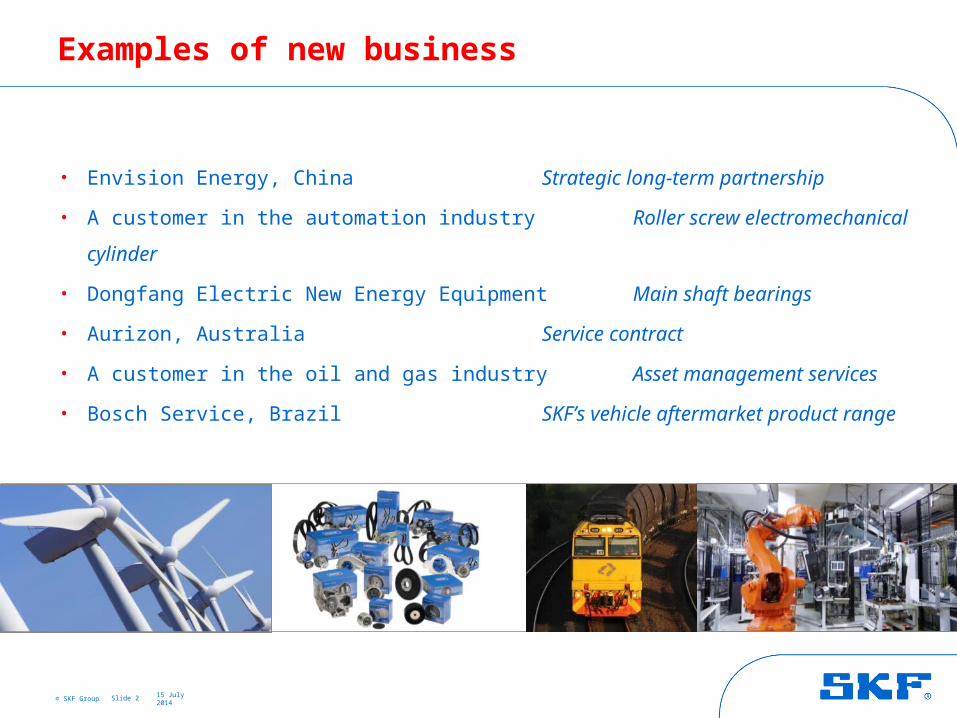
Examples of new business
• Envision Energy, China Strategic long-term partnership
• A customer in the automation industry Roller screw electromechanical cylinder
• Dongfang Electric New Energy Equipment Main shaft bearings
• Aurizon, Australia Service contract
• A customer in the oil and gas industry Asset management services
• Bosch Service, Brazil SKF’s vehicle aftermarket product range
Slide 2

© SKF Group 15 July 2014
Highlights
• Inauguration of SKF Campus and SKF North East Asia Distribution Centre in Shanghai.
• New SKF Solution Factory in Nieuwegein in the Netherlands.
• Events during the quarter:- SKF Wind Farm Management Conference in Berlin
- SKF Life Cycle Management Conference in Buenos Aires- SKF Asset Management Conference in Prague
Slide 3

© SKF Group 15 July 2014
Customer awards
Slide 4
• Best Technical and Service Award 2013 – Envision Energy, China
• Supplier Excellence Award 2013 – National Oilwell Varco (NOV), USA
• Premium Supplier Award – Joy Global Underground Mining LLC, USA
• Marine Supplier of the year Award 2014 – Rolls-Royce Marine
• Excellent Supplier Award – ABB Marine, China
• Supplier Certification of Appreciation – Nissan, China
• Quality Gold Award 2013 – Yamaha Motor Company
• The Qualitas Award – Fiat/Chrysler, Argentina

© SKF Group 15 July 2014
New products and solutions
Slide 5
SKF Wireless MicroVibe
SKF Wireless Machine Condition Sensor
SKF @ptitude Connect
SKF Shaft Alignment Tool
Low friction grease for hub bearing units
SKF Gear Bearing Unit
Floating piston
Electric grease transfer pump
SKF Tachometer
Low torque operator valve solution
Turbulo BlueMon emission monitoring system
© SKF Group 15 July 2014
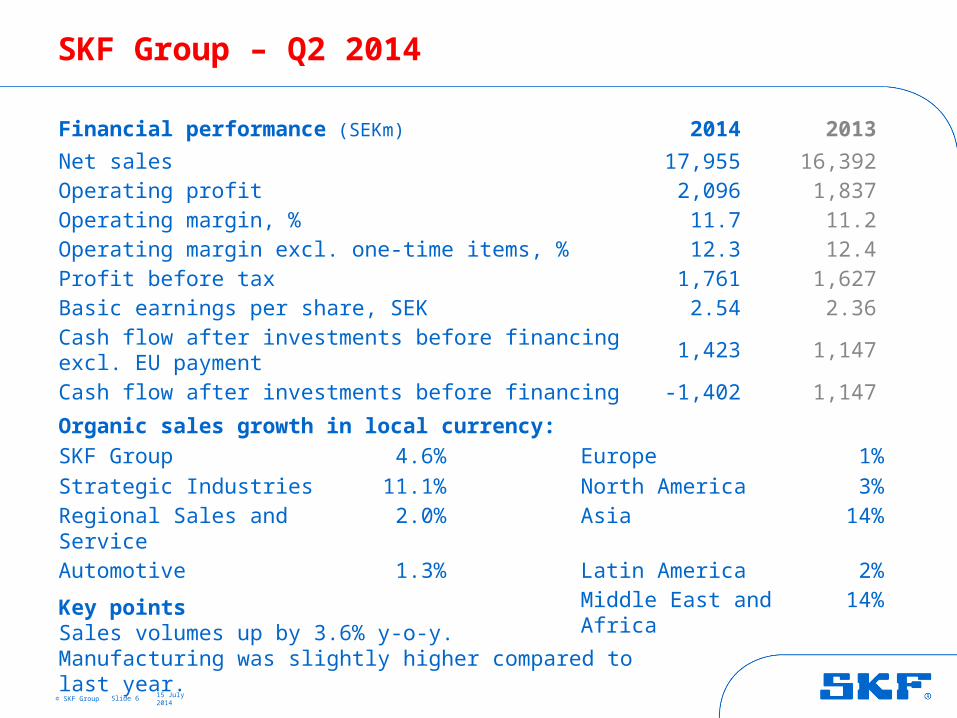
SKF Group – Q2 2014
Slide 6
Financial performance (SEKm) 2014 2013
Net sales 17,955 16,392Operating profit 2,096 1,837Operating margin, % 11.7 11.2Operating margin excl. one-time items, % 12.3 12.4Profit before tax 1,761 1,627Basic earnings per share, SEK 2.54 2.36Cash flow after investments before financing excl. EU payment 1,423 1,147Cash flow after investments before financing -1,402 1,147
Organic sales growth in local currency:
SKF Group 4.6% Europe 1%
Strategic Industries 11.1% North America 3%Regional Sales and Service 2.0% Asia 14%
Automotive 1.3% Latin America 2%Middle East and Africa 14%
Key pointsSales volumes up by 3.6% y-o-y.Manufacturing was slightly higher compared to last year.
© SKF Group 15 July 2014
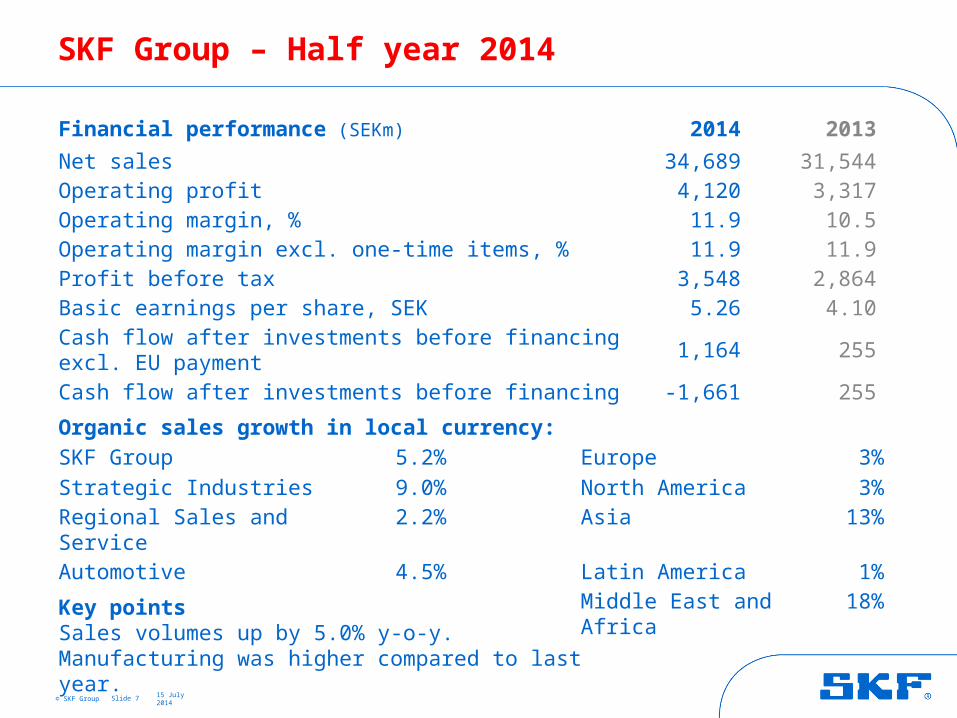
SKF Group – Half year 2014
Slide 7
Financial performance (SEKm) 2014 2013
Net sales 34,689 31,544Operating profit 4,120 3,317Operating margin, % 11.9 10.5Operating margin excl. one-time items, % 11.9 11.9Profit before tax 3,548 2,864Basic earnings per share, SEK 5.26 4.10Cash flow after investments before financing excl. EU payment 1,164 255Cash flow after investments before financing -1,661 255
Organic sales growth in local currency:
SKF Group 5.2% Europe 3%
Strategic Industries 9.0% North America 3%Regional Sales and Service 2.2% Asia 13%
Automotive 4.5% Latin America 1%Middle East and Africa 18%
Key pointsSales volumes up by 5.0% y-o-y.Manufacturing was higher compared to last year.

© SKF Group 15 July 2014
Organic sales growth in local currency
Slide 8
% changey-o-y
2012 2013 2014

© SKF Group 15 July 2014
Organic sales growth in local currency
Slide 9
% y-o-y
Structure in 2012: 0.4%Structure in 2013: 2.5%Structure in 2014: 4.2%
-2.5%
-0.7%
5.2%

© SKF Group 15 July 2014
Sales development by geographyOrganic growth in local currency Q2 2014 vs Q2 2013
Slide 10
Europe1%
Asia/Pacific14%
Middle East& Africa
14%
LatinAmerica
2%
NorthAmerica
3%

© SKF Group 15 July 2014
Sales development by geographyOrganic growth in local currency YTD 2014 vs YTD 2013
Slide 11
Europe3%
Asia/Pacific13%
Middle East& Africa
18%
LatinAmerica
1%
NorthAmerica
3%
© SKF Group 15 July 2014
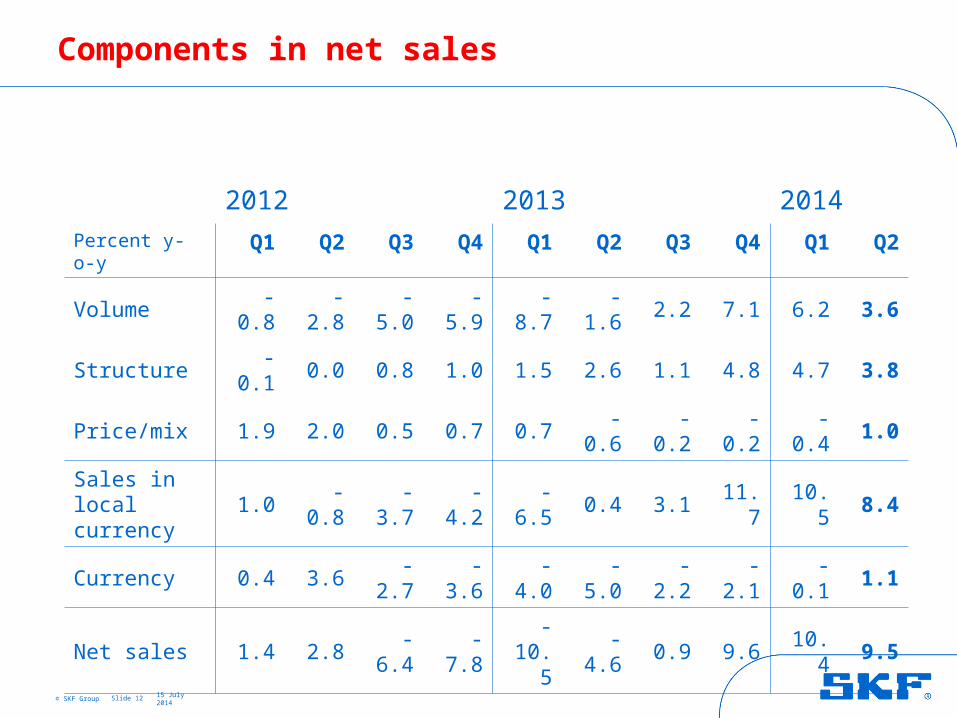
Components in net sales
Slide 12
2012 2013 2014
Percent y-o-y Q1 Q2 Q3 Q4 Q1 Q2 Q3 Q4 Q1 Q2
Volume -0.8 -2.8 -5.0 -5.9 -8.7 -1.6 2.2 7.1 6.2 3.6
Structure -0.1 0.0 0.8 1.0 1.5 2.6 1.1 4.8 4.7 3.8
Price/mix 1.9 2.0 0.5 0.7 0.7 -0.6 -0.2 -0.2 -0.4 1.0
Sales in local currency
1.0 -0.8 -3.7 -4.2 -6.5 0.4 3.1 11.7 10.5 8.4
Currency 0.4 3.6 -2.7 -3.6 -4.0 -5.0 -2.2 -2.1 -0.1 1.1
Net sales 1.4 2.8 -6.4 -7.8 -10.5 -4.6 0.9 9.6 10.4 9.5
© SKF Group 15 July 2014
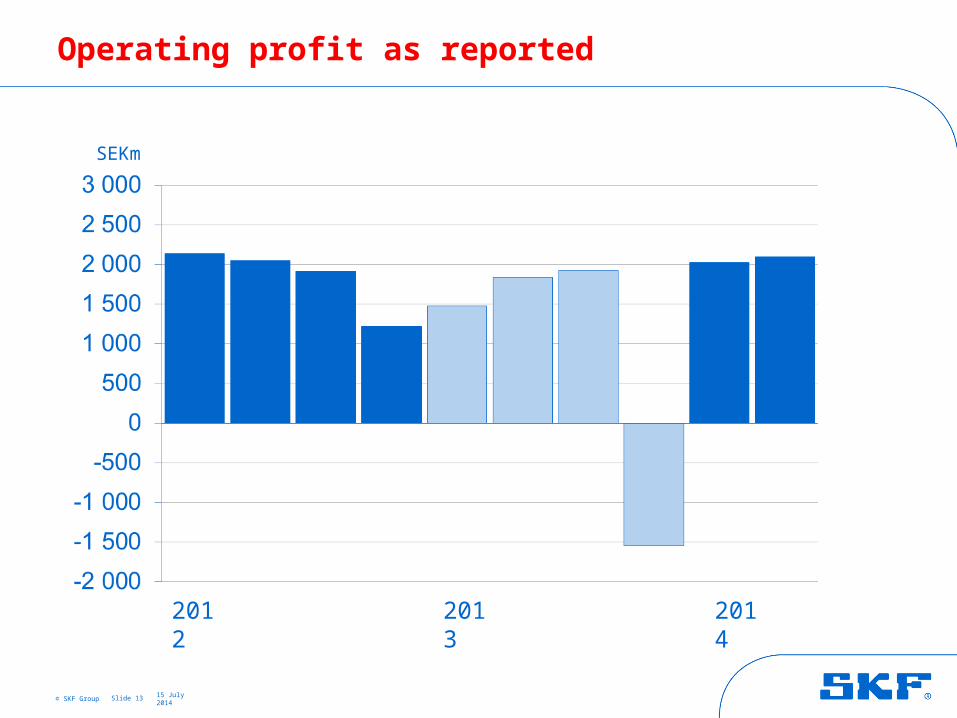
Operating profit as reported
Slide 13
SEKm
2012 2013 2014

© SKF Group 15 July 2014
Operating profit excluding one-time items
Slide 14
SEKm
2012 2013 2014
© SKF Group 15 July 2014
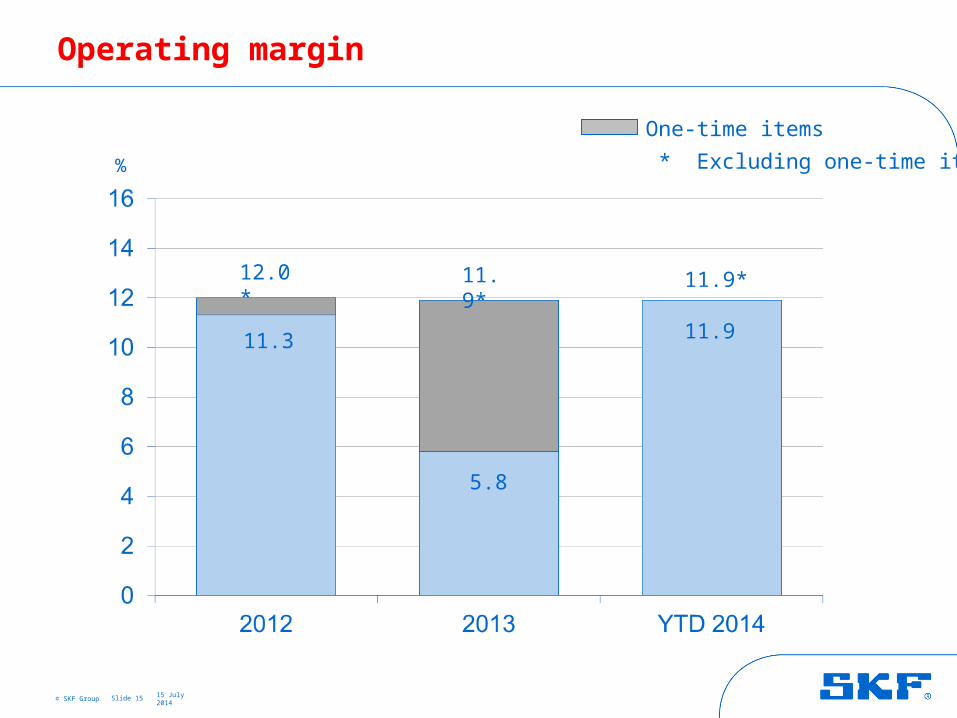
Operating margin
Slide 15
%
5.8
11.3
12.0* 11.9*
One-time items
* Excluding one-time items
11.9*
11.9
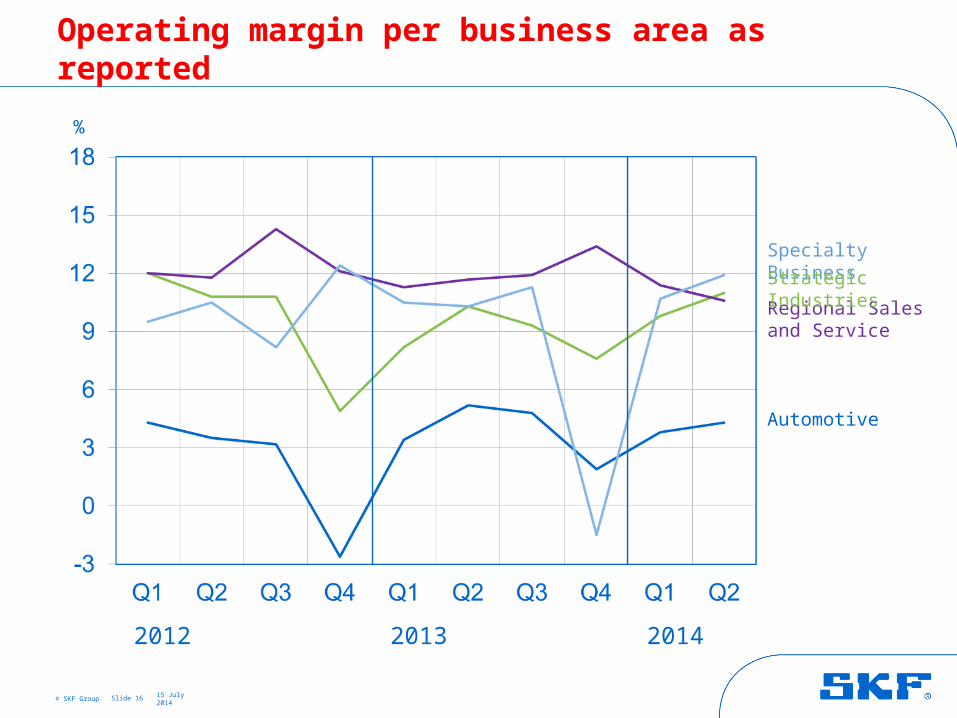
© SKF Group 15 July 2014Slide 16
Regional Salesand Service
Specialty Business
Automotive
%
2012 2013 2014
Operating margin per business area as reported
Strategic Industries
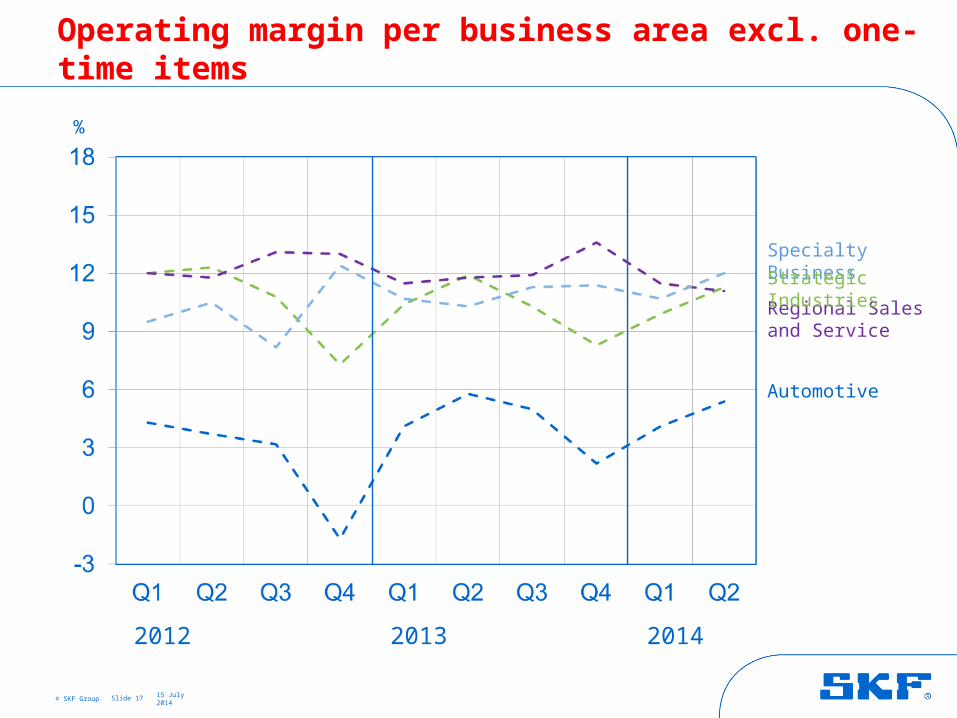
© SKF Group 15 July 2014Slide 17
Regional Salesand Service
Specialty Business
Automotive
%
2012 2013 2014
Operating margin per business area excl. one-time items
Strategic Industries

© SKF Group 15 July 2014
SKF’s programme to improve efficiency and reduce cost
Slide 18
Q4/12 Q1/13 Q2/13 Q3/13 Q4/13 2013 Q1/14 Q2/14 Total
Cost taken 200 250 190 0 50 490 0 100 790
People affected 530 410 320 0 130 860 0 170 1,560
Q1/13 Q2/13 Q3/13 Q4/13 2013 Q1/14 Q2/14 2014
Restructuring 15 35 75 75 200 70 50 120
S&A 50 50 50 50 200 0 0 0
Purchasing 100 100 100 100 400 60 100 160
Total 165 185 225 225 800 130 150 280
Restructuring, SEKm:
Realized gross savings from total programme, SEKm:
Full year gross saving 150 100 80 0 40 220 0 100 470
Giving future gross savings, SEKm:
vs 2012 vs 2013
Note: Run rate Q2 2014 SEK 1,340 million vs 2012.

© SKF Group 15 July 2014
Operating profit bridge, Q2 2014
Slide 19
+1601,837
+160 2,096+134
+150 +70 -120-295
SEKm
Q2 2013 Q2 2014Volumes excl.
Specialty
Business
Specialty
Business
Savings One-time items
Currencies R&D, inflation etc.
Price/mix

© SKF Group 15 July 2014
Operating profit bridge, half year 2014
Slide 20
+4003,317
+604,120+240
+280
+440 -220-397
SEKm
Q2 2013 Q2 2014Volumes excl.
Specialty
Business
Specialty
Business
Savings One-time items
Currencies R&D, inflation etc.
Price/mix

© SKF Group 15 July 2014
Net working capital as % of annual sales
Slide 21
%
2012 2013 2014
Target: 27%
© SKF Group 15 July 2014
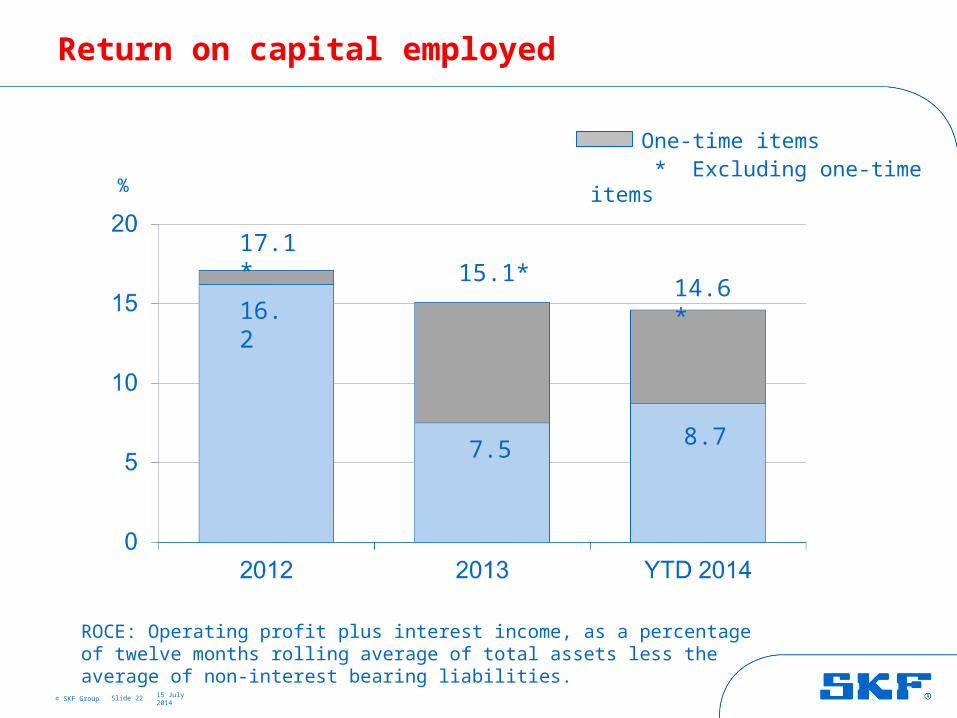
Return on capital employed
Slide 22
%
14.6*
7.5 8.7
16.2
17.1*15.1*
One-time items * Excluding one-time items
ROCE: Operating profit plus interest income, as a percentage of twelve months rolling average of total assets less the average of non-interest bearing liabilities.

© SKF Group 15 July 2014
Cash flow, after investments before financing
Slide 23
SEKm
2012 2013 2014
Excl. acq. and div.: 1) Q3 2012 SEK 1,707 million2) Q1 2013 SEK -69 million3) Q3 2013 SEK 871 million4) Q4 2013 SEK 1,170 million
Excl. EU payment 5) Q2 2014 SEK 1,423 million
4) 5)

© SKF Group 15 July 2014
Net debt
Slide 24
SEKm
2012 2013 2014
AB SKF, dividend paid (SEKm):2012 Q2 2,5042013 Q2 2,5302014 Q2 2,530
Cash out fromacquisitions (SEKm):
2012 Q3 8292013 Q1 8232013 Q4 7,900
Net debt: Loans and net provisions for post-employment benefits less short-term financial assets excluding derivatives.
EU payment (SEKm):
2014 Q2 2,825
© SKF Group 15 July 2014
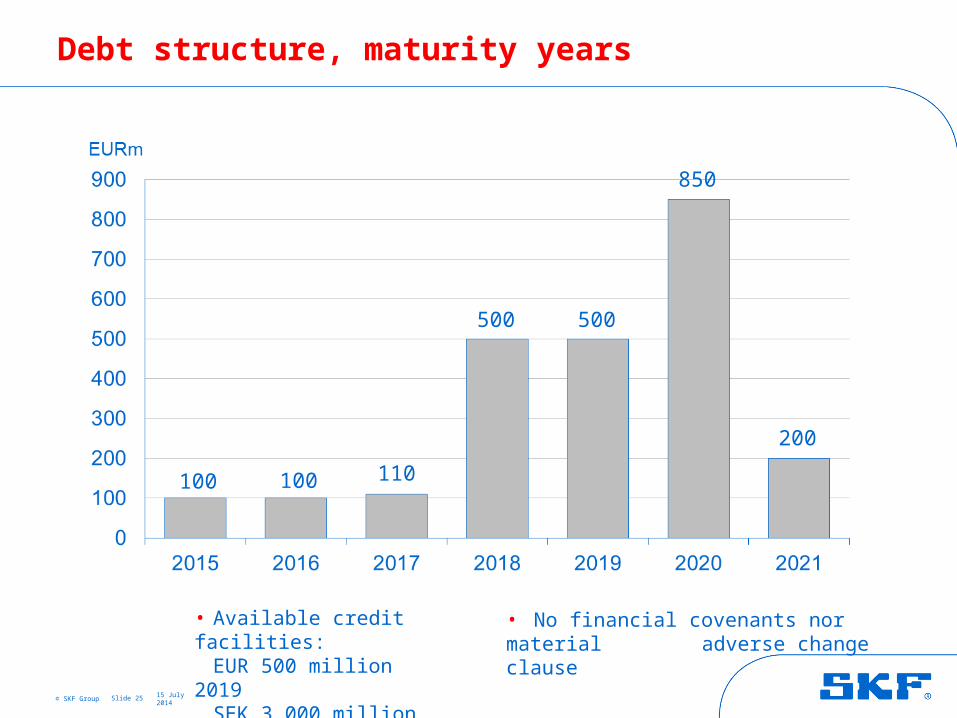
Debt structure, maturity years
Slide 25
• Available credit facilities:EUR 500 million 2019SEK 3,000 million 2016
SEK 3,000 million 2017
• No financial covenants nor material adverse change clause
200
100 100 110
500 500
850
© SKF Group 15 July 2014
July 2014: SKF demand outlook Q3 2014
Slide 26
Demand compared to the third quarter 2013
The demand for SKF’s products and services is expected to be slightly higher for
the Group and North America, higher for Asia, relatively unchanged for Europe
and slightly lower for Latin America. It is expected to be higher for Strategic
Industries and relatively unchanged for Regional Sales and Service and
Automotive.
Demand compared to the second quarter 2014
The demand for SKF’s products and services is expected to be relatively
unchanged for the Group and Europe. It is expected to be slightly higher for
North America and Asia and slightly lower for Latin America. For Strategic
Industries it is expected to be slightly higher and for Regional Sales and Service
and Automotive it is expected to be relatively unchanged.
Manufacturing
Manufacturing is expected to be slightly higher year over year and relatively
unchanged compared to the second quarter.

© SKF Group 15 July 2014
SKF demand outlook Q3 2014, main regions
Share of net sales 2013
Europe 42%
Asia Pacific 24%
North America 24%
Latin America 7%
Total
Q3 2014 vs Q3 2013
+/-
++
+
-
+
Slide 27
Sequential trend for Q3 2014

© SKF Group 15 July 2014
SKF demand outlook Q3 2014, main business areas
Share of net sales 2013
StrategicIndustries
29%
Regional Sales and Service
39%
Automotive 27%
Total
Q3 2014 vs Q3 2013
++
+/-
+/-
+
Slide 28
Sequential trend for Q3 2014

© SKF Group 15 July 2014
SKF sequential volume trend Q3 2014, Industries
Slide 29
6% Aerospace
5% Energy
4% Railway
2% Two-wheelers and Electrical
29% Industrial distribution
14% Cars and light vehicles
13% Industrial, heavy, special and off-highway
11% Vehicle service market
11% Industrial, general
5% Trucks
Share of net sales 2013

© SKF Group 15 July 2014
Guidance for the third quarter 2014*
Slide 30
• Tax level: around 30%
• Financial net for the third quarter:Around SEK -230 million
• Currency impact on operating profit versus 2013Q3: SEK +50 millionFull year: SEK -70 million
• Additions to PPE: Around SEK 1.6 billion for 2014
* Guidance is approximate and based on current assumptions and exchange rates.

© SKF Group 15 July 2014
SKF’s priorities
Slide 31
Sustainable profitable growth• Expand the platform concept• Exploit the asset life cycle approach• Develop new products and grow SKF BeyondZero portfolio• Extend and grow second brands• Acquisitions
Investments & Innovation • New and existing facilities• Research and development• IT systems and mobility
Cost reduction• Business Excellence• Consolidation of manufacturing• Optimization and productivity improvements• Reduction in purchasing costs
Capital efficiency• Fixed capital• Net working capital

© SKF Group 15 July 2014
Cautionary statement
Slide 32
This presentation contains forward-looking statements that are based on the current expectations of the management of SKF.
Although management believes that the expectations reflected in such forward-looking statements are reasonable, no assurance can be given that such expectations will prove to have been correct. Accordingly, results could differ materially from those implied in the forward-looking statements as a result of, among other factors, changes in economic, market and competitive conditions, changes in the regulatory environment and other government actions, fluctuations in exchange rates and other factors mentioned in SKF's latest annual report (available on www.skf.com) under the Administration Report; “Important factors influencing the financial results", "Financial risks" and "Sensitivity analysis”.

© SKF Group 15 July 2014