skeletal changes associated with increasing body size
TRANSCRIPT
SKELETAL CHANGES ASSOCIATED WITH INCREASING BODY SIZE
ALFRED TAYLOR Department of Zoology, Oregon State Colbege
T W O FIQURES
INTRODUCTION
It has long been recognized that between such animals as a rat and a mouse, the factor of size necessitates certain anatomical and functional adjustments which cause these similarly proportioned animals to differ in important par- ticulars. The surface area of the mouse compared to its mass is greater than is the case with the rat and this in turn is probably responsible for the fact that the rate of metabo- lism is higher in the smaller animal. The mouse consequently requires more food and a more rapid circulation per unit of body weight. I n this connection, Klatt ('19) and Parrot (1894) have shown that the heart in warm blooded animals is comparatively much smaller in the larger forms than in the smaller ones.
Of almost equal importance is the effect of size on the relative strength of an animal. The efficiency of a muscle is measured by the area of its cross section as was demon- strated by von Ber,gmann and Leuckart (1885) and this area increases as the square while the muscles and the body mass as a whole increase as the cube of the corresponding linear dimensions. It follows that if the size of the muscles of a larger animal bears the same relation to the whole weight as that of a smaller form, then the relative strength of the larger
IThe author is indebted to Dr. N. Fasten and Dr. R. Huestis for the many helpful criticisms and suggestions advanced by them during the course of this work.
253
254 ALFRED TAYLOR
animal will be much less than that of the smaller one. If two animals of the same type such as the rat and the mouse were geometrically comparable in every part and organ, then they would differ markedly from a physiological standpoint. In order to function in a comparable manner the relative pro- portions of parts must necessarily be different. It is well known that smaller animals are actually much stronger rela- tively than larger ones, but whether the difference is such as would be expected from geometric comparison has never been ascertained.
In any attempt to evaluate by experimental data the actual differences present in bodily structure due to this factor of size, the skeletonj should yield important data. This is especially true because the bony framework furnishes both support for the body and surface for muscle attachment.
I n its role of support the skeleton will become relatively weaker with increasing body size if it grows in geometric proportion with the rest of the body. This is so because the bones enlarge in three dimensions, the same as the body as a whole, while their strength increases only as the square of the corresponding linear measurement. There is no mechanical necessity for the skeletal ratio increasing on this account, since there would still be ample margin of reserve strength in even the relatively weak skeleton of quite a large animal. Small animals, such as mice, have skeletons which are much stronger than necessary for their supporting func- tions.
As far as space for muscle attachment is concerned, the increasing size of the skeleton in a strictly geometric ratio offers no particular problem. The area of the bones will increase as the square of the corresponding linear dimensions and the cross section area of the muscles in the same manner. Thus, under the circumstances mentioned, the skeleton pro- vides, with increasing body size, exactly the right amount of surface for muscle attachment.
COMPARATIVE BONE WEIGHTS AND BONE AREAS 255
REVIEW O F LITERATURE
So far as could be determined, Galileo Galilei, in 1638, was the first to consider the problem of the transformations occurring in animals as the result of size differences. Galilei considered the possibility of animals comparable in structure and body plan to men and horses attaining monstrous sizes and came to the conclusion that such types would require either a relatively larger skeleton or bones constructed of a material much stronger than that found in the smaller prototypes. He also stated that decreasing size of such a form as that of man would not cause a corresponding decline in relative muscular strength. Curiously enough, Galilei contended that the bone area of a large animal is relatively greater than that of a smaller animal of the same type. His approach to these problems was from a purely theoretical standpoint. He advanced no empirical data, but his conten- tions are interesting in that certain of his conclusions are still accepted by many present day investigators.
I n 1886, Plateau investigated the muscular power of differ- ent sizes of insects and found that among comparable types the smaller ones were invariably the stronger. He tested the various forms on the basis of their ability to pull a load represented in terms of their own weights.
I n more recent times, R. du Bois-Reymond ('28) has in- vestigated the effect of increasing body size on the thickness and strength of the limb bones in vertebrates of similar build. His results were obtained from dry skeletons, the weights of the animals being calculated in the case of mammals by adding together five measurements as follows : lengths of the two femora and tibias, lengths of the two humeri and ulnas, and length of the backbone from the skull to the pelvic girdle. He used the measure of the circumference of the femur as an index of bone thickness for each animal considered and then calculated the bone strength from the weight the femur was able to bear at its center when it was supported at its extremities. Du Bois-Reymond reported that there was no consistent relative increase in bone thickness with increasing
256 ALFRED TAYLOR
body size, but that the relative strength of the bones was markedly less in larger vertebrates when compared with smaller ones. His findings show, for example, that the femur of the mouse will support 62.5 times the weight of the body, that of the rat 34.5 times, that of the cat 7.5 times, and man’s femur will support only 5 times the body weight.
SPECIFIC PROBLEMS
It is evident from the above survey of the literature on the subject that the effect of increasing body size as it per- tains to the bony skeleton has received very little attention. As far as could be determined, no one has ever attempted to discover whether or not the cartilaginous skeleton of mammals of comparable structure but greater size actually increases its ratio to the weight of the body. There have been, it is true, numerous papers published giving the results of investigations of the skeletal ratios of individual forms, but, in view of the various techniques employed, it is im- practical, in most instances, to use these data in a comparative study.
The present paper undertakes to answer two specific ques- tions. Firstly, what changes occur, if any, in the relative weight of the bony skeleton in adult mammals of comparable form in association with varying body sizes? Secondly, what changes occur, if any, in the relative areas of the main limb bones in adult mammals of comparable form in association with varying body sizes 1
MATERIALS AND METHODS
a. Comparative skeletal weights
In this investigation, three species of mammals differing widely in weight, but not manifesting any fundamental differ- ences in body plan or skeletal proportions were utilized. These were, 1) the gray digger squirrel, Otospermophilus grammurus douglasii Richardson, weighing about 600 gm., 2) the domestic cat, Felis domestica Linnaeus, averaging in
COMPARATIVE BONE WEIGHTS AND BONE AREAS 257
weight about 3500 gm., and, 3) a series of dogs, Canis familiaris Linnaeus, whose weights varied from slightly over 7000 gm. to nearly 20,000 gm. I n addition, data are included on the skeletal ratio of the albino rat, as reported by Donald- son (’19) as well as that for man which has been reported by a number of workers.
The animals were killed with ether and the total body weight recorded immediately. The .bony skeleton was then dissected out, as much of the muscle tissue being removed as came away without too much difficulty. Following this, the treatment was similar to that described by Donaldson (,19) in connection with his work on the growth of the skele- ton of the albino rat. The bones were immersed in a 2 per cent solution of soap powder (commercial ‘Gold Dust’) and kept close to the boiling point until the connective tissue had softened enough to permit the scraping of the bones clean.
After the entire skeleton had been dissected out, surface moisture was carefully removed with absorbent paper and then the weight was recorded. After drying at room tempera- ture for 2 months or more, the skeletons were again weighed. It was noted that the bones when allowed to dry for a few weeks reached a condition of equilibrium with the amount of moisture in the atmosphere and thereafter weight slightly more or less in accordance with whether the relative humidity is high or low.
I n order to check the effect of the method of preparing the skeletons on the weights of the bones, specific gravities were recorded and compared of femora cleaned by scraping off the raw muscle and connective tissue with femora pre- pared as above. It was found that the use of the soap solu- tion caused a slight loss in weight, but since all the bones were prepared similarly this source of error tends to minimize it self.
The question of the density of bone in relation to body size was considered to have a bearing on the investigation. So specific gravities were obtained for a series of mammals ranging in size from the mole to the larger sized dog. The
258 ALFRED TAYLOR
main limb bones were selected for these determinations and in every instance the untreated bones from which every particle of raw muscle and connective tissue had been care- fully removed were utilized. The figure obtained in each case was for the specific gravity of the bone as a whole.
b. Comparative boNe areas For this aspect of the investigation, femora and humeri
that had been dried at room temperature were used. The areas of these bones were computed for a series of animals including the albino rat, guinea pig, domestic cat, dog, man and cow. The figures obtained were added together, giving a number which expressed the combined area of the four bones for each animal.
The irregularity of shape of the limb bones is such as to make accurate determination of the areas difficult. The method finally selected, however, gave very satisfactory re- sults. Each bone was covered with adhesive tape, care being taken to have the various strips coincide exactly. For the irregular uncovered spaces oE bone pieces of tape were cut to match these, with the result that when the covering process was finished, the bone presented a homogeneous appearance looking at first glance like a plaster cast of a bone rather than one which had been covered with tape.
By this procedure, the area could be computed in two ways, first from the weight of the tape used (the number of square centimeters per gram sf tape was found to be constant for each roll) and, second, from the dimensions of tape used in covering the bone as computed through laying it out on square millimeter paper.
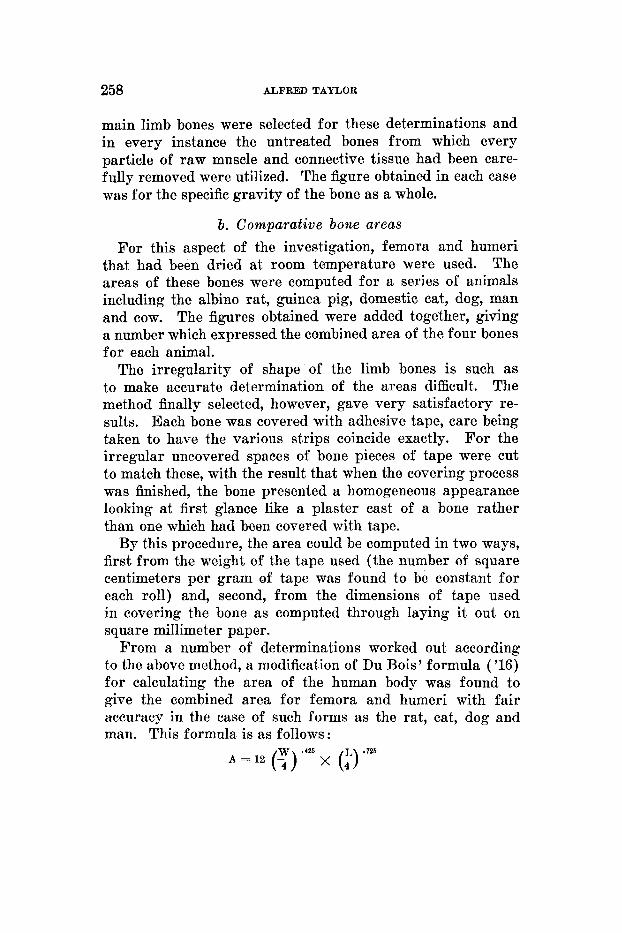
From a number of determinations worked out according to the above method, a modification of Du Bois' formula ('16) for calculating the area of the human body was found to give the combined area for femora and humeri with fair accuracy in the case of such forms as the rat, cat, dog and man. This formula is as follows:
.125
A = 12 (T) x (4) *'"
COMPARATIVE BONE WEIGHTS AND BONE AREAS 259
where A, denotes the combined area of femora and humeri in square centimeters ; W, the total weight of femora and humeri in grams (dry bone) ; and L, the total of the lengths of femora and humeri in centimeters.
When applied to such divergent animals as the rat and man, this equation predicted the area of the bones measured with a deviation of about 1 per cent from the experimentally determined areas. However, the areas given in this paper were experimentally obtained in each case ; the formula being used as a check and as an indicator of the comparability of form in the material used.
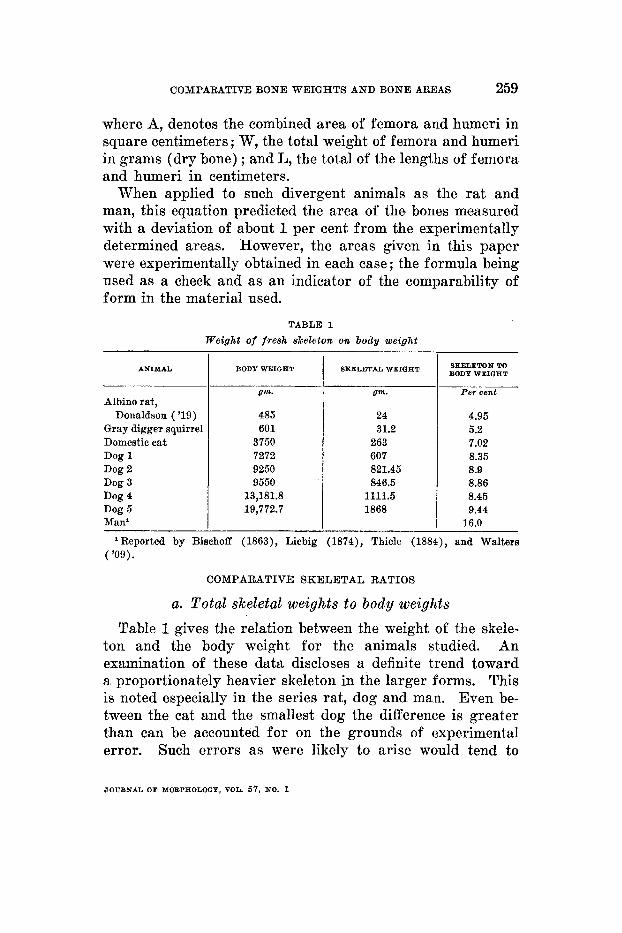
TABLE 1 Weight of fresh skeleton on body weight
ANIMAL
Albino rat, Donaldson ( '19)
Gray digger squirrel Domestic eat Dog 1 Dog 2 Dog 3 Dog 4 Dog 5 Man'
BODY WEIGHT
gm.
485 601
3750 7272 9250 9550
13,181.8 19,772.7
24 31.2
263 607 821.45 846.5
1111.5 1868
4.95 5.2 7.02 8.35 8.9 8.86 8.45 9.44
16.0
Reported by Bischoff (1863), Liebig (1874), Thiele (1884), and Walters ( '09).
COMPARATIVE SKELETAL RATIOS
a. Total skeletal weights to body weights Table 1 gives the relation between the weight of the skele-
ton and the body weight for the animals studied. An examination of these data discloses a definite trend toward a proportionately heavier skeleton in the larger forms. This is noted especially in the series rat, dog and man. Even be- tween the cat and the smallest dog the difference is greater than can be accounted for on the grounds of experimental error. Such errors as were likely to arise would tend to
JOURNAL OW MORPHOLOGY, VOL. 57, NO. 1
260 ALFRED TAYLOR
increase the skeletal percentage of the smaller animal as compared with the larger one. The surface area of the bones, as will be shown later, is proportionately greater in the smaller skeletons so that any surface moisture that may have been present at the time of weighing would favor these at the expense of the larger skeletons. Also the larger bones were easier to clean so that any difference due to this factor would again tend to increase the skeletal ratio of the smaller animals in comparison with the larger ones. Figures for the squirrel represent the average of ten animals and for the cat the average of six. In the case of the dog there were such differences in size as to indicate listing them separately.
Of special interest is the distinct increase in skeletal ratio as between dog 1 and dog 5 . Table 1 shows that dog 5 is about 2.7 times heavier than dog 1, a greater difference than exists between dog 1 and the cat. This would seem to show that the changes noted in the skeletal ratios are not due to the diversity of the species compared.
COMPARATIVE BONE DENSITIES
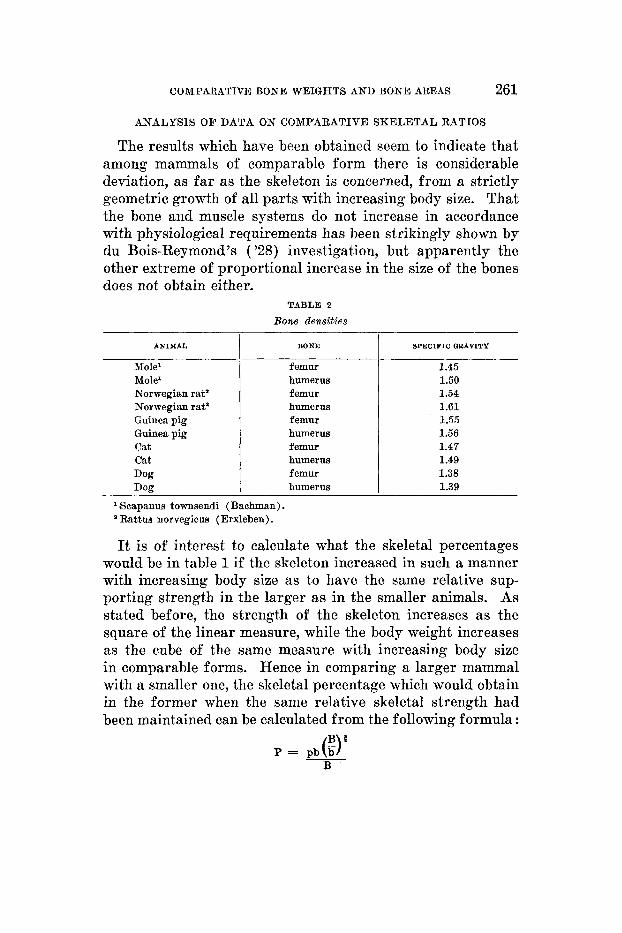
Whether or not a gram of bone from a large animal occupies the same volume as a gram of bone from a small animal is a matter of importance in such problems as are dealt with here. Table 2 records the specific gravities of the femora and humeri for a brief series of mammals. It reveals a gen- eral tendency for the bone density to be lower in the larger animals, thus increasing available area per unit of weight. It is possible that the differences recorded may be due to the factor of age. It is well known that in older animals the limb bones become more porous with advancing age. The animals used in the present investigation appeared to be! in the full vigor of maturity, but the exact ages were not defi- nitely known. Also it will be seen that the densities of the main limb bones for the smallest animal in the series, namely, the mole, do not follow the tendency common to the bones of the other animals in the table. Further data on this ques- tion would be necessary before generalizations could be ad- vanced.
COMPARATIVE BONE WEIGHTS A N D BONE AREAS 261
ANALYSIS O F DATA ON COMPARATIVE SKELETAL RATIOS
The results which have been obtained seem to indicate that among mammals of comparable form there is considerable deviation, as far as the skeleton is concerned, from a strictly geometric growth of all parts with increasing body size. That the bone and muscle systems do not increase in accordance with physiological requirements has been strikingly shown by du Bois-Reymond's ( '28) investigation, but apparently the other extreme of proportional increase in the size of the bones does not obtain either.
TABLE 2
Bone densities
ANIMAL BONE 1 SPECXFIC GRAVITY I Mole' Mole' Norwegian rat' Norwegian rat' Guinea pig Guinea pig Cat Cat Dog Dog
Scapanus townsendi (Bachman) . * Rattus norvegicus (Erxleben).
femur humerus femur humerus f emur humerus femur humerus femur humerus
1.45 1.50 1.54 1.61 1.55 1.56 1.47 1.49 1.38 1.39
It is of interest to calculate what the skeletal percentages would be in table 1 if the skeleton increased in such a manner with increasing body size as to have the same relative sup- porting strength in the larger as in the smaller animals. As stated before, the strength of the skeleton increases as the square of the linear measure, while the body weight increases as the cube of the same measure with increasing body size in comparable forms. Hence in comparing a larger mammal with a smaller one, the skeletal percentage which would obtain in the former when the same relative skeletal strength had been maintained can be calculated from the following formula :
B 1 P = p b ( J
B
262 ALFRED TAYLOR
ANIMAL ACTUAL PERCENTAQE
Albino rat 4.95 Gray digger squirrel 5.2 Domestic eat 7.02 Dog 1 8.35 Dog 2 8.90
Dog 4 8.45 Dog 5 9.44 Man 16.0
Dog 3 8.86
where P is the percentage of skeletal material necessary in the larger of two animals in order for the skeleton to have the same relative supporting strength, p, the percentage of skeletal material for the smaller animal, B, the body weight of the larger animal, and b, the body weight of the smaller animal.
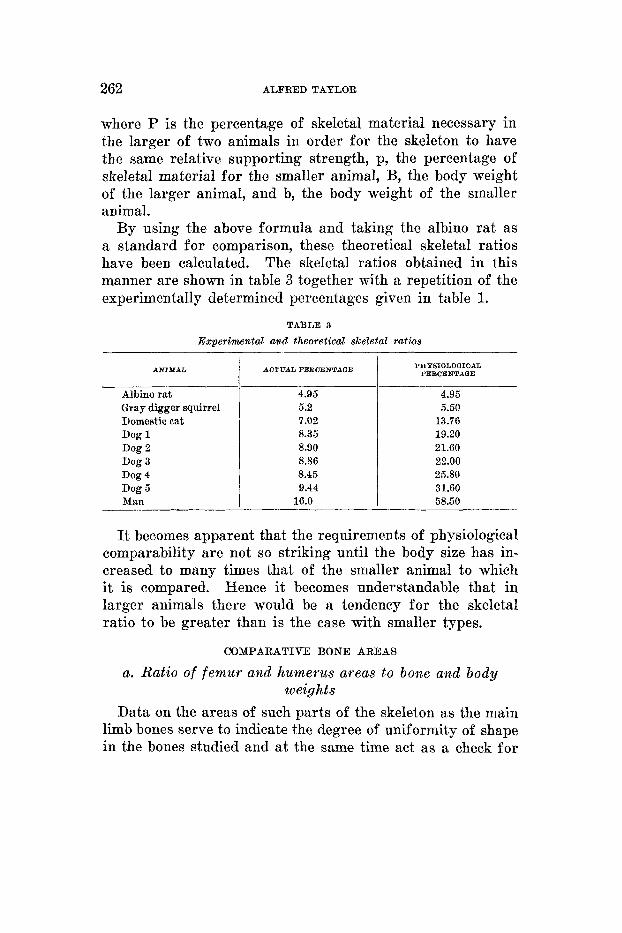
By using the above formula and taking the albino rat as a standard for comparison, these theoretical skeletal ratios have been calculated. The skeletal ratios obtained in this manner are shown in table 3 together with a repetition of the experimentally determined percentages given in table 1.
TABLE 3 Experimental and theoretical skeletal ratios
PHP610LOQICAL PEECENTAQE
4.95 5.50
13.76 19.20 21.60 22.00 25.80 31.60 58.50
It becomes apparent that the requirements of physiological comparability are not so striking until the body size has in- creased to many times that of the smaller animal to which it is compared. Hence it becomes understandable that in larger animals there would be a tendency for the skeletal ratio to be greater than is the case with smaller types.
COMPARATIVE BONE AREAS
a. Ratio o f femur and humerus areas to borte and body weights
Data on the areas of such parts of the skeleton as the main limb bones serve to indicate the degree of uniformity of shape in the bones studied and at the same time act as a check for
COMPARATIVE BONE WEIGHTS AND BONE AREAS 263
BEMOW A N D HUMERI AREAS
sq.cm.
24.0 35.92
138.0 248.0 277.6 288.0 360.4 558.0 776.0
1484.0 2988.0
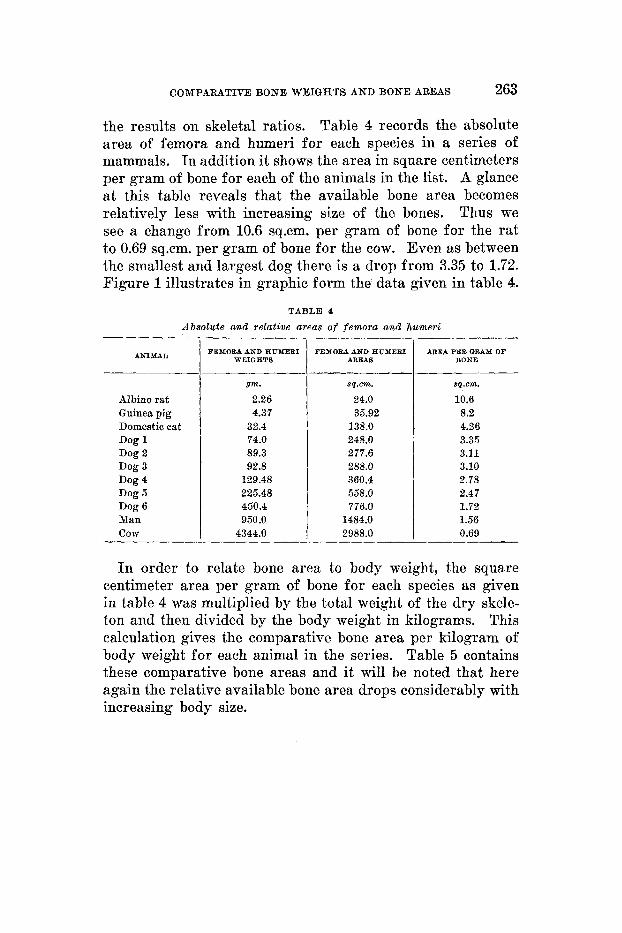
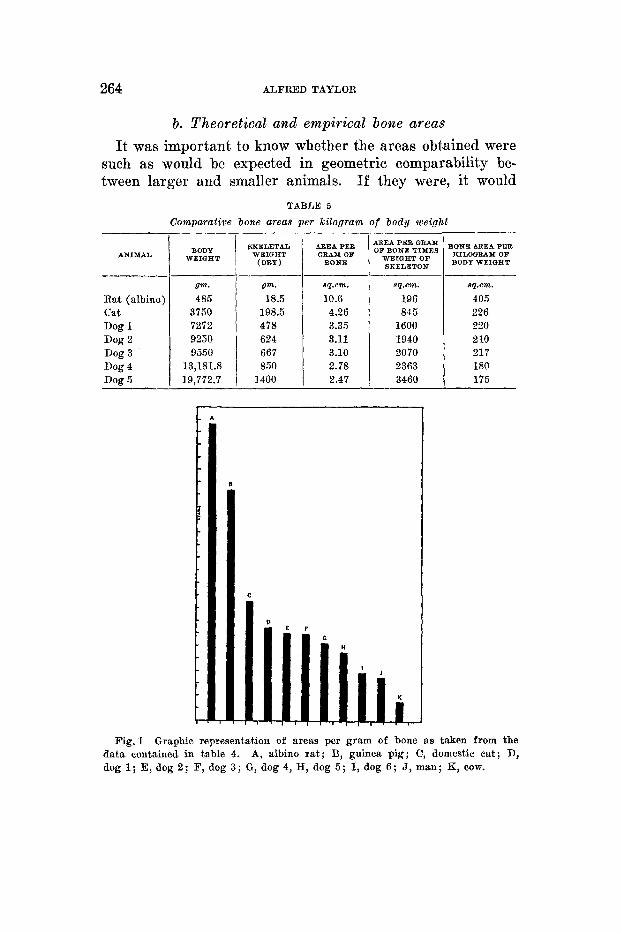
the results on skeletal ratios. Table 4 records the absolute area of femora and humeri for each species in a series of mammals. In addition it shows the area in square centimeters per gram of bone for each of the animals in the list. A glance at this table reveals that the available bone area becomes relatively less with increasing size of the bones. Thus we see a change from 10.6 sq.cm. per gram of bone for the rat to 0.69 sq.cm. per gram of bone for the cow. Even as between the smallest and largest dog there is a drop from 3.35 to 1.72. Figure 1 illustrates in graphic form the data given in table 4.
AREA PER QRAM OF BONE
sq.cm.
10.6 8.2 4.26 3.35 3.11 3.10 2.78 2.47 1.72 1.56 0.69
TABLE 4
Absolute and relative areas of femora and humeri
ANIMAL
Albino rat Guinea pig Domestic cat Dog 1 Dog 2 Dog 3 Dog 4 Dog 5 Dog 6 Man COW
FEMORA AND RUXEBI WIIGHTS
gm.
2.26 4.37
32.4 74.0 89.3 92.8
129.48 225.48 450.4 950.0
4344.0
I n order to relate bone area to body weight, the square centimeter area per gram of bone for each species as given in table 4 was multiplied by the total weight of the dry skele- ton and then divided by the body weight in kilograms. This calculation gives the comparative bone area per kilogram of body weight for each animal in the series. Table 5 contains these comparative bone areas and it will be noted that here again the relative available bone area drops considerably with increasing body size.
264 ALFRED TAYLOR
196 405 845 226
1600 220 1940 2 10 2070 217 2363 180
~ 3460 175
b. Theoretical alzd empirical bolze areas It was important to know whether the areas obtained were
such as would be expected in geometric comparability be- tween larger and smaller animals. If they were, it would
TABLE 5
Comparative bone areas per kilogram of body weight
ANIMAL
Rat (albino: cat Dog 1 Dog 2 Dog 3 Dog 4 Dog 5
BODY WEIGHT
vm. 485
3750 7252 9250 9550
13,181.8 19,772.7
SKELETAL WEIGHT
(DRY )
Vm.
18.5 198.5 478 624 667 860 1400
AREA PER GRAX OW BONE
sq.em.
10.6 4.26 3.35 3.11 3.10 2.78 2.47
L A
Fig. 1 Graphic representation of areas per gram of bone as taken from the A, albino rat; B, guinea pig; C, domestic cat; D, data contained in table 4.
dog 1; E, dog 2; F, dog 3 ; G, dog 4, H, dog 5 ; I, dog 6 ; J, man; I(, COW.
COMPARATIVE BONE WEIGHTS AND BONE AREAS 265
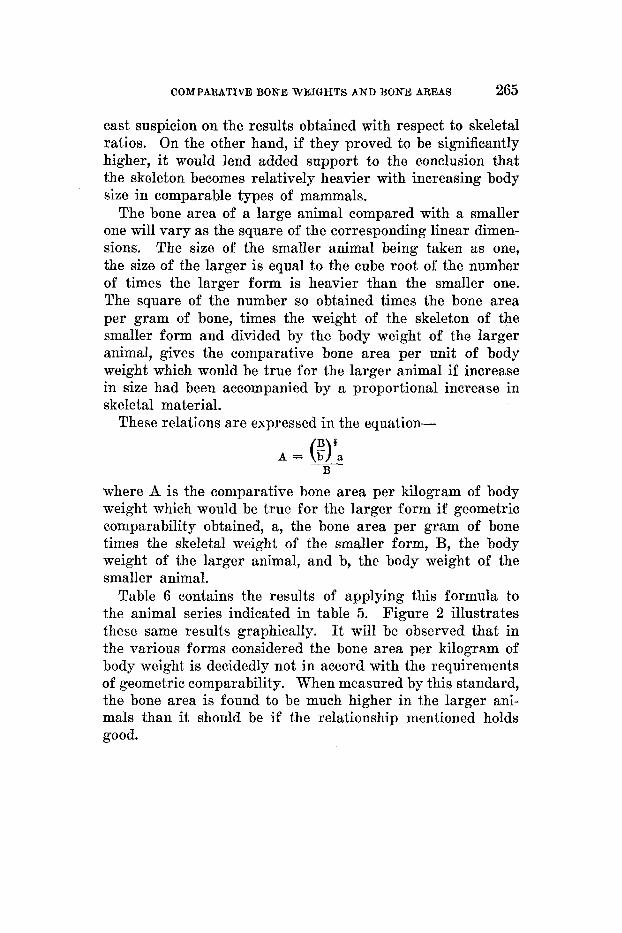
cast suspicion on the results obtained with respect to skeletal ratios. On the other hand, if they proved to be significantly higher, it would lend added support to the conclusion that the skeleton becomes relatively heavier with increasing body size in comparable types of mammals.
The bone area of a large animal compared with a smaller one will vary as the square of the corresponding linear dimen- sions. The size of the smaller animal being taken as one, the size of the larger is equal to the cube root of the number of times the larger form is heavier than the smaller one. The square of the number so obtained times the bone area per gram of bone, times the weight of the skeleton of the smaller form and divided by the body weight of the larger animal, gives the comparative bone area per unit of body weight which would be true for the larger animal if increase in size had been accompanied by a proportional increase in skeletal material.
These relations are expressed in the equation-
where A is the comparative bone area per kilogram of body weight which would be true for the larger form if geometric comparability obtained, a, the bone area per gram of bone times the skeletal weight of the smaller form, B, the body weight of the larger animal, and b, the body weight of the smaller animal.
Table 6 contains the results of applying this formula to the animal series indicated in table 5. Figure 2 illustrates these same results graphically. It will be observed that in the various forms considered the bone area per kilogram of body weight is decidedly not in accord with the requirements of geometric comparability. When measured by this standard, the bone area is found to be much higher in the larger ani- mals than it should be if the relationship mentioned holds good.
266 ALFRED TAYLOR
ANlMAlr
Albino rat Domestic cat Dog 1 Dog 2
Dog 4 Dog 5
Dog 3
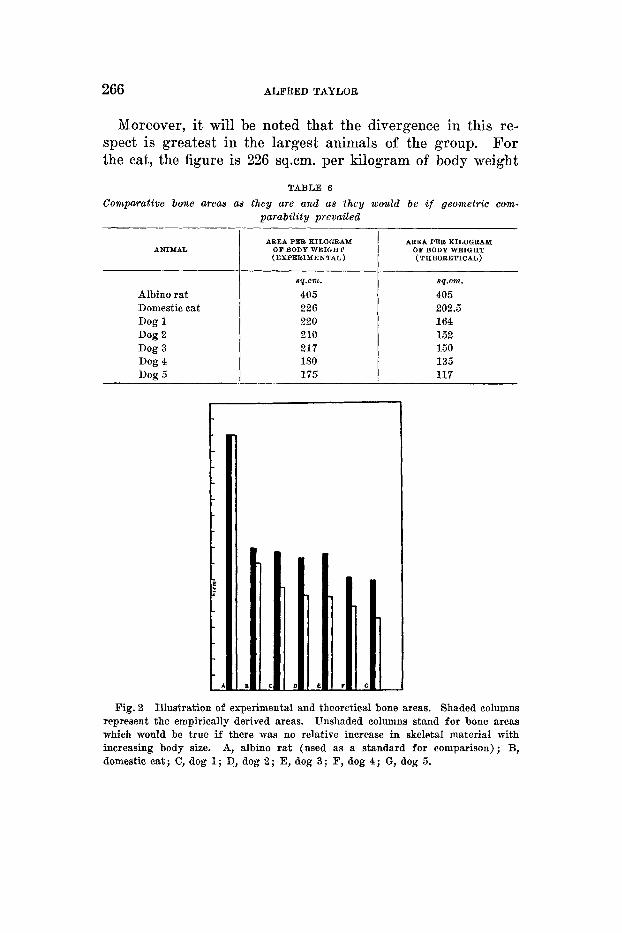
Moreover, it will be noted that the divergence in this re- spect is greatest in the largest animals of the group. For the cat, the figure is 226 sq.cm. per kilogram of body weight
AREA PER KILOGRAM OF BODY WEIQHT
AREA PER KILOQRAM OF BODY WEIQHT
(EXPERIMENTAL) (THEOSETICAL)
sq.em. sq.cm.
405 405 226 202.5 220 164 210 152 217 150 180 135 175 117
TABLE 6
Comparative bone areas as they are and as they would be if geometric com- parability prevailed
Fig. 2 Illustration of experimental and theoretical bone areas. Shaded columns represent the empirically derived areas. Unshaded columns stand for bone areas which would be true if there was no relative increase in skeletal material with increasing body size. A, albino rat (used as a standard fo r comparison); B, domestic cat; C, dog 1 ; D, dog 2; E, dog 3; F, dog 4 ; G, dog 5.
COMPARATIVE BONE WEIQHTS AND BONE AREAS 267
from the experimental data and it is 202.5 sq.cm. per kilogram of body weight from the theoretical calculations. On the other hand, for dog 5 the figures are 175 to 116.5. The ratio of the experimental figures to the theoretical in these two animals is for the cat 107 and for the dog 150.
c. Skeletal ratios calculated from the bone areas
To still further relate the data on relative bone areas and bone weights, the skeletal ratios were calculated for the dogs from the bone areas given in table 5 , using the cat as a stand- ard for comparison. This was also done for the largest dog alone, using the smallest dog as a standard of comparison in the calculation.
This can be done in view of the relations existing between surface and weight in bodies of varying sizes which are com- parable in form and material. The method may be illustrated as follows. I f we compare two cubes, cube A and cube B, of which cube A has a linear measure of 1 cm., a surface area of 6 sq.cm., and a weight of 1 gm., and cube B a linear measure of 2 cm., a surface area of 24 sq.cm., and a weight of 8 gm.; then the area of A over the area of B equals the weight of A reduced to the two-thirds power over the weight of B reduced to the two-thirds power. So given the areas of A and B and the weight of A, the weight of B can be calculated.
In the bone calculations, the same relations obtain. Here the bone area of the larger animal is to the bone area of the smaller one as the weight of the skeleton of the larger form, reduced to the two-thirds power, is to the weight of the skele- ton of the smaller animal reduced to the two-thirds power.
The equation-
expresses these relations, where a, is the area of femora and humeri for the smaller animal, A, the area of fe'mora and humeri for the larger animal, p, the skeletal ratio for the
268 ALFRED TAYLOR
Domestic cat Dog 1
Dog 3 Dog 2
Dog 4 Dog 5
smaller form, P, the skeletal ratio for the larger form, b, the body weight of the smaller animal, and B, the body weight of. the larger animal.
Simplifying and solving for P the following equation is obtained :
Percentage Percentage
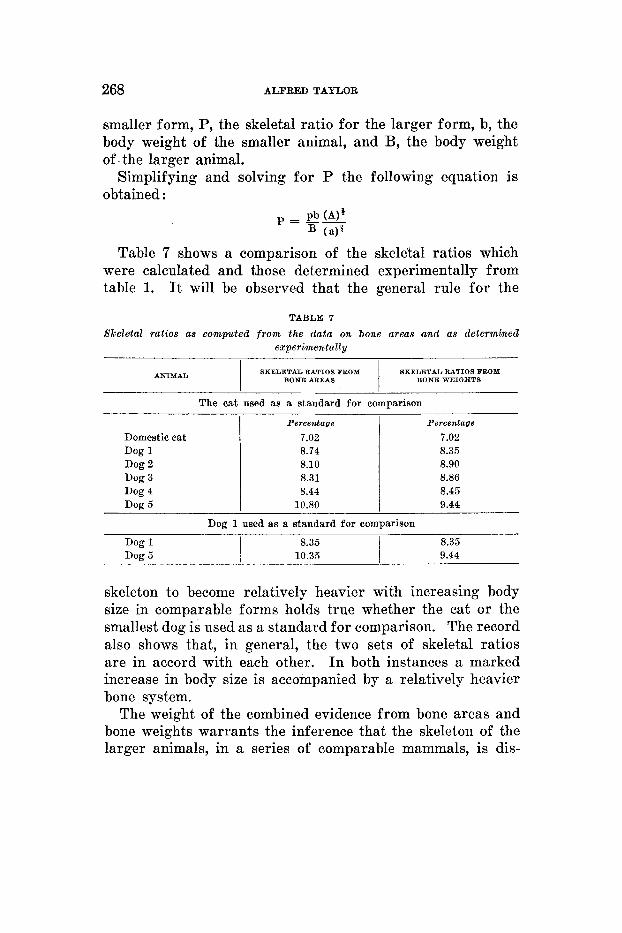
7.02 7.02 8.74 8.35 8.10 8.90 8.31 8.86 8.44 8.45
10.80 9.44
Table 7 shows a comparison of the skeletal ratios which were calculated and those determined experimentally from table 1. It will be observed that the general rule for the
TABLE 'I
Skeletal ratios as computed f rom the data on bone areas and as determined experimentally
SKELETAL RATIOS FROM SKELETAL RATIOS FROM BONE AREAS BONE WEIQHTS ANIMAL
skeleton to become relatively heavier with increasing body size in comparable forms holds true whether the cat or the smallest dog is used as a standard for comparison. The record also shows that, in general, the two sets of skeletal ratios are in accord with each other. I n both instances a marked increase in body size is accompanied by a relatively heavier bone system.
The weight of the combined evidence from bone areas and bone weights warrants the inference that the skeleton of the larger animals, in a series of comparable mammals, is dis-
COMPARATIVE BONE WEIGHTS AND BONE AREAS 269
tinctly heavier than would be the case if geometric proportion in this respect were the rule. It must be added, however, that du Bois-Reymond ( '28), in his paper, referred to before, on strength and thickness of bones in vertebrates of varying sizes, came to the opposite conclusion. Recalling again that his investigation was conducted on dry skeletal material ; that he deduced the weights of the animals from the skeletons themselves, and finally that he did not concern himself a t all with skeletal weights or bone areas, his data seem to have a less direct bearing on the problem than those presented in this paper.
GENERAL DISCUSSION
a. Physiological. implications Increased size in vertebrates is, as we have seen, gained
at the expense of relative muscular strength, but the loss is not as great as would be the case if all parts of the body maintained the same size relations with increasing body size. Both the supporting strength of the bones and available area for muscle attachment increase faster than proportional growth would require, but slower than will allow physiological comparability in strength with smaller forms.
The tendency for mammalian forms such as the cat, dog and man to compensate in some measure for the loss in rela- tive strength because of greater size by increasing the ratio of skeletal material to the rest of the body lowers the effici- ency of the organism as a whole. It means that a relatively greater quantity of inert tissue must be carried about, sup- ported, and supplied with nutriment. On the other hand, the larger mammal suffers less heat loss from its relatively smaller body surface and so becomes less dependent on tem- perature variation and general climatic conditions. Larger size also brings a greater immunity from attack by other animals and, in general, a longer span of life. It is such advantages as these which counterbalance the handicaps in- herent in an increased skeletal ratio.
270 ALFRED TAYLOR
When unusual body sizes are attained, it is more than likely that the purely mechanical factors involved serve to inhibit further increase in this direction. The question arises as to just what constitutes the maximum size possible for the ter- restrial type of vertebrate animal. From the findings of paleontology, we know that in the Jurassic and Cretaceous periods of the Mesozoic era reptilian forms, presumably land types many times larger than the African elephant existed. Judging from the data presented here in regard to the rela- tions between available bone areas and body size, it would seem that either such animals were relatively very weak and sluggish or they frequented aquatic habitats where their bodies were wholly or partially submerged.
An idea of the difficulties involved in the mechanics of locomotion in terrestrial animals as large as some of the dinosaurs are said to have been may be gained by using an illustration similar to the one A. A. Packard (1898) gave with regard to muscular power in insects. If we compare two vertebrates similar in form and proportions, but differ- ing in weight, say one weighing 50 pounds and the other 25 tons, then the leg muscles of the smaller form would be under the same stress per square centimeter of cross section area when it carried a load nine times its own weight, or 450 pounds, as would the muscles of the larger form in carrying its own weight. Some of the larger terrestrial dinosaurs are assumed to have weighed 25 tons or more and it is evi- dent that, relatively, they must have had larger bone and muscles systems than smaller vertebrates.
6. Evolzctiomry implicatio~~zs-orthogenesis One of the most intriguing problems in the field of verte-
brate evolution is that of orthogenesis. A certain character, often contrary seemingly to the principles of natural selection, becomes in the course of the evolution of a group of animals progressively more developed, finally threatening the well- being and perpetuation of the type. One of the best illustra- tions of this orthogenetic trend of character development is
COMPARATIVE BONE WEIGHTS AND BONE AREAS 271
found in the geological history of the extinct titanotheres. Henry Fairfield Osborn and his associates ( '29) discovered and described a complete series of these hoofed herbivores beginning with small forms in the middle Eocene and culmin- ating in the gigantic Brontotherium of the Oligocene.
Among some of the earliest and smallest of the titanotheres are found specimens with the beginnings of fronto-nasal horns consisting of tubercle-like bony prominences. As these forms evolved toward greater body size these bony projections be- came so much enlarged that, in Brontotherium, they became huge elongated horns. The remarkable characteristic about the development of these bony projections is that in the larger forms they became relatively larger than in the smaller types.
J. S. Huxley ('24) and ( '31) reported the same growth rela- tions between the horns and the body of deer. The larger deer have relatively larger horns. Huxley considered that the rate of action of the factor controlling the growth of such heterogonic organs was dependent upon body size and that increase in size would necessitate an exponential increase in the size of such appendages.
It is suggested here that the relatively greater size of such structures can be explained by reference to the data which have been presented with respect to skeletal ratios in com- parable mammals of different body sizes. Such appendages as the horns of the titanotheres or of the deer are essentially parts of the skeleton and the same determiners which caused a relative increase in the size of the bone system in response to increasing body size would probably bring about a corre- sponding increase in them. So if the skeletal ratio of the larger titanotheres in comparison with the smaller types was greater, then such parts of the skeleton as the horns would reflect such a condition.
It may be objected that since such appendages as the horns are not subjected to the stresses which obtain for other parts of the skeleton, and since the increased skeletal ratio is sup- posed to be called forth in an effort to compensate to some degree for these increased strains these parts would not

272 ALFRED TAYLOR
necessarily be affected. However, it must be kept in mind that the stimulus toward an increased skeletal ratio with in- creased body size applies to the greater part of the bony structure of the body so that it is likely the determiners for the size of the skeleton as a whole would be affected. Further, as Huxley has shown, increased body size is invariably a concomitant factor and if increased body size means an in- creased skeletal ratio it would seem more logical to associate the growth of such heterogonic organs with the skeletal system of which they form a part.
CONCLUDING REMARKS
Weiske (1895) and Burnett ( '08) have shown that the kind of food utilized by an animal may affect the composition, weight and strength of its bones. Such findings would seem to weaken the conclusions reache'd from the data presented in the present paper. It is well to recall again the fact that the bones of the various forms used were checked with regard to bone densities. The variation in the specific gravities of the bones within any one of the splecies studied were found to be so slight as to be negligible. The lack of any significant degree of variation in this respect was the criterion of impor- tance. When old members of a species are compared with younger ones, there is found to exist a definite variation in bone density. Invariably the bones of the older animals have a lower specific gravity than those belonging to the more youthful ones.
Finally, it must be emphasized that the results of the pres- ent investigation apply only to comparable forms and the term comparable includes such items as age, physical condition and diet of the forms compared. It is only when the animals compared differ widely in body size, such as those utilized in the present studies, that the term comparable can be applied in a broader sense, since the tendency for the skeleton to become relatively heavier with increasing body size seems to be strong enough to show in such cases even when all the conditions of comparability are not present.
COMPARATIVE BONE WEIGHTS AND BONE AREAS 273
SUMMARY
1. Data presented on the ratio of fresh skeletal weight to body weight in a series of mammals of varying body sizes indicate that the percentage of total skeletal material becomes progressively higher in comparable mammals with increasing body size.
2. Data presented on the comparative and absolute areas of femora and humeri in a series of mammals of varying body sizes disclose a distinct proportionate decrease in bone area with increasing body size. The relative bone area is, however, higher than would be expected if geometric comparability between smaller and larger mammals prevailed.
3. A mathematical calculation of the skeletal ratios from the data on bone areas confirms the tendency observed in the data on comparative skeletal weights. 4. The relatively larger size of the horns of larger deer
as compared with the horns of smaller deer, and the similar condition prevailing with respect to the horns of the large titanotheres as compared with the horns of the earlier, smaller titanotheres, can be explained on the basis of this tendency for the percentage of skeletal material to be higher in the larger of two comparable mammals. It is unnecessary to assume, therefore, that these phenomena are due to a mysteri- ous orthogenetic trend.
LITERATURE CITED
BERGMANN, AND LEUCXART 1855 Vergleichende Anatomie und Physiologie. Stuttgart.
BISCHOFF, E. 1863 Einige Gewichts und trockeu Bestimmungen der Organe des menschlichen Korpers. Zeitschr. f . Rationelle Medicin., Bd. 20,
BURNETT, E. A. 1908 The effect of food on breaking strength of bones. Bull.
The effect of food on the strength, size, and composition of 24th Ann. Report Agri. Exp. Station, Nebraska,
DOK~LDSON, H. H. 1919 Quantitative studies on the growth of the skeleton of the albino rat.
DU BOIS-REYMOND, R. Uber Dicke und Festigkeit der Knochen bei grossen und kleinen Tieren. Zeitschr. f. wissensch. Zool., Bd. 132, S. 1-36.
S. 75-118.
107 of the Agri. Exp. Station of Nebraska, vol. 21, article 1.
the bones of hogs. 1911
pp. 178-208.
Am. J. Anat., vol. 26, pp. 237-314. 1928
274 ALFRED TAYLOR
DU BOIG, D. AND E. F. 1916 A formula to estimate the approximate surface Arch. Internal Med., vol. 17,
GALILEI, GALILEO 1638 Discorsi e demostraaioni matematiche interno $. due
HUXLEY, J. 5. 1924 Constant differential growth ratios and their significance.
1932 Problems of relative growth. The Dial Press, New York. KLATI, B. 1919 Zur Methodik vergleichender metrischer Untersuchungen,
besonders des Herzgewichtes. Biol. Zentralb., Bd. 39, S. 406. LIEBIG, G. V. 1874 Gewichtsbestimmungen der Organe des menschlichen Korpers.
Arch. f. anat. Physiol. u. wissensch. Med., S. 96-117. OSBORN, H. F. 1929 The titanotheres of ancient Wyoming, Dakota, and Nebras-
ka. Vol. 1 and 2, monograph 55, U. S. Govt. Printing Office, Washing- ton.
PARROT, C. 1894 Uber die Grossenverhaltnisse des Herzens bei VBgeln. Zool. Jahrb., Bd. 7.
PACKARD, A. A. 1898 A text-book of entomology of insects, p. 219. The Maemillan Go., New York.
PLATEAU, J. A. F. 1866 Sur la force musculaire des insects. Bull. de 1’Acad. R. Belge, T. 20, p. 132.
THEILE, F. W. 1884 Gewichtsbestimmungen zur Entwickelung des Muskel- systems und des Skelettes beim Menschen. Durch eine biographische Notie eingeleitet von W. His. 4 Halle, E. Blochmann u. Sohn, in Dresden.
WALTERG, F. M. 1909 Physiologie and Hygeine. D. C. Heath & Go., New York. WEISKE, H. 1895 Weitere Beitrage zur Frage iiber die Wirkung eines Futters
mit sauren Eigenschaften auf den Organismus, insbesondere auf das Skelett. Zeitschr. f. physiol. Chem., Bd. 20, 8. 595-605.
area if height and weight are known. pp. 863-871.
nuovo scienee.
Nature, vol. 114, p. 895.
Leida Elsevirii, Dial. 2, p. 128.