sjs_ song da urban & industrial zone investment and development joint stock company
TRANSCRIPT

8/8/2019 SJS_ Song Da Urban & Industrial Zone Investment and Development Joint Stock Company
http://slidepdf.com/reader/full/sjs-song-da-urban-industrial-zone-investment-and-development-joint-stock 1/57
OneSource One-Stop Report
Song Da Urban & Ind. Zone Invt & Dev.
14 November 2010

8/8/2019 SJS_ Song Da Urban & Industrial Zone Investment and Development Joint Stock Company
http://slidepdf.com/reader/full/sjs-song-da-urban-industrial-zone-investment-and-development-joint-stock 2/57
Song Da Urban & Ind. Zone Invt & Dev.
Fl. 1& 2, CT1 BuildingMy Dinh-Me Tri Urban AreaTu Liem DistrictHanoi,Viet NamTel: 84-4-37684504Fax: 84-4-37684029www.sudicosd.com.vn
Employees: 372
Company Type: Public Independent
Traded: Hochiminh StockExchange:
SJS
IncorporationDate:
08-Jul-2003
Auditor: Auditing and Consulting JointStock Company
Financials in: USD (000)
Fiscal Year End: 31-Dec-2009
Reporting Currency: Vietnamese Dong
Annual Sales: 62,626.6 1
Net Income: 39,610.5
Total Assets: 162,309.3 2
Market Value: 289,003.7
(29-Oct-2010)
Business Description
Song Da Urban & Industrial Zone Investment and Development Joint Stock Company is a Vietnam-based company specializing inreal estate consultancy. The Company provides consultancy services on the investment, development, technical and architecturaldesign of housing residences, industrial zones and other structures. It also sells properties and provides services for urban andindustrial zones. In addition, the Company is involved in the construction of properties, the trading of machinery, as well as themanufacture and merchandise of construction materials and interior products. It has two subsidiaries and eight affiliatedcompanies. For the six months ended 30 June 2010, Song Da Urban & Industrial Zone Investment and Development Joint StockCo's revenues totaled VND462.11B. The Company's net income for the period totaled VND254.33B. Financials are not
comparable to the previous period as the Company has changed reporting basic from consolidated to non-consolidated. TheCompany provides consultancy services on the investment of housing residences, industrial zones.
Source: Reuters
Industry
Industry Real Estate Operations
ANZSIC 2006: 6712 - Non-Residential Property Operators
NACE 2002: 7020 - Letting of own property
NAICS 2002: 53112 - Lessors of Nonresidential Buildings (except Miniwarehouses)
US SIC 1987: 6512 - Operators of Nonresidential Buildings
Key Executives
Name Title Source
Dung Viet Vi General Director, Member of the Board of Management Reuters
Long Kim Vu Chief Accounting Officer Reuters
Vien Khac Bui Deputy General Director Reuters
Diep Ngoc Phan Chairman of the Board of Management Reuters
Viet Xuan Bui Member of the Board of Management Reuters
Significant Developments
Topic #* Most Recent Headline Date
Mergers / Acquisitions 2Song Da Urban & Ind. Zone Invt & Dev. Acquires SUDICO Service Joint StockCompany
13-Aug-2010
Expansion / New Markets /New Units
1 Song Da Urban & Ind. Zone Invt & Dev. Sets up Four New Subsidiaries 24-Sep-2010
Products 2 Song Da Urban & Ind. Zone Invt & Dev. Announces New Project 13-Aug-2010
Equity Financing / Related 3 Song Da Urban & Ind. Zone Invt & Dev. Announces Additional Listing 5-Mar-2010
Positive Earnings Pre-Announcement
1Song Da Urban & Ind. Zone Invt & Dev. Issues FY 2010 Earnings OutlookAbove Analysts' Estimates; to Pay FY 2009 Extra Dividend
13-Apr-2010
* number of significant developments within the last 12 months
OneSource One-Stop Reports for Song Da Urban & Ind. Zone Invt & D
Page 2

8/8/2019 SJS_ Song Da Urban & Industrial Zone Investment and Development Joint Stock Company
http://slidepdf.com/reader/full/sjs-song-da-urban-industrial-zone-investment-and-development-joint-stock 3/57
Financial Summary
As of 30-Sep-2010
Key Ratios Company Industry
Current Ratio (MRQ) 0.31 4.44
Quick Ratio (MRQ) 0.21 3.79
Debt to Equity (MRQ) 0.60 1.72
Sales 5 Year Growth 25.56 12.85
Net Profit Margin (TTM) % 50.06 11.16
Return on Assets (TTM) % 20.57 1.52
Return on Equity (TTM) % 39.04 2.07
Source: Reuters
Stock Snapshot
Traded: Hochiminh Stock Exchange: SJS
As of 29-Oct-2010 Financials in: VND
Recent Price 56,500.00 EP S 8,690.2652 Week High 90,000.00 Pr ice/Sales 5.0552 Week Low 54,000.00 Pr ice/Earnings 4.37Avg. Volume (mil) 0.24 Pr ice/Book 3.19Market Value (mil) 5,632,682.00 Beta 2.03
Price % Change Rel S&P 500%4 Week -14.39% -14.56%13 Week -23.65% -16.68%52 Week -27.49% -6.85%Year to Date -29.37% -22.79%
Source: Reuters
1 - Profit & Loss Item Exchange Rate: USD 1 = VND 17802.09 2 - Balance Sheet Item Exchange Rate: USD 1 = VND 18474
Key IDSM Number: 96609065
© 1983-2010 Reuters Research Inc. All Rights Reserved.Copyright © 2010 Graham & Whiteside Limited
Published by OneSource Information Services, Inc., 2010
OneSource One-Stop Reports for Song Da Urban & Ind. Zone Invt & D
Page 3

8/8/2019 SJS_ Song Da Urban & Industrial Zone Investment and Development Joint Stock Company
http://slidepdf.com/reader/full/sjs-song-da-urban-industrial-zone-investment-and-development-joint-stock 4/57
Song Da Urban & Ind. Zone Invt & Dev. Corporate Overview
Location Fl. 1& 2, CT1 BuildingMy Dinh-Me Tri Urban AreaTu Liem DistrictHanoi, Viet Nam
Tel: 84-4-37684504
Fax:84-4-37684029www.sudicosd.com.vn
Quote Symbol - Exchange SJS - Hochiminh Stock Exchange
Sales VND(mil): 1,114,883.6Assets VND(mil): 2,998,502.3Employees: 372Fiscal Year End: 31-Dec-2009
KeyIDSM : 96609065
Industry: Real Estate Operations
Incorporation Date: 08-Jul-200Company Type: Public IndependeQuoted Status: Quote
General Director, Member of the Board of Management:
DunViet
Company Web Links
Company Contact/E-mail
Corporate History/Profile
Employment Opportunities
Executives
Financial Information
Home Page
Investor Relations
News Releases
Products/Services
Contents
Industry Codes
Business Description
Financial Data
Market Data
Key Corporate Relationships
Industry Codes
ANZSIC 2006 Codes:
6999 - Other Professional, Scientific and Technical Services Not Elsewhere Classified
6921 - Architectural Services
6711 - Residential Property Operators
6712 - Non-Residential Property Operators
3339 - Other Hardware Goods Wholesaling
6923 - Engineering Design and Engineering Consulting Services
3020 - Non-Residential Building Construction
3211 - Land Development and Subdivision
301 - Residential Building Construction
NACE 2002 Codes:
5153 - Wholesale of wood, construction materials and sanitary equipment
7020 - Letting of own property
7011 - Development and selling of real estate
7487 - Other business activities not elsewhere classified
4521 - General construction of buildings and civil engineering works
7420 - Architectural and engineering activities and related technical consultancy
NAI CS 2002 Codes:
541330 - Engineering Services
53112 - Lessors of Nonresidential Buildings (except Miniwarehouses)
423320 - Brick, Stone, and Related Construction Material Merchant Wholesalers
236117 - New Housing Operative Builders
236220 - Commercial and Institutional Building Construction
237210 - Land Subdivision
561990 - All Other Support Services
541310 - Architectural Services
531110 - Lessors of Residential Buildings and Dwellings
531190 - Lessors of Other Real Estate Property
US SIC 1987:
6513 - Operators or Apartment Buildings
OneSource One-Stop Reports for Song Da Urban & Ind. Zone Invt & D
Page 4

8/8/2019 SJS_ Song Da Urban & Industrial Zone Investment and Development Joint Stock Company
http://slidepdf.com/reader/full/sjs-song-da-urban-industrial-zone-investment-and-development-joint-stock 5/57
1542 - General Contractors-Nonresidential Buildings, Other than Industrial Buildings and Warehouses
6552 - Land Subdividers and Developers, Except Cemeteries
6519 - Lessors of Real Property, Not Elsewhere Classified
7389 - Business Services, Not Elsewhere Classified
6512 - Operators of Nonresidential Buildings
1531 - Operative Builders
5032 - Brick, Stone, and Related Construction Materials
8712 - Architectural Services
8711 - Engineering Services
UK SIC 2003:
7487 - Other business activities not elsewhere classified
74201 - Architectural activities
74204 - Engineering consultative and design activities
4521 - General construction of buildings and civil engineering works
45212 - Construction of domestic buildings
70209 - Other letting of own property
7011 - Development and selling of real estate
7020 - Letting of own property
5153 - Wholesale of wood, construction materials and sanitary equipment
Business Description
Song Da Urban & Industrial Zone Investment and Development Joint Stock Company is a Vietnam-based company specializing in reaestate consultancy. The Company provides consultancy services on the investment, development, technical and architectural design ohousing residences, industrial zones and other structures. It also sells properties and provides services for urban and industrial zonesIn addition, the Company is involved in the construction of properties, the trading of machinery, as well as the manufacture andmerchandise of construction materials and interior products. It has two subsidiaries and eight affiliated companies. For the six monthsended 30 June 2010, Song Da Urban & Industrial Zone Investment and Development Joint Stock Co's revenues totaled VND462.11B.The Company's net income for the period totaled VND254.33B. Financials are not comparable to the previous period as the Companyhas changed reporting basic from consolidated to non-consolidated. The Company provides consultancy services on the investment ohousing residences, industrial zones.
Source: Reut ers
More Business Descriptions
Industrial and residential construction and developmentSource: Graham & Whi tes ide
Financial Data
Financials in: VND(mil)
Revenue: 1,114,883.6
Net Income: 705,149.6
Assets: 2,998,502.3
Long Term Debt: 500,000.0
Total Liabilities: 1,229,420.3Working Capital: 75.7
Date of Financial Data: 31-Dec-
2009
1 Year Growth
254.9%
482.1%
88.4%
Market Data
Quote Symbol: SJS
Exchange: Hochiminh Stock Exchange
Currency: VND
Stock Price: 56,500.0
OneSource One-Stop Reports for Song Da Urban & Ind. Zone Invt & D
Page 5

8/8/2019 SJS_ Song Da Urban & Industrial Zone Investment and Development Joint Stock Company
http://slidepdf.com/reader/full/sjs-song-da-urban-industrial-zone-investment-and-development-joint-stock 6/57
Stock Price Date: 10-29-2010
52 Week Price Change % : -27.5
Market Value (mil): 5,632,682.0
SEDOL: B1CBVZ9
ISIN: VN000000SJS9
Equity and Dept Distribution:
IPO: 6 Jul 2006. Pre-IPO shares are stated as pro-forma. 01/2007, Scrip Issue, 3 new shares for every 1 share held. 05/2007, RightsIssue, 1 new share for every 1 share held @ VND 20000 (Factor: 1.906978). 11/2009, Complex caital change (Factor: 2.425595).
Key Corporate Relationships
Auditor: Auditing and Consulting Joint Stock Company
Auditor: Auditing and Consulting Joint Stock Company
© 1983-2010 Reuters Research Inc. All Rights Reserved.
Copyright © 2010 Graham & Whiteside Limited
OneSource One-Stop Reports for Song Da Urban & Ind. Zone Invt & D
Page 6

8/8/2019 SJS_ Song Da Urban & Industrial Zone Investment and Development Joint Stock Company
http://slidepdf.com/reader/full/sjs-song-da-urban-industrial-zone-investment-and-development-joint-stock 7/57
Song Da Urban & I nd. Zone Invt & Dev.Hanoi, , Viet Nam, Tel: 84-4-37684504, URL: http://www.sudicosd.com.vn/, Executives Page
Executives Report
Board of Directors
Name Title Function Source
Diep Ngoc Phan Chairman of the Board of Management Chairman RT
Reuters Biography (Song Da Urban & Ind. Zone Invt & Dev.)
Mr. Phan Ngoc Diep has been serving Song Da Urban and Industrial Zone Investment and Development Joint StockCompany as its Chairman of the Board of Management since November 2006. He has been General Director andMember of the Board of Management at the Company during 2001 and 2006. Before this Company, he had beenHead of Investment Office at Song Da Corporation from 1994 to 2001.
Viet Xuan Bui Member of the Board of Management Director/Board Member RT
Reuters Biography (Song Da Urban & Ind. Zone Invt & Dev.)
Mr. Bui Xuan Viet has been serving as Member of the Board of Management at Song Da Urban and Industrial ZoneInvestment and Development Joint Stock Company since July 2003. He has also been Head of Headquarter's Officeat Song Da Corporation after joining the Corporation in 1974. Mr. Bui holds a Bachelor's degree in Economics.
Quang Hong Dang Member of the Board of Management Director/Board Member RTCuong Phu Nguyen Member of the Board of Management Director/Board Member RT
Reuters Biography (Song Da Urban & Ind. Zone Invt & Dev.)
Mr. Nguyen Phu Cuong has been serving as Member of the Board of Management at Song Da Urban and IndustrialInvestment and Development Joint Stock Company since April 2007. He has been with Vietnam National SeafoodProducts Corporation, Hanoi Office, since 1990, and subsequently been promoted to Head of General Business Officeduring 2001 and 2006. Mr. Nguyen holds a Master's degree of Economics.
Dung Viet ViGeneral Director, Member of the Board of Management
Director/Board Member RT
Su Hong Vu Member of the Board of Management Director/Board Member RT
Reuters Biography (Song Da Urban & Ind. Zone Invt & Dev.)
Mr. Vu Hong Su has been serving as Member of the Board of Management at Song Da Urban and Industrial ZoneInvestment and Development Joint Stock Company since 2001. He joined the Company in 2001 as its Chief Accounting Officer and resigned from this role in 2007. Before the Company, he had been with Song Da No.10 JointStock Company in similar capacity. Mr. Vu holds a Master's degree in Economics.
Executives
Name Title Function Source
Dung Viet ViGeneral Director, Member of the Board of Management
Chief Executive Officer RT
Vu Van Son Deputy General Director Managing Director GW
Long Kim Vu Chief Accounting Officer Accounting Executive RT
Vien Khac Bui Deputy General Director Other RT
Reuters Biography (Song Da Urban & Ind. Zone Invt & Dev.)
Mr. Bui Khac Vien has been Deputy General Director of Song Da Urban and Industrial Zone Investment andDevelopment Joint Stock Company since August 11, 2010, after holding this position from February 2004 toNovember 2007. He is Chairman of the Board of Members of SUDICO An Khanh One Member Company Limited. Hehad been Head of Investment Office at the Company, as well as Managing Director of Southern provinces Office.Before joining the Company, he was with Ministry of Construction of Vietnam from 2001 to 2004. He had also beenSpecialist under Technology Office, and Chief Construction Engineer of a unit of Infrastructure Development andConstruction Corporation during 1996 and 2001. He holds a Bachelor's degree in Construction Engineering.
Dung Ngoc Luu Deputy General Director Other RT
Reuters Biography (Song Da Urban & Ind. Zone Invt & Dev.)
Mr. Luu Ngoc Dung has been Deputy General Director at Song Da Urban and Industrial Zone Investment andDevelopment Joint Stock Company since August 11, 2010, after leaving the position in the Company in March 2008.He is also Chairman of the Board of Members of SUDICO Tien Xuan One Member Company Limited. He joined theCompany in 2001, and had been its Head of Technological Management Office, Director of Investment Consultancyand Architectural Design unit, and Head of Business Planning Office. He had been with another architectural designand development company during 1994 and 2001. He holds a Bachelor's degree in Construction Engineering.
Khuong Vinh Ngo Deputy General Director Other RT
Reuters Biography (Song Da Urban & Ind. Zone Invt & Dev.)
Mr. Ngo Vinh Khuong has been Deputy General Director at Song Da Urban and Industrial Zone Investment and
OneSource One-Stop Reports for Song Da Urban & Ind. Zone Invt & D
Page 7

8/8/2019 SJS_ Song Da Urban & Industrial Zone Investment and Development Joint Stock Company
http://slidepdf.com/reader/full/sjs-song-da-urban-industrial-zone-investment-and-development-joint-stock 8/57
Development Joint Stock Company since August 11, 2010. He is Director of Hanoi Urban Project Management Unit.He holds a Bachelor's degree in Construction Engineering.
Dan Duc Nguyen Deputy General Director Other RT
Reuters Biography (Song Da Urban & Ind. Zone Invt & Dev.)
Mr. Nguyen Duc Dan has been appointed as Deputy General Director of Song Da Urban and Industrial ZoneInvestment and Development Joint Stock Company since 2007. He was Head of Business Planning Office at theCompany from 2004 to 2007 after acting as Deputy Head of the Office. He joined the Company in 2001 as DeputyHead of Development Office after serving Song Da Corporation under its Investment Office and Market Office during1996 and 2001. Mr. Nguyen obtained his Master of Business Administration.
Tru Dinh Tran Deputy General Director Other RT
Thanh Van Vu Deputy General Director Other RT
Reuters Biography (Song Da Urban & Ind. Zone Invt & Dev.)
Mr. Vu Van Thanh has been Deputy General Director of Song Da Urban and Industrial Zone Investment andDevelopment Joint Stock Company since August 2003. He was Deputy Director of Song Da No 12 Joint StockCompany from 2000 to 2003, after acting as Head of Labor Organization Office and Head of Business Planning Officeat the Company during 1989 and 2000. Prior to joining Song Da No.12 Joint Stock Company, he had been with SongDa Corporation from 1987 to 1989.
Dung Van Vu Deputy General Director Other RT
Data Noted as Source: GW, Copyright © 2010 Graham & Whiteside LimitedData Noted as Source: RT, © 1983-2010 Reuters Research Inc. All Rights Reserved.
Published by OneSource Information Services, Inc., Nov, 2010
OneSource One-Stop Reports for Song Da Urban & Ind. Zone Invt & D
Page 8

8/8/2019 SJS_ Song Da Urban & Industrial Zone Investment and Development Joint Stock Company
http://slidepdf.com/reader/full/sjs-song-da-urban-industrial-zone-investment-and-development-joint-stock 9/57
OneSource One-Stop Reports for Song Da Urban & Ind. Zone Invt & D
Page 9

8/8/2019 SJS_ Song Da Urban & Industrial Zone Investment and Development Joint Stock Company
http://slidepdf.com/reader/full/sjs-song-da-urban-industrial-zone-investment-and-development-joint-stock 10/57
Song Da Urban & Ind. Zone Invt & Dev.
Significant Developments
Song Da Urban & I nd. Zone Invt & Dev. Sets up Four New Subsidiaries
Sep 24, 2010
Song Da Urban & Ind. Zone Invt & Dev. announced that it has set up four new subsidiaries. The first one is SUDICO Ha Long JSC(SUDICO Ha Long) at Quang Ninh Province with chartered capital of VND 32.6 billion of which the Company holds 99.69% stake. Thesecond one is SUDICO Hoa Binh JSC (SUDICO HB) at Hoa Binh Province with chartered capital of VND 32.6 billion of which the Compaalso holds 99.69% stake. The third one is Middleland SUDICO JSC (SUDICO Mien Trung) at Da Nang City with chartered capital of VND100 billion of which the Company holds 99.9% stake. The final one is South SUDICO JSC (SUDICO Mien Nam) at Ho Chi Minh City withchartered capital of VND 100 billion of which the Company also holds 99.9% stake.
Song Da Urban & I nd. Zone In vt & Dev. Acquires SUDICO Service Joint Stock CompanyAug 13, 2010
Song Da Urban & Ind. Zone Invt & Dev. announced that it has acquired 375,000 shares of SUDICO Service Joint Stock Company to raits contributing capital to VND 7.65 billion, accounting for 51% of the chartered capital of SUDICO Service Joint Stock Company.
Song Da Urban & Ind. Zone Invt & Dev. Announces New ProjectAug 13, 2010
Song Da Urban & Ind. Zone Invt & Dev. announced that it has invested in Ho Song Dam Urban Area in Tam Ky City, Quang NamProvince, Vietnam with area of around 600 hectares. The project will be completed in 6 months from July 23, 2010.
Song Da Urban & Ind. Zone Invt & Dev. Announces Project in Da Nan g City and Cooperation on P roject in Nha Trang CiJun 28, 2010
Song Da Urban & Ind. Zone Invt & Dev. announced that it has received the land belonging to Hoa Hai New Urban Area Project in Da NaCity with total area of 120,378 square meters where it will construct high class hotel, apartment building and villas. The Company willcooperate with Van Phong Investment & Development Joint Stock Company and Central Area Electricity Investment & Development Jo
Stock Company in a new project named Cantus Cam Ranh Resort & Spa in Nha Trang City. The initial invesment cost is VND 35.7 billiin which the Company will contribute 70%, Van Phong Investment & Development Joint Stock Company will contribute 20% and CentrArea Electricity Investment & Development Joint Stock Company will contribute 10%. Three parties will negotiate their contribution forthe next stage later.
Song Da Urban & In d. Zone Invt & Dev. Acquires CompanyJun 08, 2010
Song Da Urban & Ind. Zone Invt & Dev. announced that it has signed a contract with House Construction - Investment - Development Trading Joint Stock Company on May 10, 2010. Under the contract, the Company will acquire 60% chartered capital of Thang LongCorporation from House Construction - Investment - Development - Trading Joint Stock Company.
Song Da Urban & Ind. Zone Invt & Dev. Issues FY 201 0 Earnings Outlook Above Anal ysts' Estimates; to Pay FY 2 009
Extra DividendApr 13, 2010
Song Da Urban & Ind. Zone Invt & Dev. announced that it expects revenue of VND 2,312 billion and pretax profit of VND 1,006 billion ffiscal year 2010. According to Reuters Estimates, analysts on the average are expecting the Company to report revenue of VND1,697.318 billion and pretax profit of VND 718.271 billion for the year. It plans to pay VND 500 per share as extra cash dividend for fisyear 2009.
Song Da Urban & I nd. Zone Invt & Dev. to Pay H2 2 009 DividendMar 08, 2010
OneSource One-Stop Reports for Song Da Urban & Ind. Zone Invt & D
Page 10

8/8/2019 SJS_ Song Da Urban & Industrial Zone Investment and Development Joint Stock Company
http://slidepdf.com/reader/full/sjs-song-da-urban-industrial-zone-investment-and-development-joint-stock 11/57
Song Da Urban & Ind. Zone Invt & Dev. announced that it will pay VND 500 per share as cash dividend for the second half of fiscal yea2009. Shareholders of record on March 18, 2010 will be paid on April 22, 2010.
Song Da Urban & Ind. Zone Invt & Dev. Announces Addition al ListingMar 05, 2010
Song Da Urban & Ind. Zone Invt & Dev. announced that it will list 20 million common shares sold to existing shareholders under 2:1rights issue in November 2009 on Hochiminh Stock Exchange. The shares will start trading from March 11, 2010.
Song Da Urban & Ind. Zone Invt & Dev. Announces Addition al ListingDec 21, 2009
Song Da Urban & Ind. Zone Invt & Dev. announced that it will list an additional 40 million common shares on Hochiminh Stock Exchangand the shares will start trading from December 25, 2009. These are bonus shares distributed to existing shareholders as reported inNovember 2009.
Song Da Urban & Ind. Zone Invt & Dev. Sells SharesNov 27, 2009
Song Da Urban & Ind. Zone Invt & Dev. announced that it has sold out its 250,000 treasury shares from November 4, 2009 to Novemb25, 2009.
Song Da Urban & I nd. Zone Invt & Dev. to Offer New Equity; to Distribute Bonus SharesNov 20, 2009
Song Da Urban & Ind. Zone Invt & Dev. announced that it will distribute 40 million shares to existing shareholders as bonus shares atpayout ratio 1:1 on December 25, 2009. Another 20 million shares will be sold to existing shareholders under 2:1 rights issue at VND10,000 per share on February 12, 2010. Shareholder records will be finalized by December 1, 2009. This is the update of the planreported on September 2009.
©1983-2010 Reuters Research Inc. All Rights Reserved.Published by OneSource Information Services, Inc.,Nov, 2010
OneSource One-Stop Reports for Song Da Urban & Ind. Zone Invt & D
Page 11

8/8/2019 SJS_ Song Da Urban & Industrial Zone Investment and Development Joint Stock Company
http://slidepdf.com/reader/full/sjs-song-da-urban-industrial-zone-investment-and-development-joint-stock 12/57
OneSource One-Stop Reports for Song Da Urban & Ind. Zone Invt & D
Page 12

8/8/2019 SJS_ Song Da Urban & Industrial Zone Investment and Development Joint Stock Company
http://slidepdf.com/reader/full/sjs-song-da-urban-industrial-zone-investment-and-development-joint-stock 13/57

8/8/2019 SJS_ Song Da Urban & Industrial Zone Investment and Development Joint Stock Company
http://slidepdf.com/reader/full/sjs-song-da-urban-industrial-zone-investment-and-development-joint-stock 14/57
Articles: 0 Matches
OneSource One-Stop Reports for Song Da Urban & Ind. Zone Invt & D
Page 14

8/8/2019 SJS_ Song Da Urban & Industrial Zone Investment and Development Joint Stock Company
http://slidepdf.com/reader/full/sjs-song-da-urban-industrial-zone-investment-and-development-joint-stock 15/57
Song Da Urban & I nd. Zone Invt & Dev.
Hanoi, Viet Nam, Tel: 84-4-37684504,URL: http://www.sudicosd.com.vn/
Annual In come Statement
Financials in: USD (000)
Except for share items (millions) and per share items (actual units)
Financial Glossary
31-Dec-2009 31-Dec-2008 31-Dec-2007 31-Dec-2006 31-Dec-2005Period Length 12 Months 12 Months 12 Months 12 Months 12 Months
UpdateType/Date Updated Normal31-Dec-2009
Updated Normal31-Dec-2008
Updated Normal31-Dec-2007
Updated Normal31-Dec-2006
RestatedNormal
31-Dec-2006
Filed Currency VND VND VND VND VND
Exchange Rate (Period Average) 17802.088493 16452.496831 16083.860656 15990.427596 15854.243169
Auditor Auditing andConsulting JointStock Company
Auditing andConsulting JointStock Company
Auditing andConsulting JointStock Company
Auditing andConsulting JointStock Company
Auditing andConsulting JointStock Company
Auditor Opinion Unqualified Unqualified withExplanation
Unqualified Unqualified Unqualified
Gross Revenue 62,626.6 19,094.3 44,025.9 21,019.4 23,847.8
Sales Returns and Allowances - - - - -6.6
Revenue 62,626.6 19,094.3 44,025.9 21,019.4 23,841.2
Total Revenue 62,626.6 19,094.3 44,025.9 21,019.4 23,841.2
Cost of Revenue 22,776.1 7,421.9 20,911.2 12,850.4 12,565.6
Cost of Revenue, Total 22,776.1 7,421.9 20,911.2 12,850.4 12,565.6
Gross P rofit 39,850.5 11,672.5 23,114.7 8,169.0 11,275.6
Selling/General/AdministrativeExpense
2,052.5 1,783.6 1,654.7 1,027.3 867.0
TotalSell ing/General/ Administrative
Expenses
2,052.5 1,783.6 1,654.7 1,027.3 867.0
Depreciation 90.2 89.1 - - -
Depreciation/ Amortization 90.2 89.1 - - -
Interest Expense - Operating 300.6 169.6 - - -
Interest Expense - Net Operating 300.6 169.6 - - -
Interest Income - Operating -759.3 -129.7 -396.5 -157.3 -475.2
Investment Income - Operating -11,179.7 -1,155.2 -361.9 -195.2 -100.9
Interest/Investment Income -Operating
-11,938.9 -1,284.9 -758.4 -352.5 -576.1
Interest Expense (Income) - NetOperating Total
-11,638.4 -1,115.3 -758.4 -352.5 -576.1
Unrealized Losses (Gains) 0.0 0.0 - - -
Other Operating Expense 92.4 -15.4 -77.0 - -
Other Operating Expenses, Total 92.4 -15.5 -77.0 - -
Total Operating Expense 13,372.8 8,163.8 21,730.5 13,525.2 12,856.6
Operating Income 49,253.8 10,930.6 22,295.4 7,494.2 10,984.6
Gain (Loss) on Sale of Assets -128.1 - 0.0 0.0 19.9
Other Non-Operating Income(Expense)
-921.5 -17.7 42.4 0.6 -17.3
Other, Net -921.5 -17.7 42.4 0.6 -17.3
I ncome Before Tax 48,204.2 10,912.9 22,337.8 7,494.8 10,987.2
OneSource One-Stop Reports for Song Da Urban & Ind. Zone Invt & D
Page 15

8/8/2019 SJS_ Song Da Urban & Industrial Zone Investment and Development Joint Stock Company
http://slidepdf.com/reader/full/sjs-song-da-urban-industrial-zone-investment-and-development-joint-stock 16/57
Total Income Tax 9,061.7 3,304.6 0.0 0.0 0.0
I ncome After Tax 39,142.5 7,608.2 22,337.8 7,494.8 10,987.2
Equity In Affiliates 468.0 -382.4 - - -
Net Income Before Extraord I tems 39,610.5 7,225.9 22,337.8 7,494.8 10,987.2
Net Income 39,610.5 7,225.9 22,337.8 7,494.8 10,987.2
Miscellaneous Earnings Adjustment -735.0 - - - -
Total Adjustments to Net Income -735.0 - - - -
Income Available to Common ExclExtraord Items
38,875.5 7,225.9 22,337.8 7,494.8 10,987.2
Income Available to Common InclExtraord Items
38,875.5 7,225.9 22,337.8 7,494.8 10,987.2
Basic/Primary Weighted AverageShares
79.9 96.6 60.5 92.5 92.5
Basic EPS Excl Extraord Items 0.49 0.07 0.37 0.08 0.12
Basic/Primary EPS Incl Extraord Items 0.49 0.07 0.37 0.08 0.12
Diluted Net Income 38,875.5 7,225.9 22,337.8 7,494.8 10,987.2
Diluted Weighted Average Shares 79.9 96.6 60.5 92.5 92.5
Diluted EPS Excl Extraord Items 0.49 0.07 0.37 0.08 0.12
Diluted EPS Incl Extraord Items 0.49 0.07 0.37 0.08 0.12
Dividends per Share - Common StockPrimary Issue
0.05 0.04 0.05 0.03 0.00
Gross Dividends - Common Stock - - 4,942.8 - 0.0
Interest Expense, Supplemental 300.6 169.6 - - -
Depreciation, Supplemental 153.8 120.7 105.0 94.9 82.8
Total Special Items 128.1 - 0.0 0.0 -19.9
Normalized Income Before Tax 48,332.3 10,912.9 22,337.8 7,494.8 10,967.3
Effect of Special Items on Income
Taxes
24.1 - 0.0 0.0 0.0
Inc Tax Ex Impact of Sp Items 9,085.8 3,304.6 0.0 0.0 0.0
Normalized Income After Tax 39,246.5 7,608.2 22,337.8 7,494.8 10,967.3
Normalized Inc. Avail to Com. 38,979.5 7,225.9 22,337.8 7,494.8 10,967.3
Basic Normalized EPS 0.49 0.07 0.37 0.08 0.12
Diluted Normalized EPS 0.49 0.07 0.37 0.08 0.12
Amort of Intangibles, Supplemental 28.1 30.6 265.5 332.1 382.4
Normalized EBIT 37,615.4 9,815.2 21,537.0 7,141.7 10,408.5
Normalized EBITDA 37,797.3 9,966.6 21,907.6 7,568.7 10,873.7
Current Tax - Total 8,646.1 3,869.5 - - -
Current Tax - Total 8,646.1 3,869.5 - - -
Deferred Tax - Total 415.6 -564.9 - - -
Deferred Tax - Total 415.6 -564.9 - - -
Income Tax - Total 9,061.7 3,304.6 - - -
Annual Balance Sheet
OneSource One-Stop Reports for Song Da Urban & Ind. Zone Invt & D
Page 16

8/8/2019 SJS_ Song Da Urban & Industrial Zone Investment and Development Joint Stock Company
http://slidepdf.com/reader/full/sjs-song-da-urban-industrial-zone-investment-and-development-joint-stock 17/57
Financials in: USD (000)
Financial Glossary
31-Dec-2009 31-Dec-2008 31-Dec-2007 31-Dec-2006 31-Dec-2005
UpdateType/Date Updated Normal31-Dec-2009
Updated Normal31-Dec-2008
Updated Normal31-Dec-2007
ReclassifiedNormal
31-Dec-2007
RestatedNormal
31-Dec-2006
Filed Currency VND VND VND VND VND
Exchange Rate 18474 17483 16016.5 16056 15914
Auditor Auditing andConsulting JointStock Company
Auditing andConsulting JointStock Company
Auditing andConsulting JointStock Company
Auditing andConsulting JointStock Company
Auditing andConsulting JointStock Company
Auditor Opinion Unqualified Unqualified withExplanation
Unqualified Unqualified Unqualified
Cash 4,981.0 378.5 7,540.1 1,327.1 3,119.1
Cash & Equivalents 33,344.2 146.9 - - -
Short Term Investments 4,554.0 - 2,184.0 - 2,363.9
Cash and Short Term Investments 42,879.2 525.4 9,724.1 1,327.1 5,483.0
Accounts Receivable - Trade,Gross
3,380.9 8,076.1 14,535.4 12,536.0 14,060.5
Provision for Doubtful Accounts -480.4 -586.4 - - -
Trade Accounts Receivable - Net 2,900.5 7,489.7 14,535.4 12,536.0 14,060.5
Other Receivables 128.8 1,003.1 209.0 914.9 1,748.2
Total Receivables, Net 3,029.2 8,492.8 14,744.4 13,450.9 15,808.7
Inventories - Finished Goods - - 493.6 558.0 22.2
Inventories - Work In Progress 4,165.8 1,399.2 32.4 203.7 202.0
Inventories - Raw Materials - - 0.0 1.9 2.6
Total I nventory 4,165.8 1,399.2 526.0 763.7 226.8
Prepaid Expenses 2,754.6 1,574.5 2,051.0 2,253.7 2,402.0
Other Current Assets 877.6 542.7 467.4 108.9 149.0
Other Current Assets, Total 877.6 542.7 467.4 108.9 149.0
Total Current Assets 53,706.4 12,534.7 27,512.9 17,904.3 24,069.5
Buildings 777.1 977.7 804.8 237.9 -Machinery/Equipment 1,050.8 526.3 478.3 501.3 456.8
Construction in Progress 91,062.9 57,801.9 48,724.5 36,037.3 22,878.3
Other Property/Plant/Equipment 11.4 12.0 5.3 2.9 3.0
Property/Plant/Equipment - Gross 92,902.3 59,317.9 50,012.9 36,779.4 23,338.0
Accumulated Depreciation -518.6 -460.4 -386.3 -336.9 -192.3
Property/ P lant/ Equipment - Net 92,383.7 58,857.5 49,626.5 36,442.5 23,145.8
Intangibles - Gross 1,728.9 1,826.9 1,994.2 1,992.1 2,007.1
Accumulated IntangibleAmortization
-1,604.9 -1,667.3 -1,788.5 -1,520.3 -1,200.2
Intangibles, Net 124.0 159.7 205.7 471.8 806.8
LT Investment - Affiliate Companies 4,640.1 10,345.0 12,419.9 2,065.5 1,954.2
LT Investments - Other 11,331.1 8,574.4 6,829.7 1,404.3 468.8
Long Term Investments 15,971.1 18,919.4 19,249.5 3,469.8 2,423.0
Deferred Income Tax - Long TermAsset
102.6 531.6 - - -
Other Long Term Assets 21.4 8.5 7.9 21.5 4.3
Other Long Term Assets, Total 124.0 540.1 7.9 21.5 4.3
Total Assets 162,309.3 91,011.3 96,602.5 58,309.9 50,449.4
Accounts Payable 3,033.2 7,508.7 8,394.6 7,610.1 6,579.9
Accrued Expenses 2,885.3 818.8 211.0 130.1 126.9
OneSource One-Stop Reports for Song Da Urban & Ind. Zone Invt & D
Page 17

8/8/2019 SJS_ Song Da Urban & Industrial Zone Investment and Development Joint Stock Company
http://slidepdf.com/reader/full/sjs-song-da-urban-industrial-zone-investment-and-development-joint-stock 18/57
Notes Payable/Short Term Debt 0.0 2,859.9 0.0 0.0 0.0
Current Portion - Long TermDebt/Capital Leases
0.0 2,087.7 - - -
Customer Advances 18,119.8 501.3 4,942.7 4,073.8 11,149.1
Income Taxes Payable 13,039.8 3,808.0 1,108.2 1,536.9 856.9
Other Payables 2,382.7 284.5 597.6 379.0 600.3
Other Current liabilities, Total 33,542.3 4,593.8 6,648.5 5,989.7 12,606.3
Total Current Liabil ities 39,460.8 17,868.9 15,254.2 13,730.0 19,313.1
Long Term Debt 27,065.1 7,435.8 1,971.1 10,757.3 3,141.9
Total Long Term Debt 27,065.1 7,435.8 1,971.1 10,757.3 3,141.9
Total Debt 27,065.1 12,383.5 1,971.1 10,757.3 3,141.9
Pension Benefits - Underfunded 8.2 13.0 24.2 17.9 13.5
Other Long Term Liabilities 14.6 1.7 1.9 4.6 0.6
Other Liabilities, Total 22.8 14.7 26.1 22.5 14.0
Total Liabilities 66,548.7 25,319.4 17,251.3 24,509.8 22,469.0
Common Stock 43,304.1 22,879.4 24,974.2 3,114.1 3,141.9
Common Stock 43,304.1 22,879.4 24,974.2 3,114.1 3,141.9
Additional Paid-In Capital 11,817.1 11,423.5 12,469.5 - -Retained Earnings (AccumulatedDeficit)
37,350.6 4,814.7 24,317.2 10,741.9 12,437.3
Treasury Stock - Common 0.0 -1,548.4 - - -
Other Equity 3,288.9 28,122.6 17,590.3 19,944.1 12,401.2
Other Equity, Total 3,288.9 28,122.6 17,590.3 19,944.1 12,401.2
Total Equity 95,760.6 65,691.8 79,351.2 33,800.1 27,980.4
Total Liabil it ies & Shareholders’ Equity
162,309.3 91,011.3 96,602.5 58,309.9 50,449.4
Shares Outstanding - CommonStock Primary Issue
100.0 96.4 97.0 92.5 92.5
Total Common Shares Outstanding 100.0 96.4 97.0 92.5 92.5
Treasury Shares - Common StockPrimary Issue
- 0.6 - - -
Employees - - - 372 -
Accumulated Intangible Amort, Suppl. 1,604.9 1,667.3 1,788.5 1,520.3 1,200.2
Deferred Revenue - Current 18,119.8 501.3 4,942.7 4,073.8 11,149.1
Total Long Term Debt, Supplemental 27,065.1 9,523.5 - - -
Long Term Debt Maturing within 1 Year 5,413.0 2,087.7 - - -
Long Term Debt Maturing in Year 2 5,413.0 1,858.9 - - -
Long Term Debt Maturing in Year 3 5,413.0 1,858.9 - - -
Long Term Debt Maturing in Year 4 5,413.0 1,858.9 - - -
Long Term Debt Maturing in Year 5 5,413.0 1,858.9 - - -
Long Term Debt Maturing in 2-3 Years 10,826.0 3,717.9 - - -Long Term Debt Maturing in 4-5 Years 10,826.0 3,717.9 - - -
Long Term Debt Matur. in Year 6 & Beyond
0.0 0.0 - - -
Annual Cash Flows
Financials in: USD (000)
OneSource One-Stop Reports for Song Da Urban & Ind. Zone Invt & D
Page 18

8/8/2019 SJS_ Song Da Urban & Industrial Zone Investment and Development Joint Stock Company
http://slidepdf.com/reader/full/sjs-song-da-urban-industrial-zone-investment-and-development-joint-stock 19/57
Financial Glossary
31-Dec-2009 31-Dec-2008 31-Dec-2007 31-Dec-2006 31-Dec-2005
Period Length 12 Months 12 Months 12 Months 12 Months 12 Months
UpdateType/Date Updated Normal31-Dec-2009
Updated Normal31-Dec-2008
Updated Normal31-Dec-2007
ReclassifiedNormal
31-Dec-2007
ReclassifiedNormal
31-Dec-2006
Filed Currency VND VND VND VND VND
Exchange Rate (Period Average) 17802.088493 16452.496831 16083.860656 15990.427596 15854.243169
Auditor Auditing andConsulting JointStock Company
Auditing andConsulting JointStock Company
Auditing andConsulting JointStock Company
Auditing andConsulting JointStock Company
Auditing andConsulting JointStock Company
Auditor Opinion Unqualified Unqualified withExplanation
Unqualified Unqualified Unqualified
Net Income/Starting Line 48,672.2 10,530.5 22,337.8 7,494.8 10,987.2
Depreciation 191.6 151.3 370.5 427.4 532.7
Depreciation/ Depletion 191.6 151.3 370.5 427.4 532.7
Other Non-Cash Items -11,134.4 648.6 -835.5 -352.5 -169.2
Non-Cash Items -11,134.4 648.6 -835.5 -352.5 -169.2
Accounts Receivable 2,570.5 3,708.5 -17,948.7 2,369.5 -5,727.1
Inventories -40,714.8 -16,136.4 238.6 -13,957.1 -13,588.6
Prepaid Expenses -29.8 23.9 -6.3 6.7 39.0Accounts Payable 17,807.8 -2,045.7 3,181.0 -4,261.0 5,203.0
Taxes Payable -677.3 -4,590.0 - - -1,119.6
Other Operating Cash Flow -1,440.7 -1,155.6 -1,950.6 -1,787.2 -636.6
Changes in Working Capital -22,484.4 -20,195.2 -16,485.9 -17,629.1 -15,829.8
Cash from Operating Activities 15,245.0 -8,864.8 5,386.9 -10,059.3 -4,479.1
Purchase of Fixed Assets -833.9 -265.7 -37.0 -96.8 -43.4
Capital Expenditures -833.9 -265.7 -37.0 -96.8 -43.4
Sale of Fixed Assets 95.3 - 0.0 58.1 19.9
Sale/Maturity of Investment 2.8 2,132.2 0.0 2,352.6 3,469.1
Purchase of Investments -8,459.1 -2,830.7 -15,178.3 -1,447.8 -435.8
Other Investing Cash Flow 18,064.7 642.5 754.3 527.6 149.3Other Investing Cash Flow Items,Total
9,703.7 -55.9 -14,424.1 1,490.4 3,202.5
Cash from Investing Activit ies 8,869.7 -321.6 -14,461.0 1,393.6 3,159.1
Other Financing Cash Flow -3,349.0 -7,247.4 -849.7 -780.5 -788.4
Financing Cash Flow Items -3,349.0 -7,247.4 -849.7 -780.5 -788.4
Sale/Issuance of Common 2,564.9 - 24,883.5 - -
Repurchase/Retirement of Common
0.0 -1,645.3 - - -
Common Stock, Net 2,564.9 -1,645.3 24,883.5 - -
Issuance (Retiremen t) of Stock,Net
2,564.9 -1,645.3 24,883.5 - -
Total Debt Issued 37,213.0 15,195.3 1,701.1 11,426.8 3,153.7
Total Debt Reduction -21,287.9 -3,955.0 -10,477.0 -3,752.2 -
Issuance (Retirement) of Debt,Net
15,925.1 11,240.3 -8,775.9 7,674.6 3,153.7
Cash from Financing Activit ies 15,141.0 2,347.5 15,257.9 6,894.1 2,365.3
Foreign Exchange Effects - 0.0 - - -
Net Change in Cash 39,255.7 -6,838.9 6,183.7 -1,771.6 1,045.3
Net Cash - Beginning Balance 516.0 7,397.2 1,324.8 3,104.2 2,085.6
OneSource One-Stop Reports for Song Da Urban & Ind. Zone Invt & D
Page 19

8/8/2019 SJS_ Song Da Urban & Industrial Zone Investment and Development Joint Stock Company
http://slidepdf.com/reader/full/sjs-song-da-urban-industrial-zone-investment-and-development-joint-stock 20/57
Net Cash - Ending Balance 39,771.7 558.3 7,508.6 1,332.6 3,130.9
Cash Interest Paid 300.6 200.8 1,125.6 1,166.1 -
Cash Taxes Paid 677.3 4,590.0 - - 1,119.6
© 1983-2010 Reuters Research Inc. All Rights Reserved.
Published by OneSource Information Services, Inc., November, 2010.
OneSource One-Stop Reports for Song Da Urban & Ind. Zone Invt & D
Page 20

8/8/2019 SJS_ Song Da Urban & Industrial Zone Investment and Development Joint Stock Company
http://slidepdf.com/reader/full/sjs-song-da-urban-industrial-zone-investment-and-development-joint-stock 21/57
Song Da Urban & I nd. Zone Invt & Dev.
Hanoi, Viet Nam, Tel: 84-4-37684504,URL: http://www.sudicosd.com.vn/
Annual In come Statement
Financials in: USD (000)
Except for share items (millions) and per share items (actual units)
31-Dec-2009 31-Dec-2008 31-Dec-2007 31-Dec-2006 31-Dec-2005
Period Length 12 Months 12 Months 12 Months 12 Months 12 Months
UpdateType/Date Updated Normal31-Dec-2009
Updated Normal31-Dec-2008
Updated Normal31-Dec-2007
Updated Normal31-Dec-2006
RestatedNormal
31-Dec-2006
Filed Currency VND VND VND VND VND
Exchange Rate (Period Average) 17802.088493 16452.496831 16083.860656 15990.427596 15854.243169
Auditor Auditing andConsulting JointStock Company
Auditing andConsulting JointStock Company
Auditing andConsulting JointStock Company
Auditing andConsulting JointStock Company
Auditing andConsulting JointStock Company
Auditor Opinion Unqualified Unqualified withExplanation
Unqualified Unqualified Qualified
Gross Sales 62,626.6 19,094.3 44,025.9 21,019.4 23,847.8Sales Returns and Allowances - - - - -6.6
Total Revenue 62,626.6 19,094.3 44,025.9 21,019.4 23,841.2
Cost of Goods Sold 22,776.1 7,421.9 20,911.2 12,850.4 12,565.6
Interest Income -759.3 -129.7 -396.5 -157.3 -475.2
Income from Debtors - - -77.1 - -
Gain from Investment -297.3 -1,132.4 -15.7 -195.2 -100.9
Dividend Income -516.7 -162.6 -346.2 - -
Income from Sale of Affiliates -10,287.7 - - - -
Income from Financial Activities -258.1 -19.1 - - -
Unrealized Gains from Foreign
Exchange
0.0 0.0 - - -
Interest Expense 300.6 169.6 - - -
Provision for Investment -77.9 139.9 - - -
Expense from Financial Activities 350.5 3.7 0.1 - -
Selling Expense 41.4 75.8 58.1 31.9 40.8
Depreciation Expense 90.2 89.1 - - -
General and AdministrativeExpenses
2,011.1 1,707.8 1,596.6 995.4 826.3
Total Operating Expense 13,372.8 8,163.8 21,730.5 13,525.2 12,856.6
Gain on Sale of Fixed Assets - - 0.0 58.1 19.9
Other Non-Operating Income 97.5 2.3 45.4 0.6 2.4
Loss on Sale of Assets -128.1 - 0.0 -58.1 -
Other Non-Operating Expense -1,019.1 -20.0 -3.0 - -19.7
Net Income Before Taxes 48,204.2 10,912.9 22,337.8 7,494.8 10,987.2
Provision for Income Taxes 9,061.7 3,304.6 0.0 0.0 0.0
Net Income After Taxes 39,142.5 7,608.2 22,337.8 7,494.8 10,987.2
Equity in Affiliates 468.0 -382.4 - - -
Net Income Before Extra. I tems 39,610.5 7,225.9 22,337.8 7,494.8 10,987.2
Net Income 39,610.5 7,225.9 22,337.8 7,494.8 10,987.2
OneSource One-Stop Reports for Song Da Urban & Ind. Zone Invt & D
Page 21

8/8/2019 SJS_ Song Da Urban & Industrial Zone Investment and Development Joint Stock Company
http://slidepdf.com/reader/full/sjs-song-da-urban-industrial-zone-investment-and-development-joint-stock 22/57

8/8/2019 SJS_ Song Da Urban & Industrial Zone Investment and Development Joint Stock Company
http://slidepdf.com/reader/full/sjs-song-da-urban-industrial-zone-investment-and-development-joint-stock 23/57
Cash Equivalents 33,344.2 146.9 - - -
Short Term Investment 4,555.2 - 2,184.0 - 2,363.9
Provision for Short TermInvestment
-1.2 - - - -
Accounts Receivable 3,380.9 8,076.1 14,535.4 12,536.0 14,060.5
Prepayment to Suppliers 2,710.3 1,543.9 2,013.8 2,236.6 2,360.6
Other Receivables 128.8 1,003.1 209.0 914.9 1,748.2
Provision for Doubtful Account -480.4 -586.4 - - -
Raw Materials - - 0.0 1.9 2.6
Work in Progress 4,165.8 1,399.2 32.4 203.7 202.0
Finished Goods - - 0.0 48.6 -
Merchandise - - 493.6 492.4 22.2
Goods on Consignment - - 0.0 17.0 -
Short Term Prepaid Expense 44.3 30.6 37.2 17.1 41.4
Claimable VAT 58.2 71.9 7.4 2.3 4.9
Other Current Assets 819.4 470.9 460.1 106.6 144.0
Total Current Assets 53,706.4 12,534.7 27,512.9 17,904.3 24,069.5
Buildings and Structures 777.1 977.7 804.8 237.9 -
Machinery and Equipment 56.5 52.5 26.3 26.2 26.4
Transportation Equipment 796.3 315.6 314.2 353.1 323.1
Office Equipment 198.0 158.2 137.7 121.9 107.2
Other Fixed Assets 11.4 12.0 5.3 2.9 3.0
Accumulated Depreciation -518.6 -460.4 -386.3 -336.9 -192.3
Intangibles, Gross 1,728.9 1,826.9 1,994.2 1,992.1 2,007.1
Accumulated IntangibleAmortization
-1,604.9 -1,667.3 -1,788.5 -1,520.3 -1,200.2
Construction in Progress 91,062.9 57,801.9 48,724.5 36,037.3 22,878.3
Investment in Properties 233.5 - - - -
Accumulated Depreciation -9.3 - - - -
Investment in Subsidiaries 0.0 - 572.1 - -
Investment in Affiliates 4,640.1 10,345.0 11,847.8 2,065.5 1,954.2
Other Long Term Investment 11,510.7 8,706.0 6,829.7 1,404.3 468.8
Provision for LT Investment -403.9 -131.6 - - -
Long Term Prepaid Expense 21.4 8.5 7.9 21.5 4.3
Deferred Income Tax 102.6 531.6 - - -
Total Assets 162,309.3 91,011.3 96,602.5 58,309.9 50,449.4
Short Term Borrowings 0.0 2,859.9 - - -
Current Portion of Long Term Debt 0.0 2,087.7 - - -
Accounts Payable 3,033.2 7,508.7 8,394.6 7,610.1 6,579.9
Customer Advances 18,119.8 501.3 4,942.7 4,073.8 11,149.1
Taxes Payable 13,039.8 3,808.0 1,108.2 1,536.9 856.9
Accrued Salary 677.6 256.6 211.0 129.8 126.7
Accrued Expenses 2,207.7 562.3 0.0 0.3 0.2
Other Payables 2,382.7 284.5 597.6 379.0 600.3
Total Current Liabil ities 39,460.8 17,868.9 15,254.2 13,730.0 19,313.1
Long Term Borrowings 27,065.1 7,435.8 1,971.1 10,757.3 3,141.9
Total Long Term Debt 27,065.1 7,435.8 1,971.1 10,757.3 3,141.9
Other Long Term Payables 14.6 1.7 1.9 4.6 0.6
Reserve for Severance Allowances 8.2 13.0 24.2 17.9 13.5
Total Liabilities 66,548.7 25,319.4 17,251.3 24,509.8 22,469.0
OneSource One-Stop Reports for Song Da Urban & Ind. Zone Invt & D
Page 23

8/8/2019 SJS_ Song Da Urban & Industrial Zone Investment and Development Joint Stock Company
http://slidepdf.com/reader/full/sjs-song-da-urban-industrial-zone-investment-and-development-joint-stock 24/57
Common Stock 43,304.1 22,879.4 24,974.2 3,114.1 3,141.9
Paid-In Capital 11,817.1 11,423.5 12,469.5 - -
Treasury Stock 0.0 -1,548.4 - - -
Fund for Development 1,151.1 26,211.0 16,328.9 19,428.6 11,922.4
Fund for Financial Contingencies 1,890.7 1,750.8 1,259.2 321.9 324.8
Retained Earnings 37,350.6 4,814.7 24,317.2 10,741.9 12,437.3
Fund for Bonus and Welfare 247.1 160.7 2.2 193.5 154.0
Total Equity 95,760.6 65,691.8 79,351.2 33,800.1 27,980.4
Total Liabil it ies & Shareholders'Equity
162,309.3 91,011.3 96,602.5 58,309.9 50,449.4
S/O-Common Stock 100.0 96.4 97.0 92.5 92.5
Total Common Shares Outstanding 100.0 96.4 97.0 92.5 92.5
T/S-Common Stock - 0.6 - - -
Customer Advances 18,119.8 501.3 4,942.7 4,073.8 11,149.1
Accumulated Amortization of Intangibles
1,604.9 1,667.3 1,788.5 1,520.3 1,200.2
Full-Time Employees - - - 372 -
Long Term Debt Maturing within 1 Year - 2,087.7 - - -
Long Term Debt Maturing from 1 to 5Yrs
27,065.1 7,435.8 - - -
Total Long Term Debt, Supplemental 27,065.1 9,523.5 - - -
Annual Cash Flows
Financials in: USD (000)
31-Dec-2009 31-Dec-2008 31-Dec-2007 31-Dec-2006 31-Dec-2005
Period Length 12 Months 12 Months 12 Months 12 Months 12 Months
UpdateType/Date Updated Normal31-Dec-2009
Updated Normal31-Dec-2008
Updated Normal31-Dec-2007
ReclassifiedNormal
31-Dec-2007
ReclassifiedNormal
31-Dec-2006
Filed Currency VND VND VND VND VND
Exchange Rate (Period Average) 17802.088493 16452.496831 16083.860656 15990.427596 15854.243169
Auditor Auditing andConsulting JointStock Company
Auditing andConsulting JointStock Company
Auditing andConsulting JointStock Company
Auditing andConsulting JointStock Company
Auditing andConsulting JointStock Company
Auditor Opinion Unqualified Unqualified withExplanation
Unqualified Unqualified Qualified
Net Income 48,672.2 10,530.5 22,337.8 7,494.8 10,987.2
Depreciation 191.6 151.3 370.5 427.4 532.7
Provisions 213.8 763.0 - - -Gains/Losses on Foreign Exchange 0.0 0.0 - - -
Gain/Loss on Investment -11,648.7 -283.9 -835.5 -352.5 -169.2
Interest Expense 300.6 169.6 - - -
Increase/Decrease in AccountsReceivable
2,570.5 3,708.5 -17,948.7 2,369.5 -5,727.1
Increase/Decrease in Inventories -40,714.8 -16,136.4 238.6 -13,957.1 -13,588.6
Increase/Decrease in AccountsPayable
17,807.8 -2,045.7 3,181.0 -4,261.0 5,203.0
Increase/Decrease in PrepaidExpenses
-29.8 23.9 -6.3 6.7 39.0
OneSource One-Stop Reports for Song Da Urban & Ind. Zone Invt & D
Page 24

8/8/2019 SJS_ Song Da Urban & Industrial Zone Investment and Development Joint Stock Company
http://slidepdf.com/reader/full/sjs-song-da-urban-industrial-zone-investment-and-development-joint-stock 25/57
Cash Interest Paid -300.6 -200.8 -1,125.6 -1,166.1 -
Cash Taxes Paid -677.3 -4,590.0 - - -1,119.6
Other Cash from OperatingActivities
71.1 177.8 1.6 1.9 -
Other Cash Paid for OperatingActivities
-1,211.3 -1,132.5 -826.5 -623.0 -636.6
Cash from Operating Activities 15,245.0 -8,864.8 5,386.9 -10,059.3 -4,479.1
Capital Expenditure -833.9 -265.7 -37.0 -96.8 -43.4
Sale of Fixed Assets 95.3 - 0.0 58.1 19.9
Purchase of Investment -5,055.6 - - - -
Sale of Investment 2.8 2,132.2 0.0 2,352.6 3,469.1
Investment in Other Entities -3,403.6 -2,830.7 -15,178.3 -1,447.8 -435.8
Returns fr. Investment in OtherEntities
17,286.0 384.2 1.2 175.1 -
Dividend and Interest Income 778.7 258.4 753.0 352.5 149.3
Cash from Investing Activit ies 8,869.7 -321.6 -14,461.0 1,393.6 3,159.1
Issuance of Common Stock 2,564.9 - 24,883.5 - -
Repurchase of Stock 0.0 -1,645.3 - - -
Total Debt Issued 37,213.0 15,195.3 1,701.1 11,426.8 3,153.7
Total Debt Reduction -21,287.9 -3,955.0 -10,477.0 -3,752.2 -
Dividend and Interest Paid -3,349.0 -7,247.4 -849.7 -780.5 -788.4
Cash from Financing Activit ies 15,141.0 2,347.5 15,257.9 6,894.1 2,365.3
Foreign Exchange Effects - 0.0 - - -
Net Change in Cash 39,255.7 -6,838.9 6,183.7 -1,771.6 1,045.3
Net Cash - Beginning Balance 516.0 7,397.2 1,324.8 3,104.2 2,085.6
Net Cash - Ending Balance 39,771.7 558.3 7,508.6 1,332.6 3,130.9
Cash Interest Paid 300.6 200.8 1,125.6 1,166.1 -
Cash Taxes Paid 677.3 4,590.0 - - 1,119.6
© 1983-2010 Reuters Research Inc. All Rights Reserved.
Published by OneSource Information Services, Inc., November, 2010.
OneSource One-Stop Reports for Song Da Urban & Ind. Zone Invt & D
Page 25
8/8/2019 SJS_ Song Da Urban & Industrial Zone Investment and Development Joint Stock Company
http://slidepdf.com/reader/full/sjs-song-da-urban-industrial-zone-investment-and-development-joint-stock 26/57
Song Da Urban & I nd. Zone Invt & Dev.
Hanoi, Viet Nam, Tel: 84-4-37684504,URL: http://www.sudicosd.com.vn/
Financial Health
Financials in: USD (000)
Except for share items (millions) and per share items (actual units)
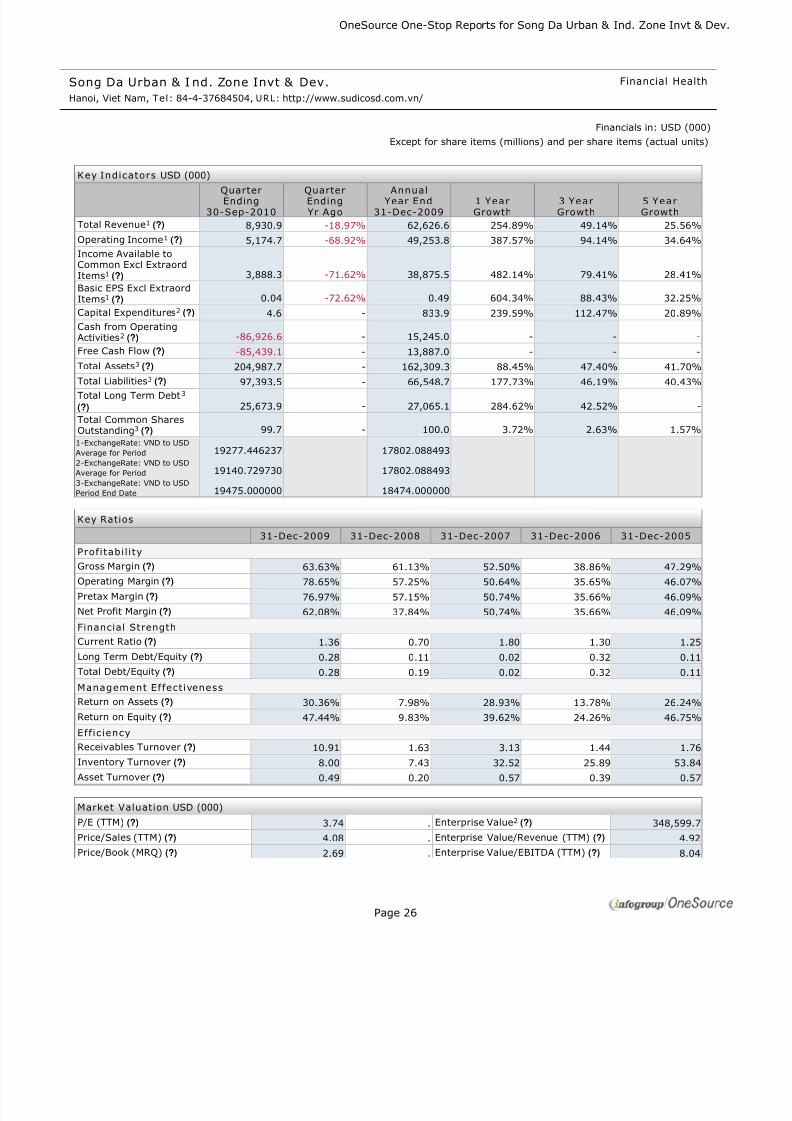
Key IndicatorsUSD (000)
Total Revenue1 (?) 8,930.9 -18.97% 62,626.6 254.89% 49.14% 25.56%
Operating Income1 (?) 5,174.7 -68.92% 49,253.8 387.57% 94.14% 34.64%
Income Available toCommon Excl ExtraordItems1 (?) 3,888.3 -71.62% 38,875.5 482.14% 79.41% 28.41%
Basic EPS Excl ExtraordItems1 (?) 0.04 -72.62% 0.49 604.34% 88.43% 32.25%
Capital Expenditures2 (?) 4.6 - 833.9 239.59% 112.47% 20.89%
Cash from OperatingActivities2 (?) -86,926.6 - 15,245.0 - - -
Free Cash Flow (?) -85,439.1 - 13,887.0 - - -
Total Assets3 (?) 204,987.7 - 162,309.3 88.45% 47.40% 41.70%
Total Liabilities3 (?) 97,393.5 - 66,548.7 177.73% 46.19% 40.43%
Total Long Term Debt3
(?) 25,673.9 - 27,065.1 284.62% 42.52% -
Total Common SharesOutstanding3 (?) 99.7 - 100.0 3.72% 2.63% 1.57%
1-ExchangeRate: VND to USD
Average for Period 19277.446237 17802.088493
2-ExchangeRate: VND to USD
Average for Period 19140.729730 17802.088493
3-ExchangeRate: VND to USD
Period End Date 19475.000000 18474.000000
Key Ratios
Profitabil ity
Gross Margin (?) 63.63% 61.13% 52.50% 38.86% 47.29%
Operating Margin (?) 78.65% 57.25% 50.64% 35.65% 46.07%
Pretax Margin (?) 76.97% 57.15% 50.74% 35.66% 46.09%
Net Profit Margin (?) 62.08% 37.84% 50.74% 35.66% 46.09%
Financial Strength
Current Ratio (?) 1.36 0.70 1.80 1.30 1.25
Long Term Debt/Equity (?) 0.28 0.11 0.02 0.32 0.11
Total Debt/Equity (?) 0.28 0.19 0.02 0.32 0.11
Management Effectiveness
Return on Assets (?) 30.36% 7.98% 28.93% 13.78% 26.24%
Return on Equity (?) 47.44% 9.83% 39.62% 24.26% 46.75%Eff ic iency
Receivables Turnover (?) 10.91 1.63 3.13 1.44 1.76
Inventory Turnover (?) 8.00 7.43 32.52 25.89 53.84
Asset Turnover (?) 0.49 0.20 0.57 0.39 0.57
Market ValuationUSD (000)
P/E (TTM) (?) 3.74 . Enterprise Value2 (?) 348,599.7
Price/Sales (TTM) (?) 4.08 . Enterprise Value/Revenue (TTM) (?) 4.92
Price/Book (MRQ) (?) 2.69 . Enterprise Value/EBITDA (TTM) (?) 8.04
QuarterEnding
30-Sep-2010
QuarterEndingYr Ago
AnnualYear End
31-Dec-20091 YearGrowth
3 YearGrowth
5 YearGrowth
31-Dec-2009 31-Dec-2008 31-Dec-2007 31-Dec-2006 31-Dec-2005
OneSource One-Stop Reports for Song Da Urban & Ind. Zone Invt & D
Page 26

8/8/2019 SJS_ Song Da Urban & Industrial Zone Investment and Development Joint Stock Company
http://slidepdf.com/reader/full/sjs-song-da-urban-industrial-zone-investment-and-development-joint-stock 27/57
Market Cap as of 29-Oct-20101 (?) 289,003.7 .
1-ExchangeRate: VND to USD on 29-Oct-
2010 19490.000000
2-ExchangeRate: VND to USD on 30-Sep-
2010 19475.000000
© 1983-2010 Reuters Research Inc. All Rights Reserved.
Published by OneSource Information Services, Inc., November, 2010.
OneSource One-Stop Reports for Song Da Urban & Ind. Zone Invt & D
Page 27

8/8/2019 SJS_ Song Da Urban & Industrial Zone Investment and Development Joint Stock Company
http://slidepdf.com/reader/full/sjs-song-da-urban-industrial-zone-investment-and-development-joint-stock 28/57
Song Da Urban & I nd. Zone Invt & Dev.
Hanoi, Viet Nam, Tel: 84-4-37684504,URL: http://www.sudicosd.com.vn/
Annual Ratios
Financials in: USD (000)
Except for share items (millions) and per share items (actual units)
Financial Strength
Current Ratio(?) 1.36 0.70 1.80 1.30 1.25
Quick/Acid Test Ratio(?) 1.16 0.50 1.60 1.08 1.10
Working Capital1(?) 14,245.6 -5,334.3 12,258.7 4,174.3 4,756.4
Long Term Debt/Equity(?) 0.28 0.11 0.02 0.32 0.11
Total Debt/Equity(?) 0.28 0.19 0.02 0.32 0.11
Long Term Debt/Total Capital(?) 0.22 0.10 0.02 0.24 0.10
Total Debt/Total Capital(?) 0.22 0.16 0.02 0.24 0.10
Payout Ratio(?) 10.24% 50.26% 13.89% 40.94% 0.00%
Effective Tax Rate(?) 18.80% 30.28% 0.00% 0.00% 0.00%
Total Capital1(?) 122,825.7 78,075.3 81,322.3 44,557.4 31,122.3
Eff ic iency
Asset Turnover(?) 0.49 0.20 0.57 0.39 0.57
Inventory Turnover(?) 8.00 7.43 32.52 25.89 53.84
Days In Inventory(?) 45.65 49.15 11.22 14.10 6.78
Receivables Turnover(?) 10.91 1.63 3.13 1.44 1.76
Days Receivables Outstanding(?) 33.47 223.45 116.52 253.87 207.38
Revenue/Employee2(?) - - - 56,273 -
Operating Income/Employee2(?) - - - 20,063 -
EBITDA/Employee2(?) - - - 21,206 -
Profitabil ity
Gross Margin(?) 63.63% 61.13% 52.50% 38.86% 47.29%
Operating Margin(?) 78.65% 57.25% 50.64% 35.65% 46.07%
EBITDA Margin(?) 78.94% 58.04% 51.48% 37.69% 48.03%
EBIT Margin(?) 78.65% 57.25% 50.64% 35.65% 46.07%
Pretax Margin(?) 76.97% 57.15% 50.74% 35.66% 46.09%
Net Profit Margin(?) 62.08% 37.84% 50.74% 35.66% 46.09%
COGS/Revenue (?) 36.37% 38.87% 47.50% 61.14% 52.71%
SG&A Expense/Revenue(?) 3.28% 9.34% 3.76% 4.89% 3.64%
Management Effectiveness
Return on Assets(?) 30.36% 7.98% 28.93% 13.78% 26.24%
Return on Equity(?) 47.44% 9.83% 39.62% 24.26% 46.75%
Valuation
Free Cash Flow/Share2(?) 0.14 -0.09 0.06 -0.11 -0.05
Operating Cash Flow/Share 2(?) 0.15 -0.09 0.06 -0.11 -0.05
1-ExchangeRate: VND to USD Period End Date 18474 17483 16016.5 16056 15914
2-ExchangeRate: VND to USD Average for Period 18474 17483 16016.5 16056 15914
Current Market Multiples
31-Dec-2009 31-Dec-2008 31-Dec-2007 31-Dec-2006 31-Dec-2005
OneSource One-Stop Reports for Song Da Urban & Ind. Zone Invt & D
Page 28

8/8/2019 SJS_ Song Da Urban & Industrial Zone Investment and Development Joint Stock Company
http://slidepdf.com/reader/full/sjs-song-da-urban-industrial-zone-investment-and-development-joint-stock 29/57
Market Cap/Earnings (TTM)(?) 3.74
Market Cap/Equity (MRQ)(?) 2.69
Market Cap/Revenue (TTM)(?) 4.08
Market Cap/EBIT (TTM)(?) 6.68
Market Cap/EBITDA (TTM)(?) 6.67
Enterprise Value/Earnings (TTM)(?) 4.51
Enterprise Value/Equity (MRQ)(?) 3.24
Enterprise Value/Revenue (TTM)(?) 4.92
Enterprise Value/EBIT (TTM)(?) 8.05Enterprise Value/EBITDA (TTM)(?) 8.04
© 1983-2010 Reuters Research Inc. All Rights Reserved.
Published by OneSource Information Services, Inc., November, 2010.
OneSource One-Stop Reports for Song Da Urban & Ind. Zone Invt & D
Page 29

8/8/2019 SJS_ Song Da Urban & Industrial Zone Investment and Development Joint Stock Company
http://slidepdf.com/reader/full/sjs-song-da-urban-industrial-zone-investment-and-development-joint-stock 30/57
Song Da Urban & I nd. Zone Invt & Dev.
Hanoi, Viet Nam, Tel: 84-4-37684504,URL: http://www.sudicosd.com.vn/
Annual In come Statement
Standardized
Financials in: USD (000)
Except for share items (millions) and per share items (actual units)
Financial Glossary
31-Dec-2009 31-Dec-2008 31-Dec-2007 31-Dec-2006 31-Dec-2005
Period Length 12 Months 12 Months 12 Months 12 Months 12 Months
UpdateType/Date Updated Normal31-Dec-2009
Updated Normal31-Dec-2008
Updated Normal31-Dec-2007
Updated Normal31-Dec-2006
RestatedNormal
31-Dec-2006
Filed Currency VND VND VND VND VND
Exchange Rate (Period Average) 17802.088493 16452.496831 16083.860656 15990.427596 15854.243169
Auditor Auditing andConsulting JointStock Company
Auditing andConsulting JointStock Company
Auditing andConsulting JointStock Company
Auditing andConsulting JointStock Company
Auditing andConsulting JointStock Company
Auditor Opinion Unqualified Unqualified withExplanation
Unqualified Unqualified Unqualified
Gross Revenue 62,626.6 19,094.3 44,025.9 21,019.4 23,847.8
Sales Returns and Allowances - - - - -6.6
Revenue 62,626.6 19,094.3 44,025.9 21,019.4 23,841.2
Total Revenue 62,626.6 19,094.3 44,025.9 21,019.4 23,841.2
Cost of Revenue 22,776.1 7,421.9 20,911.2 12,850.4 12,565.6
Cost of Revenue, Total 22,776.1 7,421.9 20,911.2 12,850.4 12,565.6
Gross P rofit 39,850.5 11,672.5 23,114.7 8,169.0 11,275.6
Selling/General/AdministrativeExpense
2,052.5 1,783.6 1,654.7 1,027.3 867.0
Total
Sell ing/General/ AdministrativeExpenses
2,052.5 1,783.6 1,654.7 1,027.3 867.0
Depreciation 90.2 89.1 - - -
Depreciation/ Amortization 90.2 89.1 - - -
Interest Expense - Operating 300.6 169.6 - - -
Interest Expense - Net Operating 300.6 169.6 - - -
Interest Income - Operating -759.3 -129.7 -396.5 -157.3 -475.2
Investment Income - Operating -11,179.7 -1,155.2 -361.9 -195.2 -100.9
Interest/Investment Income -Operating
-11,938.9 -1,284.9 -758.4 -352.5 -576.1
Interest Expense (Income) - NetOperating Total
-11,638.4 -1,115.3 -758.4 -352.5 -576.1
Unrealized Losses (Gains) 0.0 0.0 - - -
Other Operating Expense 92.4 -15.4 -77.0 - -
Other Operating Expenses, Total 92.4 -15.5 -77.0 - -
Total Operating Expense 13,372.8 8,163.8 21,730.5 13,525.2 12,856.6
Operating Income 49,253.8 10,930.6 22,295.4 7,494.2 10,984.6
Gain (Loss) on Sale of Assets -128.1 - 0.0 0.0 19.9
Other Non-Operating Income(Expense)
-921.5 -17.7 42.4 0.6 -17.3
Other, Net -921.5 -17.7 42.4 0.6 -17.3
OneSource One-Stop Reports for Song Da Urban & Ind. Zone Invt & D
Page 30

8/8/2019 SJS_ Song Da Urban & Industrial Zone Investment and Development Joint Stock Company
http://slidepdf.com/reader/full/sjs-song-da-urban-industrial-zone-investment-and-development-joint-stock 31/57
I ncome Before Tax 48,204.2 10,912.9 22,337.8 7,494.8 10,987.2
Total Income Tax 9,061.7 3,304.6 0.0 0.0 0.0
I ncome After Tax 39,142.5 7,608.2 22,337.8 7,494.8 10,987.2
Equity In Affiliates 468.0 -382.4 - - -
Net Income Before Extraord I tems 39,610.5 7,225.9 22,337.8 7,494.8 10,987.2
Net Income 39,610.5 7,225.9 22,337.8 7,494.8 10,987.2
Miscellaneous Earnings Adjustment -735.0 - - - -
Total Adjustments to Net Income -735.0 - - - -
Income Available to Common ExclExtraord Items
38,875.5 7,225.9 22,337.8 7,494.8 10,987.2
Income Available to Common InclExtraord Items
38,875.5 7,225.9 22,337.8 7,494.8 10,987.2
Basic/Primary Weighted AverageShares
79.9 96.6 60.5 92.5 92.5
Basic EPS Excl Extraord Items 0.49 0.07 0.37 0.08 0.12
Basic/Primary EPS Incl Extraord Items 0.49 0.07 0.37 0.08 0.12
Diluted Net Income 38,875.5 7,225.9 22,337.8 7,494.8 10,987.2
Diluted Weighted Average Shares 79.9 96.6 60.5 92.5 92.5
Diluted EPS Excl Extraord Items 0.49 0.07 0.37 0.08 0.12
Diluted EPS Incl Extraord Items 0.49 0.07 0.37 0.08 0.12
Dividends per Share - Common StockPrimary Issue
0.05 0.04 0.05 0.03 0.00
Gross Dividends - Common Stock - - 4,942.8 - 0.0
Interest Expense, Supplemental 300.6 169.6 - - -
Depreciation, Supplemental 153.8 120.7 105.0 94.9 82.8
Total Special Items 128.1 - 0.0 0.0 -19.9
Normalized Income Before Tax 48,332.3 10,912.9 22,337.8 7,494.8 10,967.3
Effect of Special Items on IncomeTaxes
24.1 - 0.0 0.0 0.0
Inc Tax Ex Impact of Sp Items 9,085.8 3,304.6 0.0 0.0 0.0
Normalized Income After Tax 39,246.5 7,608.2 22,337.8 7,494.8 10,967.3
Normalized Inc. Avail to Com. 38,979.5 7,225.9 22,337.8 7,494.8 10,967.3
Basic Normalized EPS 0.49 0.07 0.37 0.08 0.12
Diluted Normalized EPS 0.49 0.07 0.37 0.08 0.12
Amort of Intangibles, Supplemental 28.1 30.6 265.5 332.1 382.4
Normalized EBIT 37,615.4 9,815.2 21,537.0 7,141.7 10,408.5
Normalized EBITDA 37,797.3 9,966.6 21,907.6 7,568.7 10,873.7
Current Tax - Total 8,646.1 3,869.5 - - -
Current Tax - Total 8,646.1 3,869.5 - - -
Deferred Tax - Total 415.6 -564.9 - - -
Deferred Tax - Total 415.6 -564.9 - - -
Income Tax - Total 9,061.7 3,304.6 - - -
© 1983-2010 Reuters Research Inc. All Rights Reserved.
Published by OneSource Information Services, Inc., November, 2010.
OneSource One-Stop Reports for Song Da Urban & Ind. Zone Invt & D
Page 31

8/8/2019 SJS_ Song Da Urban & Industrial Zone Investment and Development Joint Stock Company
http://slidepdf.com/reader/full/sjs-song-da-urban-industrial-zone-investment-and-development-joint-stock 32/57
OneSource One-Stop Reports for Song Da Urban & Ind. Zone Invt & D
Page 32

8/8/2019 SJS_ Song Da Urban & Industrial Zone Investment and Development Joint Stock Company
http://slidepdf.com/reader/full/sjs-song-da-urban-industrial-zone-investment-and-development-joint-stock 33/57
Song Da Urban & I nd. Zone Invt & Dev.
Hanoi, Viet Nam, Tel: 84-4-37684504,URL: http://www.sudicosd.com.vn/
Interim I ncome Statement
Standardized
Financials in: USD (000)
Except for share items (millions) and per share items (actual units)
Financial Glossary
30-Sep-2010 30-Jun-2010 31-Mar-2010 31-Dec-2009 30-Sep-2009
Period Length 3 Months 6 Months 3 Months 3 Months 3 Months
UpdateType/Date Updated Normal30-Sep-2010
UpdatedSpecial
30-Jun-2010
Updated Normal31-Mar-2010
Updated Normal31-Dec-2009
Updated Normal30-Sep-2009
Filed Currency VND VND VND VND VND
Exchange Rate (Period Average) 19277.446237 18888.303279 18779.813187 18097.274194 17816.505435
Gross Revenue 8,931.4 24,465.5 4,313.4 38,240.2 14,873.0
Sales Returns and Allowances -0.5 - - 2,914.9 -2,948.0
Revenue 8,930.9 24,465.5 4,313.4 41,155.1 11,925.0
Total Revenue 8,930.9 24,465.5 4,313.4 41,155.1 11,925.0
Cost of Revenue 2,942.4 7,484.8 2,221.0 16,104.0 2,045.3
Cost of Revenue, Total 2,942.4 7,484.8 2,221.0 16,104.0 2,045.3
Gross P rofit 5,988.5 16,980.7 2,092.4 25,051.1 9,879.8
Selling/General/AdministrativeExpense
864.0 1,108.2 523.7 757.0 539.2
TotalSell ing/General/ AdministrativeExpenses
864.0 1,108.2 523.7 757.0 539.2
Depreciation - 50.2 - 25.4 24.0
Depreciation/ Amortization - 50.2 - 25.4 24.0
Interest Expense - Operating - - - -649.5 960.0
Interest Expense - Net Operating - - - -649.5 960.0
Interest Income - Operating - -1,649.7 - -502.1 -237.1
Investment Income - Operating - -371.6 - -292.0 -9,650.3
Interest/Investment Income -Operating
- -2,021.2 - -794.1 -9,887.3
Interest Expense (Income) - NetOperating Total
- -2,021.2 - -1,443.6 -8,927.3
Other Operating Expense -50.2 -50.9 -1,166.8 -262.0 229.8
Other Operating Expenses, Total -50.2 -50.9 -1,166.8 -262.0 229.8
Total Operating Expense 3,756.1 6,571.1 1,577.9 15,180.8 -6,089.1
Operating Income 5,174.7 17,894.4 2,735.5 25,974.3 18,014.1
Gain (Loss) on Sale of Assets - - - -126.0 0.0
Other Non-Operating Income(Expense)
-10.8 1.4 0.0 -815.4 -69.8
Other, Net -10.8 1.4 0.0 -815.4 -69.8
I ncome Before Tax 5,163.9 17,895.8 2,735.5 25,032.9 17,944.2
Total Income Tax 1,273.7 4,431.0 691.4 5,081.9 3,120.6
I ncome After Tax 3,890.3 13,464.8 2,044.1 19,951.0 14,823.7
OneSource One-Stop Reports for Song Da Urban & Ind. Zone Invt & D
Page 33

8/8/2019 SJS_ Song Da Urban & Industrial Zone Investment and Development Joint Stock Company
http://slidepdf.com/reader/full/sjs-song-da-urban-industrial-zone-investment-and-development-joint-stock 34/57
Minority Interest -1.9 - - - -
Equity In Affiliates - - - 460.4 -
Net Income Before Extraord I tems 3,888.3 13,464.8 2,044.1 20,411.4 14,823.7
Net Income 3,888.3 13,464.8 2,044.1 20,411.4 14,823.7
Miscellaneous Earnings Adjustment - - - -723.0 -
Total Adjustments to Net Income - - - -723.0 -
Income Available to Common ExclExtraord Items
3,888.3 13,464.8 2,044.1 19,688.4 14,823.7
Income Available to Common InclExtraord Items
3,888.3 13,464.8 2,044.1 19,688.4 14,823.7
Basic/Primary Weighted AverageShares
99.9 100.0 100.0 30.1 96.4
Basic EPS Excl Extraord Items 0.04 0.13 0.02 0.65 0.15
Basic/Primary EPS Incl Extraord Items 0.04 0.13 0.02 0.65 0.15
Diluted Net Income 3,888.3 13,464.8 2,044.1 19,688.4 14,823.7
Diluted Weighted Average Shares 99.9 100.0 100.0 30.1 96.4
Diluted EPS Excl Extraord Items 0.04 0.13 0.02 0.65 0.15
Diluted EPS Incl Extraord Items 0.04 0.13 0.02 0.65 0.15
Dividends per Share - Common StockPrimary Issue
0.00 0.00 0.00 0.03 0.00
Gross Dividends - Common Stock 0.0 0.0 0.0 - 0.0
Interest Expense, Supplemental - - - -649.5 960.0
Depreciation, Supplemental - 55.5 - 52.0 37.3
Total Special Items - - - 126.0 0.0
Normalized Income Before Tax 5,163.9 17,895.8 2,735.5 25,158.9 17,944.2
Effect of Special Items on IncomeTaxes
- - - 25.6 0.0
Inc Tax Ex Impact of Sp Items 1,273.7 4,431.0 691.4 5,107.4 3,120.6
Normalized Income After Tax 3,890.3 13,464.8 2,044.1 20,051.5 14,823.7
Normalized Inc. Avail to Com. 3,888.3 13,464.8 2,044.1 19,788.8 14,823.7
Basic Normalized EPS 0.04 0.13 0.02 0.66 0.15
Diluted Normalized EPS 0.04 0.13 0.02 0.66 0.15
Amort of Intangibles, Supplemental - 13.2 - 6.9 7.0
Normalized EBIT 5,174.7 15,873.2 2,735.5 24,530.7 9,086.8
Normalized EBITDA 5,174.7 15,942.0 2,735.5 24,589.7 9,131.1
Current Tax - Domestic - 4,461.2 - - -
Current Tax - Total - 4,461.2 - - -
Deferred Tax - Domestic - -30.2 - - -
Deferred Tax - Total - -30.2 - - -
Income Tax - Total - 4,431.0 - - -
© 1983-2010 Reuters Research Inc. All Rights Reserved.
Published by OneSource Information Services, Inc., November, 2010.
OneSource One-Stop Reports for Song Da Urban & Ind. Zone Invt & D
Page 34

8/8/2019 SJS_ Song Da Urban & Industrial Zone Investment and Development Joint Stock Company
http://slidepdf.com/reader/full/sjs-song-da-urban-industrial-zone-investment-and-development-joint-stock 35/57
Song Da Urban & I nd. Zone Invt & Dev.
Hanoi, Viet Nam, Tel: 84-4-37684504,URL: http://www.sudicosd.com.vn/
Annual Balance Sheet
Standardized
Financials in: USD (000)
Except for share items (millions) and per share items (actual units)
Financial Glossary
31-Dec-2009 31-Dec-2008 31-Dec-2007 31-Dec-2006 31-Dec-2005
UpdateType/Date Updated Normal31-Dec-2009
Updated Normal31-Dec-2008
Updated Normal31-Dec-2007
ReclassifiedNormal
31-Dec-2007
RestatedNormal
31-Dec-2006
Filed Currency VND VND VND VND VND
Exchange Rate 18474 17483 16016.5 16056 15914
Auditor Auditing andConsulting JointStock Company
Auditing andConsulting JointStock Company
Auditing andConsulting JointStock Company
Auditing andConsulting JointStock Company
Auditing andConsulting JointStock Company
Auditor Opinion Unqualified Unqualified withExplanation
Unqualified Unqualified Unqualified
Cash 4,981.0 378.5 7,540.1 1,327.1 3,119.1
Cash & Equivalents 33,344.2 146.9 - - -
Short Term Investments 4,554.0 - 2,184.0 - 2,363.9
Cash and Short Term Investments 42,879.2 525.4 9,724.1 1,327.1 5,483.0
Accounts Receivable - Trade,Gross
3,380.9 8,076.1 14,535.4 12,536.0 14,060.5
Provision for Doubtful Accounts -480.4 -586.4 - - -
Trade Accounts Receivable - Net 2,900.5 7,489.7 14,535.4 12,536.0 14,060.5
Other Receivables 128.8 1,003.1 209.0 914.9 1,748.2
Total Receivables, Net 3,029.2 8,492.8 14,744.4 13,450.9 15,808.7
Inventories - Finished Goods - - 493.6 558.0 22.2
Inventories - Work In Progress 4,165.8 1,399.2 32.4 203.7 202.0
Inventories - Raw Materials - - 0.0 1.9 2.6
Total I nventory 4,165.8 1,399.2 526.0 763.7 226.8Prepaid Expenses 2,754.6 1,574.5 2,051.0 2,253.7 2,402.0
Other Current Assets 877.6 542.7 467.4 108.9 149.0
Other Current Assets, Total 877.6 542.7 467.4 108.9 149.0
Total Current Assets 53,706.4 12,534.7 27,512.9 17,904.3 24,069.5
Buildings 777.1 977.7 804.8 237.9 -
Machinery/Equipment 1,050.8 526.3 478.3 501.3 456.8
Construction in Progress 91,062.9 57,801.9 48,724.5 36,037.3 22,878.3
Other Property/Plant/Equipment 11.4 12.0 5.3 2.9 3.0
Property/Plant/Equipment - Gross 92,902.3 59,317.9 50,012.9 36,779.4 23,338.0
Accumulated Depreciation -518.6 -460.4 -386.3 -336.9 -192.3
Property/ P lant/ Equipment - Net 92,383.7 58,857.5 49,626.5 36,442.5 23,145.8
Intangibles - Gross 1,728.9 1,826.9 1,994.2 1,992.1 2,007.1
Accumulated IntangibleAmortization
-1,604.9 -1,667.3 -1,788.5 -1,520.3 -1,200.2
Intangibles, Net 124.0 159.7 205.7 471.8 806.8
LT Investment - Affiliate Companies 4,640.1 10,345.0 12,419.9 2,065.5 1,954.2
LT Investments - Other 11,331.1 8,574.4 6,829.7 1,404.3 468.8
Long Term Investments 15,971.1 18,919.4 19,249.5 3,469.8 2,423.0
Deferred Income Tax - Long TermAsset
102.6 531.6 - - -
OneSource One-Stop Reports for Song Da Urban & Ind. Zone Invt & D
Page 35

8/8/2019 SJS_ Song Da Urban & Industrial Zone Investment and Development Joint Stock Company
http://slidepdf.com/reader/full/sjs-song-da-urban-industrial-zone-investment-and-development-joint-stock 36/57
Other Long Term Assets 21.4 8.5 7.9 21.5 4.3
Other Long Term Assets, Total 124.0 540.1 7.9 21.5 4.3
Total Assets 162,309.3 91,011.3 96,602.5 58,309.9 50,449.4
Accounts Payable 3,033.2 7,508.7 8,394.6 7,610.1 6,579.9
Accrued Expenses 2,885.3 818.8 211.0 130.1 126.9
Notes Payable/Short Term Debt 0.0 2,859.9 0.0 0.0 0.0
Current Portion - Long TermDebt/Capital Leases
0.0 2,087.7 - - -
Customer Advances 18,119.8 501.3 4,942.7 4,073.8 11,149.1
Income Taxes Payable 13,039.8 3,808.0 1,108.2 1,536.9 856.9
Other Payables 2,382.7 284.5 597.6 379.0 600.3
Other Current liabilities, Total 33,542.3 4,593.8 6,648.5 5,989.7 12,606.3
Total Current Liabil ities 39,460.8 17,868.9 15,254.2 13,730.0 19,313.1
Long Term Debt 27,065.1 7,435.8 1,971.1 10,757.3 3,141.9
Total Long Term Debt 27,065.1 7,435.8 1,971.1 10,757.3 3,141.9
Total Debt 27,065.1 12,383.5 1,971.1 10,757.3 3,141.9
Pension Benefits - Underfunded 8.2 13.0 24.2 17.9 13.5
Other Long Term Liabilities 14.6 1.7 1.9 4.6 0.6Other Liabilities, Total 22.8 14.7 26.1 22.5 14.0
Total Liabilities 66,548.7 25,319.4 17,251.3 24,509.8 22,469.0
Common Stock 43,304.1 22,879.4 24,974.2 3,114.1 3,141.9
Common Stock 43,304.1 22,879.4 24,974.2 3,114.1 3,141.9
Additional Paid-In Capital 11,817.1 11,423.5 12,469.5 - -
Retained Earnings (AccumulatedDeficit)
37,350.6 4,814.7 24,317.2 10,741.9 12,437.3
Treasury Stock - Common 0.0 -1,548.4 - - -
Other Equity 3,288.9 28,122.6 17,590.3 19,944.1 12,401.2
Other Equity, Total 3,288.9 28,122.6 17,590.3 19,944.1 12,401.2
Total Equity 95,760.6 65,691.8 79,351.2 33,800.1 27,980.4
Total Liabil it ies & Shareholders’ Equity
162,309.3 91,011.3 96,602.5 58,309.9 50,449.4
Shares Outstanding - CommonStock Primary Issue
100.0 96.4 97.0 92.5 92.5
Total Common Shares Outstanding 100.0 96.4 97.0 92.5 92.5
Treasury Shares - Common StockPrimary Issue
- 0.6 - - -
Employees - - - 372 -
Accumulated Intangible Amort, Suppl. 1,604.9 1,667.3 1,788.5 1,520.3 1,200.2
Deferred Revenue - Current 18,119.8 501.3 4,942.7 4,073.8 11,149.1
Total Long Term Debt, Supplemental 27,065.1 9,523.5 - - -Long Term Debt Maturing within 1 Year 5,413.0 2,087.7 - - -
Long Term Debt Maturing in Year 2 5,413.0 1,858.9 - - -
Long Term Debt Maturing in Year 3 5,413.0 1,858.9 - - -
Long Term Debt Maturing in Year 4 5,413.0 1,858.9 - - -
Long Term Debt Maturing in Year 5 5,413.0 1,858.9 - - -
Long Term Debt Maturing in 2-3 Years 10,826.0 3,717.9 - - -
Long Term Debt Maturing in 4-5 Years 10,826.0 3,717.9 - - -
Long Term Debt Matur. in Year 6 & Beyond
0.0 0.0 - - -
OneSource One-Stop Reports for Song Da Urban & Ind. Zone Invt & D
Page 36

8/8/2019 SJS_ Song Da Urban & Industrial Zone Investment and Development Joint Stock Company
http://slidepdf.com/reader/full/sjs-song-da-urban-industrial-zone-investment-and-development-joint-stock 37/57
© 1983-2010 Reuters Research Inc. All Rights Reserved.
Published by OneSource Information Services, Inc., November, 2010.
OneSource One-Stop Reports for Song Da Urban & Ind. Zone Invt & D
Page 37

8/8/2019 SJS_ Song Da Urban & Industrial Zone Investment and Development Joint Stock Company
http://slidepdf.com/reader/full/sjs-song-da-urban-industrial-zone-investment-and-development-joint-stock 38/57
Song Da Urban & I nd. Zone Invt & Dev.
Hanoi, Viet Nam, Tel: 84-4-37684504,URL: http://www.sudicosd.com.vn/
Interim Balance Sheet
Standardized
Financials in: USD (000)
Except for share items (millions) and per share items (actual units)
Financial Glossary
30-Sep-2010 30-Jun-2010 31-Dec-2009 30-Sep-2009 30-Jun-2009
UpdateType/Date Updated Normal30-Sep-2010
Updated Normal30-Jun-2010
ReclassifiedNormal
30-Sep-2010
Updated Normal30-Sep-2009
Updated Normal30-Jun-2009
Filed Currency VND VND VND VND VND
Exchange Rate 19475 19080 18474 17840.5 17773
Cash 4,339.3 5,018.1 4,981.0 15,108.0 3,508.0
Cash & Equivalents - - 33,344.2 - -
Short Term Investments 472.2 10,482.2 4,554.0 26,235.5 0.0
Cash and Short Term Investments 4,811.5 15,500.3 42,879.2 41,343.5 3,508.0
Accounts Receivable - Trade,
Gross
2,908.2 3,460.1 3,380.9 9,099.8 9,980.4
Provision for Doubtful Accounts -455.7 -465.2 -480.4 -574.6 -576.8
Trade Accounts Receivable - Net 2,452.5 2,994.9 2,900.5 8,525.2 9,403.5
Other Receivables 396.2 1,375.6 128.8 1,866.0 1,006.6
Total Receivables, Net 2,848.7 4,370.5 3,029.2 10,391.2 10,410.1
Inventories - Work In Progress 6,241.2 390.3 4,165.8 2,275.1 1,639.1
Inventories - Raw Materials 9.4 - - - -
Inventories - Other 2.7 - - - -
Total I nventory 6,253.3 390.3 4,165.8 2,275.1 1,639.1
Prepaid Expenses 5,819.3 1,422.6 2,754.6 1,771.2 1,791.8
Other Current Assets 146.0 1,355.9 877.6 1,412.9 601.6
Other Current Assets, Total 146.0 1,355.9 877.6 1,412.9 601.6
Total Current Assets 19,878.7 23,039.6 53,706.4 57,193.9 17,950.6
Buildings - 1,001.1 777.1 1,004.8 1,008.6
Machinery/Equipment - 534.7 1,050.8 661.6 524.1
Construction in Progress 147,942.6 107,606.6 91,062.9 76,849.2 59,211.9
Other Property/Plant/Equipment 2,198.5 9.6 11.4 11.8 11.8
Property/Plant/Equipment - Gross 150,141.0 109,151.9 92,902.3 78,527.4 60,756.4
Accumulated Depreciation -636.6 -433.1 -518.6 -533.1 -516.6
Property/ P lant/ Equipment - Net 149,504.5 108,718.8 92,383.7 77,994.3 60,239.8
Intangibles - Gross 1,640.1 1,674.0 1,728.9 1,790.3 1,797.1
Accumulated IntangibleAmortization
-1,541.7 -1,567.0 -1,604.9 -1,654.9 -1,654.1
Intangibles, Net 98.4 107.0 124.0 135.5 143.0
LT Investment - Affiliate Companies 14,216.4 21,730.9 4,640.1 8,264.2 10,498.6
LT Investments - Other 21,169.1 20,195.0 11,331.1 8,362.4 5,785.8
Long Term Investments 35,385.5 41,925.9 15,971.1 16,626.6 16,284.4
Deferred Charges 52.6 45.5 21.4 8.4 7.0
Deferred Income Tax - Long TermAsset
68.0 69.4 102.6 520.9 522.9
Other Long Term Assets - - - 0.0 0.0
Other Long Term Assets, Total 120.6 115.0 124.0 529.3 529.9
Total Assets 204,987.7 173,906.3 162,309.3 152,479.5 95,147.7
OneSource One-Stop Reports for Song Da Urban & Ind. Zone Invt & D
Page 38

8/8/2019 SJS_ Song Da Urban & Industrial Zone Investment and Development Joint Stock Company
http://slidepdf.com/reader/full/sjs-song-da-urban-industrial-zone-investment-and-development-joint-stock 39/57
Accounts Payable 2,327.6 2,319.1 3,033.2 2,927.0 6,422.9
Accrued Expenses 1,766.4 3,838.7 2,885.3 1,580.6 487.2
Notes Payable/Short Term Debt 38,510.9 5,241.1 0.0 0.0 2,813.3
Current Portion - Long TermDebt/Capital Leases
- - 0.0 0.0 1,125.3
Customer Advances 1,930.3 562.5 18,119.8 27,863.8 3,954.9
Income Taxes Payable 11,614.6 14,329.7 13,039.8 6,896.6 3,901.8
Other Payables 5,577.3 4,895.8 2,382.7 5,743.1 1,414.2
Other Current Liabilities 2,858.4 3,057.0 247.1 - -
Other Current liabilities, Total 21,980.6 22,845.0 33,789.4 40,503.4 9,270.9
Total Current Liabil ities 64,585.5 34,243.9 39,707.9 45,011.0 20,119.5
Long Term Debt 25,673.9 26,205.5 27,065.1 28,026.1 10,071.7
Total Long Term Debt 25,673.9 26,205.5 27,065.1 28,026.1 10,071.7
Total Debt 64,184.9 31,446.5 27,065.1 28,026.1 14,010.3
Pension Benefits - Underfunded 4.5 4.2 8.2 9.6 11.4
Other Long Term Liabilities 7,129.5 6,922.8 14.6 3.4 3.4
Other Liabilities, Total 7,134.1 6,927.1 22.8 12.9 14.8
Total Liabilities 97,393.5 67,376.4 66,795.8 73,050.1 30,206.0
Common Stock 51,347.9 52,410.9 43,304.1 22,420.9 22,506.0
Common Stock 51,347.9 52,410.9 43,304.1 22,420.9 22,506.0
Additional Paid-In Capital 11,234.9 11,467.5 11,817.1 11,194.6 11,237.1
Retained Earnings (AccumulatedDeficit)
17,705.2 14,143.6 37,350.6 19,687.6 4,733.6
Treasury Stock - Common -1,117.8 -491.1 0.0 -1,517.3 -1,523.1
Other Equity 28,424.0 28,998.9 3,041.8 27,643.7 27,988.0
Other Equity, Total 28,424.0 28,998.9 3,041.8 27,643.7 27,988.0
Total Equity 107,594.2 106,529.8 95,513.5 79,429.4 64,941.6
Total Liabil it ies & Shareholders’ Equity
204,987.7 173,906.3 162,309.3 152,479.5 95,147.7
Shares Outstanding - CommonStock Primary Issue
99.7 100.0 100.0 96.4 96.4
Total Common Shares Outstanding 99.7 100.0 100.0 96.4 96.4
Treasury Shares - Common StockPrimary Issue
0.3 - - 0.6 0.6
Accumulated Intangible Amort, Suppl. 1,541.7 1,567.0 1,604.9 1,654.9 1,654.1
Deferred Revenue - Current 1,930.3 562.5 18,119.8 27,863.8 3,954.9
Deferred Revenue - Long Term 6,796.1 6,919.7 - - -
Total Long Term Debt, Supplemental 25,673.9 - 27,065.1 28,026.1 11,197.0
Long Term Debt Maturing within 1 Year 5,134.8 - 5,413.0 9,342.0 1,125.3
Long Term Debt Maturing in Year 2 5,134.8 - 5,413.0 9,342.0 2,517.9Long Term Debt Maturing in Year 3 5,134.8 - 5,413.0 9,342.0 2,517.9
Long Term Debt Maturing in Year 4 5,134.8 - 5,413.0 - 2,517.9
Long Term Debt Maturing in Year 5 5,134.8 - 5,413.0 - 2,517.9
Long Term Debt Maturing in 2-3 Years 10,269.6 - 10,826.0 18,684.1 5,035.9
Long Term Debt Maturing in 4-5 Years 10,269.6 - 10,826.0 - 5,035.9
Long Term Debt Matur. in Year 6 & Beyond
0.0 - 0.0 - 0.0
© 1983-2010 Reuters Research Inc. All Rights Reserved.
OneSource One-Stop Reports for Song Da Urban & Ind. Zone Invt & D
Page 39

8/8/2019 SJS_ Song Da Urban & Industrial Zone Investment and Development Joint Stock Company
http://slidepdf.com/reader/full/sjs-song-da-urban-industrial-zone-investment-and-development-joint-stock 40/57
Published by OneSource Information Services, Inc., November, 2010.
OneSource One-Stop Reports for Song Da Urban & Ind. Zone Invt & D
Page 40

8/8/2019 SJS_ Song Da Urban & Industrial Zone Investment and Development Joint Stock Company
http://slidepdf.com/reader/full/sjs-song-da-urban-industrial-zone-investment-and-development-joint-stock 41/57
Song Da Urban & I nd. Zone Invt & Dev.
Hanoi, Viet Nam, Tel: 84-4-37684504,URL: http://www.sudicosd.com.vn/
Annual Cash Flow s
Standardized
Financials in: USD (000)
Except for share items (millions) and per share items (actual units)
Financial Glossary
31-Dec-2009 31-Dec-2008 31-Dec-2007 31-Dec-2006 31-Dec-2005
Period Length 12 Months 12 Months 12 Months 12 Months 12 Months
UpdateType/Date Updated Normal31-Dec-2009
Updated Normal31-Dec-2008
Updated Normal31-Dec-2007
ReclassifiedNormal
31-Dec-2007
ReclassifiedNormal
31-Dec-2006
Filed Currency VND VND VND VND VND
Exchange Rate (Period Average) 17802.088493 16452.496831 16083.860656 15990.427596 15854.243169
Auditor Auditing andConsulting JointStock Company
Auditing andConsulting JointStock Company
Auditing andConsulting JointStock Company
Auditing andConsulting JointStock Company
Auditing andConsulting JointStock Company
Auditor Opinion Unqualified Unqualified withExplanation
Unqualified Unqualified Unqualified
Net Income/Starting Line 48,672.2 10,530.5 22,337.8 7,494.8 10,987.2
Depreciation 191.6 151.3 370.5 427.4 532.7
Depreciation/ Depletion 191.6 151.3 370.5 427.4 532.7
Other Non-Cash Items -11,134.4 648.6 -835.5 -352.5 -169.2
Non-Cash Items -11,134.4 648.6 -835.5 -352.5 -169.2
Accounts Receivable 2,570.5 3,708.5 -17,948.7 2,369.5 -5,727.1
Inventories -40,714.8 -16,136.4 238.6 -13,957.1 -13,588.6
Prepaid Expenses -29.8 23.9 -6.3 6.7 39.0
Accounts Payable 17,807.8 -2,045.7 3,181.0 -4,261.0 5,203.0
Taxes Payable -677.3 -4,590.0 - - -1,119.6
Other Operating Cash Flow -1,440.7 -1,155.6 -1,950.6 -1,787.2 -636.6
Changes in Working Capital -22,484.4 -20,195.2 -16,485.9 -17,629.1 -15,829.8
Cash from Operating Activities 15,245.0 -8,864.8 5,386.9 -10,059.3 -4,479.1
Purchase of Fixed Assets -833.9 -265.7 -37.0 -96.8 -43.4
Capital Expenditures -833.9 -265.7 -37.0 -96.8 -43.4
Sale of Fixed Assets 95.3 - 0.0 58.1 19.9
Sale/Maturity of Investment 2.8 2,132.2 0.0 2,352.6 3,469.1
Purchase of Investments -8,459.1 -2,830.7 -15,178.3 -1,447.8 -435.8
Other Investing Cash Flow 18,064.7 642.5 754.3 527.6 149.3
Other Investing Cash Flow Items,Total
9,703.7 -55.9 -14,424.1 1,490.4 3,202.5
Cash from Investing Activit ies 8,869.7 -321.6 -14,461.0 1,393.6 3,159.1
Other Financing Cash Flow -3,349.0 -7,247.4 -849.7 -780.5 -788.4
Financing Cash Flow Items -3,349.0 -7,247.4 -849.7 -780.5 -788.4
Sale/Issuance of Common 2,564.9 - 24,883.5 - -
Repurchase/Retirement of Common
0.0 -1,645.3 - - -
Common Stock, Net 2,564.9 -1,645.3 24,883.5 - -
Issuance (Retiremen t) of Stock,Net
2,564.9 -1,645.3 24,883.5 - -
Total Debt Issued 37,213.0 15,195.3 1,701.1 11,426.8 3,153.7
Total Debt Reduction -21,287.9 -3,955.0 -10,477.0 -3,752.2 -
OneSource One-Stop Reports for Song Da Urban & Ind. Zone Invt & D
Page 41

8/8/2019 SJS_ Song Da Urban & Industrial Zone Investment and Development Joint Stock Company
http://slidepdf.com/reader/full/sjs-song-da-urban-industrial-zone-investment-and-development-joint-stock 42/57
Issuance (Retirement) of Debt,Net
15,925.1 11,240.3 -8,775.9 7,674.6 3,153.7
Cash from Financing Activit ies 15,141.0 2,347.5 15,257.9 6,894.1 2,365.3
Foreign Exchange Effects - 0.0 - - -
Net Change in Cash 39,255.7 -6,838.9 6,183.7 -1,771.6 1,045.3
Net Cash - Beginning Balance 516.0 7,397.2 1,324.8 3,104.2 2,085.6
Net Cash - Ending Balance 39,771.7 558.3 7,508.6 1,332.6 3,130.9
Cash Interest Paid 300.6 200.8 1,125.6 1,166.1 -
Cash Taxes Paid 677.3 4,590.0 - - 1,119.6
© 1983-2010 Reuters Research Inc. All Rights Reserved.
Published by OneSource Information Services, Inc., November, 2010.
OneSource One-Stop Reports for Song Da Urban & Ind. Zone Invt & D
Page 42

8/8/2019 SJS_ Song Da Urban & Industrial Zone Investment and Development Joint Stock Company
http://slidepdf.com/reader/full/sjs-song-da-urban-industrial-zone-investment-and-development-joint-stock 43/57
Song Da Urban & I nd. Zone Invt & Dev.
Hanoi, Viet Nam, Tel: 84-4-37684504,URL: http://www.sudicosd.com.vn/
Interim Cash Flows
Standardized
Financials in: USD (000)
Except for share items (millions) and per share items (actual units)
Financial Glossary
30-Sep-2010 30-Jun-2010 31-Dec-2009 30-Sep-2009 30-Jun-2009
Period Length 6 Months 6 Months 12 Months 9 Months 6 Months
UpdateType/Date Updated Normal30-Sep-2010
Updated Normal30-Jun-2010
Updated Normal31-Dec-2009
RestatedNormal
30-Sep-2010
Updated Normal30-Jun-2009
Filed Currency VND VND VND VND VND
Exchange Rate (Period Average) 19140.72973 18888.303279 17802.088493 17700.824088 17643.061749
Net Income/Starting Line - 17,956.2 48,672.2 - -
Depreciation - 68.8 191.6 - -
Depreciation/ Depletion - 68.8 191.6 - -
Other Non-Cash Items - -2,132.5 -11,134.4 - -
Non-Cash I tems - -2,132.5 -11,134.4 - -Accounts Receivable - 650.5 2,570.5 - -
Inventories - 10.9 -40,714.8 - -
Prepaid Expenses - 23.1 -29.8 - -
Accounts Payable - -5,188.9 17,807.8 - -
Taxes Payable - -1,206.0 -677.3 - -
Other Operating Cash Flow -86,926.6 -25,880.2 -1,440.7 21,483.1 6,756.6
Changes in Working Capital -86,926.6 -31,590.6 -22,484.4 21,483.1 6,756.6
Cash from Operating Activities -86,926.6 -15,698.2 15,245.0 21,483.1 6,756.6
Purchase of Fixed Assets -4.6 - -833.9 -13.9 0.0
Capital Expenditures -4.6 - -833.9 -13.9 0.0
Sale of Fixed Assets 0.7 - 95.3 0.8 0.6
Sale/Maturity of Investment - 4,235.4 2.8 - -
Purchase of Investments - -32,768.5 -8,459.1 - -
Other Investing Cash Flow 2,110.8 2,132.5 18,064.7 9,930.6 23.2
Other Investing Cash Flow Items,Total
2,111.5 -26,400.5 9,703.7 9,931.4 23.7
Cash from Investing Activit ies 2,106.9 -26,400.5 8,869.7 9,917.5 23.7
Other Financing Cash Flow - -5,294.3 -3,349.0 - -
Financing Cash Flow I tems - -5,294.3 -3,349.0 - -
Sale/Issuance of Common - 10,614.5 2,564.9 - -
Repurchase/Retirement of
Common
- -496.1 0.0 - -
Common Stock, Net - 10,118.5 2,564.9 - -
Issuance (Retiremen t) of Stock,Net
- 10,118.5 2,564.9 - -
Total Debt Issued 52,244.6 5,294.3 37,213.0 2,655.2 2,663.9
Total Debt Reduction - - -21,287.9 -19,347.6 -6,431.1
Issuance (Retirement) of Debt,Net
52,244.6 5,294.3 15,925.1 -16,692.4 -3,767.1
Cash from Financing Activit ies 52,244.6 10,118.5 15,141.0 -16,692.4 -3,767.1
OneSource One-Stop Reports for Song Da Urban & Ind. Zone Invt & D
Page 43

8/8/2019 SJS_ Song Da Urban & Industrial Zone Investment and Development Joint Stock Company
http://slidepdf.com/reader/full/sjs-song-da-urban-industrial-zone-investment-and-development-joint-stock 44/57
Net Change in Cash -32,575.1 -31,980.2 39,255.7 14,708.3 3,013.2
Net Cash - Beginning Balance 36,990.2 37,049.2 516.0 518.9 520.6
Net Cash - Ending Balance 4,415.0 5,069.0 39,771.7 15,227.2 3,533.8
Cash Interest Paid 140.8 -1,610.8 300.6 302.6 279.0
Cash Taxes Paid 4,756.4 1,206.0 677.3 566.5 283.4
© 1983-2010 Reuters Research Inc. All Rights Reserved.
Published by OneSource Information Services, Inc., November, 2010.
OneSource One-Stop Reports for Song Da Urban & Ind. Zone Invt & D
Page 44

8/8/2019 SJS_ Song Da Urban & Industrial Zone Investment and Development Joint Stock Company
http://slidepdf.com/reader/full/sjs-song-da-urban-industrial-zone-investment-and-development-joint-stock 45/57
Song Da Urban & I nd. Zone Invt & Dev.
Hanoi, Viet Nam, Tel: 84-4-37684504,URL: http://www.sudicosd.com.vn/
Annual In come Statement
As Reported
Financials in: USD (000)
Except for share items (millions) and per share items (actual units)
31-Dec-2009 31-Dec-2008 31-Dec-2007 31-Dec-2006 31-Dec-2005
Period Length 12 Months 12 Months 12 Months 12 Months 12 Months
UpdateType/Date Updated Normal31-Dec-2009
Updated Normal31-Dec-2008
Updated Normal31-Dec-2007
Updated Normal31-Dec-2006
RestatedNormal
31-Dec-2006
Filed Currency VND VND VND VND VND
Exchange Rate (Period Average) 17802.088493 16452.496831 16083.860656 15990.427596 15854.243169
Auditor Auditing andConsulting JointStock Company
Auditing andConsulting JointStock Company
Auditing andConsulting JointStock Company
Auditing andConsulting JointStock Company
Auditing andConsulting JointStock Company
Auditor Opinion Unqualified Unqualified withExplanation
Unqualified Unqualified Qualified
Gross Sales 62,626.6 19,094.3 44,025.9 21,019.4 23,847.8Sales Returns and Allowances - - - - -6.6
Total Revenue 62,626.6 19,094.3 44,025.9 21,019.4 23,841.2
Cost of Goods Sold 22,776.1 7,421.9 20,911.2 12,850.4 12,565.6
Interest Income -759.3 -129.7 -396.5 -157.3 -475.2
Income from Debtors - - -77.1 - -
Gain from Investment -297.3 -1,132.4 -15.7 -195.2 -100.9
Dividend Income -516.7 -162.6 -346.2 - -
Income from Sale of Affiliates -10,287.7 - - - -
Income from Financial Activities -258.1 -19.1 - - -
Unrealized Gains from Foreign
Exchange
0.0 0.0 - - -
Interest Expense 300.6 169.6 - - -
Provision for Investment -77.9 139.9 - - -
Expense from Financial Activities 350.5 3.7 0.1 - -
Selling Expense 41.4 75.8 58.1 31.9 40.8
Depreciation Expense 90.2 89.1 - - -
General and AdministrativeExpenses
2,011.1 1,707.8 1,596.6 995.4 826.3
Total Operating Expense 13,372.8 8,163.8 21,730.5 13,525.2 12,856.6
Gain on Sale of Fixed Assets - - 0.0 58.1 19.9
Other Non-Operating Income 97.5 2.3 45.4 0.6 2.4
Loss on Sale of Assets -128.1 - 0.0 -58.1 -
Other Non-Operating Expense -1,019.1 -20.0 -3.0 - -19.7
Net Income Before Taxes 48,204.2 10,912.9 22,337.8 7,494.8 10,987.2
Provision for Income Taxes 9,061.7 3,304.6 0.0 0.0 0.0
Net Income After Taxes 39,142.5 7,608.2 22,337.8 7,494.8 10,987.2
Equity in Affiliates 468.0 -382.4 - - -
Net Income Before Extra. I tems 39,610.5 7,225.9 22,337.8 7,494.8 10,987.2
Net Income 39,610.5 7,225.9 22,337.8 7,494.8 10,987.2
OneSource One-Stop Reports for Song Da Urban & Ind. Zone Invt & D
Page 45

8/8/2019 SJS_ Song Da Urban & Industrial Zone Investment and Development Joint Stock Company
http://slidepdf.com/reader/full/sjs-song-da-urban-industrial-zone-investment-and-development-joint-stock 46/57
Earning Adjustment -735.0 - - - -
Income Available to Com ExclExtraOrd
38,875.5 7,225.9 22,337.8 7,494.8 10,987.2
Income Available to Com InclExtraOrd
38,875.5 7,225.9 22,337.8 7,494.8 10,987.2
Basic Weighted Average Shares 79.8 96.6 60.5 92.5 92.5
Basic EPS Excluding ExtraOrdinaryItems
0.49 0.07 0.37 0.08 0.12
Basic EPS Including ExtraOrdinaryItems
0.49 0.07 0.37 0.08 0.12
Diluted Net Income 38,875.5 7,225.9 22,337.8 7,494.8 10,987.2
Diluted Weighted Average Shares 79.8 96.6 60.5 92.5 92.5
Diluted EPS Excluding ExtraOrd Items 0.49 0.07 0.37 0.08 0.12
Diluted EPS Including ExtraOrd Items 0.49 0.07 0.37 0.08 0.12
DPS-Common Stock 0.05 0.04 0.05 0.03 0.00
Gross Dividends - Common Stock - - 4,942.8 - 0.0
Normalized Income Before Taxes 48,332.3 10,912.9 22,337.8 7,494.8 10,967.3
Inc Tax Ex Impact of Sp Items 9,085.8 3,304.6 0.0 0.0 0.0Normalized Income After Taxes 39,246.5 7,608.2 22,337.8 7,494.8 10,967.3
Normalized Inc. Avail to Com. 38,979.5 7,225.9 22,337.8 7,494.8 10,967.3
Basic Normalized EPS 0.49 0.07 0.37 0.08 0.12
Diluted Normalized EPS 0.49 0.07 0.37 0.08 0.12
Interest Expense 300.6 169.6 - - -
Depreciation 153.8 120.7 105.0 94.9 82.8
Amortization of Intangibles 28.1 30.6 265.5 332.1 382.4
Current Tax 8,646.1 3,869.5 - - -
Current Tax - Total 8,646.1 3,869.5 - - -
Deferred Tax 415.6 -564.9 - - -
Deferred Tax - Total 415.6 -564.9 - - -
Income Tax - Total 9,061.7 3,304.6 - - -
© 1983-2010 Reuters Research Inc. All Rights Reserved.
Published by OneSource Information Services, Inc., November, 2010.
OneSource One-Stop Reports for Song Da Urban & Ind. Zone Invt & D
Page 46
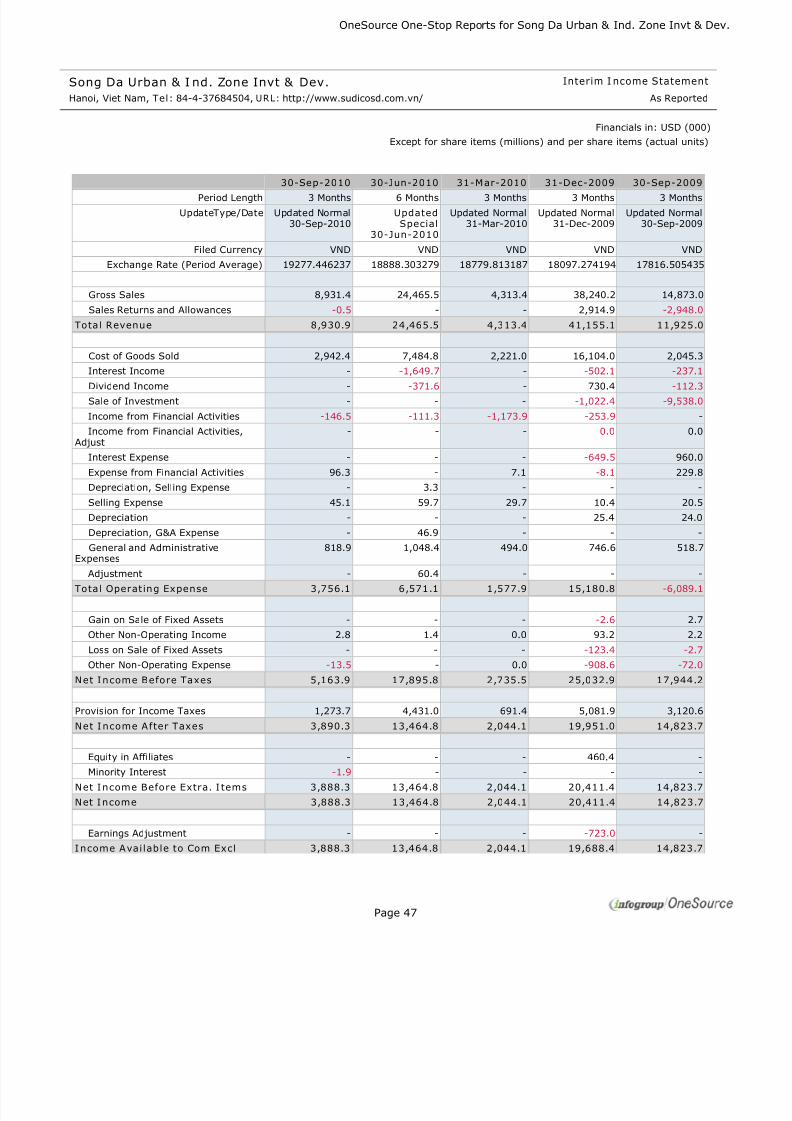
8/8/2019 SJS_ Song Da Urban & Industrial Zone Investment and Development Joint Stock Company
http://slidepdf.com/reader/full/sjs-song-da-urban-industrial-zone-investment-and-development-joint-stock 47/57
Song Da Urban & I nd. Zone Invt & Dev.
Hanoi, Viet Nam, Tel: 84-4-37684504,URL: http://www.sudicosd.com.vn/
Interim I ncome Statement
As Reported
Financials in: USD (000)
Except for share items (millions) and per share items (actual units)
30-Sep-2010 30-Jun-2010 31-Mar-2010 31-Dec-2009 30-Sep-2009
Period Length 3 Months 6 Months 3 Months 3 Months 3 Months
UpdateType/Date Updated Normal30-Sep-2010
UpdatedSpecial
30-Jun-2010
Updated Normal31-Mar-2010
Updated Normal31-Dec-2009
Updated Normal30-Sep-2009
Filed Currency VND VND VND VND VND
Exchange Rate (Period Average) 19277.446237 18888.303279 18779.813187 18097.274194 17816.505435
Gross Sales 8,931.4 24,465.5 4,313.4 38,240.2 14,873.0
Sales Returns and Allowances -0.5 - - 2,914.9 -2,948.0
Total Revenue 8,930.9 24,465.5 4,313.4 41,155.1 11,925.0
Cost of Goods Sold 2,942.4 7,484.8 2,221.0 16,104.0 2,045.3Interest Income - -1,649.7 - -502.1 -237.1
Dividend Income - -371.6 - 730.4 -112.3
Sale of Investment - - - -1,022.4 -9,538.0
Income from Financial Activities -146.5 -111.3 -1,173.9 -253.9 -
Income from Financial Activities,Adjust
- - - 0.0 0.0
Interest Expense - - - -649.5 960.0
Expense from Financial Activities 96.3 - 7.1 -8.1 229.8
Depreciation, Selling Expense - 3.3 - - -
Selling Expense 45.1 59.7 29.7 10.4 20.5
Depreciation - - - 25.4 24.0
Depreciation, G&A Expense - 46.9 - - -
General and AdministrativeExpenses
818.9 1,048.4 494.0 746.6 518.7
Adjustment - 60.4 - - -
Total Operating Expense 3,756.1 6,571.1 1,577.9 15,180.8 -6,089.1
Gain on Sale of Fixed Assets - - - -2.6 2.7
Other Non-Operating Income 2.8 1.4 0.0 93.2 2.2
Loss on Sale of Fixed Assets - - - -123.4 -2.7
Other Non-Operating Expense -13.5 - 0.0 -908.6 -72.0
Net Income Before Taxes 5,163.9 17,895.8 2,735.5 25,032.9 17,944.2
Provision for Income Taxes 1,273.7 4,431.0 691.4 5,081.9 3,120.6
Net Income After Taxes 3,890.3 13,464.8 2,044.1 19,951.0 14,823.7
Equity in Affiliates - - - 460.4 -
Minority Interest -1.9 - - - -
Net Income Before Extra. I tems 3,888.3 13,464.8 2,044.1 20,411.4 14,823.7
Net Income 3,888.3 13,464.8 2,044.1 20,411.4 14,823.7
Earnings Adjustment - - - -723.0 -
I ncome Available to Com Excl 3,888.3 13,464.8 2,044.1 19,688.4 14,823.7
OneSource One-Stop Reports for Song Da Urban & Ind. Zone Invt & D
Page 47

8/8/2019 SJS_ Song Da Urban & Industrial Zone Investment and Development Joint Stock Company
http://slidepdf.com/reader/full/sjs-song-da-urban-industrial-zone-investment-and-development-joint-stock 48/57
ExtraOrd
Income Available to Com InclExtraOrd
3,888.3 13,464.8 2,044.1 19,688.4 14,823.7
Basic Weighted Average Shares 99.9 100.0 100.0 30.1 96.4
Basic EPS Excluding ExtraOrdinaryItems
0.04 0.13 0.02 0.65 0.15
Basic EPS Including ExtraOrdinary
Items
0.04 0.13 0.02 0.65 0.15
Diluted Net Income 3,888.3 13,464.8 2,044.1 19,688.4 14,823.7
Diluted Weighted Average Shares 99.9 100.0 100.0 30.1 96.4
Diluted EPS Excluding ExtraOrd Items 0.04 0.13 0.02 0.65 0.15
Diluted EPS Including ExtraOrd Items 0.04 0.13 0.02 0.65 0.15
DPS-Common Stock 0.00 0.00 0.00 0.03 0.00
Gross Dividends - Common Stock 0.0 0.0 0.0 - 0.0
Normalized Income Before Taxes 5,163.9 17,895.8 2,735.5 25,158.9 17,944.2
Inc Tax Ex Impact of Sp Items 1,273.7 4,431.0 691.4 5,107.4 3,120.6
Normalized Income After Taxes 3,890.3 13,464.8 2,044.1 20,051.5 14,823.7
Normalized Inc. Avail to Com. 3,888.3 13,464.8 2,044.1 19,788.8 14,823.7
Basic Normalized EPS 0.04 0.13 0.02 0.66 0.15
Diluted Normalized EPS 0.04 0.13 0.02 0.66 0.15
Interest Expense - - - -649.5 960.0
Depreciation - 55.5 - 52.0 37.3
Amortization of Intangibles - 13.2 - 6.9 7.0
Current Tax - 4,461.2 - - -
Current Tax - Total - 4,461.2 - - -
Deferred Tax - -30.2 - - -
Deferred Tax - Total - -30.2 - - -
Income Tax - Total - 4,431.0 - - -
© 1983-2010 Reuters Research Inc. All Rights Reserved.
Published by OneSource Information Services, Inc., November, 2010.
OneSource One-Stop Reports for Song Da Urban & Ind. Zone Invt & D
Page 48

8/8/2019 SJS_ Song Da Urban & Industrial Zone Investment and Development Joint Stock Company
http://slidepdf.com/reader/full/sjs-song-da-urban-industrial-zone-investment-and-development-joint-stock 49/57
Song Da Urban & I nd. Zone Invt & Dev.
Hanoi, Viet Nam, Tel: 84-4-37684504,URL: http://www.sudicosd.com.vn/
Annual Balance Sheet
As Reported
Financials in: USD (000)
Except for share items (millions) and per share items (actual units)
31-Dec-2009 31-Dec-2008 31-Dec-2007 31-Dec-2006 31-Dec-2005
UpdateType/Date Updated Normal31-Dec-2009
Updated Normal31-Dec-2008
Updated Normal31-Dec-2007
ReclassifiedNormal
31-Dec-2007
RestatedNormal
31-Dec-2006
Filed Currency VND VND VND VND VND
Exchange Rate 18474 17483 16016.5 16056 15914
Auditor Auditing andConsulting JointStock Company
Auditing andConsulting JointStock Company
Auditing andConsulting JointStock Company
Auditing andConsulting JointStock Company
Auditing andConsulting JointStock Company
Auditor Opinion Unqualified Unqualified withExplanation
Unqualified Unqualified Qualified
Cash 4,981.0 378.5 7,540.1 1,327.1 3,119.1
Cash Equivalents 33,344.2 146.9 - - -Short Term Investment 4,555.2 - 2,184.0 - 2,363.9
Provision for Short TermInvestment
-1.2 - - - -
Accounts Receivable 3,380.9 8,076.1 14,535.4 12,536.0 14,060.5
Prepayment to Suppliers 2,710.3 1,543.9 2,013.8 2,236.6 2,360.6
Other Receivables 128.8 1,003.1 209.0 914.9 1,748.2
Provision for Doubtful Account -480.4 -586.4 - - -
Raw Materials - - 0.0 1.9 2.6
Work in Progress 4,165.8 1,399.2 32.4 203.7 202.0
Finished Goods - - 0.0 48.6 -
Merchandise - - 493.6 492.4 22.2
Goods on Consignment - - 0.0 17.0 -Short Term Prepaid Expense 44.3 30.6 37.2 17.1 41.4
Claimable VAT 58.2 71.9 7.4 2.3 4.9
Other Current Assets 819.4 470.9 460.1 106.6 144.0
Total Current Assets 53,706.4 12,534.7 27,512.9 17,904.3 24,069.5
Buildings and Structures 777.1 977.7 804.8 237.9 -
Machinery and Equipment 56.5 52.5 26.3 26.2 26.4
Transportation Equipment 796.3 315.6 314.2 353.1 323.1
Office Equipment 198.0 158.2 137.7 121.9 107.2
Other Fixed Assets 11.4 12.0 5.3 2.9 3.0
Accumulated Depreciation -518.6 -460.4 -386.3 -336.9 -192.3
Intangibles, Gross 1,728.9 1,826.9 1,994.2 1,992.1 2,007.1Accumulated IntangibleAmortization
-1,604.9 -1,667.3 -1,788.5 -1,520.3 -1,200.2
Construction in Progress 91,062.9 57,801.9 48,724.5 36,037.3 22,878.3
Investment in Properties 233.5 - - - -
Accumulated Depreciation -9.3 - - - -
Investment in Subsidiaries 0.0 - 572.1 - -
Investment in Affiliates 4,640.1 10,345.0 11,847.8 2,065.5 1,954.2
Other Long Term Investment 11,510.7 8,706.0 6,829.7 1,404.3 468.8
Provision for LT Investment -403.9 -131.6 - - -
OneSource One-Stop Reports for Song Da Urban & Ind. Zone Invt & D
Page 49

8/8/2019 SJS_ Song Da Urban & Industrial Zone Investment and Development Joint Stock Company
http://slidepdf.com/reader/full/sjs-song-da-urban-industrial-zone-investment-and-development-joint-stock 50/57
Long Term Prepaid Expense 21.4 8.5 7.9 21.5 4.3
Deferred Income Tax 102.6 531.6 - - -
Total Assets 162,309.3 91,011.3 96,602.5 58,309.9 50,449.4
Short Term Borrowings 0.0 2,859.9 - - -
Current Portion of Long Term Debt 0.0 2,087.7 - - -
Accounts Payable 3,033.2 7,508.7 8,394.6 7,610.1 6,579.9
Customer Advances 18,119.8 501.3 4,942.7 4,073.8 11,149.1
Taxes Payable 13,039.8 3,808.0 1,108.2 1,536.9 856.9Accrued Salary 677.6 256.6 211.0 129.8 126.7
Accrued Expenses 2,207.7 562.3 0.0 0.3 0.2
Other Payables 2,382.7 284.5 597.6 379.0 600.3
Total Current Liabil ities 39,460.8 17,868.9 15,254.2 13,730.0 19,313.1
Long Term Borrowings 27,065.1 7,435.8 1,971.1 10,757.3 3,141.9
Total Long Term Debt 27,065.1 7,435.8 1,971.1 10,757.3 3,141.9
Other Long Term Payables 14.6 1.7 1.9 4.6 0.6
Reserve for Severance Allowances 8.2 13.0 24.2 17.9 13.5
Total Liabilities 66,548.7 25,319.4 17,251.3 24,509.8 22,469.0
Common Stock 43,304.1 22,879.4 24,974.2 3,114.1 3,141.9
Paid-In Capital 11,817.1 11,423.5 12,469.5 - -
Treasury Stock 0.0 -1,548.4 - - -
Fund for Development 1,151.1 26,211.0 16,328.9 19,428.6 11,922.4
Fund for Financial Contingencies 1,890.7 1,750.8 1,259.2 321.9 324.8
Retained Earnings 37,350.6 4,814.7 24,317.2 10,741.9 12,437.3
Fund for Bonus and Welfare 247.1 160.7 2.2 193.5 154.0
Total Equity 95,760.6 65,691.8 79,351.2 33,800.1 27,980.4
Total Liabil it ies & Shareholders'Equity
162,309.3 91,011.3 96,602.5 58,309.9 50,449.4
S/O-Common Stock 100.0 96.4 97.0 92.5 92.5
Total Common Shares Outstanding 100.0 96.4 97.0 92.5 92.5
T/S-Common Stock - 0.6 - - -
Customer Advances 18,119.8 501.3 4,942.7 4,073.8 11,149.1
Accumulated Amortization of Intangibles
1,604.9 1,667.3 1,788.5 1,520.3 1,200.2
Full-Time Employees - - - 372 -
Long Term Debt Maturing within 1 Year - 2,087.7 - - -
Long Term Debt Maturing from 1 to 5Yrs
27,065.1 7,435.8 - - -
Total Long Term Debt, Supplemental 27,065.1 9,523.5 - - -
© 1983-2010 Reuters Research Inc. All Rights Reserved.
Published by OneSource Information Services, Inc., November, 2010.
OneSource One-Stop Reports for Song Da Urban & Ind. Zone Invt & D
Page 50

8/8/2019 SJS_ Song Da Urban & Industrial Zone Investment and Development Joint Stock Company
http://slidepdf.com/reader/full/sjs-song-da-urban-industrial-zone-investment-and-development-joint-stock 51/57
Song Da Urban & I nd. Zone Invt & Dev.
Hanoi, Viet Nam, Tel: 84-4-37684504,URL: http://www.sudicosd.com.vn/
Interim Balance Sheet
As Reported
Financials in: USD (000)
Except for share items (millions) and per share items (actual units)
30-Sep-2010 30-Jun-2010 31-Dec-2009 30-Sep-2009 30-Jun-2009
UpdateType/Date Updated Normal30-Sep-2010
Updated Normal30-Jun-2010
ReclassifiedNormal
30-Sep-2010
Updated Normal30-Sep-2009
Updated Normal30-Jun-2009
Filed Currency VND VND VND VND VND
Exchange Rate 19475 19080 18474 17840.5 17773
Cash 4,339.3 5,018.1 4,981.0 15,108.0 3,508.0
Cash Equivalents - - 33,344.2 - -
Short Term Securities Investment 15.7 - 224.8 211.1 -
Short Term Investment 459.6 10,482.2 4,330.4 26,024.4 0.0
Provision for Short TermInvestment
-3.1 - -1.2 - -
Accounts Receivable 2,908.2 3,460.1 3,380.9 9,099.8 9,980.4
Prepayment to Suppliers 3,449.8 1,405.9 2,710.3 1,737.5 1,758.9
Other Receivables 396.2 1,359.1 128.8 1,866.0 939.4
Provisions for Doubtful Account -455.7 -465.2 -480.4 -574.6 -576.8
Inventories in Transit 2.7 - - - -
Raw Materials 9.4 - - - -
Work in Progress 6,241.2 390.3 4,165.8 2,275.1 1,639.1
Advance Payments 2,311.7 - - - -
Short Term Prepaid Expense 57.8 16.8 44.3 33.7 33.0
Allocation Awaiting Expenses 39.1 - - - -
Claimable VAT 106.9 16.4 58.2 120.4 -
Taxes Receivable - 16.5 - 0.0 67.1
Other Current Assets - 1,339.4 819.4 1,292.5 601.6
Total Current Assets 19,878.7 23,039.6 53,706.4 57,193.9 17,950.6
Buildings and Structures - 1,001.1 777.1 1,004.8 1,008.6
Machinery and Equipment - 16.5 56.5 53.3 51.6
Transportation Equipment - 360.7 796.3 422.8 311.3
Office Equipment - 157.5 198.0 185.6 161.1
Other Fixed Assets - 9.6 11.4 11.8 11.8
Tangibles, Gross 2,198.5 - - - -
Accumulated Depreciation -636.6 -433.1 -518.6 -533.1 -516.6
Intangibles, Gross 1,640.1 1,674.0 1,728.9 1,790.3 1,797.1
Accumulated IntangibleAmortization -1,541.7 -1,567.0 -1,604.9 -1,654.9 -1,654.1
Construction in Progress 147,942.6 107,606.6 91,062.9 76,849.2 59,211.9
Investment in Properties 221.5 226.1 233.5 - -
Accumulated Depreciation -15.5 -13.6 -9.3 - -
Investment in Subsidiaries - 8,132.2 0.0 - 0.0
Investment in Affiliates 14,216.4 13,598.8 4,640.1 8,264.2 10,498.6
Other Long Term Investment 23,696.1 22,772.1 11,510.7 11,101.1 8,534.9
Provisions for LT Investment -2,733.1 -2,789.7 -403.9 -2,738.7 -2,749.1
Long Term Prepaid Expense 52.6 45.5 21.4 8.4 7.0
OneSource One-Stop Reports for Song Da Urban & Ind. Zone Invt & D
Page 51

8/8/2019 SJS_ Song Da Urban & Industrial Zone Investment and Development Joint Stock Company
http://slidepdf.com/reader/full/sjs-song-da-urban-industrial-zone-investment-and-development-joint-stock 52/57
Deferred Income Tax 68.0 69.4 102.6 520.9 522.9
Other Long Term Assets - - - 0.0 0.0
Total Assets 204,987.7 173,906.3 162,309.3 152,479.5 95,147.7
Short Term Borrowings 38,510.9 5,241.1 0.0 0.0 2,813.3
Current Port. of Long Term Debt - - 0.0 0.0 1,125.3
Accounts Payable 2,327.6 2,319.1 3,033.2 2,927.0 6,422.9
Customer Advances 1,930.3 562.5 18,119.8 27,863.8 3,954.9
Taxes Payable 11,614.6 14,329.7 13,039.8 6,896.6 3,901.8Accrued Salary 434.8 117.9 677.6 299.1 29.7
Accrued Expenses 1,331.6 3,720.8 2,207.7 1,281.5 457.4
Other Payables 5,577.3 4,895.8 2,382.7 5,743.1 1,414.2
Fund for Bonus & Welfare 2,858.4 3,057.0 247.1 - -
Total Current Liabil ities 64,585.5 34,243.9 39,707.9 45,011.0 20,119.5
Long Term Debts 25,673.9 26,205.5 27,065.1 28,026.1 10,071.7
Total Long Term Debt 25,673.9 26,205.5 27,065.1 28,026.1 10,071.7
Other Long Term Payables 12.5 3.1 14.6 3.4 3.4
Reserve for Severance Allowances 4.5 4.2 8.2 9.6 11.4
Unrealised Revenue 6,796.1 6,919.7 - - -
Minority Interest 320.9 - - - -
Total Liabilities 97,393.5 67,376.4 66,795.8 73,050.1 30,206.0
Common Stock 51,347.9 52,410.9 43,304.1 22,420.9 22,506.0
Paid-in Capital 11,234.9 11,467.5 11,817.1 11,194.6 11,237.1
Treasury Stock -1,117.8 -491.1 0.0 -1,517.3 -1,523.1
Fund for Development 24,241.0 24,731.3 1,151.1 25,685.8 25,783.4
Fund for Financial Contingencies 3,631.6 3,704.8 1,890.7 1,957.9 1,965.3
Other Owner's Fund 551.5 562.9 - - -
Retained Earnings 17,705.2 14,143.6 37,350.6 19,687.6 4,733.6
Fund for Bonus and Welfare - - - 0.0 239.3
Total Equity 107,594.2 106,529.8 95,513.5 79,429.4 64,941.6
Total Liabil it ies & Shareholders'Equity
204,987.7 173,906.3 162,309.3 152,479.5 95,147.7
S/O-Common Stock 99.7 100.0 100.0 96.4 96.4
Total Common Shares Outstanding 99.7 100.0 100.0 96.4 96.4
T/S-Common Stock 0.3 - - 0.6 0.6
Customer Advances 1,930.3 562.5 18,119.8 27,863.8 3,954.9
Deferred Revenue - Long Term 6,796.1 6,919.7 - - -
Accumulated Amortization of Intangibles
1,541.7 1,567.0 1,604.9 1,654.9 1,654.1
Long Term Debt Maturing in 1 Year - - - - 1,125.3Long Term Debt Maturing in 3 Years - - - 28,026.1 -
Long Term Debt Maturing in 5 Years 25,673.9 - 27,065.1 - 10,071.7
Total Long Term Debt, Supplemental 25,673.9 - 27,065.1 28,026.1 11,197.0
© 1983-2010 Reuters Research Inc. All Rights Reserved.
Published by OneSource Information Services, Inc., November, 2010.
OneSource One-Stop Reports for Song Da Urban & Ind. Zone Invt & D
Page 52

8/8/2019 SJS_ Song Da Urban & Industrial Zone Investment and Development Joint Stock Company
http://slidepdf.com/reader/full/sjs-song-da-urban-industrial-zone-investment-and-development-joint-stock 53/57
Song Da Urban & I nd. Zone Invt & Dev.
Hanoi, Viet Nam, Tel: 84-4-37684504,URL: http://www.sudicosd.com.vn/
Annual Cash Flow s
As Reported
Financials in: USD (000)
Except for share items (millions) and per share items (actual units)
31-Dec-2009 31-Dec-2008 31-Dec-2007 31-Dec-2006 31-Dec-2005
Period Length 12 Months 12 Months 12 Months 12 Months 12 Months
UpdateType/Date Updated Normal31-Dec-2009
Updated Normal31-Dec-2008
Updated Normal31-Dec-2007
ReclassifiedNormal
31-Dec-2007
ReclassifiedNormal
31-Dec-2006
Filed Currency VND VND VND VND VND
Exchange Rate (Period Average) 17802.088493 16452.496831 16083.860656 15990.427596 15854.243169
Auditor Auditing andConsulting JointStock Company
Auditing andConsulting JointStock Company
Auditing andConsulting JointStock Company
Auditing andConsulting JointStock Company
Auditing andConsulting JointStock Company
Auditor Opinion Unqualified Unqualified withExplanation
Unqualified Unqualified Qualified
Net Income 48,672.2 10,530.5 22,337.8 7,494.8 10,987.2Depreciation 191.6 151.3 370.5 427.4 532.7
Provisions 213.8 763.0 - - -
Gains/Losses on Foreign Exchange 0.0 0.0 - - -
Gain/Loss on Investment -11,648.7 -283.9 -835.5 -352.5 -169.2
Interest Expense 300.6 169.6 - - -
Increase/Decrease in AccountsReceivable
2,570.5 3,708.5 -17,948.7 2,369.5 -5,727.1
Increase/Decrease in Inventories -40,714.8 -16,136.4 238.6 -13,957.1 -13,588.6
Increase/Decrease in AccountsPayable
17,807.8 -2,045.7 3,181.0 -4,261.0 5,203.0
Increase/Decrease in PrepaidExpenses
-29.8 23.9 -6.3 6.7 39.0
Cash Interest Paid -300.6 -200.8 -1,125.6 -1,166.1 -
Cash Taxes Paid -677.3 -4,590.0 - - -1,119.6
Other Cash from OperatingActivities
71.1 177.8 1.6 1.9 -
Other Cash Paid for OperatingActivities
-1,211.3 -1,132.5 -826.5 -623.0 -636.6
Cash from Operating Activities 15,245.0 -8,864.8 5,386.9 -10,059.3 -4,479.1
Capital Expenditure -833.9 -265.7 -37.0 -96.8 -43.4
Sale of Fixed Assets 95.3 - 0.0 58.1 19.9
Purchase of Investment -5,055.6 - - - -
Sale of Investment 2.8 2,132.2 0.0 2,352.6 3,469.1
Investment in Other Entities -3,403.6 -2,830.7 -15,178.3 -1,447.8 -435.8Returns fr. Investment in OtherEntities
17,286.0 384.2 1.2 175.1 -
Dividend and Interest Income 778.7 258.4 753.0 352.5 149.3
Cash from Investing Activit ies 8,869.7 -321.6 -14,461.0 1,393.6 3,159.1
Issuance of Common Stock 2,564.9 - 24,883.5 - -
Repurchase of Stock 0.0 -1,645.3 - - -
Total Debt Issued 37,213.0 15,195.3 1,701.1 11,426.8 3,153.7
Total Debt Reduction -21,287.9 -3,955.0 -10,477.0 -3,752.2 -
OneSource One-Stop Reports for Song Da Urban & Ind. Zone Invt & D
Page 53

8/8/2019 SJS_ Song Da Urban & Industrial Zone Investment and Development Joint Stock Company
http://slidepdf.com/reader/full/sjs-song-da-urban-industrial-zone-investment-and-development-joint-stock 54/57
Dividend and Interest Paid -3,349.0 -7,247.4 -849.7 -780.5 -788.4
Cash from Financing Activit ies 15,141.0 2,347.5 15,257.9 6,894.1 2,365.3
Foreign Exchange Effects - 0.0 - - -
Net Change in Cash 39,255.7 -6,838.9 6,183.7 -1,771.6 1,045.3
Net Cash - Beginning Balance 516.0 7,397.2 1,324.8 3,104.2 2,085.6
Net Cash - Ending Balance 39,771.7 558.3 7,508.6 1,332.6 3,130.9
Cash Interest Paid 300.6 200.8 1,125.6 1,166.1 -Cash Taxes Paid 677.3 4,590.0 - - 1,119.6
© 1983-2010 Reuters Research Inc. All Rights Reserved.
Published by OneSource Information Services, Inc., November, 2010.
OneSource One-Stop Reports for Song Da Urban & Ind. Zone Invt & D
Page 54

8/8/2019 SJS_ Song Da Urban & Industrial Zone Investment and Development Joint Stock Company
http://slidepdf.com/reader/full/sjs-song-da-urban-industrial-zone-investment-and-development-joint-stock 55/57
Song Da Urban & I nd. Zone Invt & Dev.
Hanoi, Viet Nam, Tel: 84-4-37684504,URL: http://www.sudicosd.com.vn/
Interim Cash Flows
As Reported
Financials in: USD (000)
Except for share items (millions) and per share items (actual units)
30-Sep-2010 30-Jun-2010 31-Dec-2009 30-Sep-2009 30-Jun-2009
Period Length 6 Months 6 Months 12 Months 9 Months 6 Months
UpdateType/Date Updated Normal30-Sep-2010
Updated Normal30-Jun-2010
Updated Normal31-Dec-2009
RestatedNormal
30-Sep-2010
Updated Normal30-Jun-2009
Filed Currency VND VND VND VND VND
Exchange Rate (Period Average) 19140.72973 18888.303279 17802.088493 17700.824088 17643.061749
Net Income - 17,956.2 48,672.2 - -
Depreciation - 68.8 191.6 - -
Provisions - - 213.8 - -
Gain/Loss on Foreign Exchange - - 0.0 - -
Gain/Loss on Investment - -2,132.5 -11,648.7 - -Interest Expense - - 300.6 - -
Increase/Decrease in AccountsReceivable
- 650.5 2,570.5 - -
Increase/Decrease in Inventories - 10.9 -40,714.8 - -
Increase/Decrease in AccountsPayable
- -5,188.9 17,807.8 - -
Increase/Decrease in PrepaidExpenses
- 23.1 -29.8 - -
Cash Interest Paid - 1,610.8 -300.6 - -
Cash Tax Paid - -1,206.0 -677.3 - -
Other Cash from OperatingActivities
- 2,411.4 71.1 - -
Other Cash Paid for OperatingActivities - -29,902.3 -1,211.3 - -
Cash from Operating Activities -86,926.6 - - 21,483.1 6,756.6
Cash from Operating Activities -86,926.6 -15,698.2 15,245.0 21,483.1 6,756.6
Capital Expenditure -4.6 - -833.9 -13.9 0.0
Sale of Fixed Assets 0.7 - 95.3 0.8 0.6
Purchase of Investment - -10,588.6 -5,055.6 - -
Sale of Investment - 4,235.4 2.8 - -
Investment in Other Entities - -22,179.9 -3,403.6 - -
Returns fr. Investment in OtherEntities
- - 17,286.0 - -
Income from Subsidiaries 52.2 - - - -
Dividend and Interest Income 2,058.6 2,132.5 778.7 9,930.6 23.2
Cash from Investing Activit ies 2,106.9 -26,400.5 8,869.7 9,917.5 23.7
Issuance of Common Stock - 10,614.5 2,564.9 - -
Repurchase of Stock - -496.1 0.0 - -
Total Debt Issued 52,244.6 5,294.3 37,213.0 2,655.2 2,663.9
Total Debt Reduction - - -21,287.9 -19,347.6 -6,431.1
Dividend and Interest Paid - -5,294.3 -3,349.0 - -
Cash from Financing Activit ies 52,244.6 10,118.5 15,141.0 -16,692.4 -3,767.1
OneSource One-Stop Reports for Song Da Urban & Ind. Zone Invt & D
Page 55

8/8/2019 SJS_ Song Da Urban & Industrial Zone Investment and Development Joint Stock Company
http://slidepdf.com/reader/full/sjs-song-da-urban-industrial-zone-investment-and-development-joint-stock 56/57
Net Change in Cash -32,575.1 -31,980.2 39,255.7 14,708.3 3,013.2
Net Cash - Beginning Balance 36,990.2 37,049.2 516.0 518.9 520.6
Net Cash - Ending Balance 4,415.0 5,069.0 39,771.7 15,227.2 3,533.8
Cash Interest Paid 140.8 -1,610.8 300.6 302.6 279.0
Cash Taxes Paid 4,756.4 1,206.0 677.3 566.5 283.4
© 1983-2010 Reuters Research Inc. All Rights Reserved.
Published by OneSource Information Services, Inc., November, 2010.
OneSource One-Stop Reports for Song Da Urban & Ind. Zone Invt & D
Page 56

8/8/2019 SJS_ Song Da Urban & Industrial Zone Investment and Development Joint Stock Company
http://slidepdf.com/reader/full/sjs-song-da-urban-industrial-zone-investment-and-development-joint-stock 57/57
OneSource One-Stop Reports for Song Da Urban & Ind. Zone Invt & D