sjbv4n2_071
TRANSCRIPT

8/3/2019 SJBv4n2_071
http://slidepdf.com/reader/full/sjbv4n2071 1/26
Seoul Journal of Business
Volume 4, Number 2 (December 1998)
Cost Drivers of M anufacturing Overhead: A Cross-sectional Analysis of Automobile Component
Manufacturing Plants*
Taesik Ahn
C o ll eg e of B u s m es s A d r n m k t r a t w n
SeoulNattonal Un~uersl ty
Abstract
This paper tested whether volume and complexity-dnven support
activity drivers are significant m explainmg variabon of overhead. Dataused include cost and activity data for the 74 automobile componentmanufactunng plants. Each of volume and support achwty variablesshowed sigmfnmt marginal contnbuhon to the explanahon of overheadvanation Thls result supports the assumphons of both tradihonal andABC systems suggestmg that both volume and support achvlty dnversare useful for cost allocation and cost management purposes Amongthe support activities, process balancing activihes, purchasing controlactivities, and change actiwhes showed significant posltive effects onmanufacturing overhead
The higher level of tests showed that selected structural complexlty
variables explain the variation of support activlty drivers, especiallyprocess balancing, purchas ing control and change activities This
result partly supports the notion that structural production complexltydrivers have significant Influence on the level of support activities Wemay conclude that cost management should be considered from astrategic vlewpomt as well a s from an operabon management viewpoint.
1. Introduction
Due to product ion au tomat ion , manufac tur ing overhead is
The Institute of Management Research of Seoul Nahonal Unlverstty funded
thls research Helpful comments by three reviewers and data collect~on
support by Daewoo Motor Corporation are greatly appreciated

8/3/2019 SJBv4n2_071
http://slidepdf.com/reader/full/sjbv4n2071 2/26
7 2 Seoul Journal of Bus~ness
increasing while direct labor costs are decreasing (Miller &
Vollmann (1985)).This cost structure change ha s caused a new
concern for the cost drivers of manufacturing overhead. AchvityBased Coshng (ABC) is one of many innovative cost management
techniques dealing with the cost drivers of man ufacturing
overhead. ABC su pp or te r s as se r t t h a t cos t dr ivers of
manufacturing overhead are complexity-related activihes rather
than volume-related measures (Cooper & Kaplan ( 1991)).While
ABC is adopted by many world class companies (Cooper et al.
(1992). and Brimson (199I) ), empincal evldence is not sufficient
to verify the assertions of ABC supporters (Banker, Potter, &
Schroeder (1995). and Foster & Gupta (1990)).
This paper attempts to provide additional empirical evldence
regarding the cost drivers of manufactunng overhead. Previous
cost driver studies focused mamly on the direct effect of vanous
cost drivers on manufacturing overhead. This paper, however,
classified the previous cost drivers into two different levels and
included the analysis of inter-relationships between different
levels of cost drivers.
The data collected for this analysis consists of 74 plants of the
automobile component industry which supply their products to
one major automobile manufacturer. By limiting the scope of the
study to a homogeneous industry, we are able to control for the
effects of the mdustry.
Empirical results of this study supported that complexity-
related achvity variables indeed drive the cost of overhead. This
is consistent with the assertions of ABC supporters. Moreover
volume-related activity variables also positively influence
overhead. This result partly defends the tradihonal practice of
allocating overhead usi ng volume based drivers . We ca n
conclude that volume-related and complexity-related variables
are indeed cost dnvers of overhead.
Additional tests showed that structural complexity variables
partly explain the variation of supporting activity variables,
especially the variables that were identified as significant in
explaining overhead variation in the above analysis.

8/3/2019 SJBv4n2_071
http://slidepdf.com/reader/full/sjbv4n2071 3/26
Cost Dnvers of Manufacturing Overhead 73
2. Prior Literature
Foster and Gupta (1990) were among the first researchers on
the area of cost driver analysis. Using 37 electronic plants they
tested whether volume, complexity, and efficiency variables
actually change the level of overhead. Results supported the
nobon that volume-related variables are still the most important
vanable explaining the overhead changes. Banker, Potter, and
Schroe der (1993) analyzed 32 automobile, machinery and
electronic component plants to examine the impact of volume
and supporting acbvity variables on overhead. To operationallze
suppor t ing var iab les , they used Mil ler and Vol lmann ' s
framework (1985). In co ntrast to the result s of the previous
study, their results supported that complexity-related activlty
variables are significant explanatory variables of overhead
changes. Anderson (1995) recently tested the effect of product
mix heterogeneity on overhead uslng the tlme series data of
three textile plants. Empirical results of this study demonstratedthe effect of product mix heterogeneity on overhead.
Cost driver studies are not limited to the manufacturing
mdustry. Banker and John ston (1993) collected the archival
panel data of the U.S. alrline lndustry and analyzed the effect of
volume and operation based vanables on overhead. They found
that both variables are signlficant explanatory variables of
overhead changes. Noreen and Solderstrom (1994) used hospital
actlvity data of the state of Washington and investigated whethera strict proportionallty assumption holds in the relationship
between achvity vanables and activity costs.
In contrast to the prevlous cost drlver studies, Ittner and
MacDuffie (1995) tested the effect of structural and executional
drivers on the manufacturing overhead. Sixty-two worldwde
auto assembly plants were used. They showed that structural
variables have a signlficant impact on overhead while the
executional variables did not show any meaningful impact.
Conceptual framework used in a cost driver study varies
depending on the focus of the study. As described earlier, we
could use Cooper's framework for cost driver classification
(1990) or Miller and Vollmann's framewok (1985).Although both

8/3/2019 SJBv4n2_071
http://slidepdf.com/reader/full/sjbv4n2071 4/26
74 Seoul Journal of Busmess
studies tned to identify the various cost drivers hidden in the
previous studies, their classification methods are different
Shank and Govindarajan (1994) suggested another well-knowncost dnver classificahon, which contains two typical categories
such a s structural and executional cost drivers.
Based on these prevlous s tud~es , e can identify three levels of
cost drivers (Ahn (1998)). Level 1 drivers are structural cost
drivers which influence Level 2 cost drivers such a s volume and
complexity cost drivers. Level 3 cost drivers are activity cost
drivers which are supposedly affected by Level 2 cost drivers.
These Level 3 cost drivers, however, affects overhead cost. Aclear-cut rule does not exlst for classifying cost drivers into
certain categories. For example, product complexity can be
classified a s a struc tura l cost driver or a complexity-related
driver depending on the specific measures used. If complexlty is
measured at a very detailed component level, then it could be
classified a s a complexity (Level 2) driver. If the product
complexlty is measured a t a n aggregate level such a s a number
of product lines or product groups, however, then it could be
classified a s a structural cost driver.
Hays an d Clark (1985) at tribu te production complexity to
variety of technology, flow patterns, and production stages in
place a t the factory. Riley (1987) argued t ha t th e ex tent of
vertical integration, demand uncertainty, and work force policy
may influence production complexity. Tatikonda and Tahkonda
(1993) also recognized the hierarchy in the cost driver structure- he production complexlty of plants will cause activlties which
will in turn drive overheads.Foster and Gupta (1990) classified cost drivers into volume,
complexlty, and efficiency. As shown in Figure 1, Banker and
Potter (1994) recognized th e hierarchy in c ost drivers an d
categorized cost drivers into volume drivers, production
complexity drivers an d su pp or t activity drivers which a re
influenced by volume and produchon complexity drivers Note
th at act ivity is a basic uni t of analysis su ch a s prod uct
inspection activity and component assembly achvity. This paperused Banker and Potter's classificahon of cost dnvers.
This framework assumes a hierarchy in cost drivers As shown
m figure 1, production complexity is hypothesized to generate
various h d s of support achvlhes which, in turn, will increase

8/3/2019 SJBv4n2_071
http://slidepdf.com/reader/full/sjbv4n2071 5/26
Cost Dr ~v er sf Manufacturrng Overhead 75
u<---UPPORT_ - -
Figure 1. Cost Drivers of Overhead
manufacturing overhead. Volume may change manufacturing
overhead either directly or indirectly through support activibes
as represented by the dotted line.
3. Research Method
3.1. Data
In this study, we report on the results of a cross-sectional
analysis of auto-component plants where we can observe
considerable variation in operating practices. When we use a
time-senes analysis, we may be able to control for variation due
to production technology, cost function, and administrative
differences (Banker and Potter (1994)).But it may provlde very
little variation m producbon complexity and support activities.
In order to examine the impact of potenhal cost driver variables
on overhead, we need variation in mdependent variables. While
cross-sectional analysis allows us to have some variation m cost
dnver variables, we should accept the possibility of differences
in production technologies, cost relahonships and the number of
support and administrative activities among plants used m thestudy.
This s tudy used the da ta of 74 automobile component
manufacturing plants. Unlike previous studies that dealt with
multiple industri es (Banker, Potter, and Sch roeder (1993 ),

8/3/2019 SJBv4n2_071
http://slidepdf.com/reader/full/sjbv4n2071 6/26
76 Seoul Journal of Busrness
Banker and Potter (1994)) the samples used are confined to a
single mdustry. This might facilitate the control for cost behavior
differences among industries (Raffi and Swamidas (1987)).The first data collection attempt was made by sending the
questionnaires to automobile component manufacturing firms
listed in the directory of automobile component rnanufactunng
industry. Since the items in questionnaire asked for detailed
data, the response rate was extremely low. The second attempt
was to contact a major automobile assembly company and
collect data from supplier firms of that company. Response rate
was relatively high.Survey questionnaire items were similar to the ones used in
Banker and Potter (1994) although revisions were made to fit the
Korean environment.') Although sample firms used in the study
are supplier firms of one automobile assembly company, they
produce a w d e variety of products ranging from antennas to
transmission.
3.2. Measurementof Support Activities
As shown in Figure 1, while volume and production complexlty
are supposed to affect support activihes, support activities are
hypothesized to influence manufacturing overhead directly.
Therefore production complexlty may influence manufacturing
overhead indirectly by changing the level of support activlhes.
Miller and Vollmann (1985) categorized support activities mto
four classes of transactions from an operation management
viewpoint. These transactions include logistics transactions,
balancing transactions, quality transactions, and change
transactions. Similarly Schroeder's classificahon (1993) includes
the achvities related with the process flow design, purchasing
and mater ia ls contro l , process ba lancing , qual i ty and
engineering change. This paper followed the Schroeder's
approach.
Process balancing activities deal with the control and
1) For example, the rnanufactunng cost classificahon is direct matenal, direct
labor, and overhead in the U S In Korea, however. direct and indirect
matenal costs are not differenbated Therefore we specifically mentioned this
differentiation in classificabon and asked the respondents to classify cost
items Into direct materials, direct labor, and manufacturing overhead

8/3/2019 SJBv4n2_071
http://slidepdf.com/reader/full/sjbv4n2071 7/26
Cost Drivers of Manufacturrng Overhead 77
maintenance of production th rou gho ut the p lant . The
coordination of work orders, batches, labor, and capital require
planning and scheduling activities, which in turn demandpersonnel to deal with the bills of materials, production orders,
and equipment scheduling. Failure to balance processes results
m production congestion and shortages.
Process flow related activities are incurred in moving products
through the production process. Whenever products move to a
new work center, actlvlties to handle the material movement and
to process the products are required. Long process flows require
more activities associated wlth supervis ion. Process flowactivities are related to process balancing acbvities. Usually the
larger the area used for the production processes, the greater
the demand for activities for balancing, communicating, and
coordinating the produchon line.
Purchasing and materials control related activities concern
activities incurred for the order, receipt, movement, and
payment for materials. Examples include activities for suppller
identlficatlon, certification and inspection of incomlng un it s,
handling and Issuing materials into production. These actlvlties
requlre purchasing, recelvlng, stocking, a nd accounting
personnel, a s well a s space for processing documents, inspection
and storage
Quality related actlvities are Incurred to insure that goods are
produced to customer requirements and the standards of the
manufacturer. These actlvities include preventive procedures
l ike t ra in ing , process docum enta t ion , and des lgn for
producib~li ty.For instance, non-conforming Items requireactivibes for inspection, reworks, rejects, and scrap.
Change related act ivl t les are needed to accommodate
alterations in product or process design due to customer,
market, technology, or regulatory forces. Change related
actlvities include changes in engineering design, bil.1~ f
materials, material specifications and routings. These changes
Incur additional process balancing, process flow, purchasing,
and materials control activities. This represents one example ofinterachons among vanous activities.
Slnce the data for the above activities are not measured in a
desired fashlon, this paper adopted the proxy measures wlth
some modifications as In Banker and Pot ter (1994) . We

8/3/2019 SJBv4n2_071
http://slidepdf.com/reader/full/sjbv4n2071 8/26
78 Seoul Journal of Busrness
hypothesized th at a s work-in-process (WIP) increases, more
process balancing activities are required to insure smooth
producbon runs. More inventory requires more coordination ofwork orders, batches, and other resources. Just-In-Time (JIT),
however, may reduce the need for those activities. Therefore a
decline in WIP represents an improvement in inventory policies,
which will imply a reduction in process-balancing activities.
Although cost of WIP does not directly measure process
balancing activities, it may capture the required level of process
balancing activities.
Long and complex process flows may generate more handlingand communicating activities. Banker and Potter (1994) used
area per part (AREA), the total of production and warehouse/
storage area divided by number of different parts, to measure
the amount of movement required in the plant. Larger area per
part is assumed to require more flow related activlbes.
Purchasing and material control act ivi t ies deal with
purchasing, receiving, inspecting and storing materials. The
number of purchase orders for direct materials and parts and
the number of purchase requisitions from user departments
(PURCH) represent purchasing activities. We therefore used the
sum of the number of purchase orders and the sum of purchase
requisitions as a measure of purchasing and materials control
activities.
Data for quality-related activities are rarely kept in plants.
Four different quality related activities such a s preventive,
appraisal, internal failure and external failure related acbvities
are possible in plants. Because of limited data availability,
however, we used the number of monthly reworks (REWORK)as
a proxy for quality related activibes.
Due to the changes of customer de man ds, market and
technology, change related activities are required. These
activities include changes in material specifications, engineemg
design, schedules, routings, and standards. These activities
involve the work of manufacturing, industrial and quality
engineers along with a portion of the effort expended inpurchasing, matenals control, and data entry. These change
activities lead companies to incur additional overhead expense
(Miller and Vollmann (1985)). In th is paper, the number of
monthly engineering change order (ECO) is used to measure

8/3/2019 SJBv4n2_071
http://slidepdf.com/reader/full/sjbv4n2071 9/26
Cost Drzvers of Manufactur~ngOverhead 79
change related activities.
The above activities summarize the support activities a s
shown in Table 1. These activities are hypothesized to influenceoverhead expense directly whlle they are driven by volume and
structural complexity variables.
3.3. Measurement of Structural Complexity of Production
Structural complexlty of production can be represented by
several dimensions such a s demand uncertainty, production
scope and production scale, technology, work force policies, andproduct diversity (Banker and Potter (1994)).Breadth of product
lines and/or lack of focus is one aspect of structural complexity
in manufacturing. An increase m the number of product llnes
(NPRODLN) at a plant may lead to an expansion of demand for
activlhes of matenals handling, machine setups, super-vision,
scheduling, expediting and quality inspection. Plants m t h a
narrow or focused product mix are more likely to have simpler
operations and dedlcate their resources s uch a s equipment,
support systems, and personnel to focused tasks.
When new products are introduced at a plant, workers will
have difficulty adjusting to the production of new products. This
will increase the product volatility. In contrast, if the firm has
been producing the sam e pro duc ts for a long time, the
productlon process might have been already streamlined due to
the learnlng curve effect . Therefore the uncertainty and
complexlty of productlon environment seem to vary with the
portion of new products The porhon of new products introduced
Table 1. Volume and Supporting Activity Variables& Measurements
Vanables Measurement
Direct labor Dlrect labor costs (DLABOR)*
Process ba lanc~ng Work-In-Process (WIP)
Process flow Area per part (AREA)
Purchasing & matenal control Number of purchase orders andpurchase req u~ s~b on sPURCH)
Quality Number of reworks (REWORK)
Change Engmeenng change orders (ECO)
Words in parentheses are vanable names used in estimahon equation

8/3/2019 SJBv4n2_071
http://slidepdf.com/reader/full/sjbv4n2071 10/26
80 Seoul Journal of Busrness
within th e la st five yea rs B NEW)^) is used to capture the
uncertanty and complexlty of production environment
Production method influences the complexity of productionprocess . Cont in uous produc tion seems to have a s table
production process w t h less complexity than the batch-type of
production. If the percentage of batch production (BATCH) is
high, then products are made in small batches, it is hard to
dedicate resources to products and to enjoy economies of scale.
Congestion could increase production complexity. Especially
when plants operate close to capacity, congestion may occur
Congestion may make it more difficult to schedule, balance, andcoordinate resources in a timely fashion. Especially, quality level
wll decrease when plants are congested and are not running
smoothly (Roth and Albright (1994)). A degree of congestion
(CONGESTION) s measured a s the level of operation in excess of
85 of the capacity.
Banker and Potter (1994) identified age of plant (AGE) a s a n
additional explanatory vanable for production complexlty. Older
plants tend to add continuous but marginal improvements toexlsting technology resulting in less efficient and less flexible
production processes than newer plants wth a state-of-the-art
technology. Therefore, older plants will have difficulty in
producing and processing excellent quality products.
Produchon cycle hme (CYCLETIME) may influence production
complexity. The longer the production cycle time, the more
complex the forecasting, scheduling, material handling, and
other balancing activities are needed. JIT policies, TQM policies,
and teamwork procedures could streamline the production
processes that will reduce the production complexity.
Production scale is one example of st ru ct ura l complexity
variables which may have a n impact on supporting activities
(Shank and Govlndarajan (1992)) The net book value of plant
and equipment (NETBV) is used a s a measure of production
capacity. Operationalization of s truct-~ral omplexity variables
are summarized in Table 2.
2) Five-year penod is assumed to be long enough for learning effect s to be
matenallzed

8/3/2019 SJBv4n2_071
http://slidepdf.com/reader/full/sjbv4n2071 11/26
Cost Dnvers of Manufacturrng Overhead 81
Table 2. Structural Complexity Variables & Measurements
Vanables Measurements
Produchon Scope Number of produchon lines (NPRODLN)
Market Change Percentage of new products introduced
wthin the last 5 years (NEW)
Production Method Percentage of batch produchon (BATCH)
Congestion Operation in excess of 85% of capacity
(CONGESTION)
Age Plant's age (AGE)Length of production process Cycle hme (CYCLETIME)
Produchon scale Net book value of equipment (NETBV)
3.4. Measurement of Volume
Production volume or other volume-related variables have
been considered major variables influencing manufacturing
overhead. Prevlous cost driver studies provlded evldence on the
significant impact of volume-based drivers on overhead (Fosterand Gupta (1990). Banker, Potter and Schroeder, (1993), Banker
and Joh nsto n (1993)) .Volume-related drivers might have a
direct effect on overhead by increasing Indirect material and
indirect labor costs. Moreover volume-related variables may
change the level of support activities and hence the level of
overhead. For example, expansion of volume will require more
balancing activities. We might call th is a n indirect effect of
volume-related dnvers on overhead We used direct labor cost a s
a surrogate of volume-related acbvlties (DLABOR).
3.5. Measurement of Overhead
A dependen t varlable used in thls type of analysis IS plant
overhead a s measured by dollar terms or by physical unlts. Most
studies used total overhead (Banker et al. (1993)) while some
studies used lndivldual overhead items or physlcal measure of
overhead suc h a s indirect labor ho urs (Banker and John ston
(1993)) This study used both total manufacturing overhead
(OVHD) an d the num ber of indirect manufacturing personnel
(INDPER) a s dep end ent variables Note t ha t th e num ber of
indirect m anu factu r ing personn el (INDPER) is us ed a s a

8/3/2019 SJBv4n2_071
http://slidepdf.com/reader/full/sjbv4n2071 12/26
82 Seoul Journal of Busrness
surrogate for indirect labor hours
3.6. Cost Behavior Estimation Models
To estimate the effect of supporting activity variables and
direct labor activity on overhead, the following equations are
used.
OVHD = % + a lDLABOR (All
OVHD = Po + P I W P + LAREA + P3PURCH
+
P4REWORK+
&ECO (A21OVHD = yo + y, DLABOR + y 2 W P + y3AREA + y4PURCH
+ y5REWORK + y6EC0 (A31
INDPER = cq, + a,DLABOR (B1)
INDPER = Po + P l W P + &AREA + P3PURCH
+ P4REWORK + &ECO (B2)
INDPER = yo + DLABOR + yzWIP + yy4REA + y4PURCH
+ .).,REWORK+ ysECO 033)
Equations (Al) and (Bl ) estimate the explanatory power of
volume-related variable only while equations (A2) and (B2)
estimate the explanatory power of supporting activity variables.
Only volume-related variables and supporting activity variables
are combined together to estimate the overhead variation in
equations (A3) and (B3). By comparing R ~ ' S f (Al) and (A3) we
can test the marginal improvement in explanatory power of
supporting activity variables over the direct labor variable.
Similarly comparison of R ~ Sf 1-2 and 1 - 3 will show the
statistical significance of volume-related variables in explaining
the variabon of overhead
4. Description of Variables
The tables 3 to 5 describe the summary statistics of thevariables used in this study. Average of total manufacturing
costs is around 24.3 billion won with a median of 15.1 billion
won. A standard deviation is about 24.8 billion won which is
greater than the average. Cost structure is a major concern for

8/3/2019 SJBv4n2_071
http://slidepdf.com/reader/full/sjbv4n2071 13/26
Cost Drrvers of Manufacturing Overhead 83
Table 3. Descriptive Statistics of Cost Related Data (unit:million won)-- - - --
Mean Std Dev Skewness 1s t declle Median 9th declle
Manufactumg Costs (Won)
Duect Labor (%)
Direct Matenal (Oh)
Overhead (%)
OVHD (Won)
DLABOR (Won)
INDPER (Won)
Number of Employees
managers. Direct materials cost is the largest manufacturing
cos t e lement , 58% of the to ta l manufacturing cos t .
Manufactunng overhead is around 28% of the manufacturing
cost, whereas dlrect labor cost is about 15% of overhead. These
d at a exhibit the importance of overhead cost managem ent
compared to that of direct labor cost management. There is a
wide range of values for overhead percentage urlth the 1st decile
at 9% and the last decile a t 50%. This wide variation may be due
to the differences of production methods among the sample
plants.
Manufactumg overhead (OVHD)1s calculated by multiplying
total manufacturing expense by the overhead percentage. OVHD
has a mean of 6.6 billion won and a median of 3.8 billion won.
To be noted is that most of the variables in Table 3 Including
OVHD are skewed to the left. Skewness in OVHD is also found
in Foster and Gupta (1990) and Banker et al. (1993). Whlle thetotal number of employees has an average of 242, number of
lndlrect manufacturing personnel (INDPER) has a mean of 9 1
representing 38% of the total number of employees.
Table 4 summarizes the descriptive statishcs of activity related
and other relevant variables. Work in process inventory (WIP)
shows the smallest mean of 537 million won among inventory
items and a median of 213 million won. Material inventory has a
mean of 791 million won and a median of 419 million. Finishedgoods inventory has the largest mean of 1,029 million won and a
median of 366 million won. All of these inventory-related figures
show a left-ward skewness.
The av erage a re a per pa rt (AREA) is 37 m2 with a hug e

8/3/2019 SJBv4n2_071
http://slidepdf.com/reader/full/sjbv4n2071 14/26
84 Seoul Journal of Buslness
Table 4. Descriptive Statistics of Support Activity and Related
Variables
Mean Std Dev Skewness 1st decile Median 9thdecile
WIP 53685 82105 271 0 2125 1320
MATERIAL 79053 114173 301 95 419 1572
FG 1,028 4 1559 93 3 19 96 366 2781
AREA 36 86 136 68 6 52 0875 565 3891
MSPACE 2,331 9 3923 26 3 28 268 1300 5341
SSPACE 538.36 615.15 1 95 6 300 1471
PURCH 183 32 270 51 3 33 20 90 500
NSUPPLY 50 39 42 57 1 78 9 40 120PURORDER 152 01 252 44 377 5 67 5 360
PURC W M 206 327 55 2 95 18 80 525
REWORK 6.55 9 88 2 46 0 3 20
ECO 655 1198 397 1 2 20
Note. WIP, MATERIAL and FG in million won, AREA, MSPACE and
SSPACE in m2
standard deviabon of 137 m2 This vanable shows an extreme
variation. Average space used for manufactunng (MSPACE) 1s
2,331 m2 and the median is 1,300 m2 Storage and warehouse
space (SSPACE)1s about one fourth of manufacturing space.
Plants have about 50 suppliers (NSUPPLY) w t h the 1st decile
at 9 suppliers and the last decile at 120 suppliers. Purchasing
activities are represented by the numbers of purchase orders
(PURORDER) and purc hase requ is iti ons (PURCLAIM). The
number of monthly purchasing order shows an average of 152times with the medlan of 6 8 tlmes whlle PURCLAIM has a higher
mean of 206 and a medlan of 80.
Monthly average of reworks (REWORK)1s about 7 times w t h a
median of three hmes. It shows a very hlgh standard deviation of
25 tim es and a very large positlve value of skewn ess The
average number of engineenng change order (ECO) is around 7.
These figures show an extremely high skewness. Most firms
have few reworks and ECO. This may be due to the fact that alarge porbon of the sample firms supply most of their products
to one major au to assembler.
In add i t ion to t he ac t iv i ty and vo lume m easu res , t he
descriptive statistics for the structural production complexity

8/3/2019 SJBv4n2_071
http://slidepdf.com/reader/full/sjbv4n2071 15/26
Cost D rrvers of Manufacturing Overhead 85
Table 5. Descriptive Statistics of Structural Complexity Variables
Mean Std. Dev Skewness 1st decile Median 9th decile
NPRODLN 12 62 13 54 3 17 3 8 30
BATCH 34 82 33 90 0 75 0 23 5 100
NEW 68 89 28 68 -0 8 23 79 5 100
CYCLETIME 1 79 205 415 0 3 1 3
CONGESTION 1 94 2 30 2 70 0 0 7
AGE 15.46 8 56 0 63 4 15 24
NETBV 10,796 24 10,281 6 1 91 1,772 7,699 22,772
vanables are presented in Table 5. Average number of product
line (NPRODLN) shows a great variation with a mean of 12.6.
Half of the plants have more than 8 product lines. The medlan
for batch production (BATCH) suggests that about half of the
sample plants produce 23% of their au to components in small
ba tches . The f i rs t and the las t dec i le a re 0% and 100%
respectively, showing that some firms have continuous flow
production and others produce all of their products m small
batches
On average about 69% of their products are mtroduced urlthin
the last 5 years. A large percentage of newly introduced products
(NEW) indicate that plants must rearrange their production
processes qulte frequently. Cycle tlme (CYCLETIME) shows a n
average of 1.8 days and a standard deviation of 2 days The first
and the last decile are 0.3 days and 3 days respectively.
The average of capaclty utilization (CAPACITY) is about 86.9%
whlle the median 1s less than 85% Capaclty utilization vanable
is measu red following Banker and Potter (1994) where 85%
capacity utilization is used a s a threshold Specifically a zero
value is assigned if a plant is operatmg below 85% capacity and
positive values are assigned if capacity utillzatlon is in excess of
85%.
The median age (AGE) of the sample plants is about 15 years.
The first and the last decile are 4 and 24 years respectively. The
mean book value for property, plant, and equipment invested inthe plant (NETBV)is 10,796 milllon won whlle the median value
is 7,699 million won.
The descriptive statistics of the variables demonstrate that
there exlsts a huge vanahon in activlty and complexity vanables

8/3/2019 SJBv4n2_071
http://slidepdf.com/reader/full/sjbv4n2071 16/26
86 Seoul Journal of Busrness
in our sample plants. Since this is a cross-sectional study, this
variation among the sample plants will help investigate the
impact of support activity and structural production complexityvariables on overhead
Table 6 summarizes the results of simple Pearson correlation
both among supporting activity variables and among direct labor
and complexity variables. Panel A shows that WIP variable is
positively correlated with PURCH variable and REWORK variable
is correlated w th PURCH vanable. Panel B shows a very high
correlation between D M O R and NETBV variables. Some may
argue that two variables are alternahve measures for the samevariable , prod uction sca le. NETBV, however, re pr es en ts
production capacity while DLABOR variable represents actual
production activity. Therefore it is not surpnsing to observe a
Table 6. Panel A: Simple Pearson Correlation Among Activity
Variables
WIP AREA PURCH REWORK
WlP
AREA 0 153
PURCH 0 264** -0 067
REWORK 0 034 -0 005 0 255**
NECO 0 184 -0.034 -0 24 0.051
Table 6. Panel B: Simple Peareon Correlation Among Direct Labor and
Production Complexity Variables
NPRODLN
BATCH
CHANGE
CYCLE
CAPACITYAGE
NETBV
DLABOR
NPRODLN BATCH CHANGE CYCIE CAPACm AGE NETBV
Note *.p<O 0, *:p<O05;** p<O01

8/3/2019 SJBv4n2_071
http://slidepdf.com/reader/full/sjbv4n2071 17/26
Cost Dr~ve r s f Manufactur~ngOverhead 87
high correlation. We need caution in interpreting these two
vanables. A signlficant positive correlation a t p<0.05 level is also
observed between CAPACITY and NPRODLN and a negativecorrelation between CHANGE and CYCLE.
5. Regression Results
Support activity variables used in this study are work-in-
process (WIP), area per part (AREA), number of purchase orders
an d p ur ch ase requisi t ions (PURCH), nu m be r of reworks
(REWORK), number of engineering change order (ECO), an d
direct labor costs (DLABOR).To isolate the effect of each achmty
vanable on overhead, we need to control for the effect of other
ac t iv i ty var iables . Mul t ivar ia te regress ion ana lys i s is
recommended a s one of the most appropriate methods (Banker,
Potter an d Schroeder (1993)).
The regress ion re s u l t s examining the l ink be tween
manufacturing overhead and production activities are presented
in Table 7. values and Fvalues show that these equations are
signlficant. This implies that direct labor variable and the set of
supp orting activity variables are impo rtant cost drivers of
manufacturing overhead. Equations (Al)& (A3) show that direct
labor activity vanable (DLABOR) is still an important cost dnver
of manufactunng overhead. This result is consistent with the
traditional argument that volume-based driver is a n appropriate
basis for allocating overhead. Among the set of supporting
activities, WIP and PURCH are shown to have a significantpositive impact on overhead a s shown in equahon (A2) and (A3).
Although not significant, other actimty variables show a positive
coefficient as expected. The third regression used both volume
and supporting achvity variables a s independent variables whde
the first and the second regression equation used only volume
variables and supporting activity vanables respectively. The first
equation using only direct labor cost variables explains about
39% of th e overhead variation The second eq uati on withsupporting actimty variables a s independent variables explains
about 55% of the overhead vanation. To note is that condihon
numb er tes t (Green (1997)) did no t show multi-collinearity
problem.
8/3/2019 SJBv4n2_071
http://slidepdf.com/reader/full/sjbv4n2071 18/26
88 Seoul Journal ofBusrness
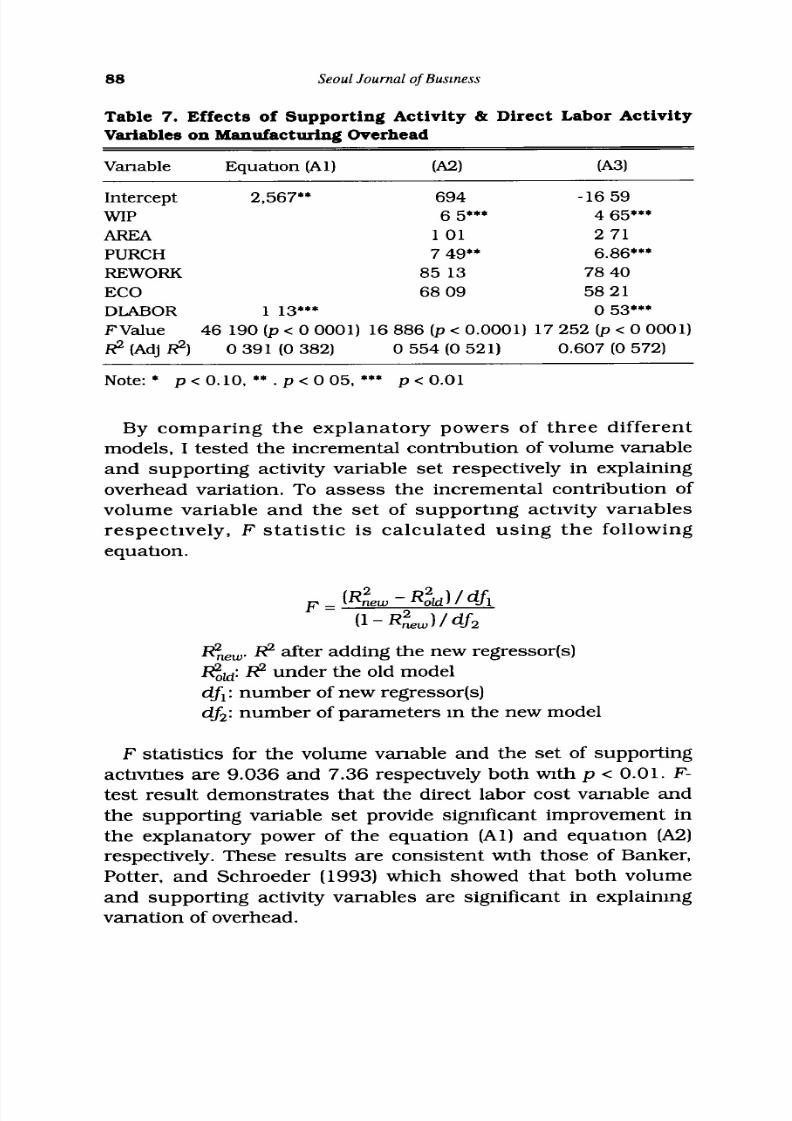
Table 7. Effects of Supporting Activity & Direct Labor Activity
Variables on Manufacturing Overhead
Vanable Equabon (Al) (A21 (A31
Intercept 2,567.' 694 -16 59
WIP 6 5*** 4 65***
AREA 1 01 2 71
PURCH 7 49** 6.86***
REWORK 85 13 78 40
ECO 68 09 58 21
DLABOR 1 13*** 0 53***
FValue 46 190 ( p <00001) 16 886 ( p <0.0001) 17 25 2 @ < 00001)$(Adj$) 0 3 9 1 (0 3 8 2 ) 0 554 (0 521) 0.607 (0 572)
Note: p < 0.10, ** .p < 0 05, *** p < 0.01
By comparing the explanatory powers of three different
models, I tested the incremental contnbution of volume vanable
and supporting activity variable set respectively in explaining
overhead variation. To assess the incremental contribution of
volume variable and the set of supporting activity variables
respectively, F statistic is calculated using the following
equahon.
I It$! after adding the new regressor(s)
e,: under the old model
dfl: number of new regressor(s)
df2: number of parameters m the new model
F statistics for the volume vanable and the set of supporting
actlvlhes are 9.036 and 7.36 respechvely both w t h p < 0.01. F-
test result demonstrates that the direct labor cost vanable and
the supporting variable set provide significant improvement in
the explanatory power of the equation (Al) and equatlon (A2)
respectively. These results are consistent m t h those of Banker,
Potter, and Schroeder (1993) which showed th at both volume
and supporting activity vanables are significant in explaining
vanation of overhead.

8/3/2019 SJBv4n2_071
http://slidepdf.com/reader/full/sjbv4n2071 19/26
Cost Drrvers of Manufacrurrng Overhead 89
Table 8. Effects of Supporting Activity and Direct Labor Activity
Variable on Indirect Manufacturing Personnel
VARIABLE EQUATION(B1) 032) 033)
INTERCEPT 46 79*** 36 76***
WIP 0 05***
AREA -0 05
PURCH 0.08***
REWORK 0 18
ECO 2 16***
DLABOR 0 01***
FValue 98051(p<O0001) 17118(p~O0001)d L ( A d j ~ ~ ) 05 77 (0 57 1) 0 557 (0 525)
Note * p < 0 10, ** p < 0 05, *** .p < 0.01
The second set of regression equations estimates the effect of
volume and support achvity vanables on the number of indirect
personnel a s shown in Table 8 Direct labor cost variable
explains about 58% of the overhead variation a s in regression
equation ( B l ) an d the se t of suppo rting activity variables
explains abou t 56% of the overhead variation Volume and
supporting achmty vanables altogether explain about 74% of the
vanation in the number of Indirect personnel.
A s w th the case of Table 7, direct labor vanable (DLABOR) is
found to be a significant explanatory variable of indirect
manufacturing personnel (INDPER). In addition to WIP and
PURCH, engineering change order achvity (ECO) variable has a
significant positwe coefficient As with the first set of regression
equation, I investigated the incremental contribution of the
direct labor cost variable and the set of supporting activity
vanables. F-statistics for volume and supporting activities are
43.7 and 9.78 respectively m th p < 0.01. The F-test result shows
that the set of supporhng achvity variables provldes significant
improvement in explaining the variation of indirect
manufacturing personnel in addition to the volume variable.
These results strongly demonstrate the usefulness of structuralproduction complexity variables in explaining overhead.
Condition num ber test (Green (1997)) did not show multi-
collineanty problem
The p-values of less than 0.0001 indicate that the regression

8/3/2019 SJBv4n2_071
http://slidepdf.com/reader/full/sjbv4n2071 20/26
90 Seoul Journal of Busrness
equations are highly significant. We can conclude that variation
in ma nufactu r ing overhead and t he nu mbe r of indirect
manufacturing personnel is explained by the volume andproduction complexity variable. This result is true in both cases
of dependent variables. I? value for the equation (B3) is 0.74,
which is higher than R~ of 0.60 for the equation (A3). This
ind~ca tes hat these activity vanables are related more with the
number of indirect personnel than the overhead costs.
Volume is measured by direct labor costs (DLABOR). Direct
labor cost has a coefficient of 0.53 wt h a significance of 0.0037.
This demonstrates the significance of volume effects after
controlling for the effect of activity variables. Volume variable is
a major determinant of manufacturing overhead and the number
of indirect manufactunng personnel. This result is consistent
w th previous studies (Foster and Gupta (1993), Banker et al.
(1993)).
Supporhng activlty variables seem to be significantly related
with overhead. WIP (work-in-process) variable representing
process balancing activities has a coefficient of 4 .65 a t a
significance level of 0.000 1. Manufacturing overhead costs seemto Increase with the level of work-in-process inventory. This is
consistent with the Just-In-Time philosophy. We may conclude
that the lower the WIP inventory level, the lower the overhead
resource consumption.
PURCH is a measure of purchasing and material handling
related activity. This vanable has a coefficient of 6.86 and a
significance level of 0.0 13. A positive coefficient indicates that
overhead increase w th the number of purchasing and materialshandling activity. Although other activity variables such as
AREA, REWORK, and ECO are not stahstically significant, they
have positive values. This Indicates that these activities tend to
lead to higher overhead costs. The relationship of these variables
with overhead, however, is not a s strong a s that of WIP, PURCH,
and DLABOR.
The regression result implies that the five activlbes of process
balancing, process flow, purchasing and material handling,
quality inspection and change combined with direct labor cost
can explain about 61% of the vanation in overhead. All of five
var iab les have positive coefficients a s expected with two
variables having a statist ical s ignificance From a cost

8/3/2019 SJBv4n2_071
http://slidepdf.com/reader/full/sjbv4n2071 21/26
Cost Drrvers of Manufacturing Overhead 91
management perspective, we can argue that the efficient control
of these five activlties mll reduce manufactunng overhead.
Similar to the case of the first set of regression equations,WIP
has a positive coefficient of 0.015 with a statistical significance
of 0.05. The level of WIP see ms to increase t he num ber of
indirect manufacturing personnel. PURCH variable also has a
positive coefficient with a high statistical significance. This again
implies that purchase and matenals handling activity will lead to
a n increase in the number of Indirect personnel. In addition to
WIP and PURCH, number of engineenng change order (ECO)
variable has a statistically significant positive coefficient. ECO
vanable is included as a n addibonal explanatory variable.
Direct labor cos t (DLABOR), a volume mea su re , is again
considered important in this model after controlling for the effect
of activity var iables. It h a s a positive coefficient with t h e
stat istical significance of 0.0001. We may conclude that the
volume variable has a positive effect on manufactunng overhead
and number of indirect personnel. Again this is consistent with
the previous results of the cost driver studies.
6. Results Relating Production Complexity to Activities
Prevlous cost driver studies (Banker et al. (1995), Foster and
Gup ta (1990 ), Banker and Jo hn sto n (1993)) focused on th e
direct effect of various cost drivers on manufacturing overhead.
This study, however, hypothesized a hierarchy of cost drivers
and attempted to analyze the effect of structural production
complexity dnvers on supporhng activlty drivers which m11 in
turn have a direct impact on manufacturing overhead. Here, we
hypothesized that structural production complexity dnvers will
have an indirect effect on manufacturing overhead through
supporting activity vanables mentioned above.
Table 9 sum marize s th e effects of st ruc tur al production
complexity vanables on supporting actimty vanables. Only two
regression equ ations with dep end ent variables of WIP an dPURCH show statistical significance As shown earlier these two
variables were found to be significant m ex plming the variation
of overhead. Since these two variables a re major determinants of
overhead, we may then conclude that structural complexity
8/3/2019 SJBv4n2_071
http://slidepdf.com/reader/full/sjbv4n2071 22/26
92 Seoul Journal of Busmess
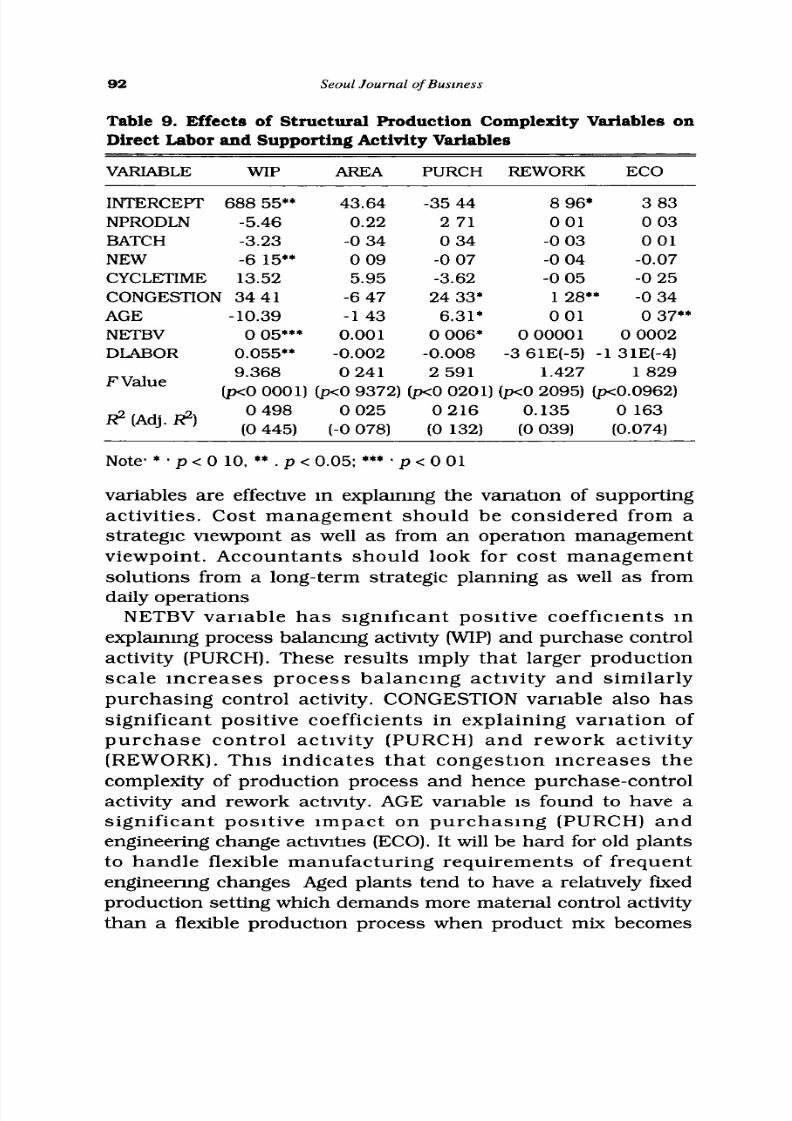
Table 9. Effects of Structural Production Complexity Variables on
Direct Labor and Supporting Activity Variables
VARIABLE WIP AREA PURCH REWORK ECO
INTERCEPT 688 55** 43.64 -35 44 8 96' 3 83
NPRODLN -5.46 0.22 2 71 0 01 0 03
BATCH -3.23 -0 34 0 34 -0 03 0 01
NEW -6 15** 0 09 -0 07 -0 04 -0.07
CYCLETIME 13.52 5.95 -3.62 -0 05 -0 25
CONGESTION 34 41 -6 47 24 33. 1 28** -0 34
AGE -10.39 -1 43 6.31. 0 01 0 37**
NETBV 0 05"' 0.001 0 006' 0 00001 0 0002DLABOR 0.055** -0.002 -0.008 -3 61E(-5) -1 31E(-4)
9.368 0 241 2 591 1.427 1 829FValue
( p 0 0001) (p<O9372) ( p c O 0201) ( p O 2095) w0 .0962)
0 498 0 025 0 216 0.135 0 163* Ad" (0 445) (-0 078) (0 132) (0 039) (0.074)
Note. * p < 0 10, * * .p < 0.05; *** .p < 0 01
variables are effective in e x p l a m g the vanation of supportingactivities. Cost man agem ent sh ou ld be considered from a
strategic vlewpoint a s well a s from a n operation management
viewpoint. Accountants should look for cost management
solutions from a long-term strategic planning a s well a s from
daily operations
NETBV variable has significant positive coefficients in
explaning process balancing activlty (WIP) and purchase control
activity (PURCH). These resu lts imply th at larger productionscale increase s p rocess balancing activi ty and s imilarly
purchasing control activity. CONGESTION variable also has
significant positive coefficients in explaining variation of
pu rc ha se contr ol act ivi ty (PURCH) an d rework act ivi ty
(REWORK). This ind icat es t h a t congestion in cre ases th e
complexity of production process and hence purchase-control
activity and rework activity. AGE variable is found to have a
signif icant posi tive imp act on pu rch asi ng (PURCH) an d
engineering change achvlhes (ECO). It will be hard for old plants
to handle flexible manufacturing requirements of frequent
engineenng changes Aged plants tend to have a relahvely fixed
production setting which demands more matenal control activity
than a flexible production process when product mix becomes

8/3/2019 SJBv4n2_071
http://slidepdf.com/reader/full/sjbv4n2071 23/26
Cost Dnvers of Manufacturing Overh ead 93
diverse.
7.Conclusion
Traditional coshng assumes that only volume is a sigmficant
driver of overhead. ABC sup po rte rs, however, as se rt th a t
complexity variables are significant drivers of overhead. This
paper tested whether volume and complexity-related drivers are
significant in explaining vanahon of overhead.
This paper classified cost drivers into two different levels. Thefirst level drivers are classified into volume-related and support
activity drivers; the lat ter of which are derived from an
operations management viewpoint. The higher level cost drivers
are structural dnvers that are assumed to influence volume-
related and support activities.
Cost structure analysis shows that manufacturing overhead
percentage 1s turlce a s big a s direct labor cost percentage, which
implies the importance of overhead cost management. Empirical
results show th at bo th volume and sup po rt activit ies a re
positively associated urlth overhead. Each of volume and support
activity vanables showed significant marginal contnbuhon to the
expla nat ion of overhead var iat ion. This res ul t su pp or ts
assumptions of both traditional and ABC systems suggesting
th at both volume and complexity-related support activity drivers
are useful for cost allocation and cost management purposes.
Among the support activities, especially process balancing
activlties, purchasing control activlties, and change activities
showed significant positive effects on manufacturing overhead.
The higher level of tests showed that selected structural
complexity variables explain the variation of support activity
dnvers, especially process balancing, purchasing control and
change activities. This result partly supports the notion that
stru ctu ral production com plex~ty r ivers have signif icant
influence on the level of support activities. We may conclude that
cost managem ent s ho uld be considered from a strateg ic
viewpoint a s well a s from an operation management viewpoint.
Accountants should look for cost management solutions from a
long-term strategic planning as well a s from daly operahons.
Note t ha t t he above support activities are selected a s the

8/3/2019 SJBv4n2_071
http://slidepdf.com/reader/full/sjbv4n2071 24/26
94 Seoul Journal of Busmess
s i g n i fi c a n t v a r i a b l e s a f f e c ti n g m a n u f a c t u r i n g o v e r h e a d
resource s . We could the n infer th at s t ru ctu ral product ion
complexity variables changes overhead resource consumptionindirectly th rou gh t he above su pp or t activities. We could not
find, however, any meaningful relationship between structural
production complexity, and process flow activities and quality
related activities.
This s tud y h a s several limitat ions. Possible var iat ion in
overhead measurements among 74 plants might have caused
some noise in coefficient estimation. By limiting the samples to a
single industry, we were able to control industry effects. Singleind ustr y res ul ts , however, may n ot be general izable to al l
industries. Variable measurements for the supporting activity
variables are subject to cr i t icism especially when data are
collected directly from respondents. Moreover some portions of
the manufac turing overhead ar e facility-sustaining expenses
whose cost drivers may not be well identified.
References
Ahn, T.. 1998, A Critical Review of Cost Driver S tud~es Future
Research Suggeshons. Korean Busmess Review (forthcoming).
Anderson, S , 1995, Measunng the Impact of Product MIXHeterogeneity
on Manufacturing Overhead Cost, The Accountmg Review 70, 363-
387
Banker, R , and H Johnston, 1993, An Emplncal Study of Cost Dnvers
In the U S. Adme Industry, The Accounting Revtew 68, 576-601Banker, R., A., Ou, and G Potter, 1996, Structural Cost Drivers,
Product Diversity, and Economies of Scope. An Emplncal Study of
U S. Banlung Industry, Worlung Paper.
Banker, R , and G. Potter, 1994, Manufactunng Overhead: A Study of
Factors Affecting Manufacturing Overhead Costs, Unpublished
Worlung Paper.
Banker, R., G. Potter, and G. Shroeder, 1995. An Empmcal Analysis of
Manufacturing Overhead Cost Drivers. Journal of Accountmg and
Economics 19, 115-134.Brimson, J , 199 1, Acttv~tyAccountlng: An Act~v~ty-Basedost~ng
Approach (John Wiley and Sons, New York)
Cooper, R , an d R S Kaplan, 1 987, How Cost Accounting
Systemahcally Distorts Product Costs, in Brulls and Kaplan, eds.:
Account~ng nd Management: Reld Study Perspectwes (Harvard

8/3/2019 SJBv4n2_071
http://slidepdf.com/reader/full/sjbv4n2071 25/26
Cost Drrvers of Manufacturing Overhead 95
Business School Press, Boston. MA)
Cooper, R . 1990, Cost Classlflcation m Unlt-Based and Achvity-Based
Manufactunng Costs Systems, Journal of Cost Management, 4-14.Cooper, R , and R S. Kaplan, 1991, The Deslgn of Cost Management
Systems (Prenhce-Hall, New England Cliffs).
Datar, S , S. Kekre, T. Mukhopadyay, and K. Srinlvasan, 1993,
Simultaneous Eshmatlon of Cost Dnvers, The Accounting Rev~ew
68, 602-614
Dopuch , N , 199 3, A Perspective on Cost D rivers, Jou rn al of
Management Accountmg Research
Foster, G , and M. Gupta, 1990, Manufactunng Overhead Cost Dnver
Analysis, Journal of Account~ng nd Economtcs 12, 309-337Green, W H., 1997, Econometric Analysts (Prenhce-Hall, New Jersey).
Ittner, C , and J P MacDuffie, 1995, E x p lm n g Plant Level Differences
In Manufacturing Overhead. S tru ctu ral and Executional Cost
Drlvers In the World Auto Industry. Production and Operatton
Management 4(4), 293-3 14
Kaplan, R. S.. 1986, The Role of Ernpincal Research in Management
Accounhng, Accounttng, Organuatton, and Soctety 11, 429-452
Kaplan , R. S , 199 3, Research Oppor tuni t ies i n Management
Accountmg, Journal of Management Accounttng Research 5, 1 14Kaplan, R , and T. Johnson, 1987, Relevance Lost-The Rlse and Fall of
Management Accountrng (Harvard Business School Press, Boston,
MA)
MacDuffie, J P., K. Se thu ram an, and M L. Fisher, 1996 , Product
Varlety and Manufacturlng Performance. Evidence from the
International Automotive Assembly Plant Study, Management
Sctence 42, 350-369
Miller, J G , and T E Vollmann, 1985, The Hidden Factory, Haruard
Busmess Revtew 6 3 (September-October), 142-150Noreen. E , and N Solderstrom, 1994. Are Overhead Costs Strictly
Propo rtional to Actlvlty? Evidence from Hosp ltal Service
Departments, Journal of Accountrng and Econorntcs 17, 255-278
Noreen, E , and N Solderstrom, 1997, Cost Pool Aggregation an d
Costmg Errors Evldence from hospitals, Worlung Paper presented
at HKUST Summer Symposium, Hong-Kong
Pla t t , D , 19 96 , Produ ction Method an d th e Associat ion of
Manufactunng Overhead costs and Achvitles, Worlung Paper
Raffi. F , an d P M. Swa mida s. 19 87 , Towards a Theory ofMa nuf actu ring Overhead Cost Behavior A Conce ptual and
Empincal Analysis, Journal of Operatton Management 7, 121 137.
Rley, D W.. 1987, Competitive Cost-Based Investment Strategies for
Industrial Companies, Manufacturtng Issues (Booz-Allen &
Harnllton)

8/3/2019 SJBv4n2_071
http://slidepdf.com/reader/full/sjbv4n2071 26/26
96 Seoul Journal of Business
Roth, H , and T Albright, 1994, What are the Costs of Variability?
Management Accountuuj (June) . 5 1-55
Shank, J .K
,
and V Govmdarajan, 1992, Strategic Cost Managementand the Value Chain. Journal of Cost Management (Winter),5-21
Shie lds, M., 1997, Research in Management Accounting by North
Americans in th e 199 0's, Jo ur na l of M anagement Accou nt~ng
Research 9, 3-62.
Schroeder, R., 1993. Operattons Management: D e c ~ ~ o nak~ngm the
Operattons Functton, 4th ed (McGraw-Hill)
Tatikonda, L , and R Tahkonda, 1993, Overhead Cost Contan me nt,
The Internal Aud~torFebruary), 5 1-55
Yin, R K ,
1989, Case Study Research: D es ~g n nd Methods (Sage,London, England)