sj-5112 1011 3a sight distance
TRANSCRIPT
8/7/2019 SJ-5112 1011 3A Sight Distance
http://slidepdf.com/reader/full/sj-5112-1011-3a-sight-distance 1/35
SJ-5112 Perancangan Geometrik Jalan
Element of Design Sony Sulaksono Wibowo, Ph.D

8/7/2019 SJ-5112 1011 3A Sight Distance
http://slidepdf.com/reader/full/sj-5112-1011-3a-sight-distance 2/35
Element of Design
o Sight Distanceo Horizontal Alignment
o
Vertical Alignmento Cross Section

8/7/2019 SJ-5112 1011 3A Sight Distance
http://slidepdf.com/reader/full/sj-5112-1011-3a-sight-distance 3/35

8/7/2019 SJ-5112 1011 3A Sight Distance
http://slidepdf.com/reader/full/sj-5112-1011-3a-sight-distance 4/35
Sight Distance
o
The length of the roadway a driver can see ahead at anyparticular time
o The ability of a driver to see ahead is crucial in the safe andefficient operation of a vehicle
o Sufficient sight distance must be provided at any point in thehighway to allow drivers of all skill levels traveling at designspeed to stop or maneuver around obstacles
o
Measurements of sight distance: Stopping Sight Distance (SSD)
Decision Sight Distance (DSD)
Passing Sight Distance (PSD)

8/7/2019 SJ-5112 1011 3A Sight Distance
http://slidepdf.com/reader/full/sj-5112-1011-3a-sight-distance 5/35
Stopping SightDistance
Sight Distance
Decision SightDistance
Passing Sight Distance
Note: A driver’s ability to see ahead is of the utmostimportance in the safe and efficient operation of a vehicle on
a highway

8/7/2019 SJ-5112 1011 3A Sight Distance
http://slidepdf.com/reader/full/sj-5112-1011-3a-sight-distance 6/35

8/7/2019 SJ-5112 1011 3A Sight Distance
http://slidepdf.com/reader/full/sj-5112-1011-3a-sight-distance 7/35
Sight Distance
o Designer needs to consider a range of ability of drivers
Age – varies as you get older
Differences in sight, hearing and others
o Designer needs to consider different vehicles:
Compact car vs. large trucks or buses
Acceleration
Braking capabilities
Height of driver’s eye from ground
Ability to climb grades
Tire condition

8/7/2019 SJ-5112 1011 3A Sight Distance
http://slidepdf.com/reader/full/sj-5112-1011-3a-sight-distance 8/35
Sight Distance
o The criteria used in sight distance include
Perception reaction time:
Perception of object on roadway
Identification of object Decision
Reaction/volition
Various studies on perception reaction time indicate that itvaries from 1.26 sec to 3 seconds depending on driver and object
Most agencies use 2.5 seconds (recommended by AASTHO) formost highway conditions
Longer times are required for more complex decisions

8/7/2019 SJ-5112 1011 3A Sight Distance
http://slidepdf.com/reader/full/sj-5112-1011-3a-sight-distance 9/35
Stopping Sight Distance

8/7/2019 SJ-5112 1011 3A Sight Distance
http://slidepdf.com/reader/full/sj-5112-1011-3a-sight-distance 10/35
Stopping Sight Distance (SSD)
o Distance ahead of the driver in which the driver can bring the vehicle to astop after seeing an object in the vehicle’s path without hitting the object
o Perception reaction distance (PRD):
distance traveled during the perception reaction time process
o
Braking distance (BD): distance to stop a vehicle once the brakes are applied
o Assumed Height:
the driver’s eye: 1,080 mm (3.5 ft)
the object to be seen: 600 mm (2.0 ft)
SSD = perception reaction distance + braking distance

8/7/2019 SJ-5112 1011 3A Sight Distance
http://slidepdf.com/reader/full/sj-5112-1011-3a-sight-distance 11/35
Perception Reaction Distance
o
Studies: Johansson and Rumar (1971), “Drivers’ Break Reaction Times”,
Journal of Human Factors:
321 Drivers Median reaction time: 0.66 sec.
90th less than 1.5 sec.
MIT (1935), Report of Massachusetts Highway Accident:
Average: 0.64 sec. 95th less than 1.0 sec.
Normann (1953), “Braking Distances of Vehicles from HighSpeeds”, Proceedings Highway Research Board:
Brake reaction time: 0.4 to 1.7 sec.
those studieswere carried outat the simpleroadway
conditionfor unexpected
event the timecould increaseby 1 sec.

8/7/2019 SJ-5112 1011 3A Sight Distance
http://slidepdf.com/reader/full/sj-5112-1011-3a-sight-distance 12/35
Perception Reaction Distance
o Studies: Fambro, Fitzpatrick, and Koppa (1997), “Determination of
Stopping Sight Distances. NCHRP Report 400:
Minimum brake reaction times should be at least 1.64 sec.
It was found that some drivers took over 3.5 sec.
90th less than 2.5 sec.
AASHTO (2001):
recommended to use 2.5 sec.
normal condition and unexpected event

8/7/2019 SJ-5112 1011 3A Sight Distance
http://slidepdf.com/reader/full/sj-5112-1011-3a-sight-distance 13/35
Braking Distance
o Studies: Fambro, Fitzpatrick, and Koppa (1997), “Determination of
Stopping Sight Distances. NCHRP Report 400:
Most drivers decelerate at a rate greater than 4.5 m/sec2
Approximately 90% of all drivers decelerate at rates greater than3.4 m/sec2
AASHTO (2001):
Most vehicle braking systems and the tire-pavement friction levelsof most roadways are capable of providing a deceleration of at
least 3.4 m/sec2
8/7/2019 SJ-5112 1011 3A Sight Distance
http://slidepdf.com/reader/full/sj-5112-1011-3a-sight-distance 14/35
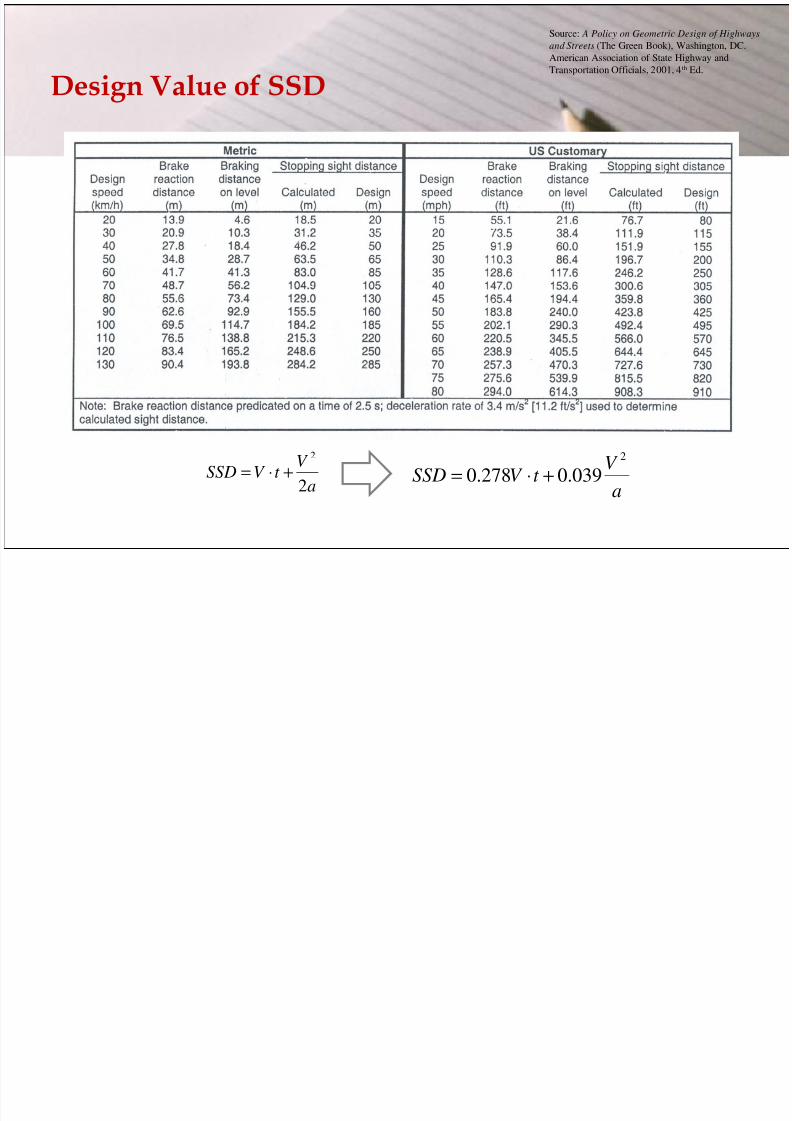
Design Value of SSD
a
V t V SSD
2
2
+⋅=
a
V t V SSD
2
039.0278.0 +⋅=
Source: A Policy on Geometric Design of Highways
and Streets (The Green Book), Washington, DC.
American Association of State Highway and
Transportation Officials, 2001, 4th Ed.
Source: A Policy on Geometric Design of Highways

8/7/2019 SJ-5112 1011 3A Sight Distance
http://slidepdf.com/reader/full/sj-5112-1011-3a-sight-distance 15/35
Effect of Grade on Stopping
±
=
Ga
V SSDG
81.9
254
2
G is the percent ofgrade divided by 100
Source: A Policy on Geometric Design of Highways
and Streets (The Green Book), Washington, DC.
American Association of State Highway and
Transportation Officials, 2001, 4th Ed.

8/7/2019 SJ-5112 1011 3A Sight Distance
http://slidepdf.com/reader/full/sj-5112-1011-3a-sight-distance 16/35
8/7/2019 SJ-5112 1011 3A Sight Distance
http://slidepdf.com/reader/full/sj-5112-1011-3a-sight-distance 17/35
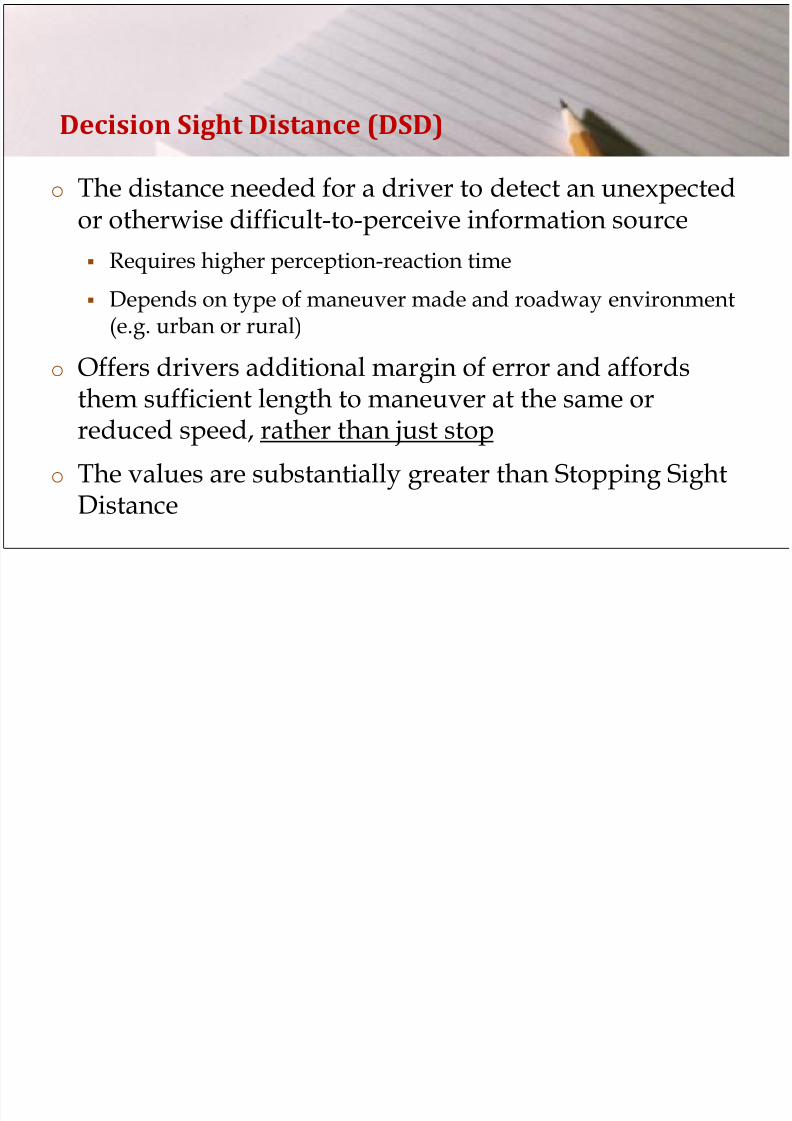
Decision Sight Distance (DSD)
o
The distance needed for a driver to detect an unexpectedor otherwise difficult-to-perceive information source
Requires higher perception-reaction time
Depends on type of maneuver made and roadway environment(e.g. urban or rural)
o Offers drivers additional margin of error and affords
them sufficient length to maneuver at the same orreduced speed, rather than just stop
o The values are substantially greater than Stopping SightDistance
Source: A Policy on Geometric Design of Highways

8/7/2019 SJ-5112 1011 3A Sight Distance
http://slidepdf.com/reader/full/sj-5112-1011-3a-sight-distance 18/35
Decision Sight Distance
and Streets (The Green Book), Washington, DC.
American Association of State Highway and
Transportation Officials, 2001, 4th Ed.
8/7/2019 SJ-5112 1011 3A Sight Distance
http://slidepdf.com/reader/full/sj-5112-1011-3a-sight-distance 19/35
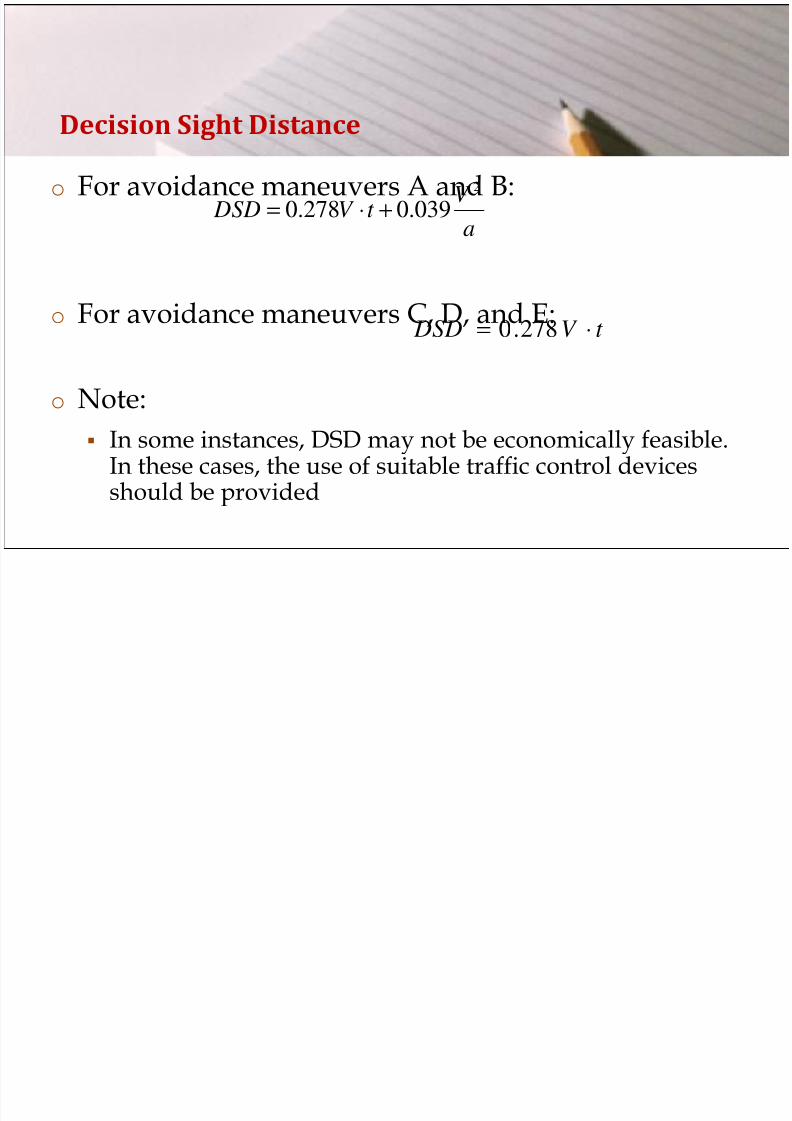
Decision Sight Distance
o
For avoidance maneuvers A and B:
o For avoidance maneuvers C, D, and E:
o Note: In some instances, DSD may not be economically feasible.
In these cases, the use of suitable traffic control devices
should be provided
aV t V DSD
2
039.0278.0 +⋅=
t V DSD ⋅= 278.0

8/7/2019 SJ-5112 1011 3A Sight Distance
http://slidepdf.com/reader/full/sj-5112-1011-3a-sight-distance 20/35
Passing Sight Distancefor two-lane highways

8/7/2019 SJ-5112 1011 3A Sight Distance
http://slidepdf.com/reader/full/sj-5112-1011-3a-sight-distance 21/35
Passing Sight Distance
o
Important assumptions: The overtaken vehicle travels at uniform speed
The passing vehicle has reduced speed and trails the
overtaken vehicle as it enters a passing section
The passing vehicle accelerates during the maneuver andits average speed is 15 kph higher than the overtaken
vehicle
When the passing vehicle returns to its lane, there issuitable clearance length between it and the oncomingvehicle in the other lane

8/7/2019 SJ-5112 1011 3A Sight Distance
http://slidepdf.com/reader/full/sj-5112-1011-3a-sight-distance 22/35
Passing Sight Distance – left side
right

8/7/2019 SJ-5112 1011 3A Sight Distance
http://slidepdf.com/reader/full/sj-5112-1011-3a-sight-distance 23/35
Passing Sight Distance
PSD = d1 + d2 + d3 + d4
d1 = distance traveled during P/R time to point where vehiclejust enters the left lane
wheret1 = time for initial maneuver (sec)
v = average speed of passing vehicle (kph)a = acceleration (kph/s)m = difference between speeds of passing and passedvehicle (kph)
+−=
2
278.0 111
at mvt d
8/7/2019 SJ-5112 1011 3A Sight Distance
http://slidepdf.com/reader/full/sj-5112-1011-3a-sight-distance 24/35
Passing Sight Distance
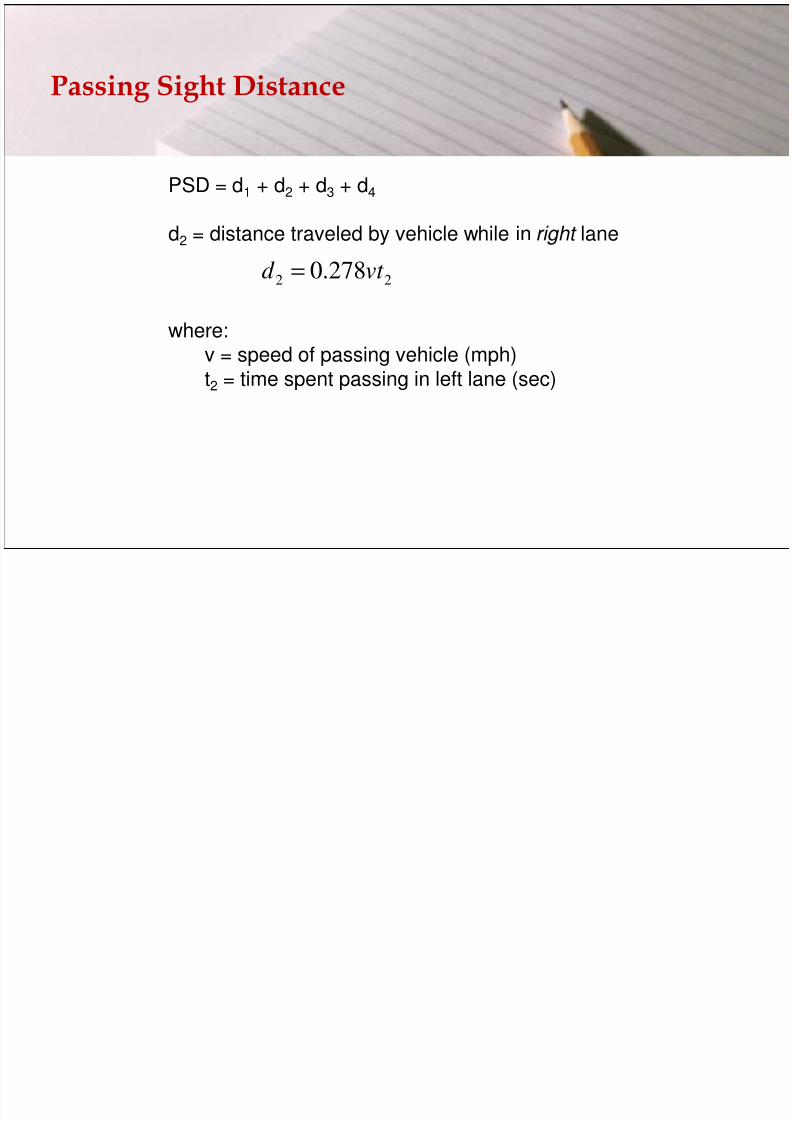
PSD = d1 + d2 + d3 + d4
d2 = distance traveled by vehicle while in right lane
where:v = speed of passing vehicle (mph)t2 = time spent passing in left lane (sec)
22 278.0 vt d =

8/7/2019 SJ-5112 1011 3A Sight Distance
http://slidepdf.com/reader/full/sj-5112-1011-3a-sight-distance 25/35
Passing Sight Distance
PSD = d1 + d2 + d3 + d4
d3 = the clearance distance that varies from 30 to 75 m
d4 = distance traveled by opposing vehicle duringpassing maneuver
d4 usually taken as 2/3 d2
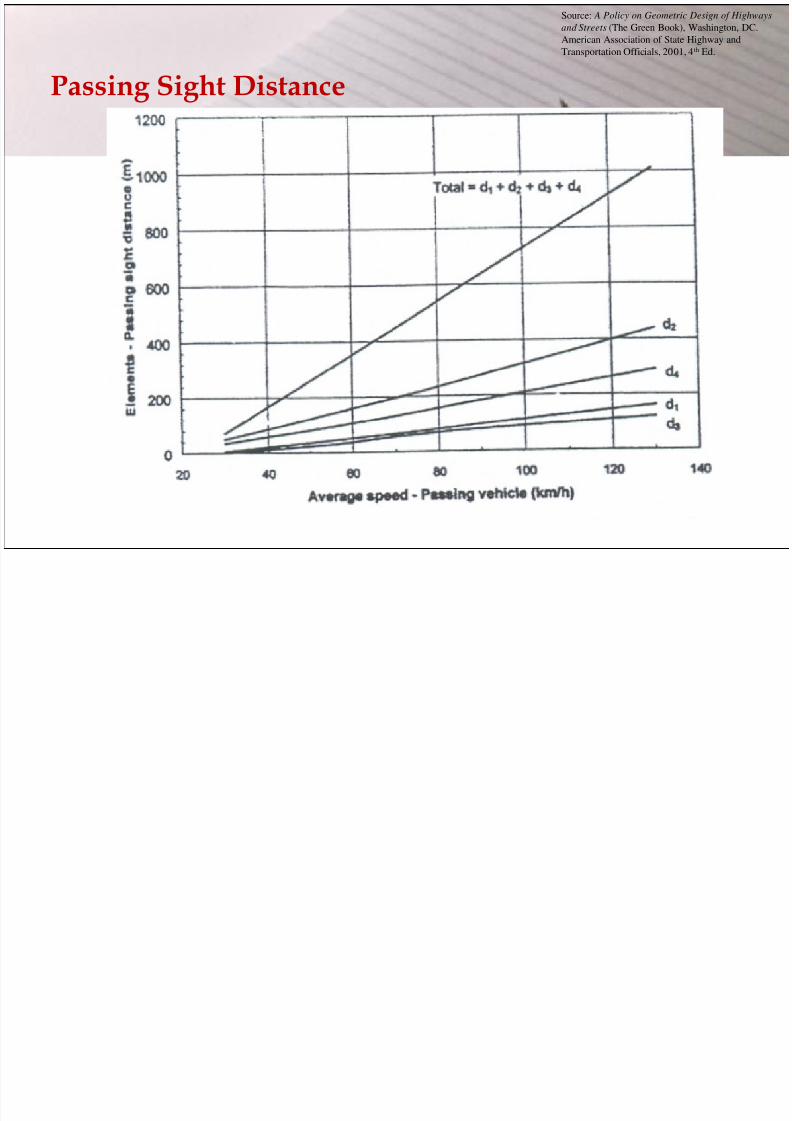
Source: A Policy on Geometric Design of Highways
and Streets (The Green Book), Washington, DC.

8/7/2019 SJ-5112 1011 3A Sight Distance
http://slidepdf.com/reader/full/sj-5112-1011-3a-sight-distance 26/35
Passing Sight Distance
American Association of State Highway and
Transportation Officials, 2001, 4th Ed.
Source: A Policy on Geometric Design of Highways
and Streets (The Green Book), Washington, DC.
8/7/2019 SJ-5112 1011 3A Sight Distance
http://slidepdf.com/reader/full/sj-5112-1011-3a-sight-distance 27/35
Passing Sight Distance
American Association of State Highway and
Transportation Officials, 2001, 4th Ed.
Source: A Policy on Geometric Design of Highways
and Streets (The Green Book), Washington, DC.
A i A i i f S Hi h d

8/7/2019 SJ-5112 1011 3A Sight Distance
http://slidepdf.com/reader/full/sj-5112-1011-3a-sight-distance 28/35
Passing Sight Distance
American Association of State Highway and
Transportation Officials, 2001, 4th Ed.
from the previous slide

8/7/2019 SJ-5112 1011 3A Sight Distance
http://slidepdf.com/reader/full/sj-5112-1011-3a-sight-distance 29/35

8/7/2019 SJ-5112 1011 3A Sight Distance
http://slidepdf.com/reader/full/sj-5112-1011-3a-sight-distance 30/35
Passing Sight Distance (notes)
o Considering to provide passing sight distance along roadway
o Designers try to avoid long stretches with no passingopportunities as it leads to driver frustration
o A significant number of drivers may attempt to pass andattempt an unsafe maneuver
o Consider passing truck climbing lanes
o Need to consider traffic volumes
o Long trucks require additional time

8/7/2019 SJ-5112 1011 3A Sight Distance
http://slidepdf.com/reader/full/sj-5112-1011-3a-sight-distance 31/35

8/7/2019 SJ-5112 1011 3A Sight Distance
http://slidepdf.com/reader/full/sj-5112-1011-3a-sight-distance 32/35
Measuring Sight Distance

8/7/2019 SJ-5112 1011 3A Sight Distance
http://slidepdf.com/reader/full/sj-5112-1011-3a-sight-distance 33/35
Driver Eye Height
Passenger Car: 1,080 mmLarge Trucks: 1,800 mm to 2,400 mm 2,330 mm
SD to Object
1,080 mm
Object
600 mm
Object
Criteria for Measuring Sight Distance

8/7/2019 SJ-5112 1011 3A Sight Distance
http://slidepdf.com/reader/full/sj-5112-1011-3a-sight-distance 34/35
Measuring Sight Distance

8/7/2019 SJ-5112 1011 3A Sight Distance
http://slidepdf.com/reader/full/sj-5112-1011-3a-sight-distance 35/35