size-resolved source apportionment of ambient particles by positive
TRANSCRIPT

Atmos. Chem. Phys., 6, 211–223, 2006www.atmos-chem-phys.org/acp/6/211/SRef-ID: 1680-7324/acp/2006-6-211European Geosciences Union
AtmosphericChemistry
and Physics
Size-resolved source apportionment of ambient particles by positivematrix factorization at Gosan background site in East Asia
J. S. Han1, K. J. Moon1, S. J. Lee1, Y. J. Kim 2, S. Y. Ryu2, S. S. Cliff3, and S. M. Yi4
1Department of Air Quality Research, National Institute of Environmental Research, Environmental Research Complex,Kyeongseo-dong, Seo-gu, Incheon, 404-170, Republic of Korea2ADvanced Environmental Monitoring Research Center (ADEMRC) at Gwangju Institute of Science and Technology(GIST), Oryong-dong, Buk-gu, Gwangju, 500-712, Republic of Korea3The DELTA Group (DAS), University of California, Davis, CA, USA4Department of Environmental Health, Seoul National University, Yongun-dong, Jongno-gu, Seoul, 110-799, Republic ofKorea
Received: 24 March 2005 – Published in Atmos. Chem. Phys. Discuss.: 22 July 2005Revised: 20 October 2005 – Accepted: 16 December 2005 – Published: 27 January 2006
Abstract. Size- and time-resolved aerosol samples were col-lected using an eight-stage Davis rotating unit for monitor-ing (DRUM) sampler from 29 March to 29 May in 2002at Gosan, Jeju Island, Korea, which is one of the represen-tative background sites in East Asia. These samples wereanalyzed using synchrotron X-ray fluorescence for 3-h av-erage concentrations of 19 elements consisting of S, Si, Al,Fe, Ca, Cl, Cu, Zn, Ti, K, Mn, Pb, Ni, V, Se, As, Rb, Cr,Br. The size-resolved data sets were then analyzed usingthe positive matrix factorization (PMF) technique in orderto identify possible sources and estimate their contributionto particulate matter mass. PMF analysis uses the uncer-tainty of the measured data to provide an optimal weight-ing. Fifteen sources were resolved in eight size ranges(0.07∼12µm) and included continental soil, local soil, seasalt, biomass/biofuel burning, coal combustion, oil heatingfurnace, residual oil fired boiler, municipal incineration, non-ferrous metal source, ferrous metal source, gasoline vehi-cle, diesel vehicle, copper smelter and volcanic emission.PMF analysis of size-resolved source contributions showedthat natural sources represented by local soil, sea salt andcontinental soil contributed about 79% to the predicted pri-mary particulate matter (PM) mass in the coarse size range(1.15∼12µm). On the other hand, anthropogenic sourcessuch as coal combustion and biomass/biofuel burning con-tributed about 60% in the fine size range (0.56∼2.5µm). Thediesel vehicle source contributed the most in the ultra-finesize range (0.07∼0.56µm) and was responsible for about52% of the primary PM mass.
Correspondence to:K. J. Moon([email protected])
1 Introduction
Northeast Asia is known to emit a large amount of Asian dustparticles and anthropogenic pollutants, due to its high densityof industrial activities and increasingly high rate of energyconsumption. This region has recently attracted significantattention in terms of atmospheric chemistry and has beenthe focus of international measurement activities, such as theAsia-Pacific Regional Aerosol Characterization Experiment(ACE-Asia) (Huebert et al., 2003), East Asia/North PacificRegional Experiment (APARE) (Carmichael et al., 1997),Transport and Chemical Evolution over Pacific (TRACE-P) (Jacob et al., 1999), Pacific Exploratory Mission-West(PEM-WEST) (Hoell et al., 1991), being a subproject of theInternational Global Atmospheric Chemistry (IGAC) Pro-gram, and the Atmospheric Brown Cloud (ABC) program(Ramanathan et al., 2003) supported by UNEP. Moreover, asthe Korean peninsula is located in the middle of the westerlywind latitude region of northeast Asia, many studies on theinfluence of long-range transport (LRT) have been performedin this region.
It is commonly necessary to identify aerosol sources andestimate their influence on ambient PM concentration in or-der to formulate effective control strategies for ambient par-ticulate matter. Measures of source apportionment have beenderived from various statistical methods to achieve thesegoals, and utilize method such as chemical mass balance(CMB), factor analysis, and those based on multiple linearregression. In particular, receptor modeling using aerosolchemical composition data is a reliable method that can pro-vide information on aerosol sources. However, the com-monly used multivariate receptor models such as principalcomponent analysis (PCA) have several drawbacks. The
© 2006 Author(s). This work is licensed under a Creative Commons License.

212 J. S. Han et al.: Size-resolved source apportionment of ambient particles
Fig. 1. Location of the Gosan sampling site.
factors used in PCA are not always physically realistic, asnegative values may appear among factor loadings and fac-tor scores. Additionally, PCA results do not represent a mini-mum variance solution because the method is based on incor-rect weighting by assuming unrealistic standard deviationsfor the variables in the data matrix. Furthermore, PCA is in-capable of handling missing and below-detection-limit dataoften observed in environmental measurements.
A newly developed Positive Matrix Factorization (PMF)method (Paatero and Tapper, 1994) overcomes the weakpoints of the previous receptor model. It introduces a weight-ing scheme taking into account errors of the data points,which are used as point-by-point weights. Adjustment of thecorresponding error estimates also allows it to handle miss-ing and below-detection-limit data. Moreover, non-negativeconstraints are implemented in order to obtain more physi-cally explainable factors (Paatero, 1998). PMF has been suc-cessfully applied to the analysis of ambient aerosol data inmany urban, rural and remote areas (Begum et al., 2004; Kimet al., 2003; Polissar et al., 2001; Song et al., 2001).
Most previous studies examined the contributions of emis-sion sources to PM2.5 and PM10 mass using PMF (Kim et al.,2003; Begum et al., 2004; Ramadan et al., 2000). Composi-tion of ambient aerosol varies with size, even in the fine sizerange (<2.5µm), and is dependent on the type of anthro-pogenic source. Therefore, more size-segregated composi-tion data are needed in the fine size range in order to improvethe accuracy of anthropogenic source apportionment. Fromthis point of view, PMF analysis has been performed in thisstudy on the Gosan aerosol data collected by a DRUM sam-pler in order to obtain a better estimation of possible aerosolsources and their contributions. The use of a DRUM sam-pler is advantageous because it can collect fine particles infive stages below 2.5µm. Moreover, it is expected that size-segregated aerosol data collected by a DRUM sampler witha high time resolution will improve the efficiency of PMFanalysis.
2 Sampling and analysis
Ambient aerosol samples were collected at Gosan, Jeju Is-land, Korea (33◦17′ N, 126◦10′ E, 70 m a.s.l.) from 29 Marchto 29 May 2002. Gosan, a representative background site inEast Asia, is an ideal location for studying the long-rangetransport of air pollutants in East Asia (Carmichael et al.,1996; NIER, 1998; Heubert et al., 2003; Han et al., 2004).It has served as a “super site” for the ACE-Asia program(Heubert et al., 2003) and is now a selected “super site” forthe ABC project (Ramanathan et al., 2003). During the mea-surement period, two Asian dust (AD) outbreaks were ob-served on 8–10 April and 17 April. In this study, aerosoldata pertaining to those AD periods were not subject to PMFanalysis in order to focus on the estimation of anthropogenicaerosol sources.
Size-segregated aerosol samples were collected with aneight-stage Davis Rotating Unit for Monitoring (DRUM)sampling system (Cahill et al., 1985). The DRUM samplercollects size-resolved aerosol samples on ApiezonTM coatedMylarTM strips in eight stages, having equivalent aerody-namic cut-off diameters of 0.07, 0.26, 0.34, 0.56, 0.75, 1.15,2.5, 5.0 and 12µm. The DRUM sampler was operated con-tinuously during the 61-day sampling period. The DRUMaerosol samples were then analyzed for inorganics (19 el-ements between aluminum and lead) using synchrotron X-ray fluorescence (S-XRF) at the Lawrence Berkeley Na-tional Laboratory Advanced Light Source (Perry et al., 2004;Bench et al., 2002). Conditions of S-XRF analysis are sum-marized in Table 1. Data reduction was performed offlineusing a well-accepted international XRF code, AXIL to gen-erate the elemental profiles in 3-h temporal resolution. Adetailed description of the sampling and analysis methods isprovided by Cahill et al. (1993).
3 Data analysis by PMF
The Positive Matrix Factorization (PMF) method was devel-oped by Paatero (Paatero and Tapper, 1993) to provide a flex-ible modeling approach that effectively uses the informationin the data. In PMF, the data matrixX of dimension n rowsand m columns, wheren andm are the number of samplesand species, respectively, can be factorized into two matrices,namelyG (n×p) andF (p×m), and a residual componentE,wherep represents the number of factors extracted:
X = GF + E (1)
G is the source contribution matrix withp sources, andFa source profile matrix. PMF provides a solution that mini-mizes an object function,Q, based upon the uncertainty foreach observation (Paatero, 2000), which is defined as:
Q =
n∑i=1
m∑j=1
(eij
sij
)2
, (2)
Atmos. Chem. Phys., 6, 211–223, 2006 www.atmos-chem-phys.org/acp/6/211/
J. S. Han et al.: Size-resolved source apportionment of ambient particles 213
Table 1. XRF analysis conditions∗.
Photon Energy Range Monochromator Photon Flux Spectral Resolution Spatial Resolution Detectors Sensitivity of(keV) (Photons/s) (E/1E) (mm) Detection
6–15 White light, multiplayer 3×10¹⁰ 25 1.0×1.0 Si (Li) x-ray ∼0.1 ng/m−3
(with multiplayer mirrors in Kirkpatrick-Baez (at 12.5 keV) (at 12.5 keV) detectormirrors) configuration
*: Analyzed by DELTA group in Univ. of California Davis.
eij = xij −
p∑k=1
gikfkj , (3)
wheresij is the uncertainty in the measured dataxij . PMFuses a least-squares approach to solve the factor analysisproblem with integrating non-negativity constraints into theoptimization process, meaning that sources cannot have neg-ative species concentration (fkj≥0) and the sample cannothave a negative source contribution (gki≥0). The solution ofEq. (2) is obtained using an iterative minimization algorithm,PMF2 (two-way PMF) (Paatero, 2000). PMF2 uses the errorof measurement in the data to provide optimum data pointscaling, and permits better treatment of missing and below-detection-limit values. Measurement values, xij , below thedetection limit were replaced by a value of half of the detec-tion limit, and an error corresponding to a relative uncertaintyof 100% was assigned to the original error estimate.
A robust mode of PMF2 was selected for the handling ofoutlier data in order to degrade the disproportional effect ofexcessively large data points, and is especially useful in theanalysis of environmental data (Paatero, 1996). This can beachieved by introducing a filter functionhij in Eq. (2), theleast-squares minimization ofQ (Hien et al., 2004):
Q =
n∑i=1
m∑j=1
(eij
hij sij
)2
(4)
where
hij =
{1 if
∣∣eij
/sij∣∣ ≤ α,∣∣eij
/sij∣∣ /α otherwise.
(5)
The parameterα is the outlier threshold distance, and thevalueα=4 was chosen in the present study for consistencywith Lee et al. (1999) and Hien et al. (2004). The otherimportant parameter of PMF2 isFpeak, which can be usedto control rotations and yield more physically realistic solu-tions (Paatero et al., 2002; Begum et al., 2004). In this study,the rotation was controlled byFpeakuntil an appropriate dis-tribution of the edges is achieved andG space plotting forPMF modeling reveals the independence of the contributionsreducing the rotational ambiguity.
4 Results and discussions
4.1 Determination of rotational freedom and the number ofsources
The determination of the number of factors in PMF is a crit-ical step. A trial and error method with different numbersof factors is generally employed to obtain optimal conditionswith the most physically meaningful results. In addition, thevalue ofQ, as defined in Eq. (2), can be used to help deter-mine the optimal number of factors. In this study, informa-tion from the scaled residual matrix (R) in PMF is also usedto reduce the ambiguity, due to the manual judgment of thenumber of factors. Each column in matrixR (rij=eij /sij )represents the quality of the fitting of each species to theproduct ofGF. For each specific number of factors, two pa-rameters are obtained fromR: IM, the maximum individualcolumn mean, andIS, the maximum individual column stan-dard deviation (Lee et al., 1999), where
IM = maxj=1...m
(1
n
n∑i=1
rij
), (6)
IS = maxj=1...m
√√√√ 1
n − 1
n∑i=1
(rij − r̄j )2
. (7)
When the number of factors increases to a critical value,IMandIS will drop sharply. Figure 2 shows the variation ofIMandIS with differences in the number of factors in eight sizeranges. Finally, four to eight factors were found to generatethe most reasonable results. A further reduction of the num-ber of factors resulted in a combination of different sources.
After the source profiles were identified without transfor-mation, PMF was run with differentFpeakvalues in order todetermine a range within which the objective functionQ inEq. (4) remained relatively constant. The optimal solutionshould lie within this range (Song et al., 2001; Kim et al.,2003). Negative values ofFpeak were used in this study be-cause positive values make the source compositions in matrixF the extreme values, which are either close to zero or unity.Rotmat, a rotational matrix in PMF, is also used to reveal iffactors have excessive rotational freedom. The largest ele-ment inRotmat shows the worst case in rotational freedom
www.atmos-chem-phys.org/acp/6/211/ Atmos. Chem. Phys., 6, 211–223, 2006

214 J. S. Han et al.: Size-resolved source apportionment of ambient particles
Fig. 2. Determination of the number of factors in eight size ranges by(a) maximum individual column mean (IM), and(b) standard deviation(IS) of standardized residuals.
Table 2. Sources identified in each of the eight size ranges.
Source Major components Stage 1∗ Stage 2∗ Stage 3∗ Stage 4∗ Stage 5∗ Stage 6∗ Stage 7∗ Stage 8∗
1 Continental soil Si, Al, Fe, Ca, K, S, Pb + + + + + + + +2 Local soil Si, Al, Fe, K, Ti, Ca + + +3 Sea salt Cl, S, K, Br + + +4 Biomass/biofuel burning S, K, Cl, Si, Al + + + + +5 Municipal incineration Cl, Fe, S, Al, Ca, Zn, Br, Pb + + +6 Coal combustion S, Si, K, Zn, Ca, Fe, As, Se + + + + +7 Oil heating furnace S, Si, K, Ca, Fe, V, Pb + + +8 Oil fired boiler S, V, Si, Ni + + +9 Gasoline vehicle S, Si, Ca Fe, Zn, Cl, K + + + +10 Diesel vehicle Si, S, Al, K +11 Ferrous metal source-C Fe, Zn, Cu, Pb +12 Nonferrous metal source Cu, S, Zn, Fe, Cr, Pb + +13 Ferrous metal source-F Fe, Si, Al, K, Zn, Mn + + + +14 Copper smelter S, Si, K, Fe, Zn, Cu, As, Pb + +15 volcanic emission Si, Al, S, K, Ca, Fe, Ti +
Number of samples 411 411 411 411 411 335 381 411Number of factor 5 4 5 5 8 6 8 7Q (Chi square) 37 015 31 996 30 992 37 007 12 773 23 331 5067 12 175
Fpeak −0.4 −0.5 −0.9 −0.7 −0.7 −0.6 −0.7 −0.7
*: stage 1: 5.0µm∼Inlet, stage 2: 2.5∼5.0µm, stage 3: 1.15∼2.5µm, stage 4: 0.75∼1.15µm, stage 5: 0.56∼0.75µm, stage 6:0.34∼0.56µm, stage 7: 0.26∼0.34µm, stage 8: 0.07∼0.24µm
(Lee et al., 1999). The final acceptable rotations were de-termined by trial and error and are based on the evaluationof the calculated source profiles in comparison with the trueprofiles. Figure 3 shows the variation ofQ values and thelargest element inRotmat with differentFpeak values. As aresult,Fpeakvalues of−0.4∼−0.9 provided the most physi-cally reasonable source profiles in the eight size ranges.
4.2 Source profiles and temporal variations
The resolved source profiles from PMF analysis were com-pared with the known profiles obtained from previous studies(Davis et al., 1981; He et al., 2001; Mamuro et al., 1979a, b;Small et al., 1981; US EPA, 1987; Watson et al., 1979, 1994)in order to identify source type. Source profiles show a very
similar shape in the resolved size ranges for the same source.For example, Fig. 4 shows similar profiles of sea salt in stages1∼3 and the biomass/biofuel burning source in stages 4∼8.This similarity of source profiles suggests that PMF has beensuccessfully applied in this study.
Overall, fifteen distinct primary sources were resolved forthe ambient aerosols collected at the Gosan site in the springof 2001, excluding AD periods. Secondary sources werenot resolved in this study because the chemical composi-tion data of secondary particles including sulfate, nitrate, am-monium and organic carbon matter was not used in PMFanalysis. The parameters and results of PMF analysis aresummarized in Table 2. The resolved sources included notonly natural sources such as local soil, sea salt, continental
Atmos. Chem. Phys., 6, 211–223, 2006 www.atmos-chem-phys.org/acp/6/211/

J. S. Han et al.: Size-resolved source apportionment of ambient particles 215
Fig. 3. Determination of the rotational freedom in eight size ranges by(a) Q and(b) largest element in the rotational matrix.
Fig. 4. Source profiles in different size ranges ((a) sea salt,(b) biomass/biofuel burning).
soil and volcanic emission, but also eleven anthropogenicsources such as biomass/biofuel burning, municipal inciner-ation, coal combustion, oil heating furnace, residual oil firedboiler, gasoline vehicle, diesel vehicle, nonferrous and fer-rous metal sources and copper smelter. The influence of mostanthropogenic sources was observed in the fine size range(0.07∼1.15µm), while the coarse particles (1.15∼12µm)mainly originated from natural sources. It is especially in-teresting to note that several anthropogenic sources such asgasoline vehicle, diesel vehicle, nonferrous metal source andresidual oil combustion were only resolved in the ultra-finesize range (0.07∼0.75µm).
The profiles of fifteen sources were determined by tak-ing an average of similar profiles in different size ranges.The average mass profiles, obtained from PMF analysis, areshown in Fig. 5 with known profiles from previous studies.The resolved source profiles had a chemical composition thatwas very similar to the corresponding existing source pro-files: continental soil (He et al., 2001), soil dust (EPA pro-file 41340), marine aerosol (Watson, 1979), volcanic emis-sion (Davis et al., 1981), oil heating furnace (Mamoro etal., 1979a), oil fired boiler (EPA 13505), coal combustion(Mamuro et al., 1979a), field burning (EPA profile 42320),municipal incineration (EPA profile 17106), gasoline vehicle
www.atmos-chem-phys.org/acp/6/211/ Atmos. Chem. Phys., 6, 211–223, 2006
216 J. S. Han et al.: Size-resolved source apportionment of ambient particles
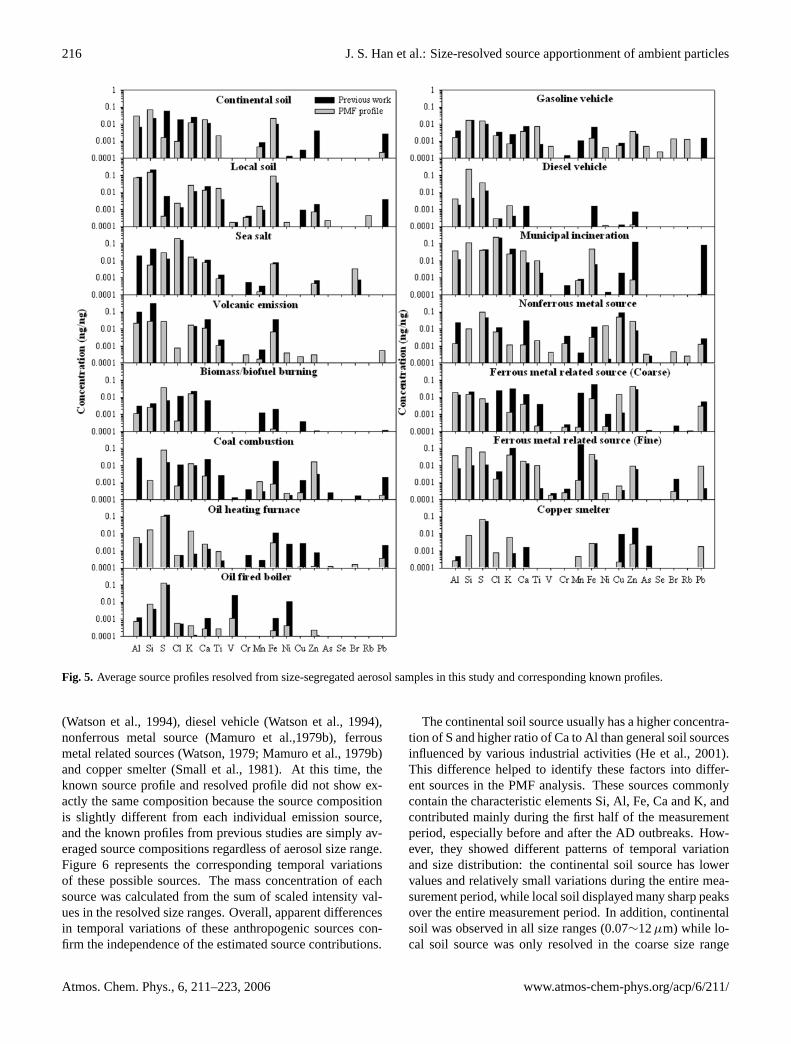
Fig. 5. Average source profiles resolved from size-segregated aerosol samples in this study and corresponding known profiles.
(Watson et al., 1994), diesel vehicle (Watson et al., 1994),nonferrous metal source (Mamuro et al.,1979b), ferrousmetal related sources (Watson, 1979; Mamuro et al., 1979b)and copper smelter (Small et al., 1981). At this time, theknown source profile and resolved profile did not show ex-actly the same composition because the source compositionis slightly different from each individual emission source,and the known profiles from previous studies are simply av-eraged source compositions regardless of aerosol size range.Figure 6 represents the corresponding temporal variationsof these possible sources. The mass concentration of eachsource was calculated from the sum of scaled intensity val-ues in the resolved size ranges. Overall, apparent differencesin temporal variations of these anthropogenic sources con-firm the independence of the estimated source contributions.
The continental soil source usually has a higher concentra-tion of S and higher ratio of Ca to Al than general soil sourcesinfluenced by various industrial activities (He et al., 2001).This difference helped to identify these factors into differ-ent sources in the PMF analysis. These sources commonlycontain the characteristic elements Si, Al, Fe, Ca and K, andcontributed mainly during the first half of the measurementperiod, especially before and after the AD outbreaks. How-ever, they showed different patterns of temporal variationand size distribution: the continental soil source has lowervalues and relatively small variations during the entire mea-surement period, while local soil displayed many sharp peaksover the entire measurement period. In addition, continentalsoil was observed in all size ranges (0.07∼12µm) while lo-cal soil source was only resolved in the coarse size range
Atmos. Chem. Phys., 6, 211–223, 2006 www.atmos-chem-phys.org/acp/6/211/

J. S. Han et al.: Size-resolved source apportionment of ambient particles 217
Fig. 6. Temporal variations of total mass concentration using each of the resolved sources during non-AD periods.
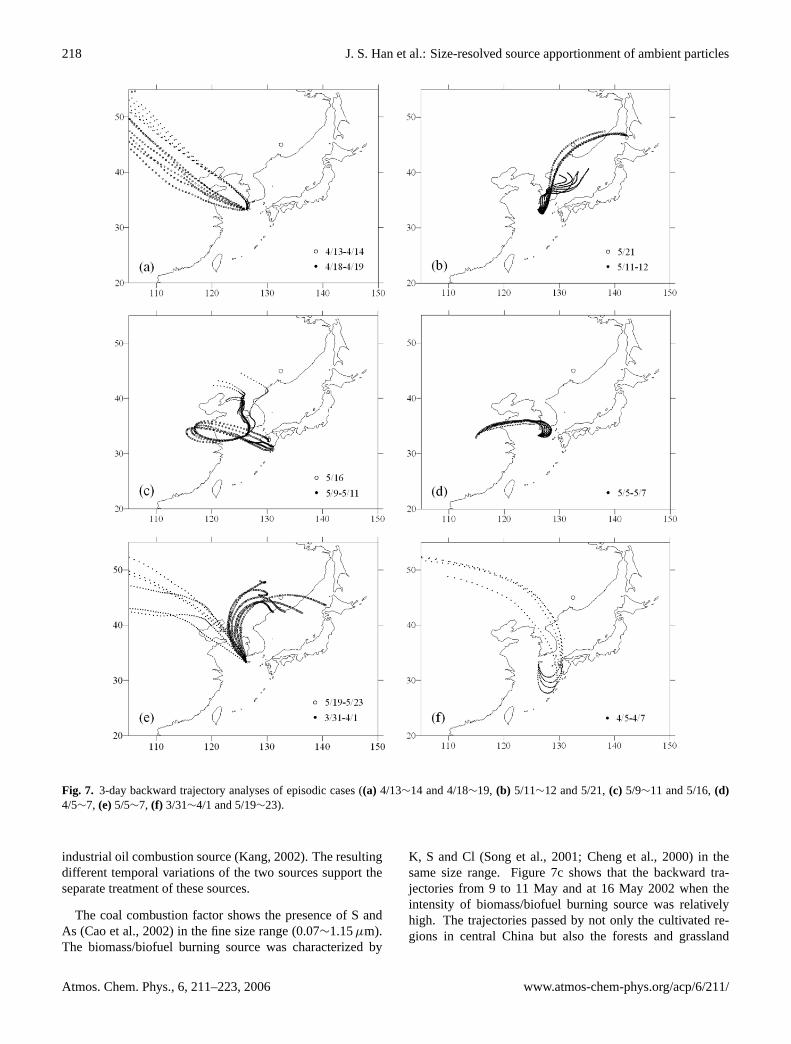
(1.15∼12µm). The difference between continental soil andlocal soil was definitely observed in the backward trajectoryanalysis using HYSPLIT4 (Draxler, 2004). Figures 7a andb respectively shows the back trajectories in 3-h intervalsobserved when the intensities of continental soil and localsoil sources were independently higher than other periods asshown in Fig. 6. The trajectories reveal that continental soilwas transported from more distant regions including north-eastern China than local soil. The sea salt factor character-ized by high Cl and Br was also resolved in the same coarsesize range as the local soil source.
The factors characterized by high S and V in the fine sizerange (0.07∼2.5µm) could be represented by an oil com-bustion source (Watson, 1997). However, these factors wereseparated into the two sources, residual oil-fired boiler andindustrial oil heating furnace, in order to account for thedifferences in their chemical composition. In the ultra-finesize range (0.07∼0.56µm), the factor containing the largeramount of V and Ni represents the influence of the resid-ual oil combustion source (Swietlicki and Krejci, 1996; Sunet al., 2004). The factor characterized by K, Ca and Pb inthe relatively large size range (0.56∼2.5µm) represents the
www.atmos-chem-phys.org/acp/6/211/ Atmos. Chem. Phys., 6, 211–223, 2006
218 J. S. Han et al.: Size-resolved source apportionment of ambient particles
Fig. 7. 3-day backward trajectory analyses of episodic cases ((a) 4/13∼14 and 4/18∼19, (b) 5/11∼12 and 5/21,(c) 5/9∼11 and 5/16,(d)4/5∼7, (e)5/5∼7, (f) 3/31∼4/1 and 5/19∼23).
industrial oil combustion source (Kang, 2002). The resultingdifferent temporal variations of the two sources support theseparate treatment of these sources.
The coal combustion factor shows the presence of S andAs (Cao et al., 2002) in the fine size range (0.07∼1.15µm).The biomass/biofuel burning source was characterized by
K, S and Cl (Song et al., 2001; Cheng et al., 2000) in thesame size range. Figure 7c shows that the backward tra-jectories from 9 to 11 May and at 16 May 2002 when theintensity of biomass/biofuel burning source was relativelyhigh. The trajectories passed by not only the cultivated re-gions in central China but also the forests and grassland
Atmos. Chem. Phys., 6, 211–223, 2006 www.atmos-chem-phys.org/acp/6/211/

J. S. Han et al.: Size-resolved source apportionment of ambient particles 219
Fig. 8. Comparison of predicted primary PM mass, as determinedby PMF analysis, with measured primary PM mass.
located in northeast China and North Korea. Therefore, itis inferred that this source includes field combustion of agri-cultural residues as well as biofuel combustion. The mu-nicipal incineration source was described by Cl, S, Fe, Brand Zn (Chueinta et al., 2000; Kang, 2002) in both coarse(5∼12µm) and fine size ranges (0.26∼0.76µm).
The motor vehicle sources were classified further intogasoline and diesel vehicle sources. The gasoline vehiclesource, represented by S, Si, Ca, Fe and Cl, was resolved inthe fine size range (0.07∼0.75µm). On the other hand, thediesel vehicle source characterized by Si, S, Al and K wasonly resolved in the ultra-fine size range (0.07∼0.26µm).The factor associated with S, Cu, Zn and Pb represents an in-dustrial emission source originating principally from a non-ferrous smelter (Lee et al., 1999) and was resolved in theultra-fine size range (0.07∼0.34µm). The ferrous metalsource, mainly loaded with Fe, Mn and Zn, was resolved inboth coarse (5∼12µm) and fine size (0.56∼2.5µm) ranges.In two size ranges, the ferrous metal related source re-vealed significantly different source compositions and tem-poral variations, indicating that the detailed emission sourceand source region are different in each size range. As shownin Figs. 7d and e, the difference of trajectories when they re-spectively have high intensities also supports the separationof two ferrous metal related sources. The source in coarsesize range was estimated to be transported from southern in-dustrial regions in South Korea while fine aerosol source re-gions related to the steel industry could be mainly located inmajor industrial areas in northeastern China. The other met-allurgical source, copper smelter, was also resolved in thefine size range (0.56∼0.75µm). Finally the volcanic emis-sion source, containing large amounts of Al, Si, K, Ca andFe, was resolved in the fine size range (0.56∼0.75µm) whenthe trajectories passed around Kyushu Island in which thereare several active volcanoes as shown in Fig. 7f.
Fig. 9. Average source contributions to the total particle mass con-centration.
The effectiveness of PMF analysis was evaluated by acomparison between predicted and measured primary PMmass, as shown in Fig. 8. The measured primary PM masswas obtained from the sum of element mass concentrationsmeasured in eight size ranges, while the predicted primaryPM mass was calculated from the sum of scaled source con-tribution values for each sample. The correlation coeffi-cient between measured and predicted primary PM masseswas 0.82, indicating that the resolved factors effectively ac-counted for most of the variations in mass concentration ofparticulate elements.
4.3 Source contributions
The average contributions of each source to the measuredtotal PM mass during the non-AD periods are shown inFig. 9. The total PM (<12µm) mass collected by theDRUM sampler was calculated from the PM10 mass con-centration obtained at Gosan ambient air quality monitoringsite (33◦15′ N, 126◦12′ E) operated by the Ministry of Envi-ronment Korea. PM10 concentration was measured by aβ-ray absorption method, having a detection limit of 2µg/m3
with 1µg/m3 resolution with an interval of 1-h. A weight-ing factor of 1.02 was used in the analysis, and was derivedfrom the previous result that the PM10 mass occupies about98% of the PM12 mass on the average at Gosan (Han etal., 2005). On average, the estimated fifteen sources fromPMF analysis contributed to about 53% of the total PM12mass. At this time, local soil contributed 11%, the largestportion of the PM12 mass, and natural sources including lo-cal soil, sea salt and continental soil represented about 23%of the total PM12 mass. On the other hand, anthropogenicsources contributed to a rather larger portion than naturalsources, accounting for 30% of the total PM12 mass. It isespecially interesting to note that the contributions of dieselvehicle, biomass/biofuel burning, coal combustion, ferrousmetal source and municipal incineration were large, beingequal to 6.7, 6.1, 5.4, 3.0 and 2.7%, respectively.
www.atmos-chem-phys.org/acp/6/211/ Atmos. Chem. Phys., 6, 211–223, 2006

220 J. S. Han et al.: Size-resolved source apportionment of ambient particles
Fig. 10.Temporal variation of PM mass contributed by different source types for(a) total size ranges,(b) the coarse size range (2.5∼12µm),(c) the fine size range (0.56∼2.5µm), and(d) the ultra-fine size range (0.07∼0.56µm).
Atmos. Chem. Phys., 6, 211–223, 2006 www.atmos-chem-phys.org/acp/6/211/

J. S. Han et al.: Size-resolved source apportionment of ambient particles 221
Considering the fact that water-soluble ions and carboncomponents are not included in PMF analysis, the remain-ing fractions of the total PM12 mass (47%) that cannotbe described by estimated sources may represent a portionof secondary aerosol components such as ammonium sul-fate, ammonium nitrate and secondary organic carbon mat-ter. This agrees considerably with the result of a previousstudy (KME, 2004) performed at Gosan from 30 March to11 April 2002 in which the average concentration of organiccarbon and secondary ion components, including sulfate, ni-trate and ammonium, occupied more than 40% of the PM10mass during NAD periods.
Temporal variations of total PM12 mass and estimatedsource contributions are shown in Fig. 10, where the contri-bution from each source is accumulated. The results showthat many large peaks in total PM mass are produced bythe contributions of the resolved sources from PMF anal-ysis. However, the undetermined fraction of PM12 massreveals rather different temporal variations from those esti-mated by sources, implying that this fraction originated notfrom primary emission sources but from secondary particu-late matter. In addition, the contributions of various sourcesreveal different temporal variations correlated with aerosolsize range. Source contributions in three different size rangesare assessed separately in Fig. 10. Figure 10b shows thatthe contribution of natural sources including local soil, seasalt and continental soil was dominant, representing 79% inthe coarse size range (2.5∼12µm). On the other hand, thecontribution of anthropogenic sources such as coal combus-tion, biomass/biofuel burning and diesel vehicle, increasedsharply in the fine and ultra-fine size ranges (0.07∼2.5µm),as shown in Figs. 10c and d. Moreover, the contributionof diesel vehicle (52%) was observed mainly in the ultra-fine size range (0.07∼0.56µm), while the coal combustionsource (33%) contributed the most in the fine size range(0.56∼2.5µm). The contribution of anthropogenic sourcesincreased to 98% of the total contribution in the ultra-finesize range (0.07∼0.56µm).
5 Summary and conclusion
Size-resolved aerosol chemical composition data collectedat Gosan, Jeju Island, Korea were analyzed using the PMFmethod to estimate the contribution by possible emissionsources in various size ranges. Fifteen possible sources wereidentified over eight size ranges (0.07∼12µm). The result ofsource identification reveals that natural sources including lo-cal soil, sea salt and continental soil, contributed principallyin the coarse size range (1.15∼12µm), while the greatestcontribution by anthropogenic sources was resolved in thefine size range (0.07∼1.15µm). It is especially interestingto note that several anthropogenic sources such as gasolinevehicle, diesel vehicle, nonferrous metal source and residualoil combustion were only resolved in the ultra-fine size range
(0.07∼0.75µm). The average mass contribution of resolvedprimary emission sources was about 53% of the total PMmass. Among them, the natural sources contributed about23%, and the contribution of other anthropogenic sources,including diesel vehicle, biomass/biofuel burning, coal com-bustion, ferrous metal furnace and municipal incineration,accounted for about 24% of the total PM mass. It wasalso discovered that the contribution of each source variedwith respect to particle size range. In the coarse size range(2.5∼12µm), the contribution of natural sources was pre-dominant and attained a level of over 75%. On the otherhand, coal combustion and biomass/biofuel burning sourcescontributed the most in the fine size range (0.56∼2.5µm),accounting for 33% and 25% of the total PM mass, respec-tively. In the ultra-fine size range (0.07∼0.56µm), the dieselvehicle source contributed to more than 50% of the total PMmass.
PMF analysis has been applied to size-resolved aerosol el-emental concentration data obtained by a DRUM samplerat Gosan. Temporal variations of PMF estimated sourceswere different, suggesting the independence of the resolvedsources. These results show that PMF analysis using con-tinuous size-resolved aerosol data is a powerful method forthe identification of emission sources from measured ambi-ent aerosol composition data.
Acknowledgements.This work was supported by the projectof Ministry of Environment, Korea; “Long Range Transport ofToxic Trace Substances: Identification and Impact Analysis”and in part by the Korea Science and Engineering Foundation(KOSEF) through the Advanced Environmental MonitoringResearch Center (ADEMRC) at Gwangju Institute of Scienceand Technology (GIST). Special recognition goes to K. D. Perryin the University of Utah for helping to analyze the DRUM samples.
Edited by: W. Conant
References
Begun, B. A., Kim, E., Biswas, S. K., and Hopke, P. K.: Investiga-tion of sources of atmospheric aerosol at urban and semi-urbanareas in Bangladehs, Atmos. Environ., 38, 3025–3038, 2004.
Bench, G., Grant, P. G., Ueda, D., Cliff, S. S., Perry, K. D., andCahill, T. A.: The use of STIM and PESA to measure profiles ofaerosol mass and hydrogen content, respectively, across Mylarrotating drum impactor samples, Aerosol Sci. Technol., 36, 642–651, 2002.
Cahill, T. A., Goodart, C., Nelson, J. W., Eldred, R. A., Nasstrom,J. S., and Feeny, P. J.: Design and evaluation of the DRUM im-pactor, Proceedings of the International Symposium on Partic-ulate and Multi-Phase Processes (vol. 2), edited by: Ariman, T.and Nejat, T., Taylor and Francis, Philadelphia, Pa., pp. 319–325,1985.
Cahill, T. A. and Wakabayashi, P.: Compositional analysis of size-segregated aerosol samples, in: Measurement Challenges in At-mospheric Chemistry, edited by: Newman, L., Adv. Chem. Ser.,232, 211–228, 1993.
www.atmos-chem-phys.org/acp/6/211/ Atmos. Chem. Phys., 6, 211–223, 2006

222 J. S. Han et al.: Size-resolved source apportionment of ambient particles
Cao, L., Tian, W., Ni, B., Zhang, Y., and Wang, P.: Preliminarystudy of airborne particulate matter in a Beijing sampling stationby instrumental neutron activation analysis, Atmos. Environ., 36,1951–1956, 2002.
Carmichael, G. R., Zhang, Y., Chen, L., Hong, M. S., and Ueda,H.: Seasonal variation of aerosol composition at Cheju Island,Korea, Atmos. Environ., 30, 2407–2416, 1996.
Carmichael, G. R., Hong, M. S., Ueda, H., Chen, L. L., Murano, K.,Park, J. K., Lee, H., Kim, Y., Kang, C., and Shim, S.: Aerosolcomposition at Cheju Island, Korea, J. Geophys. Res., 102(D5),6047–6061, 1997.
Cheng, Z. L., Lam, K. S., Chan, L. Y., Wang, T., and Cheng, K. K.:Chemical characteristics of aerosols at coastal station in HongKong, I. Seasonal variation of major ions, halogens and mineraldusts between 1995 and 1996, Atmos. Environ., 24, 2777–2783,2000.
Chueinta, W., Hopke, P. K., and Paatero, P.: Investigation of sourcesof atmospheric aerosol at urban and suburban residential area inThailand by positive matrix factorization, Atmos. Environ., 34,3319–3329, 2000.
Gladney, E. S., Small, J. A., Gordon, G. E., and Zoller, W. H.: Com-position and Size distribution of In-Stack Particulate Material at aCoal-Fired Power Plant, Atmos. Environ., 10, 1071–1077, 1976.
Draxler, R. ans Hess, G. D.: Description of the HYSPLIT4 model-ing system, NOAA Technical Memorandum ERL ARL-224, 28pp., Air Resources Lab., Silver Spring, Meryland, 2004.
Han, J. S., Moon, K. J., Ahn, J. Y., Hong, Y. D., Kim, Y. J., Ryu,S. Y., Cliff, S. S., and Cahill, T. A.: Characteristics of ion com-ponents and trace elements of fine particles at Gosan, Korea inspring time from 2001 to 2002, Environ. Monit. Assess., 92, 73–93, 2004.
Han, J. S., Moon, K. J., Lee, S. J., Kim, J. E., and Kim, Y. J.: Sizedistribution characteristics of particulate mass and ion compo-nents at Gosan, Korea from 2002 to 2003, J. Korean Soc. Atmos.Environ., 21(E1), 23–35, 2005.
He, K., Yang, F., Ma, Y., Zhang, Q., Yao, X., Chan, C. K., Cadle,S., Chan, T., and Mulawa, P.: The characteristics of PM2.5 inBeijing, China, Atmos. Environ., 35, 4959–4970, 2001.
Hien, P. D., Bac, V. T., and Thinh, N. T. H.: PMF receptor modelingof fine and coarse PM10 in air masses governing monsoon condi-tions in Hanoi, northern Vietnam, Atmos. Environ., 38, 189–201,2004.
Hoell, J. M., Davis, D. D., Liu, S. C., Newell, R., Shipham, M.,Akimoto, H., and McNeal, R. J.: Overview of PEM-West A Re-sult, URLhttp://www-gte.larc.nasa.gov/pem/pemarslt.htm, (as-sessed in January 2005), 1991.
Huebert, B. J., Bates, T., Russel, P. B., Shi, G., Kim, Y. J., Kawa-mura, K., Carmichael, G., and Nakajima, T.: An overview ofACE-Asia: Strategies for quantifying the relationships betweenAsian aerosols and their climatic impacts, J. Geophys. Res.,108(D23), 8633, doi:10.1029/2003JD003550, 2003.
Jacob, D. J., Davis, D. D., Liu, S. C., Newell, R. E., Huebert, B.J., Anderson, B. E., Atlas, E. L., Blake, D. R., Browell, E. V.,Chameides, W. L., Elliott, S., Kasputin, V., Saltzman, E. S.,Singh, H. B., and Sze, N. D.: Transport and Chemical Evolu-tion over the Pacific (TRACE-P): A NASA/GTE Aircraft Mis-sion, URL http://www-gte.larc.nasa.gov/trace/tracep.html, (as-sessed in January 2005), 1999.
Kang, C. M.: Characteristics of the Fine Particles and Source Ap-
portionments using the CMB model in Seoul Area, Doctoral dis-sertation, Konkuk University, Seoul, Korea, 2002.
Kim, E., Larson, T. V., Hopke, P. K., Slaughter, C., Sheppard, L.E., and Claiborn, C.: Source identification of PM2.5 in an aridNorthwest U.S. City by positive matrix factorization, Atmos.Res., 66, 291–305, 2003.
KME (Korean Ministry of Environment): Long Range Transportof Toxic Trace Substances: Identification and Impact Analysis –Measurement & Analysis of Aerosol and Hazardous Substances(in Korean), 11-1480083-000142-14, 87–136, 2004.
Lee, E., Chan, C. K., and Paatero, P.: Application of positive matrixfactorization in source apportionment of particulate pollutants inHong Kong, Atmos. Environ., 33, 3201–3212, 1999.
Mamuro, T. A. and Mizohata, T. K.: Elemental Compositions ofSuspended Particles Released from Various Boilers, Annual Re-port of the Radiation Center of Osaka Prefecture, 20, 9–17,1979a.
Mamuro, T. A. and Mizohata, T. K.: Elemental Compositions ofSuspended Particles Released from Iron and Steel Works, Ann.Rep. Radiat. Center of Osaka Prefecture, 20, 19–28, 1979b.
NIER (National Institute of Environmental Research): Study onlong-range transport of air pollutants in Northeastern Asia (III)(in Korean). Report to National Institute of Environmental Re-search, Korea, Report No. BSG557-6191, Korea Institute of Sci-ence and Technology, Seoul, Korea, 1998.
Paatero, P. and Tapper, U.: Analysis of different modes of factoranalysis as least squares fit problem, Chemometrics and Intelli-gent Laboratory Systems, 18, 183–194, 1993.
Paatero, P. and Tapper, U.: Positive matrix factorization: a non-negative factor model with optimal utilization of error estimatesof data values, Environmetrics, 5, 11–126, 1994.
Paatero, P.: User’s Guide for Positive Matrix Factorization Pro-grams PMF2.EXE and PMF3.EXE, University of Helsinki,Helsinki, 1996.
Paatero, P.: User’s Guide for Positive Matrix Factorization pro-grams PMF2 and PMF3, Part 1: tutorial, 2000.
Paatero, P., Hopke, P. K., Song, X. H., and Ramadan, Z.: Un-derstanding and controlling rotations in factor analytic models,Chemometrics and Intelligent Laboratory Systems, 60, 253–264,2002.
Perry, K. D., Cliff, S. S., and Jimenez-Cruz, M. P.: Evidencefor hygroscopic mineral dust particles from the Intercontinen-tal Transport and Chemical Transformation Experiment, J. Geo-phys. Res., 109, D23S28, doi:10.1029/2004JD004979, 2004.
Polissar, A. V., Hopke, P. K., Poirot, R. L.: Atmospheric aerosolover Vermont: chemical composition and sources, Environ. Sci.Technol., 35, 4604–4621, 2001.
Ramadan, Z., Song, X. H., and Hopke, P. K.: Identification ofsources of Phoenix aerosol by positive matrix factorization, J.Air Waste Manage. Assoc., 50, 1308–1320, 2000.
Ramanathan, V., Carmichael, G., Crutzen, P. J., Holben, B., Prather,K., Prospero, J., Savoie, D., and Schauer, J.: Regional Aeorosol-Chemistry-Climate Observatories for the Indo-Asia-Pacific Re-gion, NOAA, Washington, D.C., accepted, 2003.
Small, M., Germani, M. S., Zoller, W. H., and Moyers, J. L.: Frac-tionation of Elements During Copper Smelting, Environ. Sci.Technol., 15, 299–304, 1981.
Song, X. H., Pollissar, A. V., and Hopke, P. K.: Sources of fineparticle composition in the northeastern US, Atmos. Environ.,
Atmos. Chem. Phys., 6, 211–223, 2006 www.atmos-chem-phys.org/acp/6/211/
J. S. Han et al.: Size-resolved source apportionment of ambient particles 223
35, 5277–5286, 2001.Sun, Y., Zhuang, G., Wang, Y., Han, L., Guo, J., Dan, M., Zhang,
W., Wang, Z., and Hao, Z.: The air-borne particulate pollution inBeijing – concentration, composition, distribution and sources,Atmos. Environ., 38, 5881–6004, 2004.
Swietlicki, E. and Krejci, R.: Source characterization of the Cen-tral European atmospheric aerosol using multivariate statisticalmethods, Nuclear Instrument and Method in Physics ResearchSection B, 109/110, 519–525, 1996.
US EPA (U.S. Environmental Protection Agency): Protocol for ap-plying and validating the CMB model, EPA-450/4-87-010, 1987.
Watson, J. G.: Chemical Element Balance Recetor Model Method-ology for Assessing the Source of Fine and Total Suspended Par-ticulate Matter in Portland, Oregon, PhD Thesis, Oregon Gradu-ate Center, Beaverton, 1979.
Watson, J. G., Chow, J. C., Lu, Z., Fujita, E. M., Lowenthal, D. H.,Lawson, D. R., and Ashbaugh, L. L.: Chemical Mass Balancesource apportionment of PM10 during the Southern CaliforniaAir Quality Study, Aerosol Sci. Technol., 21, 1–36, 1994.
Watson, J. G., Robinson, N. F., Lewis C., and Coulter, T.: Chemicalmass balance receptor model version 8 (CMB8) user’s manual,US EPA/DRI, 1997.
Watson, J. G., Robinson, N. F., Fujita, E. M., Chow, J. C., Pace, T.G., Lewis, C., and Coulter, T. L.: CMB8 Applications and vali-dation protocol for PM2.5 and VOCs, Desert Research InstituteDocument No. 1808.2D1, 1998.
www.atmos-chem-phys.org/acp/6/211/ Atmos. Chem. Phys., 6, 211–223, 2006