size matters: entrepreneurial entry and...
TRANSCRIPT

1
Size Matters: Entrepreneurial Entry and Government
Ruta Aidis*, Saul Estrin**, Tomasz Mickiewicz*
* UCL ** LSE
Abstract
We explore the country-specific institutional characteristics likely to influence an
individual‟s decision to become an entrepreneur. We focus on the size of the government, on
freedom from corruption, and on „market freedom' defined as a cluster of variables related to
protection of property rights and regulation. We test these relationships by combining
country-level institutional indicators for 47 countries with working age population survey
data taken from the Global Entrepreneurship Monitor. Our results indicate that
entrepreneurial entry is inversely related to the size of the government, and more weakly to
the extent of corruption. A cluster of institutional indicators representing „market freedom‟ is
only significant in some specifications. Freedom from corruption is significantly related to
entrepreneurial entry, especially when the richest countries are removed from the sample but
unlike the size of government, the results on corruption are not confirmed by country-level
fixed effects models.
Keywords: entrepreneurship, government, market freedom, corruption
JEL classification codes: L26, P14, P51, P37

2
1. Introduction
Existing research indicates that entrepreneurship and new firm entryi fosters
innovation and development; enhances employment creation; and ensures more equitable
income distribution (Hirschman 1958; Baumol 1990; Acs 2006). However, these benefits
depend on the institutional environment; where institutions are “weak”, entrepreneurs are less
likely to undertake new projects or may instead focus their energies on unproductive ones
(Glaeser et al., 2003; Johnson et al., 1997; Baumol 1990; Hodler, 2009). While there can be
deficiencies in the institutional framework anywhere, it is normally argued that problems are
especially serious in less developed economies. The literature has concentrated on the
weaknesses in the rule of law, high levels of state regulation, and corruption (La Porta et al,
1999; Djankov et al, 2002).
In this paper, we compare the effects of these factors on individual entrepreneurial
activity in the form of new business start-ups in 47 different countries. Using the Global
Entrepreneurship Monitor (GEM) dataset allows us to include all start-ups regardless of the
legal form and to use information about the whole universe of potential entrepreneurs, rather
than just of the existing business owners. In contrast, many existing studies focus on small
enterprises requiring legal registration or on incorporated firms as a proxy for entrepreneurial
activity. Previous studies using GEM have also analysed cross-country variation in
entrepreneurship (see also Schaffer et al 2005). In particular, Wennekers et al. (2005), Van
Stel et al. (2007) and McMullen et al. (2008) use country averages to explore institutional
influences on entrepreneurship. However, the literature has not considered explicitly the
3
impact of particular institutions namely the size of the government, corruption and market
supporting institutions more generally - on the choice of whether an individual will enter the
market as an entrepreneur. Our methodology is akin to the approach adopted by Koellinger
(2008): we merge individual GEM survey data and country-level data from other sources. We
base our study on a conceptual framework which analyses the potential role of the state and
corruption, as well as the quality of market supporting institutions on entrepreneurial entry.
Moreover, we address potential issues of multicollinearity between institutions by using
factor analysis prior to estimating our regression models. This renders results that are more
robust and avoids the ad hoc specifications based on an arbitrary exclusion of indicators. By
using institutional country-level variables as explanatory factors for the individual decision of
a potential entrepreneur, we are also able to overcome the limitation of simultaneity bias
prevalent in entrepreneurship studies based solely on country-level aggregate data.
Analyzing the impact of the institutional environment for entrepreneurship poses a
challenge for both theoretical and empirical research. The former arises because the
conceptual framework linking individual choices to become entrepreneurs with the
institutional environment remains underdeveloped. We build on Williamson‟s (2000) model
of hierarchy of institutions to consider the effects of, in turn: corruption, property rights and
the size of the government sector on entrepreneurship. Institutions are difficult to measure in
practice and the available indicators are often highly correlated with each other, leading to
serious specification dilemmas (Acemoglu and Johnson, 2005), but we employ factor
analysis and use a large variety of indicators to ensure robustness for our findings.
Our work establishes that two institutional dimensions –comprised of a cluster of
variables associated with market supporting institutional quality that we label the market
freedom and the size of the state sector respectively– are associated with the entrepreneurial

4
entry. The negative impact of the size of state is more robust: our results are confirmed by
country-level fixed effects models. The impact of these institutions on entrepreneurship is
shown to be conditional on the stage of economic development: for the richest 10% of
countries little is explained by institutional variation.
In the following section we analyze the effects of key institutions – corruption,
property rights and the size of the state - on entrepreneurship. We also summarize the
findings from the main existing studies so as to frame the current state of knowledge and
identify our contribution. Our approach to quantifying indicators of the institutional
environment is outlined in the third section and the Global Entrepreneurship Monitor dataset
as well as our estimation methods in the fourth. Section 5 discusses our results and the paper
concludes with Section 6.
2. Unbundling Institutions and Entrepreneurship: Theory and Empirics
2.1 Institutional theory and entrepreneurship: an introduction
Organizations set up by entrepreneurs - North‟s main agents of change (1997a) -
adapt their activities and strategies to fit the opportunities and limitations provided through
the institutional framework. Formal rules, designed to facilitate exchange by reducing
transaction costs, are likely to affect individuals or groups in different ways. Since private
interests may differ and individuals, who have their own narrow interests at heart, affect
formal rules and institutions, the latter are not necessarily shaped in the interest of social
well-being (North 1994; Olson, 2000).
Moreover both formal and informal rules can be maintained even if they are
inefficient (DiMaggio & Powell 1983; North 1990). This is because, even when they clash

5
with new formal rules, informal norms have a tenacious ability to survive because they
become habitual behaviour (i.e. culture). In this sense, informal institutions provide a sense
of stability. Second, informal institutions may change more slowly due to path dependence.
This occurs because institutional change is usually incremental and is seldom discontinuous
(North 1990:10). Thirdly, lock-in can occur as a result of a symbiotic relationship between
existing institutions and the organizations that have evolved as a result of the incentive
structure provided by those institutions (ibid. 1990:7).
One can model potential entrepreneurs as maximizing their expected return against
the alternatives when making a decision to start new ventures (Casson, 1982; Parker, 2004).
In contexts where institutions are functioning effectively, the risks primarily stem from the
nature of the ventures themselves and the characteristics of the individuals‟ involved
(Schumpeter, 1934; Kirzner, 1973). However, in a less developed economy, institutions may
not provide sufficient underpinning to the functioning of the market economy and may
influence both the potential returns from entrepreneurial activity and the variance around the
expected income stream.
To organise our discussion of these institutional factors, we rely on the model of
hierarchy of institutions as presented by Williamson (2000, p. 597). We start with the level of
“embeddedness”: corruption, when widespread, may be seen as an informal norm and,
therefore belongs there. Next we move to the level of “formal rules of the game”, and
following Williamson, we take the rules related to property as located at the core of this level,
which may also be labelled „constitutional‟ (see also Olson, 2000). Finally, we move to the
level of governance. Here we first consider “the depth” and quality of governance as
represented by various dimensions of regulation, those related directly to entrepreneurial
6
entry in particular. Next we move to “the scope” of government activity, as proxied by the
extent of state expenditure (and what follows, also by revenues).
2.2. Corruption
In the literature, corruption has been found to reflect the multi-dimensional impact of
poor institutions in developing countries (Tanzi 1998). The significance of corruption as an
indicator of institutional quality arises from the fact that it becomes institutionally embedded;
where widespread it is transformed into a social norm of behaviour, which becomes difficult
to change and responds only slowly to formal institutional reform.
If we take corruption as a more fundamental (and less frequently changing)
phenomenon than regulations, we can account for the inertia in informal institutions, as
highlighted by North (1990). Corruption can become culturally embedded and in that sense
becomes more than an equilibrium response to the current institutional setup. A good
illustration of such a possibility comes from transition economies of Central and Eastern
Europe. Estrin and Mickiewicz (2010) argue that change in informal institutions is socially
embedded in generational change and therefore must be counted in decades rather than years.
However, this interpretation has been brought into question by the finding in Djankov
et al. (2002) that corruption levels and the intensity of entry regulations are positively
correlated. This could suggest that „low level‟ institutional characteristics of governance,
notably an inefficient, over-regulated environment, creates the conditions in which corrupt
practices thrive, especially where officials are endowed with discretionary power. However,
the critical assumption concerns which variables are seen as endogenous. Corruption may be
viewed as endogenous when it is modelled as an equilibrium response to an overregulated
environment (see also Hodler, 2009). We would argue however that the regulatory barriers

7
may be endogenous vis-a-vis corruption because politicians are corrupt and seek to realise
rents. As Shleifer and Vishny noted, corruption '...can also cause leaders of a country to
maintain monopolies, to prevent entry, and to discourage innovation by outsiders if
expanding the ranks of the elite can expose existing corruption practices' (1993:616).
Even where corruption “greases the wheels of commerce”, it typically has a negative
effect on economic development (Wei 2000; Aidt 2009). Corruption is detrimental for
entrepreneurial entry in three ways: it may discourage potential entrepreneurs who are
unwilling to engage in corrupt behaviour from ever starting a business.ii Similarly, it may
encourage unproductive and destructive forms of entrepreneurship (Baumol 1990) and breed
negative societal attitudes towards entrepreneurs. Finally, a corrupt environment may prevent
businesses from growing because they wish to avoid expropriation by corrupt officials,
especially those involved with tax administration (Barkhatova 2000; Aidis and Mickiewicz,
2006). A study by Djankov et al. (2005) in Russia indicates that perceptions of low
corruption combined with a favourable attitude towards entrepreneurship by the general
population and government officials increases both the probability that Russians become
entrepreneurs as well as the length of time they spent as entrepreneurs. A corrupt
environment distorts entrepreneurial opportunities and returns: it facilitates the development
of entrepreneurs willing and able to engage in corrupt practices while acting as a barrier that
hinders the entry or growth of businesses by entrepreneurs who are unwilling to engage in
corrupt practices.
2.3. Property rights
Following Williamson (2000), we see property rights at the core of „high level‟
(constitutional characteristics) of the formal institutional order. North and Thomas (1973),

8
Williamson (1985), Barzel (1997), Rodrik (2000), Acemoglu and Johnson (2005) and others
have argued that property rights systems form the backbone of the modern set of institutions
that characterize the market economy. Within the theoretical framework introduced by
Hodler (2009) which links institutional environment with entrepreneurial outcomes, strong
property rights may be seen as corresponding to low levels of government arbitrariness,
which in turn is related to limits imposed on opportunities for the government actions
influenced by non-welfare enhancing political motives.
Strong formal property rights (which may also be seen as a component of the wider
characteristics of the rule of law) support the broader development of economic property
rights that are defined as “individual ability, in expected terms, to consume the good (or the
services of the asset) directly or to consume it indirectly through exchange” (Barzel, 1997,
p.3). Accordingly, in recent institutional research, the focus shifts from the assignment of
rights and certification to the institutional conditions that make execution of these rights,
especially exchange and other legal contracts based on the property rights, effective. One
important issue relates to the accessibility of these rights to the population as a whole: a
property rights system may work well for the economic elite and remain deficient for the
others (Sonin, 2003).
Recent theories of entrepreneurship emphasise that “the institution of private property
... has an important psychological dimension that enhances our feelings of ... internal control
and personal agency, and it thereby promotes entrepreneurial alertness” (Harper 2003, p. 74).
For entrepreneurship, it is also important that the property rights not only guarantee the status
quo but also include the „find and keep‟ component, which is essential for the aspects of
entrepreneurship related to discovery, innovation and creation of new resources (Harper
2003). Property rights that are well protected help promote entrepreneurship and innovation
9
(Parker 2007: 711). In addition, weaker property rights are likely to foster the development of
predatory forms of entrepreneurial activitiesiii
(Henrekson 2007:730). But if property rights,
such as for intellectual property, are too strong, innovativeness may be reduced (ibid. 731).
2.4. Business Regulations and the Size of the State
Parker (2007) offers an overview of the way in which the various aspects of excessive
business regulation impose costs on entrepreneurs and hamper entrepreneurial activity.
Djankov et al. (2002) also focus on the regulation of entry though they fail to find an
unambiguous direct link between this and entrepreneurial entry. The difficulty arises because
while governance structures may be important for entrepreneurship, the institutional
spectrum becomes very wide at the lower level of governance. Thus, while at the top of
institutional hierarchy, the institutional order focuses on protection of property rights, at the
lower level of governance, the number of regulatory dimensions becomes very large. Hence,
while the impact of individual regulatory measures is difficult to detect, their joint influence
may still be significant. We return to the catalogue of regulatory measures and to the data
reduction methods to deal with this problem in section 3.
One way to address the problem of multidimensionality of governance indicators is to
identify some critical dimension that may cut across all indicators of government activity and
may represent an important institutional aspect affecting entrepreneurship. We posit that the
size of the state may provide us with such an opportunity.
Greater government spending may provide resources to maintain strong institutions,
and thereby reduce barriers to entrepreneurial entry such as weak property rights as well as
eliminating some of the incentives for corruption by ill-paid officials. But it can also create
major new barriers to entrepreneurship development. For example, a greater level of state

10
expenditure implies weaker budget constraints on government spending. This is likely to
create conditions under which political non-welfare-related motives begin to dominate in the
government activity, hampering productive entrepreneurship (Hodler, 2009).
Moreover, a larger state sector may militate against entrepreneurship, both via the
collection of taxes and through its expenditures (Parker 2004). Taxes and welfare provision
may affect entrepreneurial entry via their direct impact on expected returns to entrepreneurial
activity and its opportunity cost. High and increasing marginal level of taxes may weaken
incentives for opportunity-driven entrepreneurship by reducing potential gains, while high
levels of welfare support (and state sector employment) provide alternative sources of income
and therefore by increasing the alternative wage may reduce the net expected return to
entrepreneurship (Parker 2004). In addition, a strong welfare state can reduce the incentives
for necessity entrepreneurs. Henrekson (2005) has shown this to be the case in Sweden,
where the welfare state has had a negative effect on entrepreneurial behaviour both of
opportunity and necessity entrepreneurs. Similarly Koellinger and Minniti (2009) provide
empirical evidence based on data from 16 developed countries that generous unemployment
benefits are negatively related to nascent entrepreneurship: opportunity and necessity
entrepreneurs as well as innovative and imitative entrepreneurs were less likely to engage in
entrepreneurial activities in those developed countries where unemployment benefits were
high.
11
2.5 Existing empirical findings on the determinants of entrepreneurial activity
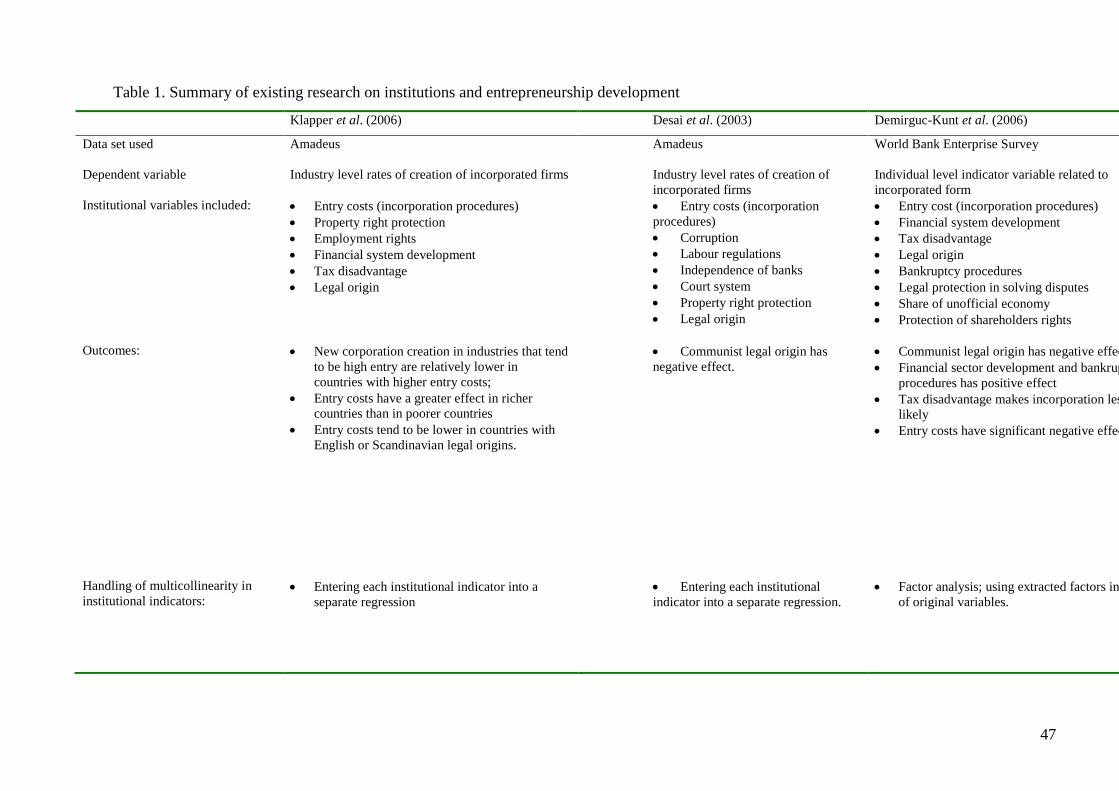
A number of earlier studies have investigated the impact of institutions on
entrepreneurship. The seven main studies vary considerably in their measures of
entrepreneurial activity, institutional variables, methods and results, and the differences are
summarised in Table 1.
Klapper et al. (2006) build on the Djankov et al. (2002). Their study focuses on
incorporated companies and measures the effects of entry costs in terms of complying with
bureaucratic requirements for incorporation on the creation of new firms. The Amadeus data
set is used to compare the entry of incorporated firms in 34 Western and East European
countries and in addition to entry cost, institutional variables, such as property rights
protection and employment rights as well as measures related to the financial and fiscal
aspects of the policy environment are also included. Their results indicate the rate of new
corporation creation in industries that tend to be high-entry is relatively lower in countries
with higher entry costs.
Desai et al. (2003) draw on the same dataset, aggregating company level data to
produce industry level indicators as the units of analysis to study the effects of institutional
indicators on entry. These indicators include: a measure of start-up procedures (from
Djankov et al. 2002), a corruption indicator (from Transparency International), an index of
labour regulations (from Botero et al. 2004), an index measuring the independence of courts
(from the World Bank), a formalism index of the court system (from Djankov et al. 2003)
and a measure of property rights protection (from the World Economic Forum). In order to
address the issue of multicollinearity, Desai et al. enter each institutional indicator into a
separate regression. Their key result, which is in line with Klapper et al. (2006), indicates
that lower rates of entry pertain to Central and East European (post-Soviet) countries.

12
Demirguc-Kunt et al. (2006) also focus on incorporated firms, but adopt a different
methodology and use a different dataset. Instead of looking at industry averages, they
combine country level institutional explanatory variables with firm-level data from the World
Business Environment Survey. Discrete response models are used to investigate which
factors affect the likelihood for companies to be incorporated. They find that developed
financial systems, efficient bankruptcy procedures, lower regulation of corporate entry,
relatively lower corporate taxes in comparison with personal income taxes, and English,
German and Scandinavian legal origin increase the likelihood for firms to be incorporated.
Focusing on entrepreneurs rather than just incorporated firms, Wennekers et al.
(2005) and Van Stel et al. (2007) utilise GEM to explore the relationship between
entrepreneurship levels, economic development and institutional variables. Wennekers et al.
(2005) employ nascent entrepreneurship rates by country as their unit of analysis and use
2002 GEM data from 36 countries. The explanatory variables to capture institutional
variation include income per capita (purchasing power parity), variables measuring
demographics (population growth and education), legal origin (former centralised command
economy origins) and measures of governance/regulation (fiscal legislation, social security
system and administrative requirements for starting a new business). Their results indicate
that there is a positive effect of population growth on entrepreneurship development and
confirm Desai et al. (2003) in that countries with formerly centrally planned economy origins
significantly display lower levels of entrepreneurship development. In terms of institutions,
they find a negative effect of social security but a positive effect of tax revenues as a
percentage of GDP on nascent entrepreneurship. They point out that the latter result may be
consistent either with incentives for tax avoidance / evasion or with high-tax countries
spending more on infrastructure providing a better environment for new firms.

13
Van Stel et al. (2007) analyse the effect of a particular set of business regulations on
nascent entrepreneurs and young businesses (defined as less than 42 months old). They draw
on a broader country range of GEM data (2002 - 2005 for 39 countries) and also base their
analysis on aggregate mean values. Their measurement of business regulations is drawn from
the World Bank‟s Doing Business indicators and uses five categories: (1) starting a business,
(2) hiring and firing workers, (3) obtaining credit, (4) paying taxes and (5) closing a business.
Their results indicate that both minimum capital requirements and labour market rigidity
have a negative effect while private bureau coverageiv
(i.e. availability of credit information)
has a positive effect on nascent entrepreneurship rates. They also show that countries with
more nascent entrepreneurs tend to have more young businesses, supporting the notion that
more nascent entrepreneurs translates into more actual entrepreneurship.
Klapper et al. (2007) is based on the largest country sample (76 countries), utilising
the World Bank Entrepreneurship Survey. The database focuses on registered businesses
only, and, as the authors note, it is not a legal obligation to register some forms of businesses
in some countries. Not surprisingly, in contrast to studies based on more encompassing GEM
data, the authors find a positive association between registration rates and income per capita:
more formalisation and better coverage of registration of businesses is characteristic of
wealthier countries. The strongest result on determinants of registration rates relates to the
positive impact of finance. However, as the authors are aware, using country averages, one
cannot rule out reverse causality, as a greater number of registered companies alleviate
informational asymmetries between providers of finance and businesses, perhaps leading to
standardisation of lending procedures, and therefore creating better conditions for the
development of the financial sector.
Finally a recent study by McMullen et al. (2008) focuses on the institutional
14
determinants for opportunity driven and necessity driven entrepreneurial entry. The authors
estimate models using the individual dimensions of the Wall Street Journal and Heritage
Foundation indicators of economic freedom. These indicators are used in separate equations
as well as jointly in a single equation (with the logarithm of GDP per capita used as a control
variable). The results provide evidence that property rights are significant for opportunity
driven entry but not for necessity driven entry. Notably for future research, McMullen et al.
(2008) recommend the application of factor analysis to the Heritage Foundation indicators; a
proposal that we adopt in this paper.
Table 1 summarises these studies in terms of the data sets used, the dependent
variables chosen, their main outcomes and their estimation model limitations.
Multicollinearity and omitted variables pose an important limitation in all of these studies.
Klapper et al. (2006) and Desai et al. (203) run separate regressions for each institutional
indicator in order to address the problem of multicollinearity. This is a reliable exploratory
methodology, which may help in rejecting irrelevant factors but does not provide insights as
to the comparative impact of each of the significant factors. It may also lead to spurious
results; when a variable is used which is strongly correlated with an omitted variable, the
coefficients are estimated in an inconsistent way (Acemoglu, 2005).
Demirguc-Kunt et al. (2006) combine individual level outcomes with country level
variablesv. This is the methodology we adopt, while focusing on the whole universe of
potential entrepreneurs rather than existing business owners or just registered entrants. We
also use factor analysis to address the collinearity problems in measuring institutional quality
and also consider explicitly the size of the state as well as levels of corruption.

15
-------------------------------------------
INSERT TABLE 1 ABOUT HERE
-------------------------------------------
3. Quantifying Institutional Indicators
In this section, we describe the measures employed in our empirical work to quantify
the institutional environment and the methodologies used to tackle multicollinearity. Our
approach is to apply a data reduction technique – factor analysis – and we report the findings
from this methodology. In the next section, we consider the remaining data used in our study.
There is no single universally accepted set of indicators for cross-country institutional
quality and as indicated above a number of different variables have been used. We adopt the
variables used by McMullen et al. (2008) which originate from the Heritage Foundation /
Wall Street Journal set of institutional indicators. Though other indicators exist, the Heritage
Foundation/Wall Street Journal's indicators are unique in providing the broadest coverage
and containing the largest number of countries and years.vi
Other studies conducting
comparable empirical analysis have successfully utilised the Heritage Foundation/Wall Street
Journal's indicators (Doucouliagos and Ulubasoglu 2006; Heckelman 2000; Han and Sturm
2000). The Heritage Foundation offers fifty independent indicators grouped into ten broad
institutional categories related to: trade policy, fiscal burden (including marginal tax rates),
size of the government sector (government spending) in the economy, monetary policy
(control of inflation), constraints on foreign investment, direct state involvement in banking
and finance and regulatory restrictions that go beyond prudential supervision, regulation of
labour (employment and wages)vii
, security of property rights, business regulations (which
include entry barriers), and freedom from corruption. These ten categories are intended to
outline the institutional factors that taken together determine the degree to which economic

16
actors are free to respond to changing world market conditions (see Beach and Kane (2007)
for a more detailed discussion).
“Property rights” in the Heritage Foundation index comprises seven areas: (1)
Freedom from government influence over judicial system; (2) Commercial code defining
contracts; (3) Sanctioning of foreign arbitration of contract disputes; (4) Government
expropriation of property; (5) Corruption within the judiciary; (6) Delays in receiving judicial
decisions and/or enforcement, and (7) Legally granted and protected private property. Thus,
consistent with De Soto (2001) and Barzel (1997), the indicator of property rights protection
includes both low risk of expropriation and security of contracts, and remains closely related
to the slightly more general concept of the “rule of law.”
We have noted that multicollinearity is a serious issue in institutional analysis,
because of the abundance of closely related indicators. Theory can guide us on the relative
importance of different institutional dimensions but is of limited assistance when considering
the choice of alternative measures for related institutional features. We apply factor analysis
to tackle the problem, utilising the entire dataset (1995-2008 including 164 countries and nine
indicators) available on the Heritage Foundation‟s website.viii
By ordering the extracted
factors according to the magnitude of their eigenvalues we produced the following screeplot.
--------------------------------
FIGURE 1 ABOUT HERE
--------------------------------
There is a distinct break after the second factor, as the eigenvalue drops from 1.30 to 0.27.
Accordingly, following the standard practice (see Russell, 2002; Pett et al., 2003; Costello

17
and Osborne, 2005) we retain the first two factors.ix
We next apply oblique rotation (via
oblimin method), producing the following factor loadings illustrated by Figure 2 below.x
--------------------------------
FIGURE 2 ABOUT HERE
--------------------------------
While Heritage Foundation and Wall Street Journal aggregate their indicators into one
average measure of „economic freedom‟, our results demonstrate that the set of indicators has
more than one dimension and enforcing a one-dimensional scale on it may not be a valid
technique. We need to look more closely into what are the dimensions suggested by factor
analysis.
Figure 2 reveals that the property rights indicator has the highest loadings on the first
factor, which itself explains most of the institutional variance. "Freedom from corruption",
ranks as the second highest loadings on the first factor. Most of other institutional indicators
measuring various dimensions of regulation are clustered around these. Thus, most but not all
of the Heritage-Wall Street Journal indicators are located here. We therefore label the first
factor as market freedom, to relate it but also distinguish from the label of „economic
freedom‟ used by Heritage-Wall Street Journal.
In Figure 2 we also see that the dimensions ”fiscal freedom” and the size of the
government expenses in GDP should both be considered separately from the other
institutional factors. They form the second factor that we label (limited) size of state sector.
While the impact of taxes and the impact of government expenses (including welfare) on
entrepreneurship can be separated conceptually, they are obviously connected empirically via
18
the size of the state budget, and in practice their independent effects prove difficult to
identify.xi
Linking our results to the discussion in Section 2, we note that out of the four
institutional dimensions identified using Williamson's (2000) framework, for our data the
first three (freedom from corruption, property rights, measures of regulation) are difficult to
disentangle empirically, while the fourth (government size) stands apart.
--------------------------------
FIGURE 3 ABOUT HERE
--------------------------------
In Figure 3, we show the country - specific factor scores, finding the Scandinavian
countries, Belgium, Netherlands and Germany to be located in the upper left corner, with
market freedom and an extensive state sector. In contrast, Hong Kong and Singapore are two
economies which combine market freedom with a small state sector. The Anglo-Saxon
economies are located in between, characterised by conditions of market freedom and a mid-
sized state. In contrast, Latin American countries (with the notable exception of Chile),
Russia, China and India are all countries where the size of government spending and taxation
remains relatively low, but market freedom is weak. The weak negative correlation between
the two factors is driven by the fact that there are no countries in the lower left corner of the
graph. To explain this, we may notice that the factor we labelled „market freedom‟ (low
corruption, low degree of arbitrariness in the executive branch of the government, more
limited and more functional regulations) may also be taken as a measure of institutional
quality. This suggests that, paradoxically, a large state sector cannot be built where
19
institutional quality is low, perhaps because the latter affects the state‟s capacity to collect
taxes.
Another way of interpreting the relationship between the two factors is through the
Acemoglu and Verdier (2000) model, which stipulates that while state intervention may have
a positive overall impact, some corruption may be unavoidable to achieve an efficient
outcome in the feasible range. This would imply a positive correlation between the two
factors, at least over some section of the distribution: a larger state sector would be associated
with greater corruption leading to an ordering of observations along the diagonal. However,
this is not what we observe. Rather, the findings in Figure 3 are more consistent with
Hellman et al. (2003): in the countries with a large state sector, corruption may be lower,
perhaps because special interests become directly embedded within the state sector (see also:
Mickiewicz 2009). Acemoglu and Verdier‟s (2000) perspective is motivated by the efficiency
theory of institutions, which assumes that institutional outcomes have some traits of efficient
feasible solutions. In contrast, Botero et al. (2004) argue that institutional outcomes may also
be explained using political theories (assuming some entrenched special interests) and by
institutional inertia (as represented by legal origin). As noted above, inefficient economic
institutions may persist and both political factors and institutional continuity can contribute to
this outcome. This theoretical perspective is consistent with the ordering of both factors that
results from our factor analysis.
Given the importance of corruption in our analysis, we next explore if the
relationship in Figure 3 holds when factor scores are replaced by the two individual source
indicators taken from the Heritage-Wall Street Journal dataset. Accordingly, we plot in
Figure the relationship between the variable 'freedom from corruption' and 'government size'.
The results are consistent with Figure 3 but stronger; a weak negative correlation in Figure 3

20
(correlation coefficient: 0.07) becomes somewhat stronger in Figure 4 (coefficient at 0.22).
Institutional theory proves useful in interpreting the results. At the bottom, we have countries
with weak institutions and small government size (such as Mexico, Thailand and South
Africa). In contrast, lower levels of corruption are also related to larger government size in
countries such as Sweden and Denmark. Again, this interpretation runs against Acemoglu
and Verdier‟s (2000) model, and is consistent with our interpretation of corruption. It also
allows for reverse causality: it may be corruption that makes large government impossible, as
argued above. Thus though the redistributive aims of many Latin American governments
may be comparable to those held by Scandinavian politicians, Latin American governments
may be constrained by their institutional capacity to implement those policies.
--------------------------------
FIGURE 4 ABOUT HERE
--------------------------------
We have shown that the correlations between the factors and between the single measures of
corruption and government size are limited, enabling us to identify their separate impacts on
entrepreneurship. Moreover, the ordering of countries along the diagonal in Figure 4 is
partially driven by the level of development. Hence, it is important to control for this in our
empirical work.

21
4. Data and Estimation Methodology
4.1 Individual Level Data
Our individual level data are drawn from GEM and are generated through surveys creating
stratified samples of at least 2,000 individuals per country. The sample is drawn from the
whole working age population in each participating country and therefore captures both
entrepreneurs and non-entrepreneurs. Entrepreneurial activity in this paper is new, nascent
start-up activity, defined as those individuals between the ages of 18 – 64 years who have
„taken some action‟ toward creating a new business in the past year, and expect to own a
share of those businesses they are starting, which must not have paid any wages or salaries
for more than three months (Reynolds et al., 2005; Minniti et al., 2005b). In contrast,
established entrepreneurs are defined as individuals who own or manage a company and have
paid wages or salaries for more than 42 months (ibid.). We utilise all available GEM data
from the 1998-2005 surveys. Our survey database includes 47 individual country samples.
Additional data details are reported in Table 2.
4.2. Control variables
Apart from the institutional variables discussed above, we control for the level of
economic development as well as personal characteristics of entrepreneurs that might affect
entrepreneurial entry. Commencing with cross- country characteristics, a number of studies
have documented the existence of a relationship between entrepreneurial activity and
economic development (Wennekers et al. 2005; Carree et al. 2002; Acs et al. 1994), for
which we control by including a measure of per capita GDP (purchasing power parity).

22
Similar to McMullen et al. (2008), we found that the curvilinear relationship represented by
natural logarithm of GDP per capita (p.c.) fits the data best. We also verified that using both
GDP p.c. and GDP p.c. squared does not alter our main results; we do not report these
equations because overall they perform worse than when the natural logarithm of GDP p.c. is
used.xii
In addition, the link between the overall (cyclical) economic performance in a country
and the incentives to entrepreneurial entry are often discussed. Two conflicting effects may
occur, and it is difficult to decide a priori which has the stronger impact. On the one hand,
entrepreneurship may be „recession-push‟, as the opportunity cost of entrepreneurial entry is
lower when existing firms are not expanding, which reduces new job openings. On the other
hand, there may be also „prosperity-pull‟ effect; that is, a growing economy leads to larger
expected gains from entrepreneurial activity (Parker, 2004). The rate of economic growth has
been shown by Van Stel et al. (2007) to have a positive effect on the rate of opportunity
entrepreneurship. Some ambiguity in these results is resolved by Koellinger and Thurik
(2009), who demonstrate that time gaps should be taken into account. Following them, we
include GDP growth as a control variable but lag it one year.
The scale of entrepreneurial activity is also influenced by the supply of finance. An
efficient system of property rights may be a necessary but is not a sufficient condition for a
well-developed financial system. One can find countries which have implemented a relatively
efficient system of property rights, while their financial system remains underdeveloped, for
example some of the countries that switched from a command to market economy. In these
cases, entrepreneurs may be unable to carry through their projects, either because the cost of
finance is too high or because they face binding financial constraints (Gros and Steinherr,
2004; Mickiewicz, 2005). The findings on this issue in the empirical literature are mixed.

23
Grilo and Irigoyen (2006) report a negative effect of the perception of lack of finance on the
probability of being self-employed, while Grilo and Thurik (2005) are unable to identify any
effect. The ambiguity may result from the fact that entrepreneurs often substitute financial
resources from the informal sector for those from the formal sector (Korosteleva and
Mickiewicz, 2008). We found that polynomial representation has the best fit for the data and
we report the set of results based on this.
It would be ideal to control for individual differences in access to finance, because
Evans and Jovanovic (1989) show that capital constraints lead to a positive relationship
between the probability of becoming self-employed and the assets of the entrepreneur.
Similarly, Evans and Leighton (1989) show that the exploitation of entrepreneurial
opportunities is more common when people have greater financial capital (see also: Hurst
and Lusardi (2004)). However, our data set does not offer a reasonable proxy, though we
capture an aspect of the individual's financial position by using a dummy variable which
indicates if a potential entrepreneur had been providing funds for business financing in the
past.
We also control for individual personal and factor supply characteristics, including
gender, age and human capital. Most research indicates that men have a higher probability of
becoming entrepreneurs than women (Minniti et al. 2005a; Verheul et al. 2006; Reynolds et
al. 2002). The relationship between entrepreneurship and age is typically found to be inverse-
U -shaped, with the maximum found at a relatively young age (Levesque and Minniti, 2006).
Findings on human capital are an important area of research in terms of its
relationship to entrepreneurship; though the results for developed economies measured in
terms of education are mixed. Robinson and Sexton (1994) and Cooper and Dunkelberg
(1987) find that the decision to become self-employed is influenced by education while the

24
results of Delmar and Davidsson (2000) and Davidsson and Honig (2003) establish the
significance of education for nascent entrepreneurs and Parker (2004) shows that
entrepreneurs tend to be more educated than non- entrepreneurs.
Wennekers et al. (2005) found a significant and positive relationship between the
number of incumbent business owners and entrepreneurial start-ups. Role models may for
example help by providing information, which alleviates both uncertainty and the cost of
starting the business (Minniti, 2005). We therefore also control for whether the potential
nascent entrepreneur knows any other entrepreneurs. Another factor that may affect start-up
rates in different economic settings is whether the entrepreneur is employed while starting
their business, and we include a variable indicating if the individual is in employment.
Definitions and descriptive statistics for all variables, including nascent
entrepreneurship, are presented in Table 2.
-------------------------------------------
INSERT TABLE 2 ABOUT HERE
-------------------------------------------
4.3 Framework for analysis
If i denotes individuals, j denotes countries and t denotes time, we estimate an
equation of the form:
entijt = f(Market freedomjt, , Size of State Sectorjt, GDP/capitajt, GDP growth ratejt,
Availability of Financejt, Individual Level Controlsjit),
25
where ent is a dummy variable denoting whether or not an individual in a particular country
at a particular date is engaged in nascent start up activity. We use Probit as our estimator,
reporting robust standard errors. We also report marginal effects instead of coefficients. We
allow for the possibility that the observations are not independent for each country-year
sample in our dataset. This is reflected in the estimated variance-covariance matrix and
reported coefficients and we also cluster standard errors on country-years. Given the sample
size, all our standard errors would be artificially suppressed and many country level variables
would become significant without this correction. As an alternative strategy, we also applied
specifications including a full set of country and year fixed effects. Unsurprisingly, these
models were not reliable and the overall Wald statistics could not be produced. This is
because the sample is highly unbalanced and the institutional indicators do not vary greatly
over time, which makes it difficult and inappropriate to estimate a fixed effects model.
Moreover, institutional indicators are assessed with a measurement error, and there are
probably lags between the actual phenomena and perceptions. For instance, it is likely that
perceptions of corruption follow actual corruption with lags, and the length of these may
vary. In order to alleviate this problem, all the country level variables are loaded with a one
year lag.
Our estimation strategy is as follows: first we estimate the model including the two factors
obtained by data reduction methods: market freedom and size of state sector (Table 3, model
(1)). To explore the relationship between the level of development and the institutional
variables, we then estimate the same model excluding 10% of the sample corresponding to
the richest countries (Table 3, model (2)).xiii
To consider more carefully the individual institutions behind our “factors”, we re-
estimate the two models described above replacing the factors with each of the ten underlying
26
„economic freedom‟ indicators. We limit our presentation of these results to the combinations
which were most significant: these proved to be „the size of the government‟ indicator
(retaining reverse ordering, as is presented in the original data) and 'freedom from corruption'
(Table 3, models (3) and (4))xiv
.
To check robustness of our indicators, we report two models where the two factors
are replaced with alternative indicators (Table 3, models (5) and (6)). First, the market
freedom is replaced with an indicator for the "effective constraints on the executive branch of
the government" obtained from the Polity IV dataset (Marshall and Jaggers 2007).xv
Acemoglu and Johnson (2005), argue that the effective constraints on the discretionary power
of the executive branch of the government serves as a good overall proxy for the protection
of property rights. We also replace the size of state sector factor with a variable, the "ratio of
government expenses to GDP", as reported in the World Bank "World Development
Indicators".
Finally, as a further robustness check, we run a fixed effects model with robust
standard errors on country level averages, which are available for a longer time span (that is
for 1999-2009) from GEM. Our dependent variable is now the proportion of respondents
involved in a start-up activity („nascent entrepreneurs‟); alternatively, we also use a different
functional form with better distributional characteristics, transforming this measure into
logarithms. On the right hand side, we include freedom of corruption, size of the government,
and control for the logarithm of GDP per capita (purchasing power parity) and GDP rate of
growth, which we continue to lag one period to alleviate simultaneity bias.
27
5. Results and discussion
5.1. Specifications and empirical results
------------------------------------------------
INSERT TABLE 3 ABOUT HERE
------------------------------------------------
Table 3 presents the six estimation modelsxvi
. We observe in the first two models that
the two institutional factors have the expected signs but different levels of significance. In
particular, the market freedom is insignificant when the total country sample is used, though
when the richest countries are removed, it becomes weakly significant. The size of state
sector factor is positive and highly significant in both specifications. These are our central
results and the remaining regressions explore their robustness and implications.
To ensure our results are not an artefact of the use of factor analysis, we entered all
the institutional variables separately instead. Due to limitations of space, we focus on the
most significant indicators. Reassuringly, these prove to be, first, "freedom from corruption"
and the "the government size" (i.e. individual Heritage indicator, not to be confused with the
factor used previously, size of state sector), coded in reverse order by the Heritage
Foundation i.e. with lower values representing more government spending. These regressions
are reported in models 3 and 4. These confirm our previous results; both the size of the
government and freedom from corruption variables are found to be significant, with the latter
increasing in significance from model 3 to model 4 where the richest 10% of the countries
have been removed.
In models 5 and 6 we use alternative indicators of institutions, drawn instead from
Polity IV, with "constraints on executive" as an alternative measure of the market freedom.
As previously, the results suggest that the link between market freedom and entrepreneurship

28
is weak; the variable is marginally significant for the whole sample (model 5) but marginally
insignificant when the richest countries are excluded (model 6). On the other hand, the
estimated coefficients on government expenses remain highly significant in both models.xvii
Finally, the results of our robustness check using fixed effects model is reported in
Table 4. We find that both freedom of corruption and government size retain their signs, but
only the latter is significant. If corruption is a slowly evolving embedded informal norm, the
within variation captured by fixed effects will be largely driven by measurement errors, so it
is unsurprising that the corresponding coefficient becomes insignificant. Nevertheless, the
identification problem remains: there may be other dimensions of long term institutional
embeddedness apart from corruption that we do not include. Therefore, this strong robustness
check confirms our results on government size, but leads to some caution in relation to our
previous results on corruption.
Our results with respect to the control variables largely conform with those in the
literature. As shown previously (e.g. Wennekers et al., 2005) the relationship between the
level of economic development and entrepreneurship is negative and non-linear; a
logarithmic function performs best with our data. We also confirm that access to finance is
important for entrepreneurial activity (Klapper et al, 2006); formal finance is less important
in poor countries, but becomes increasingly significant at the higher stages of economic
development (Demingucr-Kunt et al, 2008). At lower levels of development, the impact of
credit to private sector on entrepreneurship is negative, perhaps because it is crowding out
informal finance, though it becomes positive at higher levels of GDP per capita (Wennekers
et al, 2005). Credit provision becomes insignificant once we eliminate the richest countries.
29
Men and current owners are significantly more likely to start new businesses (Minniti
et al, 2005a), as are people who provided finance as business angels in the past (Mickiewicz,
2005). We also confirm the relevance of business networks: individuals who know other
entrepreneurs are significantly more likely to start a new business. This result is not
surprising given that a number of studies have identified the importance of entrepreneurial
networks for opportunity recognition (Hills et al. 1997; Singh et al. 1999) and entrepreneurial
alertness (Ardichvili et al. 2003). However networks developed in weak institutional
environments may not complement markets (creating synergies) but substitute for them,
creating transaction costs. As a result, much networking activity may not be productivity-
enhancing (Aidis et al. 2008: 670). Human capital as measured by post-secondary and higher
education has a significantly positive impact on entrepreneurial entry (Davidsson and Honig,
2003). Finally we confirm a significant, quadratic effect for age in our regression models,
implying that in the relevant range older people are less likely to become entrepreneurs
(Levesque and Minniti, 2006).

30
5.2 Discussion
Our analysis provides insights into the effect of variations in institutional quality on
entrepreneurial entry. We identify a significant and robust negative relationship between the
size of the state sector and entrepreneurship. Moreover, freedom from corruption has a
positive and significant impact on entrepreneurial entry, albeit this result is slightly less
robust. However, contrary to some previous findings (Van Stel, 2007; McMullen et al,
2008), potential entrepreneurs are only marginally influenced by market freedom, especially
if they do not reside in the sample's richest countries.
Future researchers may wish to distinguish more carefully between institutions and to
extend our framework to alternative forms of entrepreneurship, such as potential
entrepreneurs, existing entrepreneurs or high growth entrepreneurs. Whereas existing
entrepreneurs and high growth entrepreneurs may be more significantly influenced by the
quality of property rights, our analysis indicates that this may play less of a role for nascent
entrepreneurs, especially in more developed economies. Similarly, while current
entrepreneurs may have learned to function in their existing institutional environment, even
where corruption is prevalent, our results indicate that entrepreneurial entry is greater where
there is less corruption. In addition, the results suggest that the perceptions of corruption play
a significant role in reducing entrepreneurial aspirations, a view consistent with other studies
(Djankov et al. 2005; Aidis and Mickiewicz, 2006; Aidis and Adachi 2007; Aidis et al.
2008).
Our main result concerning the impact of the size of the state sector abstracts from
some important issues; the characteristics of the state sector as well as its size are important.
Baumol et al. (2007) argue against welfare provision based on employment status as this
discourages movements from employment towards entrepreneurship. Thus, some of the key
31
policy discussions with respect to the state sector and entrepreneurship should be about its
design as well as its size.
Our analysis is subject to a number of limitations. Firstly, though the GEM data
provides excellent uniform data for cross-country comparisons, there is potential sample
selection bias because, given the cost of conducting a GEM country survey, few participating
countries have very weak institutions. Thus our results more accurately pertain to middle and
high income countries. Moreover, from the perspective of institutional change, the data are
only available for relatively few years, we may not have sufficient inter-temporal variation
to be confident that causality runs from institutional quality to entrepreneurship rather than
vice versa. These issues must be addressed further in the future as additional years of data
become available.
6. Conclusions
When the size of the government is considered from a theoretical perspective, one
could argue that a larger government may be associated with better conditions for
entrepreneurship. More extensive government spending may create a basis for stronger
institutions, funding law and order enforcement systems that protect contracts and supporting
infrastructure that may enhance entrepreneurship. Conversely, lower government spending
might weaken the business environment. However, we do not observe this positive
relationship over the empirical range of current economies. In contrast, we find a robust
negative relationship between the size of the government and entrepreneurial entry.
Consistent with earlier findings (Parker, 2004; Henrekson, 2005; Koellinger and Minniti,
2009), we argue that an extensive welfare state supported by high level of taxation reduce the
incentives for nascent entrepreneurs. This in turn, has wider implications for economic

32
development.
Our findings also have implications for policy-makers. We have found that that
individual choice to become an entrepreneur is heavily dependent on two aspects of the
business environment: on the size of the state sector and – based on somewhat weaker results
– on freedom from corruption. Policymakers might benefit from focusing their attention on
the elements of the institutional environment that are most critical at a given level of
economic development in their efforts to enhance entrepreneurial activity. Reducing
corruption is important but we have argued that corruption is not just a rational choice
response of economic actors but also an embedded informal institution. Hence, its
eradication cannot be achieved solely through better monitoring and by institutional design to
improve bureaucratic procedures. In addition, one needs to target deeper issues of social
attitudes and values, and to influence those through the educational system and media
awareness. Moreover, at every level of economic development, increasing the size of the
state sector reduces the incentives to be entrepreneurial. This trade-off needs to be taken into
consideration when making policy choices: policies to increase the fiscal role of the state are
in direct conflict with aspirations to create a more entrepreneurial society. In a global
perspective, it is South-East Asia, characterised by limited fiscalism and dynamic
entrepreneurial sectors that offers clear lessons for policy-makers.
33
References
Acemoglu, D. (2005). Constitutions, Politics and Economics: A Review Essay on Persson
and Tabellini‟s The Economic Effect of Constitutions. Journal of Economic Literature, 43,
1025-1048
Acemoglu, D., Johnson, S. (2005). Unbundling Institutions. Journal of Political Economy,
113, 949-995.
Acemoglu, D., Verdier, T. (2000). The Choice Between Market Failures and Corruption.
American Economic Review, 90, 194-211.
Acs, Z. (2006). Start-ups and Entry Barriers: Small and Medium-sized Firms Population
Dynamics. In: M. Casson, B. Yeung, A. Basu & N. Wadeson (2006). The Oxford Handbook
of Entrepreneurship. Oxford: Oxford University Press. 194-224.
Acs, Z., Audretsch, D. (2003), Handbook of Entrepreneurship Research, New York:
Springer.
Acs, Z., Audretsch, D., Evans, D. (1994). Why does the self-employment rate vary across
countries and over time?. Discussion Paper 871. CEPR, London
34
Acs, Z., Szerb, L. (2009). The Global Entrepreneurship Index (BEINDEX) and Stages of
Economic Development. George Mason University and Univerisity of Pécs. Mimeo.
Aidis, R., Adachi, Y. (2007) Firm Entry and Survival Barriers. Economic Systems, 31, 391-
411.
Aidis, R., Mickiewicz, T. (2006). Entrepreneurs, Expectations and Business
Expansion: Lessons from Lithuania. Europe Asia Studies, 58 (6), 855-880.
Aidis, R., Estrin, S., Mickiewicz, T. (2007). Entrepreneurship, Institutions and the Level of
Development. Working Paper 103. Retrieved October 19, 2007 from
http://www.tiger.edu.pl/publikacje/twp103.pdf
Aidis, R., Estrin, S., Mickiewicz, T. (2008). Institutions and Entrepreneurship Development
in Russia: A Comparative Perspective. Journal of Business Venturing, 23, 656-672.
Aidt,T. (2009) Corruption, institutions and economic development. Oxford Review of
Economic Policy. 25(2) 271-291.
Ardichvili, A., Cardozo, R., Ray, S. (2003) A Theory of Entrepreneurial Opportunity
Identification and Development. Journal of Business Venturing, 18(1), 105-123.
Barkhatova, N. (2000) Russian Small Business, Authorities and the State. Europe-Asia
Studies 52, 657-676.

35
Barzel, Y. (1997). The Economic Analysis of Property Rights (Cambridge: Cambridge
University Press).
Baumol, W. (1990). Entrepreneurship: productive, unproductive, and destructive. Journal of
Political Economy, 98, 893-921.
Baumol, W., Litan, R. Scharamm, C. (2007). Sustaining Entrepreneurial Capitalism.
Capitalism and Society, 2, 1-38.
Beach, W. & Kane, T. (2007) Methodology: Measuring the 10 Economic Freedoms.
Washington: The Heritage Foundation. Retrieved March 5, 2009 from
http://www.heritagefoudation.org
Botero, J., Djankov, S. La Porta, R., Lopez-de-Silvanes, F., Shleifer, A. (2004). The
Regulation of Labor. Quarterly Journal of Economics, 119, 1339-1382.
Carree, M., van Stel, A., Thurik, R., Wennekers, S. (2002). Economic Development and
Business Ownership: An analysis using data of 23 OECD countries in the period 1976 –
1996. Small Business Economics, 19, 271 – 290
Casson, M. (1982). The Entrepreneur. An Economic Theory (Oxford: Martin Robertson).
36
Cooper A.C. & Dunkelberg, W.C. (1988). Entrepreneurial Research: Old Questions, New
Answers and Methodological Issues (West Lafayette, Indiana: Purdue University, Krannert
Graduate School of Management)
Costello, A., Osborne, J. (2005). Best Practices in Exploratory Factor Analysis. Practical
Assessment, Research & Evaluation, 10, 1-9.
Davidsson, P., Honig, B. (2003). The Role of Social and Human Capital among Nascent
Entrepreneurs. Journal of Business Venturing, 13, 301-331
Delmar, F., Davidsson, P. (2000). Where do they come from? Prevalence and
characteristics of nascent entrepreneurs. Entrepreneurship and Regional Development, 12,
1-23
Demirguc-Kunt, A., Love, I., Maksimovic, V. (2006). Business Environment and the
Incorporation Decision, Journal of Banking and Finance, 30, 2967-2993
Desai, M., Gompers, P., Lerner, J. (2003). Institutions, Capital Constraints and
Entrepreneurial Firm Dynamics: Evidence from Europe. Harvard Negotiation, Organizations
and Markets Research Papers 03-59.
De Soto, H. (2001). The Mystery of Capital (London: Black Swan).

37
DiMaggio, P., Powell, W. (1983). The Iron Cage Revisited: Institutional Isomorphism and
Collective Rationality in Organizational Fields. American Sociological Review, 47, 147-160
Djankov, S., La Porta, R., Lopez-de-Silanes, F., Shleifer, A. (2002). The Regulation of
Entry. Quarterly Journal of Economics, 107, 1-37
Djankov, S., La Porta, R., Lopez-de-Silvanes, F., Shleifer, A. (2003). Courts. Quarterly
Journal of Economics, 118, 453-517
Djankov, S., Miguel, E., Qian Y., Roland, G., Zhuravskaya, E. (2005) Who are Russia's
Entrepreneurs? Journal of European Economics, 3(2-3) 587-597.
Doucouliagos, C., Ulubasoglu, M.A. (2006) Economic Freedom and economic growth: Does
specification make a difference? Journal of Political Economy, 22, 60 - 81.
Estrin, S. and T. Mickiewicz (2010) Entrepreneurship in Transition Economies; The Role of
Institutions and Generational Change, in: M. Minniti (ed.) The Dynamics of Entrepreneurial
Activity (Oxford: Oxford University Press).
Evans, D., Jovanovic, B. (1989). An Estimated Model of Entrepreneurial Choice Under
Liquidity Constraints‟. Journal of Political Economy, 97, 808 – 827
Evans, D., Leighton L. (1989). Some Empirical Aspects of Entrepreneurship. American
Economic Review, 79, 519 – 535

38
Fabrigar, L., Wegener, D., MacCallum, R., Strahan, E. (1999) Evaluating the use of
exploratory factor analysis in psychological research. Psychological Methods, 4, 272-299.
Glaeser, E., J. Scheinkman, Shleifer, A. (2003). Injustice of inequality. Journal of Monetary
Economics, 50, 199-222
Grilo, I., J. Irigoyen (2006). Entrepreneurship in the EU: to wish and not to be. Small
Business Economics, 26, 305-318
Grilo, I., Thurik, R. (2005). Latent and actual entrepreneurship in Europe and the US.
International Entrepreneurship and Management Journal, 1, 441 – 459
Gros, D., Steinherr, A. (2004). Economic Transition in Central and Eastern Europe
(Cambridge: Cambridge University Press).
Haan, J. de, Sturm, J.E. (2000) On the relationship between economic freedom and economic
growth. European Journal of Political Economy, 16, 215-141.
Harper, D. (2003) Foundations of Entrepreneurship and Economic Development, Abingdon:
Routledge.
Heckelman, J.C. (2000) Economic Freedom and Economic Growth: A Short-Run Causal
Investigation. Journal of Applied Economics, 3(1) 71-91.
39
Hellman, J., Jones, G., Kaufmann, D. (2003) Seize the State, Seize the Day: State Capture
and Influence in Transition Economies, Journal of Comparative Economics, 31, 751-773.
Henrekson, M. (2005) Entrepreneurship: A Weak Link in the Welfare State. Industrial and
Corporate Change, (14)3, 437-467.
Henrekson, M. (2007) Entrepreneurship and Institutions. Comparative Labor Law and Policy
Journal, 28, 717-742.
Hills, G.E., Lumpkin, G.T., Singh, R.P. (1997) Opportunity Recognition: Perceptions and
Behaviours of Entrepreneurs. Frontiers of Entrepreneurship Research. Babson College,
Wellesley, MA.
Hirschman, A. (1958). The Strategy of Economic Development (New Haven: Yale University
Press)
Ho, Y., Wong, P. (2007). Financing, Regulatory Cost and Entrepreneurial Propensity, Small
Business Economics, 28, 187-204
Hodler, R. (2009). Industrial Policy in an imperfect world. Journal of Development
Economics, 90, 85-93.

40
Hurst, E., Lusardi, A. (2004). Liquidity Constraints, Household Wealth and
Entrepreneurship. Journal of Political Economy, 112, 319-347
Johnson, S., Kaufmann, D., Shleifer, A. (1997). Politics and Entrepreneurship in Transition
Economies. Working Paper No 57, William Davidson Institute, University of Michigan
Johnson, S., McMillan, J., Woodruff, C. (2002). Property Rights and Finance, American
Economic Review, 95, 1335-1356
Kirzner, I. (1973), Competition and Entrepreneurship, Chicago: University of Chicago.
Klapper, L., Laeven, L., Rajan, R. (2006). Entry Regulation as a Barrier to Entrepreneurship.
Journal of Financial Economics, 82, 591-629
Klapper, L., Amit, R., Guillen, M., Quesada, J. (2007). Entrepreneurship and Firm Formation
Across Countries. Policy Research Working Paper 4313, World Bank.
Koellinger, P. (2008). Why Are Some Entrepreneurs More Innovative Than Others? Small
Business Economics, 31, 21-37.
Koellinger, P., Minniti, M. (2009). Unemployment benefits crowd out nascent
entrepreneurial activity. Economic Letters. 103, 96-98.
Koellinger, P., Thurik, A. (2009). Entrepreneurship and the Business Cycle. Discussion Paper

41
No 032/3, Tinbergen Institute.
Korosteleva, J., Mickiewicz, T. (2008). Finance and Entrepreneurial Entry. Centre for the
Study of Economic and Social Change in Europe. Working Paper No 96, University College
London.
La Porta R., Lopez-de-Silanes, F., Shleifer,A., Vishny, R. (1999). The Quality of
Government. Journal of Law, Economics and Organisation, 15, 222-279
Levesque, M., Minniti, M. (2006). The Effect of Aging on Entrepreneurial Behavior, Journal
of Business Venturing, 21, 177-194
Lumpkin, G., Dess, G. (1996). Clarifying the entrepreneurial orientation construct and
linking it to performance. Academy of Management Review, 21, 135 – 172
Marshall, M., Jaggers, K.(2007). Polity IV Project Dataset User's Manual. Center for
Systemic Peace (http://www.systemicpeace.org/polity).
McMullen, J., Bagby, D., Palich, L. (2008). Economic Freedom and the Motivation to
Engage in Entrepreneurial Action. Entrepreneurship Theory and Practice, 32 (5), 875-895.
Mickiewicz, T. (2005). Economic Transition in Central Europe and the Commonwealth of
Independent States (Houndmills: Palgrave Macmillan).

42
Mickiewicz, T. (2009). Property Rights, Corporate Governance and Privatisation
in Central-Eastern Europe and Central Asia. Economics Working Paper No 90, Centre for the
Study of Economic and Social Change in Europe, UCL.
Minniti, M. (2005). Entrepreneurship and Network Externalities. Journal of Economic
Behavior and Organization, 57, 1-27
Minniti, M., Arenius, P., Langowitz, N. (2005a). GEM 2004 Report on Women and
Entrepreneurship, Retrieved October 19, 2007 from http://www.gemconsortium.org
Minniti, M., Bygrave, D. & Autio, E. (2005b). Global Entrepreneurship Monitor. 2005
Executive Report. Babson College, MA, US and London Business School, UK. Retrieved
September 8, 2007 from http://www.gemconsortium.org
North, D. (1990). Institutions, Institutional Change and Economic Performance (New York:
Cambridge University Press)
North, D. (1994). Economic performance over time. American Economic Review, 84, 359 –
368.
North, D. (1997a). The Contribution of the New Institutional Economics to an Understanding
of the Transitional Problem (Paper presented at Wider Annual Lectures, United Nationals
University World Institute for Development Economics Research, Helsinki).

43
North, D. (1997b). Understanding economic change. (In Tilly, C., Nelson, J. & Walker,L.
(Eds.) Transforming communist political economies (pp. 13-19). Washington DC: National
Academy Press)
North, D. & Thomas, R. (1973). The Rise of the Western Word: A New Economic History
(Cambridge: Cambridge University Press).
Olson, M. (2000). Power and Prosperity (New York: Basic Books).
Parker, S. (2004). The Economics of Self-Employment and Entrepreneurship (Cambridge:
Cambridge University Press).
Parker, S. (2007) Law and the Economics of Entrepreneurship. Comparative Labor Law and
Policy Journal, 28, 695-716.
Parker, S. (2009). The Economics of Entrepreneurship (Cambridge: Cambridge University
Press).
Pett, M., Lackey, N., & Sullivan, J. (2003). Making Sense of Factor Analysis (Thousand
Oaks, CA: Sage Publications).
Reynolds, P., Bygrave, W., Autio, E., Cox, L. & Hay, M. (2002). Global Entrepreneurship
Monitor: 2002 Executive Report. Retrieved September 8, 3007, from
http://www.gemconsortium.org

44
Reynolds, P., N., Bosma, E. Autio, S. Hunt, N. De Bono, A. Servais, P. Lopez-Garcia, Chin,
N. (2005). Global Entrepreneurship Monitor: Data Collection Design and Implementation
1998-2003. Small Business Economics, 24, 205-231.
Rodrik, D. (2000). Institutions for High-Quality Growth: What They Are and How to
Acquire Them. Studies in Comparative International Development, 35, 3 – 31
Robinson, P.B., Sexton, E.A. (2002). The Effect of Education and Experience on Self-
Employment Success. Journal of Business Venturing, 9, 141-156
Russell, D. (2002). In Search of Underlying Dimensions: The Use (and Abuse) of Factor
Analysis . Personality and Social Psychology Bulletin.
Schaffer, M., Carlin, W. & Seabright, P. (2006). Where are the real bottlenecks? A
Lagrangian approach to identifying constraints on growth from subjective data (Paper
presented at the Centre for Economic Development and Institutions inaugural conference,
University of Brunel).
Shleifer, A., Vishny, R. (1993) Corruption. The Quarterly Journal of Economics, 108(3) 599
- 617
Schumpeter, J. (1934) The Theory of Economic Development (Cambridge, MA: Harvard
University Press).
45
Singh, R.P., Hills, G.E., Hybels, R. & Lumpkin, G.T. (1999) Opportunity Recognition
through Social Network Characteristics of Entrepreneurs. Frontiers of Entrepreneurship
Research. Babson College, Wellesley, MA.
Sonin, K. (2003). Why the Rich may Favor Poor Protection of Property Rights. Journal of
Comparative Economics, 31, 715-731
Tanzi, V. (1998) Corruption Around the World. IMF Staff Papers 45(4), 559 - 594.
Van Stel, A., Storey, D., Thurik, R. (2007). The Effect of Business Regulations on Nascent
and Young Business Entrepreneurship, Small Business Economics, 28, 171 – 186
Verheul, I., van Stel, A., Thurik, R. (2006). Explaining female and male entrepreneurship
across 29 countries. Entrepreneurship and Regional Development, 18, 151-183
Wei, S. (2000). Bribery in the Economies: Grease or Sand? Brookings Institute Working
Paper, http://www.brookings.org/scholars/swei.htm
Wennekers, S., van Stel, A., Thurik, R., Reynolds, P. (2005).Nascent Entrepreneurship and
the Level of Economic Development. Small Business Economics, 24, 293 – 309
Williamson, O. (1985). The Economic Institutions of Capitalism. Firms, Markets, Relational
Contracting (New York: The Free Press).

46
Williamson, O. (2000) New Institutional Economics. Journal of Economic Literature, 38, ,
595-613.
47
Table 1. Summary of existing research on institutions and entrepreneurship development
Klapper et al. (2006) Desai et al. (2003) Demirguc-Kunt et al. (2006)
Data set used
Amadeus Amadeus World Bank Enterprise Survey
Dependent variable
Industry level rates of creation of incorporated firms
Industry level rates of creation of
incorporated firms
Individual level indicator variable related to
incorporated form
Institutional variables included: Entry costs (incorporation procedures)
Property right protection
Employment rights
Financial system development
Tax disadvantage
Legal origin
Entry costs (incorporation
procedures)
Corruption
Labour regulations
Independence of banks
Court system
Property right protection
Legal origin
Entry cost (incorporation procedures)
Financial system development
Tax disadvantage
Legal origin
Bankruptcy procedures
Legal protection in solving disputes
Share of unofficial economy
Protection of shareholders rights
Outcomes: New corporation creation in industries that tend
to be high entry are relatively lower in
countries with higher entry costs;
Entry costs have a greater effect in richer
countries than in poorer countries
Entry costs tend to be lower in countries with
English or Scandinavian legal origins.
Communist legal origin has
negative effect.
Communist legal origin has negative effect
Financial sector development and bankruptcy
procedures has positive effect
Tax disadvantage makes incorporation less
likely
Entry costs have significant negative effect
Handling of multicollinearity in
institutional indicators: Entering each institutional indicator into a
separate regression
Entering each institutional
indicator into a separate regression.
Factor analysis; using extracted factors instead
of original variables.

48
Table 1. Summary of existing research on institutions and entrepreneurship development (continued)
Wennekers et al. (2005) Van Stel et al. (2007) Klapper et al. (2007) McMullen et al. (2008)
Data set used
Global Entrepreneurship Monitor Global Entrepreneurship Monitor WB Entrepreneurship Survey Global Entrepreneurship Monitor
Dependent variable
Country level rates of nascent
entrepreneurship
Country level rates of nascent
entrepreneurship & young business
Rate
Country level rates of creation of
incorporated firms
Country level rates of nascent
Entrepreneurship split between
opportunity and necessity
Institutional
variables included: Entry costs (administrative
requirements for starting a new
business)
Fiscal legislation
Social security
Former communist country
economic origin
Variables in 5 categories:
Starting a business
Hiring and firing workers
Getting credit
Paying taxes
Closing a business
Entry costs (incorporation procedures)
Employment rights
Financial system development
Quality of state governance
Ten individual dimensions of the
Wall Street Journal / Heritage
Foundation “Economic Freedom”
set of institutional indicators
Outcomes: Higher social security
expenditure has a negative
effect;
Higher government tax revenues
have a positive effect;
Communist legal origin has
a negative effect.
Minimum capital requirements have
negative effect;
Labour market rigidity has a negative
effect;
Countries with more nascent
entrepreneurs also have more young
businesses;
GDP growth rates have a positive
effect on opportunity entrepreneurship;
Private bureau coverage has a
positive effect.
Financial system matters for per capita
entry rate, but significance is not
robust (sensitive to estimation
method)
Entry procedures matter for entry rates
per capita, but significance is not
robust (sensitive to estimation method,
also less significant as compared with
the result on finance)
The most significant result is
that protection of property rights is
associated positively with
opportunity motivated entry
Handling of
multicollinearity in
institutional
indicators:
General to specific: excluding
insignificant variables.
General to specific: excluding
insignificant variables.
Applying different estimation methods
(GEE, GLS) and different definition
of dependent variable to check for
robustness
Applying equations
with single indicators
entered separately
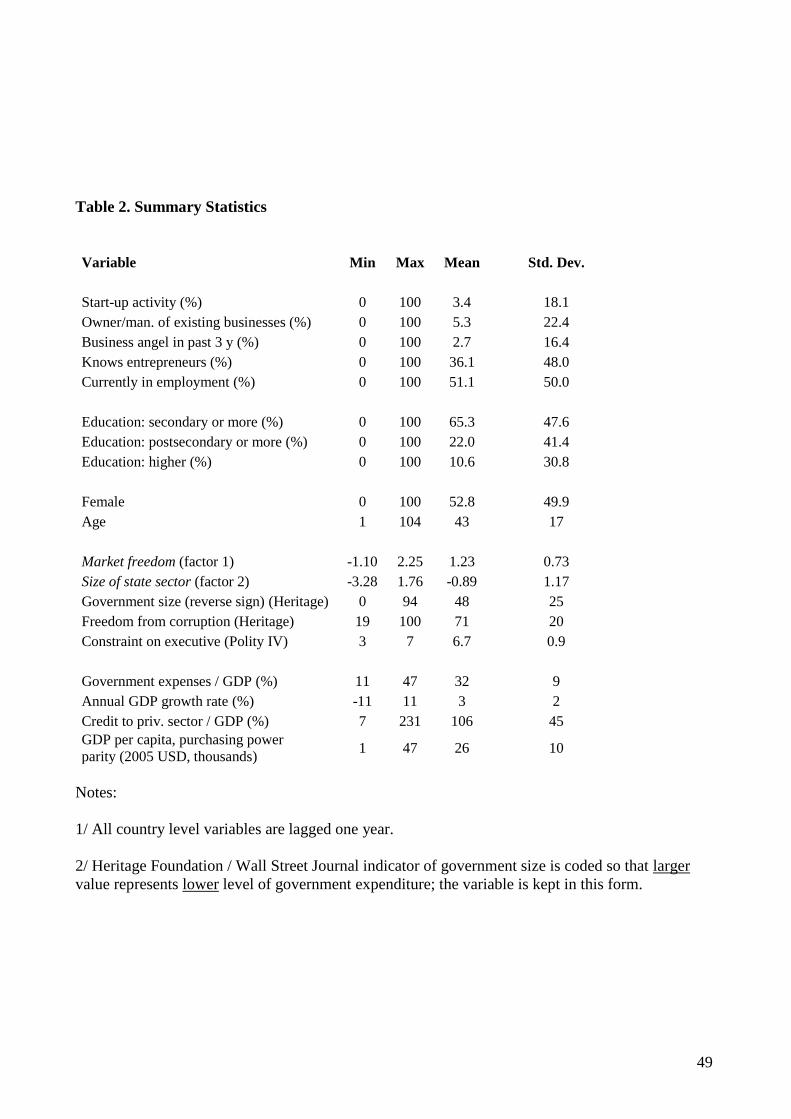
49
Table 2. Summary Statistics
Variable Min Max Mean Std. Dev.
Start-up activity (%) 0 100 3.4 18.1
Owner/man. of existing businesses (%) 0 100 5.3 22.4
Business angel in past 3 y (%) 0 100 2.7 16.4
Knows entrepreneurs (%) 0 100 36.1 48.0
Currently in employment (%) 0 100 51.1 50.0
Education: secondary or more (%) 0 100 65.3 47.6
Education: postsecondary or more (%) 0 100 22.0 41.4
Education: higher (%) 0 100 10.6 30.8
Female 0 100 52.8 49.9
Age 1 104 43 17
Market freedom (factor 1) -1.10 2.25 1.23 0.73
Size of state sector (factor 2) -3.28 1.76 -0.89 1.17
Government size (reverse sign) (Heritage) 0 94 48 25
Freedom from corruption (Heritage) 19 100 71 20
Constraint on executive (Polity IV) 3 7 6.7 0.9
Government expenses / GDP (%) 11 47 32 9
Annual GDP growth rate (%) -11 11 3 2
Credit to priv. sector / GDP (%) 7 231 106 45
GDP per capita, purchasing power parity (2005 USD, thousands)
1 47 26
10
Notes:
1/ All country level variables are lagged one year.
2/ Heritage Foundation / Wall Street Journal indicator of government size is coded so that larger
value represents lower level of government expenditure; the variable is kept in this form.
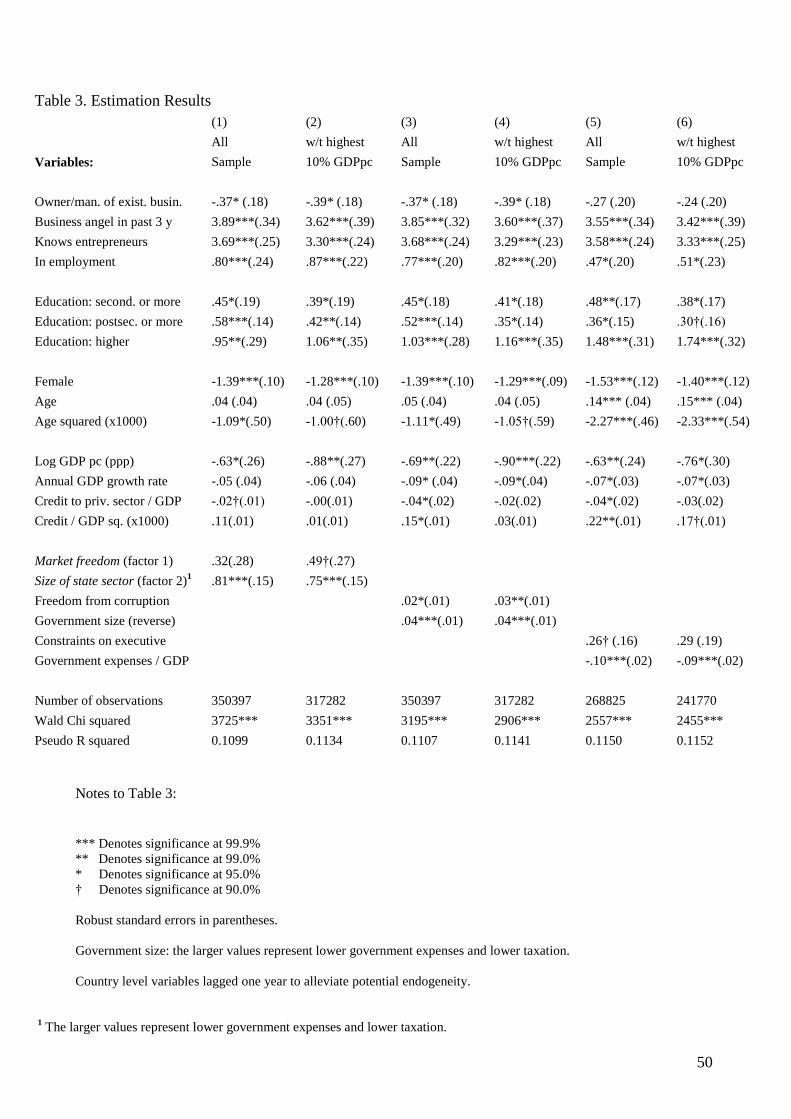
50
Notes to Table 3:
*** Denotes significance at 99.9%
** Denotes significance at 99.0%
* Denotes significance at 95.0%
† Denotes significance at 90.0%
Robust standard errors in parentheses.
Government size: the larger values represent lower government expenses and lower taxation.
Country level variables lagged one year to alleviate potential endogeneity.
1 The larger values represent lower government expenses and lower taxation.
Table 3. Estimation Results
(1) (2) (3) (4) (5) (6)
All w/t highest All w/t highest All w/t highest
Variables: Sample 10% GDPpc Sample 10% GDPpc Sample 10% GDPpc
Owner/man. of exist. busin. -.37* (.18) -.39* (.18) -.37* (.18) -.39* (.18) -.27 (.20) -.24 (.20)
Business angel in past 3 y 3.89***(.34) 3.62***(.39) 3.85***(.32) 3.60***(.37) 3.55***(.34) 3.42***(.39)
Knows entrepreneurs 3.69***(.25) 3.30***(.24) 3.68***(.24) 3.29***(.23) 3.58***(.24) 3.33***(.25)
In employment .80***(.24) .87***(.22) .77***(.20) .82***(.20) .47*(.20) .51*(.23)
Education: second. or more .45*(.19) .39*(.19) .45*(.18) .41*(.18) .48**(.17) .38*(.17)
Education: postsec. or more .58***(.14) .42**(.14) .52***(.14) .35*(.14) .36*(.15) .30†(.16)
Education: higher .95**(.29) 1.06**(.35) 1.03***(.28) 1.16***(.35) 1.48***(.31) 1.74***(.32)
Female -1.39***(.10) -1.28***(.10) -1.39***(.10) -1.29***(.09) -1.53***(.12) -1.40***(.12)
Age .04 (.04) .04 (.05) .05 (.04) .04 (.05) .14*** (.04) .15*** (.04)
Age squared (x1000) -1.09*(.50) -1.00†(.60) -1.11*(.49) -1.05†(.59) -2.27***(.46) -2.33***(.54)
Log GDP pc (ppp) -.63*(.26) -.88**(.27) -.69**(.22) -.90***(.22) -.63**(.24) -.76*(.30)
Annual GDP growth rate -.05 (.04) -.06 (.04) -.09* (.04) -.09*(.04) -.07*(.03) -.07*(.03)
Credit to priv. sector / GDP -.02†(.01) -.00(.01) -.04*(.02) -.02(.02) -.04*(.02) -.03(.02)
Credit / GDP sq. (x1000) .11(.01) .01(.01) .15*(.01) .03(.01) .22**(.01) .17†(.01)
Market freedom (factor 1) .32(.28) .49†(.27)
Size of state sector (factor 2)1
.81***(.15) .75***(.15)
Freedom from corruption .02*(.01) .03**(.01)
Government size (reverse) .04***(.01) .04***(.01)
Constraints on executive .26† (.16) .29 (.19)
Government expenses / GDP -.10***(.02) -.09***(.02)
Number of observations 350397 317282 350397 317282 268825 241770
Wald Chi squared 3725*** 3351*** 3195*** 2906*** 2557*** 2455***
Pseudo R squared 0.1099 0.1134 0.1107 0.1141 0.1150 0.1152

51
Notes:
Significance levels denoted as in Table 3.
GDP growth and GDP level lagged one year to alleviate simultaneity.
Table 4. Estimation Results:
country fixed effects (within) panel estimator
(1) (2)
Dependent variable
Country level
startup rate
Natural logarithm of
country level startup rate
Log GDP pc (ppp) 5.91***(1.16) 5.69***(0.92)
Annual GDP growth rate 0.06*(0.03) 0.03 (0.02)
Freedom from corruption -0.02 (0.02) 0.01 (0.02)
Government size (reverse) 0.03*(0.01) 0.03*(0.01)
Constant -58.03***(11.06) -60.77***(8.65)
Number of observations 369 369
F statistics (4, 73) 8.39*** 14.48***
Within R squared 0.09 0.13
Between R squared 0.07 0.21
Overall R squared 0.03 0.07
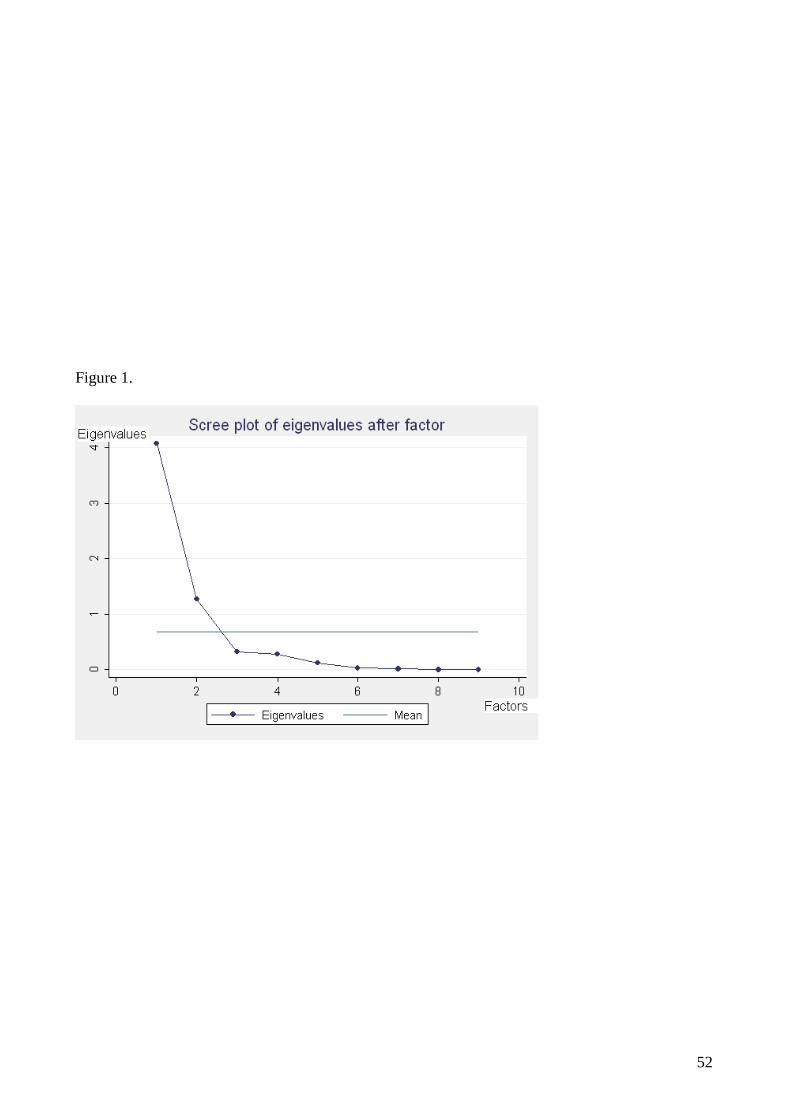
52
Figure 1.

53
Figure 2.
Explanation of indicators:
Fiscal freedom is a measure of the tax burden imposed by government. It includes both the direct tax burden in terms
of the top tax rates on individual and corporate incomes and the overall amount of tax revenue as a percentage of GDP.
Government size (also referred to as government spending) considers the level of government expenditures as a
percentage of GDP including consumption and transfers.
Monetary freedom combines a measure of price stability with an assessment of price controls using weighted average
inflation rate for the past three years.
Financial freedom is a measure of banking security as well as a measure of independence from government control.
Trade freedom is a composite measure of the absence of tariff and non-tariff barriers that affect imports and exports of
goods and services.
Investment freedom measures restrictions in the following five areas: national treatment of foreign investment;
sectoral investment restrictions; expropriation of investment without fair compensation; foreign exchange
compensation; foreign exchange controls and capital controls.
Business freedom is a quantitative measure of the ability to start, operate, and close a business and represents the
overall burden of regulation as well as the efficiency of government in the regulatory process.
Property rights indicator provides an assessment of the ability of individuals to accumulate private property, secured
by clear laws that are fully enforced by the state.
Freedom from corruption is derived primarily from Transparency International's Corruption Perceptions Index (CPI).
It measures the perceived level of public-sector corruption in 180 countries and territories around the world. The CPI
is a 'survey of surveys', based on 13 different expert and business surveys.
source: http:// www.heritage.org, http://www.transparency.org

54
Figure 3. Factor scores for GEM sample countries.
Note: The data points relate to year 2004 or latest available.

55
Figure 4. Corruption and Government Size
Argentina
Austria
Australia
Belgium
Brazil
Canada
Chile
Germany
Denmark
Spain
Finland
France
Greece
Croatia
Hungary
Israel
India
Iceland
Italy
Jamaica
Japan
Latv ia
Mexico
Norway
New Zealand
Poland
Portugal
SwedenSingapore
Slovenia
Switzerland
Thailand
Uganda
United Kingdom
United States
Venezuela
South Africa
20
40
60
80
10
0
Fre
ed
om
fro
m C
orr
up
tion
-100 -80 -60 -40 -20 0Government Size
56
i Entrepreneurship is a multidimensional concept (see Acs and Szerb, 2009) and our results may not apply to measures
other than entry. We motivate our focus by the work of Lumpkin and Dess (1996) who state „the essential act of
entrepreneurship is new entry‟ (1996: 136). See also Acs (2006).
ii For example, the highly corrupt environment in Russia may explain the low levels of entrepreneurship there (see also
Aidis and Adachi, 2008; Aidis, et al. 2008).
iii An example of predatory entrepreneurship in this case would be 'private' security companies which provide business
protection at a price and profit from maintaining weak local property rights (e.g. Sicily). It is a form of destructive
entrepreneurship and has a negative overall effect on economic growth.
iv This variable measures the existence and extensiveness of private firms or non-governmental organizations that
maintain databases on the creditworthiness of borrowers (Van Stel et al. 2007:178).
v Koellinger (2008) applies similar methodology to GEM data focusing on innovativeness.
vi World Bank „Governance‟ indicators would be an attractive alternative. Unfortunately, it is only in the most recent
period where those are reported annually. For the period we cover some years are missing.
vii This indicator is available since 2005.
viii As accessed in February 2008. Since labour freedom is available from 2005 only, it was not included. However, we
verified it did not affect the results significantly. When we run factor analysis for a shorter period but with freedom of
labour included, the first two factors still explain most of the variance, and loadings of labour freedom are not high on
either of them. Empirically, labour freedom is negatively correlated with the size of the government spending and
therefore its impact is difficult to separate where the size of the government is taken into account (see Aidis et al.,
2007).
ix However, retaining two factors come at cost of high uniqueness value for the trade freedom indicator (at 0.71), i.e.
this variable is not well explained by the extracted factors. Generally however, sampling adequacy is high: overall
Kaiser-Meyer-Olkin measure is 0.85.
x As argued by Costello and Osborne (2005), orthogonal rotation is not utilising all available information. Moreover, if
factors are truly uncorrelated, the results of oblique rotation are very similar to the results of orthogonal rotation. In our
case the correlation between the two factors after oblique rotation is -0.14. We use oblimin method following
recommendation by Fabrigar et al. (1999) and Russell (2002). We also applied promax. We verified that the results
based on the two are almost indistinguishable for our data.
xi However, while the size of the government measure as reported by Heritage is simply based on the volume of
government expenses, the tax measure includes the impact of marginal tax rates in addition to tax revenues.
57
xii
These results can be obtained from the authors upon request. Estimation with GDP per capita squared does not
produce a credible Wald statistics for the probit model. At the same time, the main results are not affected.
xiii In a previous version, reported as working paper XYZ we also used 20% threshold. The results were not affected.
xiv Additional results can be obtained from the authors upon request.
xv The Polity IV Project captures global trends in governance and currently includes 163 countries. The polity
conceptual scale examines concomitant dimensions of democratic and autocratic authority in governing institutions. It
is based on six component that measure three key qualities: executive recruitment, constraints to executive authority
and political competition (see also http://www.systemicpeace.org/polity/polity4.htm)
xvi It is likely that there is a U-shaped relationship between the level of development and entrepreneurial entry as
postulated by Acs et al. (1994), Carree et al. (2002) and Wennekers et al. (2005). Unfortunately, with regards to our
data, when we attempt to enter a linear and quadratic GDP per capita term in our specifications, the overall Wald
statistics for the probit regression cannot be produced. For this reason, we stick to the logarithmic transformation.
xvii Given the high significance of the size of the government we also explored what happens if a quadratic term is
added. It is insignificant.