size and sources of the private school premium in test scores … · 2016-08-02 · size and...
TRANSCRIPT

Size and Sources of the Private School Premium in
Test Scores in IndiaAbhijeet Singh
Wo
rkin
g P
aper
SEPTEMBER 2013
98
www.younglives.org.uk


Wo
rkin
g P
aper
SEPTEMBER 2013
98
www.younglives.org.uk
Size and Sources of the Private School Premium in
Test Scores in IndiaAbhijeet Singh

Size and Sources of the Private School Premium in Test Scores in India
Abhijeet Singh
First published by Young Lives in September 2013
© Young Lives 2013 ISBN: 978-1-909403-10-9
A catalogue record for this publication is available from the British Library. All rights reserved. Reproduction, copy, transmission, or translation of any part of this publication may be made only under the following conditions:
• withthepriorpermissionofthepublisher;or
• withalicencefromtheCopyrightLicensingAgencyLtd., 90TottenhamCourtRoad,LondonW1P9HE,UK,orfromanothernationallicensingagency;or
• underthetermssetoutbelow.
This publication is copyright, but may be reproduced by any method without fee for teaching or non-profit purposes, but not for resale. Formal permission is required for all such uses, but normally will be granted immediately. For copying in any other circumstances, or for re-use in other publications, or for translation or adaptation, prior written permission must be obtained from the publisher and a fee may be payable.
PrintedonFSC-certifiedpaperfromtraceableandsustainablesources.
Young Lives, Oxford Department of International Development (ODID), University of Oxford,
Queen Elizabeth House, 3 Mansfield Road, Oxford OX1 3TB, UK
Tel: +44 (0)1865 281751 • E-mail: [email protected]
Funded by

SIZE AND SOURCES OF THE PRIVATE SCHOOL PREMIUM IN TEST SCORES IN INDIA
i
Contents Summary ii
The Author ii
Acknowledgements ii
Introduction 1
1. Private and government schools in India 4
2. Data 5
2.1 Sampling 5
2.2 Data collected through household visits 6
2.3 Data collected from schools 7
3. Size of the private school premium 8
3.1 Empirical framework 8
3.2 Estimated specifications 10
3.3 Results 11
3.4 Robustness 12
4. Decomposing learning production in schools 14
4.1 What differs in inputs across government and private schools? 14
4.2 Decomposing school productivity 14
4.3 Do student perceptions of schooling matter? 16
5. Conclusion 18
References 21
Tables 24
Appendix Tables 30
SIZE AND SOURCES OF THE PRIVATE SCHOOL PREMIUM IN TEST SCORES IN INDIA
ii
SummaryThis paper uses unique panel data to estimate value-added models of learning production in
private and government schools in Andhra Pradesh (India), examine heterogeneity in the value-
added of private schools, and identify the sources of learning in these schools. In rural areas there
is a substantial positive effect of private schools on English, no effect on mathematics and
heterogeneous effects on Telugu for 8–10 year old children; at 15 years, there are significant but
modest effects on Telugu, mathematics and receptive vocabulary. In urban areas, there is no
evidence of a positive private school effect. Teachers’ absence and effort, teaching practices and
class size significantly affect learning but teachers’ education, tenure and experience do not.
Children in private schools report more positive assessments of their school experience. Results
correspond closely with comparable experimental estimates.
The Author Abhijeet Singh is a Quantitative Research Officer at Young Lives and is a doctoral student in
Economics at the University of Oxford. His current research focuses on issues of education,
health and inequalities in childhood.
Acknowledgements The author wishes to thank the children and families who participate in Young Lives research, as
well as the field workers who carried out the interviews reported in this paper. Special thanks also
to internal and external reviewers and editors. However, the errors and the views expressed in
this paper are mine. I am grateful to my supervisors, Stefan Dercon and Albert Park, and to Steve
Bond, John Muellbauer and Francis Teal for their encouragement and guidance in this project. I
am also grateful for very helpful feedback received from Sonia Bhalotra, Jishnu Das, Marcel
Fafchamps, James Fenske, Paul Glewwe, Doug Gollin, Zoe James, Pushkar Maitra, Karthik
Muralidharan, Caine Rolleston, Tristan Zajonc and seminar participants in Oxford, at the Indian
Statistical Institute and the Delhi School of Economics. I thank the Young Lives Project for
providing the data in this paper and supporting this study.
About Young Lives
Young Lives is an international study of childhood poverty, following the lives of 12,000 children in 4 countries (Ethiopia, India, Peru and Vietnam) over 15 years. www.younglives.org.uk
Young Lives is funded from 2001 to 2017 by UK aid from the Department for International Development (DFID), and co-funded by the Netherlands Ministry of Foreign Affairs from 2010 to 2014.
The views expressed are those of the author(s). They are not necessarily those of, or endorsed by, Young Lives, the University of Oxford, DFID or other funders.

SIZE AND SOURCES OF THE PRIVATE SCHOOL PREMIUM IN TEST SCORES IN INDIA
1
Introduction The share of private schools in total enrolment has risen substantially across both urban and
rural areas in India in the past 15 years (Kingdon 2007); students in these schools perform much better on average in test scores (Muralidharan and Kremer 2009); and frequently it
seems that private schools achieve this better performance even with much lower expenditure per pupil than government schools.
In this paper, I answer three questions using a unique longitudinal dataset collected by the
Young Lives study in Andhra Pradesh state, which has tracked two cohorts of children
through multiple rounds of data collection at household and school level between 2002 and 2011. First, I estimate value-added models (VAMs) of learning achievement to evaluate whether, and to what extent, the better test performance of children in private schools is
attributable to schools. Second, I examine whether the impact of private schools on test scores is heterogeneous across different tests, different age groups, different languages of instruction and across urban and rural areas. Third, using detailed information collected at
school level matched with multiple rounds of household-based data collection, I examine how the relative contribution of various inputs to learning production differs across the private and public sectors.
These questions are central to understanding the implications of the rise of private schools
for the educational sector in India. Establishing whether the private school premium is causal, and whether it is heterogeneous, is essential for understanding whether the rapid proliferation of private schools can be expected to improve abysmally low learning levels in
Indian schools and, if so, by how much; this is also essential for understanding the likely implications for inequality in test scores in India, which is already among the highest in the world (Das and Zajonc 2010). Finally, understanding the relative contribution of different
inputs in achievement production is important for targeting educational investment and policies towards those inputs which have the largest marginal returns in terms of learning.
In rural areas, where private schools account for about a quarter of the total enrolment in our
data, I find that value-added for students in private schools is substantially greater in English compared to government school students, moderately greater in receptive vocabulary and no
worse in Mathematics between the ages of 8 and 10 years; in Telugu, the local language, children in English-medium private schools do worse but children in Telugu-medium private schools perform as well while still out-performing government school students in English. At
the age of 15 years, children in private schools significantly outperform government school children in Mathematics, receptive vocabulary and Telugu, although estimated effect sizes remain relatively modest and only about 20 to 40 per cent of the within-community raw
premium in test scores. In urban areas, I find no evidence of a causal private school effect on test scores. Focusing on the decomposition of learning gains, I show that whereas measures of teacher absence and teaching practice matter importantly for learning production across
subjects, the same is not true for teacher education, teacher qualifications (except in Telugu), tenure, or experience which are frequently the variables that are most debated in discussions of education policy. I find expected negative effects of effective class size. Analysis in this
paper is richer than previously available studies of the effect of private schools in India (discussed in Section 2) which have been constrained by the lack of longitudinal data on individuals and the unavailability of detailed data at both the household and the school level.

SIZE AND SOURCES OF THE PRIVATE SCHOOL PREMIUM IN TEST SCORES IN INDIA
2
I attempt in this paper to also add to a recent and growing literature, mostly from studies in
the United States, on the robustness and reliability of value-added approaches to modelling achievement production. In particular, the richness of the data allow me to engage directly
with the central concern of Rothstein (2010), that decision-makers have access to much more detailed information about children than just their previous test scores, which can bias value-added estimates due to selection on unobservables: I show that controlling for lagged
parental assessments of a child's academic performance and for parental aspirations with regard to a child's education does not alter the size or significance of estimated private school effects from value-added models.
Furthermore, part of the data used in this paper are contemporaneous to data collected by
Muralidharan and Sundararaman (2013, MS hereafter) for children of the same age, in the same state and tested on partly the same domains of learning. The MS study offers experimental variation, induced through the randomised assignment of school vouchers in a
representative set of communities in Andhra Pradesh, and thus offers an ideal comparison for results in this paper to assess the presence and extent of systematic bias that may still be present in value-added models. As I document, the pattern of causal effects reported here,
on a comparable set of indicators for a comparable cohort of children, is very similar to the MS study; this is, to my knowledge, the first comparison of experimental and value-added estimates for the effect of selection into different schools in a developing country and the first
such comparison using independently drawn samples in any setting.1
Finally, I am able to show that children across private and government schools differ not just
in their socio-economic background and their test scores but that they also differ in how positively they rate their school experience, their belief in their own abilities (self-efficacy) and
the support they receive from their peers and teachers. I show that these measures are meaningful in that they exhibit variation and are strongly predictive of test scores even conditional on a wide range of home, school, class and teacher characteristics and lagged
achievement. In this, I relate to a long literature in child psychology and a recent literature in economics that documents the importance of psychosocial (‘non-cognitive’) skills such as self-efficacy and locus of control to the production of learning skills (e.g. Bandura 1982
1993; Cunha and Heckman 2008; Cunha et al. 2010).
These results have important implications. Combined with the significantly lower per-pupil
expenditure in private schools, this indicates that private schools are considerably more productive than government schools on average. The much better performance of private school students in English may plausibly contribute a significant labour market premium for
these children in the future; recent evidence using nationally representative data from 2005 suggests an increase in hourly wages by 13 per cent for men who can speak a little English and up to 34 per cent for those who can speak it fluently (Azam et al. 2013). However, the
insignificance or relatively modest size of the private school premium in most dimensions (with the exception of English) indicates that the spread of private schooling alone, without concomitant reforms across the education sector, will not lead to very appreciable
improvements in the low levels of learning in Indian schools as measured by achievement in mathematics or the ability to read and write.
1 In addition to documenting similar results for one sample of children, I extend the results of MS substantially by presenting
results on older (15-year old) children, urban areas, on non-curricular test domains (receptive vocabulary), on decomposition of learning sources and on subjective experience of schooling. The MS study is focused exclusively on children in rural areas
aged about 8 to 10 years at the time of testing.

SIZE AND SOURCES OF THE PRIVATE SCHOOL PREMIUM IN TEST SCORES IN INDIA
3
The failure of several commonly targeted inputs, such as teacher training, term of contract
and experience, in explaining variation in most test scores indicates that input-focused interventions in these domains (which have been the mainstay of education policy
interventions in India) are unlikely to move average levels of achievement significantly. The strong and substantial effect of teacher effort and practice (as measured by whether teachers had marked notebooks, whether they were reported by students as being frequently absent,
and whether they used a textbook during class observations) indicates that there may be high returns to reforms in teacher accountability and pedagogical changes; this supplements findings from, for example, Muralidharan and Sundararaman (2011) and Duflo et al. (2012)
who demonstrate large experimental impacts of teacher performance pay and of incentives to reduce teacher absenteeism respectively.
The robust performance of value-added models, in a developing country setting with
decidedly non-random selection across school types, is heartening. While experimental
evidence, preferably on representative samples and with minimal attrition, remains very desirable for measuring the causal effects of different educational inputs and interventions, such data are unlikely to be always available or always feasible to collect; results in this
paper support the reliability of value-added estimates using panel data in these settings.
Results in this paper resonate much more broadly than merely the Indian context. Low-fee
private schools have increased their share in enrolment across several developing countries; in many countries in Latin America, Asia and Africa, they also seem to outperform
government schools in test scores (Andrabi et al. 2011; Jimenez et al. 1991; Bold et al. 2011). Evidence from India will have direct relevance for these contexts as well. Similarly, the methodological question about the presence and extent of any bias in value-added models is
also relevant across different contexts. Finally, results about the role of psychosocial skills and subjective experience of schooling add to a larger global literature and highlight that there may be gains to collecting systematic information on these domains in educational
studies and that some domains, like children's satisfaction with their school experience, may not just be intrinsically valuable in themselves but also contributory factors to how they learn.
The rest of this paper is structured as follows: Section 1 presents the background and
context of the schooling sector in India; Section 2 presents the data; Section 3 presents the empirical specifications and results from VAMs exploring whether the private school effect is
causal and whether it is heterogeneous; Section 4 investigates the sources of learning gains including the role of psychosocial skills and subjective experience of schooling in learning production; and Section 5 presents a discussion of the results and concludes.

SIZE AND SOURCES OF THE PRIVATE SCHOOL PREMIUM IN TEST SCORES IN INDIA
4
1. Private and government schools in India As noted previously, the share of the private sector in total enrolment especially at the primary level has expanded very rapidly and a large literature finds significant difference in
the test scores of children in these schools when compared to government school students. It has also been shown that government school teachers, although better-paid and more qualified than private school teachers, are also much more likely to be absent and much less
likely to be teaching when in school.
Assessing the causal contribution of private schools to the learning outcomes of pupils is
beset with serious problems of endogenous selection: there are systematic differences in observable characteristics of students in the two sectors and it is plausible that these may
extend also to unobservable characteristics. Studies in the Indian context have adopted a series of econometric techniques to correct for this source of bias.2 The results in most cases seem to indicate that there is, in fact, a ‘private school premium’ in test scores which persists
even when issues of selection have been dealt with as far as possible. However, all of the studies previously available in the literature use only cross-sectional variation in test scores and a limited range of characteristics of children, schools and households to arrive at their
estimates of the private school premium. Their identification strategies, while perhaps the best that can be achieved given the data, remain vulnerable to several sources of endogeneity.3
The most convincing results on the effect of private schools in India are those emerging from
the MS study from the state of Andhra Pradesh, which is also the state in which the data
used in this paper are collected. The MS study offered school vouchers through random assignment to children in the last year of pre-school (kindergarten) and Grade 1 for the entire duration of primary schooling up till Grade 5 which could be used to attend any private school
in the village; this allows for clean identification of the magnitude of any private school effect. Results on the study available thus far indicate that children in private schools perform better in English and Hindi and no worse in Mathematics and Telugu even though up to 40% less
instruction time is dedicated to these subjects in private schools than in government schools. The Young Lives data do not have Hindi test scores; however, for Mathematics, Telugu and English tests of a comparably aged cohort I document similar estimates of the private school
effect.
2 Specifically, these studies have used the following approaches: controlling for observed background characteristics of children
(Muralidharan and Kremer 2009; Kingdon 1996; French and Kingdon 2010; Desai et al. 2008); running models with village fixed
effects to isolate village-level confounders; with household fixed effects (French and Kingdon 2010); with propensity score
matching (Chudgar and Quin 2012); and finally, through the use of Heckman selection models (Kingdon 1996; Desai et al. 2008).
3 Ordinary Least Squares (OLS) regressions and propensity score matching estimators conditioning for limited background
characteristics cross-sectionally are unlikely to have observed all relevant dimensions in which these children differ; within-village comparisons neglect the potential bias caused due to unobserved characteristics that lead households in the same village to
making different choices regarding the enrolment of their children; household fixed effects remain vulnerable to differential
enrolment within the household being related to either unobserved ability differences across children or, even more plausibly, to other unobserved differences in complementary investments; finally, variables used to control for selection in these studies using
Heckman selection-correction estimators are unlikely to satisfy necessary exclusion restrictions. For example, Desai et. al. (2008)
use the presence of a private school in a village as a factor predicting selection into private schools but not test scores; this exclusion restriction is almost certainly untenable as villages that have a private school will differ from villages that do not. In fact
such a pattern has clearly been documented by Pal (2010) using the PROBE dataset covering five Indian states.

SIZE AND SOURCES OF THE PRIVATE SCHOOL PREMIUM IN TEST SCORES IN INDIA
5
2. Data
2.1 Sampling
The data I use in this study were collected by the Young Lives study4 between 2002 and 2011
in the state of Andhra Pradesh. Andhra Pradesh is the fourth-largest state in India by area and had a population of over 84 million in 2011. It is divided into three regions – Coastal Andhra, Rayalaseema and Telangana – with distinct regional patterns in environment, soil and
livelihood patterns. Administratively the state is divided into districts, which are further sub-divided into sub-districts (mandals) which are the primary sampling units within our sample.5
The Young Lives study in Andhra Pradesh has collected data on two cohorts of children:
1008 children born between January 1994 and June 1995, and 2011 children born between
January 2001 and June 2002. Data was collected from children and their families using household visits in 2002, 2006-07 and 2009-10. The study also collected extensive data through visits to the schools of a randomly selected sub-sample of the Younger Cohort in
2011.
Figure 1. Timing of interviews in Young Lives
Note: School−based data collection did not cover the older cohort
4 Young Lives is a longitudinal study of child poverty which follows two cohorts of children in four countries: Ethiopia, Andhra
Pradesh state (India), Peru and Vietnam. For details, please visit www.younglives.org.uk
5 The Young Lives sample is distributed across the three main regions and covers about 100 communities (villages or urban wards) across 20 sub-districts (mandals). A careful comparison with representative data for Andhra Pradesh shows that the
data in the Young Lives sample contains similar variation across comparable measures: a detailed explanation of the sampling methodology and the comparison of the characteristics of the Young Lives sample with the DHS sample on a range of
observed characteristics is reported in Kumra (2008).
R1 R2 R3 SchoolsSurvey
05
1015
20Ag
e
Dec 02 Apr 07 Jan 10 Mar 11
Oldest child in 1994/95 cohort Youngest child in 1994/95 cohort
Oldest child in 2001/02 cohort Youngest child in 2001/02 cohort
Age of children in successive roundsBy cohort

SIZE AND SOURCES OF THE PRIVATE SCHOOL PREMIUM IN TEST SCORES IN INDIA
6
Figure 1 presents graphically the timings of data collection and the age of the children at the
time of the data collection.6 Attrition rates in the data have been kept very low – 1930 children (96 per cent) in the Younger Cohort and 976 children (97 per cent) in the Older Cohort are
still in the sample in 2009. This has been achieved in part by following children whose households migrated from their original communities to their destination of migration.
2.2 Data collected through household visits
Extensive test data were collected from children in the sample in all rounds of the survey.
The tests differed in their focus on which dimension of cognitive achievement they attempted to capture and how closely they related to the formal school curriculum in Andhra Pradesh;
often, different tests were administered to children across rounds in order to ensure that they were appropriate for the age and the stage of education that the children were in. Box 1 lists the different test measures that are used in this paper.7
Box 1. Cognitive tests in Young Lives
Round 1 (2002) Round 2 (2006-07) Round 3 (2009-10) School Survey (2011)
Older Cohort Age 8 Age 12 Age 15 Not surveyed
Raven’s test PPVT
Mathematics
PPVT Mathematics
Cloze (Telugu)
Younger Cohort 6–18 months old Age 5 Age 8 Age 9
PPVT
CDA Quantitative
PPVT
Writing
Mathematics
Telugu
English
Mathematics
PPVT refers to the Peabody Picture Vocabulary Test III CDA refers to the Cognitive Development Assessment quantitative subscale
Scores on all tests used in this paper, with the exception of the Raven's test, were generated
using Item Response Theory (IRT) models. The use of IRT models is standard in education assessments and presents significant advantages: it allows for the accounting of difficulty of different items and, where the same test (or a sub-set) was administered over time, it allows
for the computation of scores from the repeated tests on the same scale.8 Tests in which the
6 The interviews were usually carried out over a period of four to six months for the bulk of the sample. In India, the Round 2
interviews were mostly carried out between January and April 2007. Round 3 interviews were mostly carried out between
September 2009 and January 2010. The timing of interviews given in Figure 1 corresponds to the end-period for the majority of
the interviews which did not involve tracking children who had moved to different communities.
7 For precise details of the contents of the tests, as well as the validation for use in Andhra Pradesh, please consult Cueto et al. (2009), Cueto and Leon (2013) and the Young Lives questionnaires which are available at www.younglives.org.uk.
8 IRT models posit a relationship between a unidimensional latent ability parameter and the probability of answering a question correctly; it is assumed that the relationship is specific to the item but is constant across individuals. Further assuming local
independence, conditional on ability, between answers to different items by the same person, and across persons for the
same item, it is possible to recover estimates of ability based on standard maximum likelihood techniques. I used the OpenIRT suite of commands in Stata written by Tristan Zajonc to generate the maximum likelihood scores used in this paper. For a
detailed explanation of IRT models, please consult Das and Zajonc (2010) and Van der Linden and Hambleton (1997).
One of the core assumptions of IRT models is that item parameters (e.g. difficulty) do not differ across sub-groups. This is not an assumption that is maintainable across different languages as difficulty levels may plausibly have changed during
translation and therefore, in the case of the PPVT and the cloze test (‘fill-in-the-blanks’) administered to the Older Cohort in 2009/10, I am constrained in only using the test scores of children who took the tests in Telugu; these account for over 90 per
cent of the sample in each of the tests.

SIZE AND SOURCES OF THE PRIVATE SCHOOL PREMIUM IN TEST SCORES IN INDIA
7
same items were administered (PPVT in both cohorts in Rounds 2 and 3, and the mathematics test in the Younger Cohort in Round 3 and the school survey) were calibrated together which allows them to be put on the same scale.9 I have normalised the test scores
to have a mean of 0 and a standard deviation of 1.
The tests used in Young Lives are much more comprehensive in the domains of learning
they capture and offer more variation than tests in most previous studies in the literature, which is a considerable strength of the data.
Data collection in 2002, 2007 and 2009-10 was at the households of the children. This data
has particularly rich information about the socio-economic background of the children’s households, parental expectations/aspirations for the children, and also detailed child-specific data. In the interest of clarity, I will explain individual variables being used in the
estimation as part of the different empirical sections at the point at which they are actually being employed.
2.3 Data collected from schools
In 2011, the Young Lives study visited a random sub-set of 247 schools being attended by
children in the Younger Cohort.10 The sampling frame consisted of all the Younger Cohort (YC) children who were still enrolled in school in Round 3 (2009-10) and were going to school within Andhra Pradesh.11
The sampling was carried out within strata defined on whether the school was in an urban or
a rural area, whether it was private or public and whether it was recognised or unrecognised, yielding a total of six strata.12 The final sample includes 952 children across 247 schools.
The school-level survey was conducted between December 2010 and March 2011, i.e. in the
school year immediately after the third wave of household-level data collection. The survey
attempted to capture in detail school-level differences in infrastructure and funding, teacher qualifications and characteristics, classroom characteristics, teaching processes and children’s experiences of schooling. It administered questionnaires to all school principals
(head-teachers), to all Young Lives sample children in the school and to the maths teachers of the sample children covered in the survey. Additionally, enumerators observed a maths class for each of the sample children and they also looked at the notebooks of each Young
Lives child to note the extent to which work had been seen/marked by the teacher.
9 The same items were administered in the PPVT in both rounds and a subset of items from the Round 3 Maths tests for the
Younger Cohort were repeated in the school survey. In the case of tests in different rounds which were calibrated together, I
have normalised scores to have a mean of zero in the first period in which the test is administered by cohort. Maths scores for the Older Cohort in Rounds 2 and 3 cannot be linked to a common scale due to the unavailability of adequate link items
administered in both rounds.
10 It was not possible to visit all schools due to budgetary and logistical constraints. In total, 807 different schools were being attended by children in this cohort in 2009-10, 538 of those attended by only one Young lives child; logistical constraints and funding meant that we could at best survey 250-300 schools.
11 YC children outside AP were excluded from the frame as tracking them was unfeasible and because all questionnaires, tests and procedures were designed keeping the AP education system in context; this left 1880 children in the sampling frame.
12 In each stratum, a pre-determined number of children were drawn randomly and all other Young Lives YC children in the school were covered as well: this sampling approach was administered because the marginal effort of surveying additional
Young Lives children in schools which are already being surveyed is low and as importantly, within-school variation (which this
maximizes) is essential for several analytical purposes. Where the child(ren) enrolled in a particular school had shifted schools since 2009, they were dropped from the school-based survey and were not followed to their new school unless the new school
was also already in the sample.
SIZE AND SOURCES OF THE PRIVATE SCHOOL PREMIUM IN TEST SCORES IN INDIA
8
Finally, four tests were administered as part of the school survey: each child completed a test
in mathematics, Telugu and English; mathematics teachers of the Young Lives children were also administered a test of competency in teaching mathematics.
3. Size of the private school premium
3.1 Empirical framework
Following Todd and Wolpin (2003, 2007), it is possible to write the achievement production
function in a general form:
yist
* = F Xi t( ),Si t( ),μis0,εist[ ] (1)
where the achievement yist* of child i in school s at time t is expressed as a function of the
whole history of home-based inputs X i t( ) , school-based inputs
Si t( ) , student endowments
μis0 (such as ability), and a time-varying error term εist . While useful for conceptualising the production technology for achievement, direct estimation of Eq (1) is not typically possible
because the whole history of home and school inputs, as well as individual-specific endowments, are not observed by the researcher.
Following the initial specification provided by Andrabi, Das, Khwaja and Zajonc (2011) I
model the education production function as follows:
yit
* =α1' .xit +α2
' .xit−1+…+αt' .xi1+
s=1
s=t
∑θt+1−sμis (2)
where xit is a vector of inputs for child i at time t , yit* is true achievement at time t measured
without error, and summed μis are cumulative productivity shocks. Adding and subtracting
βyi ,t−1
* to Equation (1) and assuming that coefficients decline geometrically yields the lagged value-added model:
yit* =α1
' .xit + βyi ,t−1* +μit (3)
In this paper, I will largely be adopting the lagged value-added (VA) specification (Eq 3) to
obtain estimates of the public school premium. The lagged test score in the above specification is expected to capture the contribution of all previous inputs and any past unobservable endowments and shocks. This specification is believed to be a significant
improvement over a contemporaneous specification, which links current test scores to only current inputs, but estimates still remain subject to possible bias from two sources – measurement error in the lagged achievement measure and any unobserved heterogeneity
affecting learning between children.
In practice, however, bias from these sources in VA estimates seems very limited in a range
of studies that compare VA estimates to other estimates utilising experimental or quasi-experimental variation. Andrabi et. al. (2011) document, while analysing the effectiveness of
private schools in Pakistan (a setting very similar to the one in this paper), that biases from measurement error and unobserved heterogeneity are countervailing, and aggregate bias on

SIZE AND SOURCES OF THE PRIVATE SCHOOL PREMIUM IN TEST SCORES IN INDIA
9
the private school coefficient does not seem to be significant.13 Similar results are also emerging from a growing literature in the US: Deming et al. (2011) compare the effects of a school choice lottery in the US and find no significant differences between experimental
estimates of school effects based on the school lottery and estimates from a value-added model that controls for previous test scores; Kane and Staiger (2008), analysing results from an experiment in Los Angeles that assigned children randomly across classrooms, similarly
report that teacher effect estimates that controlled for prior student test scores yielded unbiased predictions of test scores after randomisation; similar results are obtained by Muralidharan and Sundararaman (2012), a paper of particular relevance to this study as it is
based in the same context, who document that experimental and VA estimates of the effectiveness of contract teachers are identical.14 Chetty, Friedman and Rockoff (2011) find no evidence of bias when comparing estimates of teacher effectiveness using a value-added
approach to estimates using previously unobserved parent characteristics and a quasi-experimental research design based on changes in teaching staff. Finally, in a recent paper, Angrist, Pathak and Walters (2011) also show how their estimates of Charter school
estimates are identical when estimated on the same sample of children using lottery outcomes and separately using observational data (including baseline scores).15
13 Specifically, they report from their application in Pakistan: “Despite ignoring measurement error and unobserved
heterogeneity, the lagged value-added model estimated by OLS gives similar results for the private school effect as our more
data intensive dynamic panel methods, although persistence remains overstated. The relative success of the lagged value-
added model can be explained by the countervailing heterogeneity and measurement error biases on (their persistence parameter) and because lagged achievement can also act as a partial proxy for omitted heterogeneity in learning.” They also
note that merely correcting for the bias due to measurement error is likely to make the aggregate bias worse and, particularly
in the private schooling analysis, severely bias coefficients downwards.
They correct for the twin sources of bias through the use of dynamic panel methods (e.g. Arellano and Bond 1991) where they estimate a restricted value added specification after differencing it and then use the scores in other subject as the instrument.
The application of these methods require that there are at least three measures over time and that there are some switchers
between each round. While I would have liked to attempt addressing the two biases similarly, the data available do not enable me to do so even with multiple rounds of data. The Older Cohort did not have comparable tests across the three rounds; in
particular, in the 2002 round of the study, only a basic (ASER-type) reading and writing test and a simple numerical calculation
were asked and as a result I only have two rounds of comparable test data. Similarly, in the Younger Cohort, no test was administered in all three rounds of test data collection (from 2007, 2009-10 and 2011); moreover, the 2011 data collection did
not follow switchers in the Younger Cohort to their new schools unless it was already being covered in the survey. As a result,
in neither cohort can I use dynamic panel estimators to simultaneously correct for these problems.
14 Specifically, they show that a reduction in the pupil-teacher ratio has an equivalent impact whether it was caused due to the
provision of an additional regular teacher or an experimentally-assigned contract teacher. Combined with additional results presented in their paper, that contract teachers and regular teachers had exactly the same impact on test scores per year, this
indicates that VA estimates of the impact of regular teachers were unbiased.
15 A note of caution is sounded by Rothstein (2010) who documents that there may be a possibility of bias due to unobserved heterogeneity. However he does document that the lagged value-added model performs considerably better than cross-
sectional estimates or a gain-score model (similar to results in Andrabi et. al. (2011)) and that using multiple scores from previous years, the evidence of remaining bias is low. In the section on robustness of the main results, I engage directly with
Rothstein's key concern - that achievement measured through test scores may still exclude much information that is available
to relevant decision-makers (headteachers in his case) which could be used to sort students; specifically, I show that controlling for the parent's lagged assessment of the child's academic performance, or parental aspirations about the child's
educational levels, does not change the results on the effect (or lack thereof) of private school enrolment on test scores.

SIZE AND SOURCES OF THE PRIVATE SCHOOL PREMIUM IN TEST SCORES IN INDIA
10
3.2 Estimated specifications
In this section, I estimate the size of the private school effect separately for urban and rural
areas for each of the available test scores for the samples of children aged 8 years (2009/10), 9 years (2011) and 15 years. Descriptive statistics about the background
characteristics of children in the younger and Older Cohort, disaggregated by the type of school in which they are enrolled, are provided in Tables 1 and 2. In both rural and urban areas, there are significant differences in the observable characteristics of children in
government and private schools: children in private schools are likely to be from richer households with more educated parents and are much more likely to be male and first-born children. The share of private school enrolment varies across cohorts and across urban and
rural areas. Furthermore, whereas nearly all children in the Younger Cohort are enrolled in school, by the age of 15 about 22 per cent of children in this sample have dropped out of schooling.
Table 3 presents the raw magnitudes of the test score gaps between children in private and government schools across the three samples and across urban and rural areas.16
The estimated specifications are similar across these samples but differ in some details due
to different data availability. The core specification used for the estimation in the case of the 8-year old sample is as follows:
Yit = α + β1.Privateit + β2.sitei +εit 4( )+β3.Yit−1 5( )
+β4.Xit 6( )+β5.timeuseit 7( )
where Privateit is an indicator variable equaling 1 if the child is enrolled in a private school in 2009/10, with enrolment in a government school as the base category; sitei is a vector of
sentinel site (mandal) fixed effects; Yi ,t−1 is the lagged test score; X is a vector of background
characteristics that includes caste dummies and wealth index, maternal and paternal years of schooling, the sex of the child and whether he/she is the first-born child in the household;
timeuseit is the number of hours spent on a typical day in various activities - specifically, I control for the time use on caring for others, domestic tasks, studying outside of school time (including extra tuition), tasks on the family farm or other family business, time spent in
school and paid work outside of the household.17 In the 9-year old sample (2011), I also have more extensive information about home investments into childen's studies (collected as part of a battery of questions in the child questionnaire of the school visit) which are aggregated
and entered as an index of home support. In the 15-year old sample, in comparison to the specifications for 8-year old sample, I additionally control for the Raven's test score from
16 Since the 9-year old sample has only 23 children in government schools, I do not report any results for children in urban areas
for this sample. The very small sample size restricts me from making any reliable conclusions about results in this sample for
urban areas.
17 This estimation includes controls sequentially as in Equations 4-7. Time use data is included in the penultimate step because
hours spent in school, and possibly hours spent studying after school, are variables that are not merely background variables but allocation decisions which schools can actively affect at least to some degree (through school time-tables and
amount/frequency of homework assigned). The MS study finds that time use in studying after school did not adapt for lottery
winners and thus including time use as controls seems to be prudent. In the 9-year old sample (2011), time use data was not collected and I use the time use as reported at 8 years (2009-10) as controls. In the main body of the paper, I only report
results from the most extensive specification (9) but results in detail at each step are presented in Appendix tables A1 to A3.

SIZE AND SOURCES OF THE PRIVATE SCHOOL PREMIUM IN TEST SCORES IN INDIA
11
2002 (which serves as a proxy for ability). In all regressions in this paper, I cluster standard errors at the sub-district(mandal) level.
In the 8-year old cohort, I use scores from the maths test and the PPVT as outcome
variables. I use the 2007 score on the quantitative section of the Cognitive Development
Assessment as the lagged score for maths and the 2007 score on the PPVT as the lagged measure for the PPVT in 2009/10. In the 9-year old sample, I have three test measures: a maths test (which had common items with the test administered in 2009-10), a test of Telugu
competence and a test on English language competence.18 I use the maths test in 2009-10 as the lagged measure for 2011 maths test and the PPVT (administered in Telugu) as the lag for the Telugu test. Since a test in English was administered for the first time in 2011, I use
the PPVT receptive vocabulary test score as the lagged achievement measure for English. In the 15-year old sample, I use PPVT, maths and Telugu as the outcome variables; furthermore, since over a fifth of this sample is no longer enrolled in school, I also include a
dummy variable for not being enrolled in school in 2009/10.
3.3 Results
In Table 4, I present the coefficient on the private school dummy from Equation ([eq:YC-
flexible]), which includes all available controls, separately for rural areas, in all three samples. In rural areas (Panel A), at the age of 8, there is a significant private school premium of about 0.17 SD in PPVT which is about 35 per cent of the size of the within-community raw premium
in test scores; there is no significant premium in maths test scores. At the age of 9, there is no significant private school premium in maths but there is a very large private school premium in English of about 0.7 SD; in Telugu, there apears to be a negative effect of
attending private schools; this cohort is similar to the sample in MS and the pattern of incidence of a significant private school effect is also similar.19 At the age of 15 years, there is a significant private school premium in all test scores. The size of the premium in this cohort
is relatively modest: about 0.12 SD for PPVT and the Telugu Cloze test and about 0.2 SD for the maths test; in each case, this is between 20–40 per cent of the raw premium.
In urban areas, as is evident from Panel B, I do not find any statistically significant evidence
of a private school premium in either cohort. While this could potentially be due to relatively small sample sizes in urban areas, this does not seem to be the case in practice: in the Older
Cohort, the coefficient itself is very close to zero; and the problem of low sample size is not as severe a problem for the Younger Cohort as it has twice the number of observations. Certainly these results suggest that even if there is a private school premium in urban areas,
which is not detected due to relatively small sample sizes, it is very unlikely to be large in magnitude.
18 At this point, children in the Younger Cohort were aged about 9-10 years which is exactly analogous to the age of the children
in the MS study four years after their experimental intervention offering scholarships. Furthermore, they test the children on all of the three dimensions (Math, Telugu and English) in which test scores are available to us. Therefore results on this sub-
sample are the most comparable to their experimental estimates.
19 There appears, prima facie, to be a major difference in the size of the private school effect in English; MS report a Local Average Treatment Effect (LATE) effect size of about 0.32 SD at 2.5 years (and even smaller at just above 0.2 SD after four
years) which is half the size of the effect I find. One possibility is that the use of Item Response Theory in generating the test scores, which allows items to differ in difficulty and thus changes the contribution of each test item towards a composite test
score, may have changed the spread of the distribution. I reran the estimation using a (normalised) raw score as the
dependent variable. The effect size I get is 0.28 SD which is very close to the two estimates reported by MS.The discrepancy between effect sizes using two different techniques of scoring the test highlights that items did differ in difficulty and that
weighting all test questions equally (as the creation of raw scores does) understates the effect of private schools significantly.

SIZE AND SOURCES OF THE PRIVATE SCHOOL PREMIUM IN TEST SCORES IN INDIA
12
As pointed out by previous research, as well as the MS study, the private school sector is
very heterogeneous. A key aspect of heterogeneity is the medium of instruction; while government schools teach all subjects in the local language, private schools may either use
Telugu or English as the medium of instruction. In Table 5, I present results which re-estimates regressions on the private school premium for the 9-year old sample, distinguishing between English-medium and Telugu-medium private schools (with
government schools as the base category). There is clear evidence of a private school premium in English across both Telugu and English medium private schools with the magnitude (about 0.8 SD) being expectedly greater in the latter but still substantial at about
0.5 SD even in Telugu-medium private schools. Importantly, the negative effect of private schools on Telugu seems to be concentrated entirely in the English-medium private schools and although substantial at 0.36 SD, it is still much smaller than the positive premium of 0.8
SD in English.20 A further interesting pattern to note is that, while they are both not statistically significantly different from zero, the coefficient on going to an English-medium private school is negative for mathematics while that for a Telugu-medium private school is
positive; this also corresponds closely with patterns documented by MS.21
3.4 Robustness
While previous studies on the robustness of VAMs have been encouraging, and indeed
results in this paper on a comparable cohort and indicators conform closely with comparable experimental evidence, the possibility of bias in the estimates cannot be definitively ruled out; this may especially be a concern for indicators/cohorts for which external validation through
the MS study is not available. Analogous to Rothstein's (2010) criticism (delivered in the context of tracking of students into different classrooms by headteachers), while VAMs may deliver unbiased estimates of the private school effect if selection was only on the variables
controlled for and past achievement, it is plausible that parents observe more or different information on child achievement which is used as basis for selecting whether the child is enrolled into private or government schools.22 Furthermore, it is always possible that parents
differ in their degrees of aspirations for children and the preferences they have towards their education; if these preferences lead to a greater propensity to select into private schools (as they are perceived to be of higher quality) and also lead to higher home-based investment 20 In the absence of estimates of labour market returns to English and Telugu, it is not clear how these trade-offs should be
weighted (a point also made by MS). However, it is reasonable to assume that returns to English are significantly greater than local languages including Telugu - this is, for, example, the pattern documented by Munshi and Rosenzweig (2006) in Mumbai
- and certainly seems to be the impression among parents, who view the additional English language proficiency provided by
private schools as one of their biggest draws.
21 The close correspondence between patterns in this paper and in the MS study indicate, in addition to a lack of bias in the VA
estimates, that schools have not made material adjustments to their inputs as a result of the MS voucher and that there has also not been a large adaptation on the part of parents/households. As Todd and Wolpin (2003) discuss in detail, and Das et.
al. (2013) show in practice, experimental treatment effects and production function parameters need not coincide: while
experimental estimates identify the `total policy effect', production function parameters identify the partial derivative keeping other inputs fixed. MS document that lottery winners did not, in fact, change their time use patterns; further it seems unlikely
that a one-off intervention applying only to one cohort of children (in kindergarten and Grade 1 at the start of the experiment)
would lead schools to adapt their long-term production strategies.
22 Parent's assessments of the child's academic performance may contain information other than that contained in test scores for
at least two reasons. Parents may observe much more about their children than our survey measures can capture; and parental assessments may have significant measurement error of their own (if, for example, parents cannot reliably assess a
child's actual progress i.e. how well the child should have done as opposed to actual achievement). The precise reason for
(possible) divergence of parental assessments from achievement data on our test measures is not central to the issue; what is important is that selection on ability, if any, depends on the former (parental) measure and not the latter (test scores). If there is
systematic divergence between the two, it is plausible that bias may still exist.

SIZE AND SOURCES OF THE PRIVATE SCHOOL PREMIUM IN TEST SCORES IN INDIA
13
which is not captured in our range of controls or proxied by past achievement, then our estimate of the private school effect might be biased.
I attempt to test directly for these sources of bias by using unique proxies available in the
Young Lives data for these sources of bias. In 2007 and 2009/10, in both cohorts, the
household survey collected parents' assessments of how they thought the child (if enrolled at the time) was performing in school; the measure was collected on a five-point scale with 1 being “Excellent” and 5 being “Very bad”. Furthermore, in 2007 the survey asked parents
what they would desire as the highest level of education for their child, in the absence of any constraints. These measures seem to be meaningful: average test scores in mathematics seem to increase incrementally for each point of the parental assessment scale; similarly,
parental aspirations about a child's education (reduced to a dummy variable for whether the parent would like the child to go to university) seem to be associated in bivariate correlation with private school attendance. As a robustness check on this possible source of bias, I
estimate the lagged VAMs on the all three age samples supplementing the specification with a vector of dummy variables for each point of the parental assessment scale (with “Excellent” as the omitted category) and a dummy variable for whether the parent desires the child to go
to university.23
Results from this analysis are given for rural areas in Table 6; as can be seen, even though
there is information in the parental assessments and their educational aspirations which is related to test scores, the coefficients on the private school dummy variable seem to be
unchanged from the main estimates.24 I find no evidence of additional bias in the VAM specification estimated in the previous subsection.25
Finally, I estimate specifications which test for the possibility of a different lag stucture in the
VAMs: specifically, I estimated the main regression specifications including a third-order polynomial of the lag (as in Deming et. al. (2011), Chetty, friedman and Rockoff (2011) and
Kane and Staiger (2008)) instead of the lag only in levels (as in all specifications heretofore) and, separately, by including also lagged measures from time t-2 instead of just a single period lag; coefficients on the private school premium seem stable and unchanged.26
23 In 2007, children in the 8-year cohort were aged between 4.5 and 6 years and only about 44 per cent had joined formal
schooling; for enrolled children parental assessment of performance at school was collected. Most other children were in
preschools (including anganwadis) and the survey asked for the parent's assessment of child performance there. Together
these two variables allow me to construct lagged measures of parental assessment for the 8-year old cohort.
24 This is true for most coefficients in the regressions apart from the lagged achievement measures which decline in magnitude. This indicates that parents' assessments of child performance, although informative, do not seem to bias the estimates and
probably reflect information similar to the lagged achievement measures.
25 While additional coefficients are not presented in the paper, it is interesting to further note that the inclusion of these variables does reduce the impact of the lagged achievement variables which is entirely consistent with the latter being a summary
statistic for the full history of past inputs, a core assumption of the value-added modelling approach
26 These results are available on request but have not been included in the paper.

SIZE AND SOURCES OF THE PRIVATE SCHOOL PREMIUM IN TEST SCORES IN INDIA
14
4. Decomposing learning production in schools In this Section, I examine differences in the vector of inputs used across private and government schools and the productivity of these inputs in producing test scores.
4.1 What differs in inputs across government and private schools?
Table 7 presents the descriptive statistics about school, class and teacher characteristics in
the sample, and student-level observations/reports of school experience, by school type
across rural and urban areas.
Private schools differ from government schools on several dimensions: they typically have
more students and more teachers, are more likely to have access to amenities like toilets, drinking water, electricity connection and libraries, and mostly report using English as the
medium of instruction. Teachers in private schools are much more likely to be women, younger, less experienced, less likely to hold a teaching qualification, paid a fraction of the salaries of their government school counterparts and are less likely to hold a permanent
contract; these teachers are much more likely to use a textbook during class observations by survey interviewers, are more likely to have marked most or all of the work in the notebooks of the children in the sample, and are much less likely to be reported as being frequently
absent by their students. Government schools are much more likely to have multi-grade teaching (i.e. children of more than one grade being taught in class at the same time) and typically have a single teacher teach all subjects across the grade. However, private schools
have worse student-teacher ratios on aggregate in these data, larger effective class sizes and a larger proportion of boys in class. This broad stylised picture seems to be true across both rural and urban areas.
4.2 Decomposing school productivity
In Table 7 we saw that not all differences in schooling were in favour of private schools: how
do these differing factors determine productivity of schools in the two sectors in production of learning achievement?
My estimation strategy for answering the above question takes Equation (7) as estimated for
the 9-year old sample as the base and adds factors at the school, class and teacher level to estimate the relative contribution of these factors in promoting achievement; I only estimate this specification for rural areas. Specifically, I estimate the following specification for the test
scores in Telugu, English and Maths:
Yit =α + β1.Privateit + β2.sitei + β3.Xit + β4.homesupportit + β5.Yi ,t−1+ β6.Sit + β7.Cit + β8.Tit +εit (8)
where Sit is a vector of school variables that includes an index of school facilities and the
student–teacher ratio in the school; Cit is a vector of class level controls which includes whether the class was observed to be using a textbook during the observation of the maths

SIZE AND SOURCES OF THE PRIVATE SCHOOL PREMIUM IN TEST SCORES IN INDIA
15
lesson, the effective class size,27 the percentage of boys in the class and whether the class
was a multi-grade classroom; Tit is a vector of controls relating to teachers which includes dummy variables for the teacher's level of education and whether the teacher is permanent
or temporary, the teacher's experience (in years), whether the child had a notebook with all or most of the work marked by the teacher, whether the child reported that the teacher was frequently absent and whether he/she attended extra classes with his/her teacher after
school. The survey also included a test of the teacher's pedagogical knowledge in mathematics, which is included in the regressions on maths scores.28 Results are available on request. Other controls – ateit , siteit , Xit , homesupportit and
Yi ,t−1 – are defined as in
Eq(7). Given that the Round 3 (2009-10) data collection and the school-based data collection are separated by less than a full academic year, there may be concerns as to whether adequate progress on learning has been made which can be captured through these
specifications. Accordingly I also use specifications which control for the lag from 2007 instead of 2010; the pattern of results does not change substantially.29
Table 8 presents the results from this exercise for rural areas. Of school-level variables,
infrastructure seems positively associated with test scores but the coefficients are always
insignificant; the coefficient on student-teacher ratio is both statistically insignificant and very small albeit in the expected direction (smaller student–teacher ratios are positively related to achievement). Class size has an expected negative effect: coefficients across the three tests
imply that a difference in class size by 11 children (about the difference between the average class in a government school and an average class in a private school in the rural sample) results in roughly a difference in test scores by about 0.1 SD. Teacher absenteeism has a
strong negative impact on maths and Telugu scores (although not significant on the latter). Teacher practice within classrooms – checking children's notebooks and using textbooks in class – is positively related to achievement and with large magnitudes.Teacher training,
teacher experience and teacher tenure do not seem to have any effect on test scores.30
27 The effective class size variable equals the number of children enrolled in the class if the class is not combined with other
grades. Where the class is combined with other grades, the class size is the sum of the enrolment in all the grades which are
combined with the grade of the Young lives child (as reported by the head-teacher). This process tries to account for the fact
that many classes are taught in multi-grade settings; the effective class size, as defined above, is significantly higher in government schools than the uncorrected class size.
28 Given large differences in incentive structure across the two sectors, I also estimated a specification with interaction terms for teacher tenure, experience, education, qualifications and knowledge (for maths) with the private school dummy. I do not find
much evidence of heterogeneity here and the interactions were mostly insignificant.
29 It is somewhat surprising that results from specifications that use the lagged achievement measure from 2007 are not substantially
bigger than results which use the lagged achievement measure from the preceding school year; the former are impacts of value-added over four years whereas the latter are estimates over a single year. It is quite plausible that this is caused due to very low
levels of persistence in impacts across years. This is also the case in the MS study: their estimates of the private school effect at 4
years after the experiment began are actually smaller than their impact at 2.5 years. Various studies across contexts (Andrabi et. al. 2011, Rothstein 2010 and Kane and Staiger 2008) have documented that persistence rates are as low as 25% from year to
year; low persistence has also been demonstrated in the Indian case by Banerjee et. al. (2007) who report the results of two
interventions, using para-teachers and computer-aided learning, to promote learning outcomes.
30 A constant concern in the estimation of achievement production functions is the endogenous placement of inputs; if the vector
of inputs is selectively targeted towards children based on unobserved characteristics that also affect achievement directly, then input coefficients will be biased. In this particular setting, this will be the case if parents are targeting children into
schools, or schools are targeting into classrooms, based on unobserved characteristics of children that are not proxied by
lagged achievement. As demonstrated in Section 3, endogenous placement by parents does not seem to be a concern in the VA specifications in this data. Multiple sections per grade are uncommon in rural Andhra Pradesh and so tracking across
classrooms based on unobserved characteristics (which are not proxied by lagged achievement) is also unlikely to be an
important concern. Further credence is lent to the reliability of VA estimates of input effectiveness by the results presented by Muralidharan and Sundararaman (2012) who find no differences in the impact of the productivity of contract teachers and
class size as assessed using VAMs and experimental variation.

SIZE AND SOURCES OF THE PRIVATE SCHOOL PREMIUM IN TEST SCORES IN INDIA
16
A somewhat surprising pattern is the consistently large positive effect and strong significance
of the dummy for multi-grade classroom; a priori it is reasonable to expect that multi-grade teaching will exert a negative influence on test scores as multi-grade teaching in Indian
schools is not typically a planned intervention but a necessity due to the availability of fewer teachers in government schools compared to the number of grades offered. This effect is identified within the government school sector since private schools very rarely have multi-
grade classrooms. One possible explanation is that, in the context of a `no-retention' policy which is in place in government schools and sees automatic promotion from one grade to the next, it may be beneficial for weaker children to sit in the same grade as children in the year
below them; an alternative (and not mutually exclusive) story could be that better-performing students in lower grades benefit from being seated with children in higher grades.31
Home support, wealth and hours per day studying outside of school time have large and
statistically significant effects, even controlling for the various school-based inputs.
4.3 Do student perceptions of schooling matter?
The analysis of achievement production in government and private schools focused on
traditionally measured inputs. In this subsection, I investigate whether students' perceptions
of their schooling experience and their own beliefs about their agency and efficacy predict their test scores, conditional on the other school and home based investments examined previously.
The school survey data allow me to construct five measures, in addition to the home support index previously described, based on these attitudinal items: an index of locus of control
which measures the degree to which a student feels that outcomes in their life are under their control and their assessment of their ability to achieve favourable outcomes; an index of self-efficacy/academic self-concept which reflects an individual's self-assessment of their
competence in different domains of learning; an index of peer support which is a measure aggregating over a child's subjective reponses to questions on several domains of support from peers; an index similarly measuring teacher support; and finally an index of school
experience which aggregates responses to several dimensions of a child's experience of the school. Cross-tabulation of the statements that underlie each measure is presented in Appendix Table A4.32
There is variation in these measures, even though most individual statements are skewed
rightwards. Students in rural private schools report significantly higher degrees of self-efficacy and peer support as well as a much more positive assessment of their school experience (Table 9) than students in government schools. They are significantly more likely
to report being happy going to school, enjoying all their lessons and feeling safe at school. Students in private schools are much more likely to report self-assessments of being good in math and English (but not Telugu), being proud of their achievements at school, and being
31 As Glewwe et. al. (2011) note in a comprehensive review, the evidence on multi-grade teaching is decidedly mixed with
different studies finding positive and negative signs. In the Indian case, the availability of other datasets with children in
different classrooms in the same schools (e.g. the School TELLS data collected by Geeta Kingdon and collaborators) and
sometimes for multiple years (such as in the AP Randomised Studies of Education) can allow for a broader investigation to establish whether this result is specific to our sample or possibly a generalisable phenomenon at least within India. See also
Little (2007) for a discussion of diverse experience of multi-grade education across developing countries.
32 To construct the indices, each negative statement was recoded, all statements were normalised and an aggregate taken of the non-missing responses per child.
SIZE AND SOURCES OF THE PRIVATE SCHOOL PREMIUM IN TEST SCORES IN INDIA
17
able to do class work without help. Finally, and somewhat surprisingly, children in private schools also give more positive reports of support from peers; they are more likely to report that they can approach other students for help, that all other students in class are their
friends, and less likely to report that children in their class tease them.
They also report somewhat higher levels of teacher support and locus of control, but these
differences are not statistically significant. An exception, in which differences are marked and statistically significant, is in questions around fairness: children in private schools are much
less likely to report that their teacher behaves `unfairly' in statements assessing child's perceptions of fairness.
My method of investigating any effects of these characteristics on student achievement is
straightforward: using Equation (8) as the base, I sequentially add the assessments of peer
support and teacher support, indexes of agency and self-efficacy, and finally the index of school experience.33 As can be seen in Table 10 for rural areas, while peer support does not seem to matter in our estimation, assessments of teacher support are strongly predictive of
learning gains in maths and Telugu: a 1 SD increase in teacher support is associated with a rise in maths scores by about 0.1 SD. Both agency and self-efficacy matter as well. And finally, children's assessments of their schooling experience is also very strongly significantly
predictive with a 1 SD change being associated with a 0.1–0.2 SD improvement across the three test scores.
Interpreting these estimates requires care. It is conceivable that that there is an endogenous
relationship between attitudes such as self-efficacy and school experience and actual achievement in the form of test scores: it could be, for example, that doing better in school
prompts greater happiness with the schooling experience and that is captured in the subjective assessments of school experience; it could also be the case that teachers are more supportive to better-performing students. There are two important things to note
however: all regressions in Table 10 control for academic achievement in the previous session which should guard substantially against simple versions of the bias noted above – to the extent we worry that these attitudes may themselves be products of the past
achievement history, controlling for this history should allay some of these concerns. Furthermore, all regressions also control for the full range of school, class and teacher characteristics as in Equation ([eq:School decomposition])which should guard against the
possibility of these characteristics being a mere reflection of standard school inputs and bolster the case that these attitudes and non-cognitive skills independently affect future outcomes.34
Measures of psychosocial variables in the school based data seem to be informative: they
show important variation between individuals, this variation seems to be predictive of test achievement, and this association is robust to the inclusion of a rich set of controls at the school and household level and the past achievement of the child. This presents, in my
33 I add variables in this sequence to also see the structure of partial correlations within these measures: it is conceivable that
support from teachers and peers contributes directly to agency and self-efficacy, and that these four constructs contribute to
school experience.
34 I do not investigate the correlates of these psychosocial variables but merely control for schooling inputs to avoid confounding effects of, for example, teacher characteristics. To the extent that we may care about psychosocial outcomes as outcomes of
interest on their own, for example caring about children's happiness about school independently of their test performance in school, such an investigation may also be worthwhile. Patterns here do suggest cross-productivity across these different
domains of child well-being and performance in school.
SIZE AND SOURCES OF THE PRIVATE SCHOOL PREMIUM IN TEST SCORES IN INDIA
18
opinion, strongly suggestive evidence for the possibly large effects of these psychosocial variables on achievement and possible gains in attempting to also measure them in other data collection in schools in developing countries.35 This is important to note because our
current knowledge of which, if any, interventions might be able to shift these variables remains limited.36
It is worth recognising that the discussion above has only evaluated any possible
instrumental role of these attitudinal variables in producing learning outcomes; however, it is
quite conceivable to think of these measures also as having intrinsic value and being welfare indicators on their own merit. Unfortunately, not much can be conclusively said based on the available data as to whether private schools cause higher reports on these indicators and/or
which features of school organisation lead to more positive outcomes in these domains: such causal attribution will require either experimental variation or the availability of multiple rounds of data on these attitudinal measures with either switchers across school types or
changes in school facilities; this type of data is not presently available.37
5. Conclusion In this paper, I investigated the extent of test score gaps between students of private and government schools across several cognitive domains for children aged 8 years, 9 years and
15 years in rural and urban areas; I have tried to isolate the extent to which any gaps might be causal effects of private schools; and I have attempted to understand the sources of learning achievement at the school level.
Raw differences in test scores between children in private and government schools are
invariably substantial, statistically significant, and favour private school students. However, much of this variation seems to be a reflection of greater home investment and socio-economic background. Upon controlling for a wide ranging set of controls and prior
achievement, for younger children I find evidence of substantially better performance only in English and a somewhat smaller effect on receptive vocabulary. For older children, I do find significant impacts of going to private schools on their scores in mathematics and Telugu;
while these differences are consistently significant, they are relatively modest at about 0.2 SD and only between 20–40 per cent of the average within-community difference in test scores. In urban areas, I find no evidence of a significant private school effect.
35 This evidence cannot definitively be given a causal interpretation since it is possible that contemporaneous shocks which
positively raise both test scores and these subjective measures might bias the estimates. This possibility is plausibly more of a threat for identification of the impact of psychosocial variables (which are subject to child-level shocks while classroom or
school level inputs presumably are not, or at least are less so). However, the results do show a persistent correlational pattern
and are suggestive of a causal link.
36 Recent rare exceptions in the economics literature include Glewwe et. al. (2013) who study the impact of child sponsorship on
raising aspirations and self-esteem, Krishnan and Krutikova (forthcoming) who report substantial effects of an intervention in an urban Mumbai slum to raise self-esteem and self-efficacy, and Bernard et. al. (2011) who report experimental results from
an intervention designed to raise aspirations.
37 A possibly convincing placebo test in the spirit of Rothstein (2010) would be to test if private school attendance at the age of 8-9 years can predict higher attitudinal outcomes (or parental assessments of these domains) at the age of 4-5 years before
children have joined schools, once background characteristics have been controlled for. Unfortunately, no such measures exist in the Young Lives data; the first such measures are taken in 2009 when the children had already attended school for 2 to
3 years.

SIZE AND SOURCES OF THE PRIVATE SCHOOL PREMIUM IN TEST SCORES IN INDIA
19
The results have several implications of interest for policy-makers. Combined with previous
work highlighting that the average cost per child in rural private schools is less than a third of the average cost in the state schools, and that private schools dedicate less instructional time
to Telugu and mathematics, they suggest strongly that private schools are considerably more productive than government schools. However, they also imply that the spread of private schools is unlikely to raise average achievement levels as measured by mathematics skills or
functional literacy significantly; with the exception of English, I do not find any large and consistently positive `private school effect'. To the extent that the first-order concern for education policy in India remains the abysmally low levels of achievement in general, rather
than the inefficiencies in the delivery of education services, the spread of private schooling by itself is clearly not an adequate solution.38
The large and significant private school premium in English, provided without any trade-off in
other subjects in the case of Telugu-medium private schools and only a modest trade-off in
English-medium schools, could lead to a possibly large wage premium for private school students in the future. Combined with the selectivity on socio-economic background in the private sector, this premium provides possible grounds for concern that private schools
hinder social mobility and facilitate the intergenerational persistence of socio-economic status. The precise extent to which the presence of private schools causally leads to greater inequality in test scores is hard to assess: even if no private schools were available, wealthier
parents could have invested in their children to capture any English-language wage premium through specialist language classes (as in Jensen 2012) or extra tuition after school. The objective of reducing inequality in learning is likely to be better served by a policy of
improvements in the quality of education in state schools and by improving the ability of children to access better quality education regardless of their parents' socio-economic background,39 rather than any policies aimed at a containment of private schooling (for
example, through onerous licensing or recognition regulations).
Results on the sources of learning in schools highlight, in keeping with previous literature,
that teacher accountability remains one of the core problems in the delivery of public education in India. Government school teachers are much better paid than teachers in
private schools, have much greater job security, are much more likely to have received specialist teacher training, and are more experienced than teachers in private schools on average; yet, they are more likely to be absent from school and their students report that they
are less approachable and less fair; results in Section 4 indicate that these factors have a direct impact on the performance of children. I find little evidence that characteristics such as
38 The dichotomy between the two objectives - raising overall achievement and reducing the per-unit cost of achievement
production - is partly artificial: it is, of course, possible (even desirable) for policy-makers to be concerned about both of these objectives. However, it needs to be acknowledged that the two objectives are distinct. Supportive evidence that the rapid rise
in private schooling will only partially, if at all, address the problem of low achievement in Indian schools is also provided by
the two major trends documented in the 2012 ASER Report (Pratham 2013): while private schools have rapidly increased in their share of enrolment in rural areas between 2005 and 2012, achievement levels across states have either stayed flat (for
example, in Andhra Pradesh) or in many states even declined.
39 There are two recent and prominent examples of such interventions both of which are responsive to the greater efficiency of the private schooling sector. The first, specific to Andhra Pradesh, is that government schools have introduced English as a
second language from Grade I since the 2011-12 session; according to contemporary news articles, the explicit reason given by the relevant minister for the decision was that parents were removing their children from state schools because English was
not being taught. The second, which is of national relevance, is the reservation of 25 per cent of all seats in private schools for
economically disadvantaged children under the Right to Education Act (RTE) 2010, for which compensation to the schools will be provided by the state; this particular provision is clearly based on an appreciation of the need of lowering the economic
barriers to accessing schooling of better (perceived) quality.

SIZE AND SOURCES OF THE PRIVATE SCHOOL PREMIUM IN TEST SCORES IN INDIA
20
tenure, teacher experience or teacher performance on a test of pedagogy affect test scores but the effect of teacher absence and low effort seems to be strongly negative and substantial. In light of these findings, the strong focus of the Right to Education Act 2010 on
teacher qualifications, and the relative lack of focus on measures to address teacher absence and low effort, seems misplaced. These results, taken together, also suggest that flat public sector pay increases and in-service trainings would be at best very blunt, and more
probably entirely ineffective, in addressing the issue of teacher motivation and incentives.40
This study also attempts to contribute methodologically to the literature. The close
correspondence of the results with experimental estimates on a comparable sample from Muralidharan and Sundararaman (2013), as well as other robustness checks reported in the
paper, provide evidence of the robustness of value-added models as a mechanism for investigating causal differences across school effects or teacher effects, which echoes a recent literature from the US and Pakistan. This is important since experiments may not be
uniformly feasible across contexts and convincing natural experiments may not be available in many situations where evaluating a relevant policy question remains important.41
Finally, results documenting that there are important differences in the self-efficacy and the
school experience of children across private and government schools highlight that
comprehensive comparisons of school effectiveness in these two sectors need to also incorporate the differential experience that children in these schools have; given evidence that these subjective indicators seem to matter directly for learning production, understanding
the differences in these attitudes appears to be an interesting and important area of further research.
40 Perhaps the most promising interventions thus far have been reported by Muralidharan and Sundararaman (2011) and Duflo
et. al. (2012) who present experimental evidence that even small economic incentives to teachers can end up with large gains
across test scores and that these learning gains persist (Muralidharan 2012a). While there are significant concerns in generalising these results and it is possible that these interventions are ineffective once scaled up and put in charge of local
authorities (e.g. see. Banerjee et. al. (2008) for a health intervention), they are probably the most promising ideas that have
been tested yet on how to improve incentives for public sector workers. For a thoughtful synopsis of what the implications of the accumulated evidence from the economics of education might be for education policy in India, please see Muralidharan
(2012b).
41 It is additionally important to evaluate the robustness of VAMs in this setting since it is plausible that, if government schools do move towards a system of targeting learning outcomes instead of merely inputs (as advocated by, for example, Muralidharan
(2012b)), then panel data on child learning outcomes would be available across the Indian public educational system. In such a scenario, it is likely that the use of VAMs will proliferate - it is worthwhile to know to what extent results from such analytical
exercises will be reliable and useful.

SIZE AND SOURCES OF THE PRIVATE SCHOOL PREMIUM IN TEST SCORES IN INDIA
21
References Andrabi, T., J. Das, A.I. Khwaja and T. Zajonc (2011) ‘Do value-added estimates add value?
Accounting for learning dynamics’, American Economic Journal: Applied Economics 3(3): 29–54.
Angrist, J.D., P. Pathak and C.R. Walters (2011) ‘Explaining Charter School Effectiveness’,
NBER Working Papers 17332.
Arellano, M. and S.R. Bond (1991) ‘Some tests of specification for panel data: Monte Carlo
evidence and an application to employment equations’, Review of Economic Studies 58(2): 277–297.
Azam, M., A. Chin and N. Prakash (2013) ‘The returns to English-language skills in India’, Economic Development and Cultural Change 61(2).
Bandura, A. (1982) ‘Self-efficacy mechanism in human agency’, American Psychologist
37(2): 122–147.
Bandura, A. (1993) ‘Perceived self-efficacy in cognitive development and functioning’,
Educational Psychologist 28(2): 117–148.
Banerjee, A.V., S. Cole, E. Duflo and L. Linden (2007) ‘Remedying Education: Evidence from
Two Randomised Experiments in India’, Quarterly Journal of Economics 122(3): 1235–1264.
Banerjee, A.V., E. Duflo and R. Glennerster (2008) ‘Putting a Band-Aid on a corpse:
Incentives for nurses in the Indian public health care system’, Journal of the European
Economic Association 6(2-3): 487–500.
Bernard, T., S. Dercon and A.S. Taffesse (2011) Beyond Fatalism: An Empirical Exploration
of Self-efficacy and Aspirations Failure in Ethiopia.
Bold, T., M Kimenyi, G. Mwabu and J. Sandefur (2011) ‘The High Return to Private
Schooling in a Low-Income Country’, Working Paper 279, Center for Global Development.
Chetty, R., J.N. Friedman and J.E. Rockoff (2011) ‘The long-term impacts of teachers:
Teacher value-added and student outcomes in adulthood’, Technical report, National Bureau
of Economic Research.
Chudgar, A. and E. Quin (2012) ‘Relationship between private schooling and achievement:
Results from rural and urban India’, Economics of Education Review 31(4): 376–390.
Cueto, S. and J. Leon (2013) ‘Psychometric Characteristics of Cognitive Development and
Achievement Instruments in Round 3 of Young Lives’, Young Lives Technical Note 25.
Cueto, S., J. Leon, G. Guerrero and I. Munoz (2009) ‘Psychometric Characteristics of
Cognitive Development and Achievement Instruments in Round 2 of Young Lives’, Young
Lives Technical Note 15.
Cunha, F. and J.J. Heckman (2008) ‘Formulating, identifying and estimating the technology
of cognitive and noncognitive skill formation’, Journal of Human Resources 43(4): 738–782.
Cunha, F., J.J. Heckman and S.M. Schennach (2010) ‘Estimating the technology of cognitive
and non-cognitive skill formation’, Econometrica 78(3): 883–931.

SIZE AND SOURCES OF THE PRIVATE SCHOOL PREMIUM IN TEST SCORES IN INDIA
22
Das, J., S. Dercon, J. Habyarimana, P. Krishnan, K. Muralidharan and V. Sundararaman
(2013) ‘School Inputs, Household Substitution and Test Scores’, American Economic Journal: Applied Economics 5(2): 29–57.
Das, J. and T. Zajonc (2010) ‘India shining and Bharat drowning: Comparing two Indian
states to the worldwide distribution in mathematics achievement’, Journal of Development Economics 92(2): 175–187.
Deming, D., J. Hastings, T. Kane and D. Staiger (2011) ‘School choice, school quality and
academic achievement’, NBER Working Paper 17438.
Desai, S., A. Dubey, R. Vanneman and R. Banerji (2008) ‘Private Schooling in India: A New Educational Landscape’, in India Policy Forum vol 5: 1–58, Global Economy and
Development Program, Brookings Institution.
Duflo, E., R. Hanna and S.P. Ryan (2012) ‘Incentives work: Getting teachers to come to
school’, American Economic Review 102(4): 1241–1278.
French, R. and G.G. Kingdon (2010) ‘The relative effectiveness of private and government
schools in rural India: Evidence from ASER data’, DoQSS Working Papers.
Glewwe, P., P.H. Ross and B. Wydick (2013) ‘Developing aspirations: The impact of child sponsorship on self-esteem and aspirations’, Mimeo.
Glewwe, P.W., E.A. Hanushek, S.D. Humpage and R. Ravina (2011) ‘School Resources and
Educational Outcomes in Developing Countries: A Review of the Literature from 1990 to 2010’, NBER Working Paper 17554.
Jensen, R. (2012) ‘Do Labor Market Opportunities Affect Young Women’s Work and Family
decisions? Experimental Evidence from India’, Quarterly Journal of Economics 127(2): 753–792.
Jimenez, E., M.E. Lockheed and V. Paqueo (1991) ‘The relative efficiency of private and
public schools in developing countries’, World Bank Research Observer 6(2): 205–218.
Kane, T.J. and D.O. Staiger (2008) ‘Estimating Teacher Impacts on Student Achievement:
An Experimental Evaluation’, NBER Working Papers.
Kingdon, G.G. (1996) ‘The Quality and Efficiency of Private and Public Education: A Case-
Study of Urban India’, Oxford Bulletin of Economics and Statistics 58(1): 57–82.
Kingdon, G.G. (2007) ‘The progress of school education in India’, Oxford Review of
Economic Policy 23(2): 168–195.
Krishnan, P. and S. Krutikova (forthcoming) ‘Skill Formation in Bombay Slums’, Labour
Economics
Kumra, N. (2008) ‘An Assessment of the Young Lives Sampling Approach in Andhra
Pradesh, India’, Young Lives Technical Note 2.
Little, A.W. (2007) Education For All and Multi-grade Teaching: Challenges and
Opportunities, Springer.
Munshi, K. and M.R. Rosenzweig (2006) ‘Traditional Institutions Meet the Modern World:
Caste, Gender and Schooling Choice in a Globalizing Economy’, American Economic Review 96(4): 1225–1252.
Muralidharan, K. (2012a) ‘Long-Term Effects of Teacher Performance Pay: Experimental
Evidence from India’, unpublished.

SIZE AND SOURCES OF THE PRIVATE SCHOOL PREMIUM IN TEST SCORES IN INDIA
23
Muralidharan, K. (2012b) ‘Priorities for Primary Education Policy in India’s 12th five-year
Plan’, unpublished.
Muralidharan, K. and M. Kremer (2009) ‘Public and Private Schools in Rural India. School
choice international: Exploring public-private partnerships’ (pp.91).
Muralidharan, K. and V. Sundararaman (2011) ‘Teacher performance pay: Experimental
evidence from India’, Journal of Political Economy 119(1): 39–77.
Muralidharan, K. and V. Sundararaman (2012) ‘Contract Teachers: Experimental Evidence
from India’, unpublished.
Muralidharan, K. and V. Sundararaman (2013) ‘The Aggregate Effect of School Choice:
Evidence from a two-stage experiment in India’, unpublished.
Pal, S. (2010) ‘Public infrastructure, location of private schools and primary school attainment
in an emerging economy’, Economics of Education Review 29(5): 783–794.
Pratham (2013) ‘Annual Status of Education Report 2012’, Technical report, Pratham, New Delhi.
Rothstein, J. (2010) ‘Teacher quality in educational production: Tracking, decay, and student
achievement’, Quarterly Journal of Economics 125(1): 175–214.
Todd, P.E. and K.I. Wolpin (2003) ‘On the Specification and Estimation of the Production
Function for Cognitive Achievement’, The Economic Journal 113(485): F3–F33.
Todd, P.E. and K.I. Wolpin (2007) ‘The Production of Cognitive Achievement in Children:
Home, School, and Racial Test Score Gaps’, Journal of Human Capital 1(1): 91–136.
Van der Linden, W.J. and R.K. Hambleton (1997) ‘Item Response Theory: Brief History,
Common Models, and Extensions’, Handbook of Modern Item Response Theory (pp. 1–28).

SIZE AND SOURCES OF THE PRIVATE SCHOOL PREMIUM IN TEST SCORES IN INDIA
24
Tables
Table 1. Descriptive statistics, Younger Cohort (2009-10)
Rural Areas Urban Areas
Government Private Difference Government Private Difference
Mother’s education 2.96 5.08 -2.12*** 3.75 7.95 -4.20***
Father’s Education 4.75 7.70 -2.95*** 5.11 9.17 -4.07***
Male 0.49 0.62 -0.12*** 0.48 0.55 -0.07
First-born child 0.34 0.48 -0.14*** 0.27 0.46 -0.19***
Scheduled Caste 0.23 0.15 0.08*** 0.20 0.08 0.12*
Scheduled Tribe 0.19 0.09 0.10*** 0.07 0.01 0.06*
Other Backward Classes 0.49 0.48 0.01 0.40 0.47 -0.07
Other castes 0.09 0.28 -0.19*** 0.33 0.44 -0.11
Monthly per capita expenditure (2009-10) 725.69 1101.90 -376.21*** 780.91 1095.23 -314.32***
Time use (hours spent on ‘typical’ day)
caring for others 0.22 0.19 0.03 0.09 0.18 -0.08*
household chores 0.40 0.25 0.15*** 0.26 0.25 0.01
at school 7.60 8.02 -0.41*** 7.64 7.94 -0.30**
studying after school 1.75 2.09 -0.34*** 1.65 1.96 -0.31*
unpaid work outside household 0.02 0.00 0.01 0.00 0.00 0.00
paid work outside household 0.00 0.01 -0.00 0.01 0.00 0.01
play/general leisure 4.80 4.35 0.45*** 5.14 4.62 0.52**
sleeping 9.20 9.09 0.10* 9.20 9.01 0.19
N 1050 391 1441 85 374 459
*** p<0.01, ** p<0.05, * p<0.1
Table 2. Descriptive statistics, Older Cohort (2009-10)
Rural Areas Urban Areas
Not enrolled
Public School
Private School
Not enrolled
Public School
Private School
Raven’s test score (2002) -0.10 -0.09 0.10 0.07 0.01 0.31
Mother’s education (years) 1.27*** 4.13 4.44 3.42 4.06 7.09***
Father’s education (years) 2.49*** 4.67 6.72*** 4.77 5.91 9.54***
Male 0.41 0.49 0.58 0.48 0.39 0.58**
Eldest child 0.23 0.26 0.43*** 0.23 0.33 0.48*
Scheduled Castes 0.22 0.27 0.11*** 0.23 0.22 0.05**
Scheduled Tribes 0.12 0.13 0.10 0.00 0.03 0.01
Other Backward Classes 0.55 0.48 0.47 0.32 0.52 0.49
Other Castes 0.10 0.12 0.32*** 0.45* 0.21 0.44***
Monthly per capita real expenditure (2009-10) 1004.38 967.67 1201.72* 990.79 981.74 1444.43***
Time Use (hours on typical day)
Sleeping 8.70*** 8.21 7.96** 8.61* 8.22 8.19
caring for others 0.58*** 0.21 0.18 0.42 0.19 0.14
household chores 2.47*** 1.44 0.86*** 2.10** 0.96 0.76
Family farm/business/hh enterprise 1.95*** 0.18 0.13 0.58 0.00 0.04*
paid work outside household 4.53*** 0.06 0.00** 4.71*** 0.00 0.00
at school 0.39*** 7.87 8.58*** 0.00*** 7.70 8.81***
studying after school 0.16*** 2.40 2.83** 0.42*** 2.66 2.60
N 189 412 139 31 68 137
*** p<0.01, ** p<0.05, * p<0.1

SIZE AND SOURCES OF THE PRIVATE SCHOOL PREMIUM IN TEST SCORES IN INDIA
25
Table 3. Raw premium in test scores (Private - Government)
Math PPVT Telugu English
Rural
8 years (2009-10) 0.51*** 0.45***
9 years (2011) 0.49*** 0.26*** 1.05***
15 years (2011) 0.49*** 0.67*** 0.46***
Urban
8 years (2009-10) 0.56*** 0.31***
15 years (2011) 0.34*** 0.27** 0.18
*** p<0.01, ** p<0.05, * p<0.1 Only 23 children are in urban government schools in 9-year old (2011) sample. Therefore results for this group are not reported.
Table 4. Coefficient on Private School dummy
Math PPVT Telugu English N (math)
Rural Areas
YC (8 years, 2009-10) 0.076 0.17** 1,438
(0.073) (0.066)
YC (9 years, 2011) 0.057 -0.21* 0.68*** 743
(0.056) (0.10) (0.14)
OC (15 years, 2011) 0.19** 0.15* 0.14* 731
(0.074) (0.084) (0.075)
Urban Areas
YC (8 years, 2009-10) 0.16 0.19 458
(0.17) (0.21)
OC (15 years, 2011) 0.074 -0.053 -0.059 234
(0.12) (0.077) (0.13)
Regressions control for child and household characteristics, sub-district fixed effects, lagged achievement score. Standard errors are clustered at sub-district (mandal level)
Table 5. Heterogeneity by medium of instruction (Rural areas)
Math Telugu English
Private School - English medium -0.093 -0.36** 0.80***
(0.081) (0.14) (0.13)
Private school - Telugu medium 0.21 -0.079 0.58***
(0.13) (0.11) (0.15)
Observations 769 711 672
Regressions control for child and household characteristics, sub-district fixed effects, lagged achievement score. Standard errors clustered at sub-district (mandal level). *** p<0.01, ** p<0.05, * p<0.1

SIZE AND SOURCES OF THE PRIVATE SCHOOL PREMIUM IN TEST SCORES IN INDIA
26
Table 6. Robustness to selection on parental assessments and aspirations (Rural areas)
(1) (2) (3) (4) (5) (6) (7) (8)
8-year old (2009-10) 9-year old (2011) 15-year old (2009-10)
VARIABLES Math PPVT Math Telugu English Math PPVT Cloze
Private 0.076 0.15** 0.074 -0.26** 0.61*** 0.22*** 0.22*** 0.14**
(0.072) (0.064) (0.077) (0.12) (0.15) (0.055) (0.065) (0.053)
Performance: Good -0.14 0.12 -0.079 -0.32 0.016 -0.15 -0.12 -0.079
(0.11) (0.12) (0.13) (0.27) (0.16) (0.099) (0.082) (0.063)
Performance: Reasonably Well -0.24* -0.0068 -0.27 -0.56* -0.26 -0.40*** -0.096 -0.20*
(0.12) (0.13) (0.15) (0.26) (0.17) (0.12) (0.093) (0.11)
Performance: Poorly -0.37** -0.23 -0.41** -0.97*** -0.51** -0.66*** -0.18 -0.70***
(0.13) (0.16) (0.16) (0.32) (0.22) (0.19) (0.12) (0.18)
Performance: Very Bad -0.87*** -0.67** 0.16 -0.45 0.061 -1.32 -0.45** -2.05***
(0.18) (0.30) (0.18) (0.26) (0.19) (0.88) (0.19) (0.19)
Parent Aspiration: Child will go to university
0.086 0.031 -0.037 -0.0030 0.0017 0.017 0.079 0.063**
(0.053) (0.042) (0.091) (0.076) (0.058) (0.054) (0.064) (0.028)
Observations 1,208 1,071 718 665 627 620 607 603
R-squared 0.354 0.325 0.510 0.387 0.437 0.416 0.591 0.441
Standard errors clustered at sub-district (mandal) level. *** p<0.01, ** p<0.05, * p<0.1 Regressions control for child and household characteristics, sub-district FE, lagged achievement score. Performance: ’Excellent’ is the omitted category.

SIZE AND SOURCES OF THE PRIVATE SCHOOL PREMIUM IN TEST SCORES IN INDIA
27
Table 7. Differences between government and private schools
Rural areas Urban areas
Government Private Difference Government Private Difference
School Characteristics
English medium 0.00 0.58 -0.58*** 0.06 0.72 -0.66***
Highest grade taught 5.49 8.49 -3.00*** 5.72 8.67 -2.94***
Number of students (I-V) 73.68 266.69 -193.01*** 122.89 331.89 -209.00***
Number of teachers (I-V) 3.34 9.45 -6.10*** 4.78 11.33 -6.56***
Proportion of teachers with permanent contracts
0.73 0.25 0.47*** 0.85 0.50 0.35***
Proportion of male teachers 0.62 0.43 0.19*** 0.34 0.18 0.15
Proportion of teachers with teaching qualification
0.83 0.65 0.18*** 0.95 0.62 0.34***
Student-Teacher ratio 20.70 28.54 -7.85*** 24.98 29.56 -4.58
One teacher teaches all subjects in Grade V 0.94 0.05 0.89*** 0.89 0.17 0.72***
Has a library 0.03 0.32 -0.29*** 0.11 0.42 -0.31**
Has a playground 0.75 0.80 -0.05 0.50 0.56 -0.06
Has an electricity connection 0.74 0.94 -0.20*** 0.94 0.97 -0.03
Has drinking water availability 0.71 0.95 -0.25*** 0.83 0.97 -0.14
Number of separate rooms 2.88 10.52 -7.64*** 4.56 12.43 -7.88***
Has toilets 0.63 0.83 -0.20** 0.83 0.99 -0.15
N 93 61 154 17 72 89
Class Characteristics
Proportion of boys in class 0.47 0.61 -0.14*** 0.49 0.53 -0.03
Class used textbook during maths observaton 0.58 0.72 -0.13* 0.55 0.80 -0.25
Class usually taught multigrade 0.58 0.05 0.53*** 0.30 0.08 0.22
Effective class size 22.91 30.67 -7.77*** 29.68 33.75 -4.07
N 222 117 339 19 115 134
Teacher characteristics
Teacher: Age 32.92 28.22 4.70*** 37.89 29.89 8.00**
Teacher: Experience 7.47 4.83 2.64*** 11.28 5.27 6.01*
Teacher: Salary 12111.79 3463.54 8648.25*** 16295.39 3906.53 12388.86***
Teacher: Male 0.67 0.44 0.23*** 0.42 0.17 0.25
Teacher education: Upto Senior Secondary 0.29 0.20 0.09 0.05 0.11 -0.06
Teacher Education: Bachelor’s Degree 0.53 0.48 0.04 0.63 0.71 -0.08
Teacher Education: Postgraduate 0.17 0.23 -0.06 0.26 0.15 0.11
Teacher: Has teaching qualification 0.81 0.62 0.19** 0.95 0.52 0.43***
Teacher: Permanent Contract 0.68 0.18 0.50*** 0.78 0.27 0.51***
N 183 83 266 18 98 116
Student level variables
Has homework book 0.84 0.97 -0.12*** 0.96 0.97 -0.01
All/most of work in notebook is marked 0.38 0.79 -0.41*** 0.68 0.83 -0.15
My teacher is frequently absent from school 0.40 0.27 0.13*** 0.26 0.36 -0.09
I attend extra classes with my teacher after school
0.53 0.61 -0.08* 0.43 0.50 -0.07
N 549 194 743 22 147 169
*** p<0.01, ** p<0.05, * p<0.1

SIZE AND SOURCES OF THE PRIVATE SCHOOL PREMIUM IN TEST SCORES IN INDIA
28
Table 8. Rural areas: Sources of learning
(1) (2) (3) (4) (5) (6)
VARIABLES Maths Telugu English Maths Telugu English
School characteristics
Private School 0.10 0.095 0.76*** 0.090 0.11 0.80***
(0.10) (0.14) (0.18) (0.15) (0.13) (0.18)
Infrastructure index 0.23 0.020 0.055 0.040 -0.074 0.085
(0.21) (0.25) (0.30) (0.29) (0.21) (0.27)
Student Teacher Ratio -0.0014 -0.00023 0.0069 0.000051 -0.0035 0.0044
(0.0050) (0.0041) (0.0045) (0.0065) (0.0040) (0.0042)
Class characteristics
Did class use textbooks? 0.066 0.22** 0.085 0.26*** 0.27*** 0.14*
(0.091) (0.078) (0.089) (0.083) (0.074) (0.075)
Proportion of boys in class -0.41 -0.093 -0.18 -0.23 -0.18 -0.22
(0.30) (0.17) (0.30) (0.37) (0.21) (0.32)
Multigrade Classroom 0.17 0.31** 0.20* 0.28** 0.27** 0.16
(0.11) (0.12) (0.11) (0.12) (0.12) (0.10)
Effective class size -0.00033 -0.0074** -0.0053 -0.0099** - 0.0100*** -0.0071
(0.0020) (0.0032) (0.0054) (0.0045) (0.0033) (0.0049)
Teacher characteristics
Bachelor’s Degree 0.15* -0.034 0.11 0.11 -0.057 0.073
(0.073) (0.10) (0.13) (0.10) (0.083) (0.13)
Post-graduate Degree 0.17* -0.0077 -0.017 0.18 0.0033 0.0037
(0.085) (0.12) (0.12) (0.15) (0.096) (0.13)
Diploma or qualification in teaching 0.060 0.24** 0.14 0.031 0.30*** 0.16
(0.12) (0.088) (0.13) (0.16) (0.093) (0.15)
Permanent contract 0.038 0.092 -0.040 0.12 0.12 -0.00035
(0.11) (0.11) (0.12) (0.14) (0.11) (0.14)
Experience (in years) 0.012 0.00091 -0.00021 0.0074 -0.0015 -0.0037
(0.0071) (0.0059) (0.0069) (0.0080) (0.0065) (0.0059)
Teacher often does not come to school -0.16* -0.10 -0.029 -0.27*** -0.083 -0.017
(0.076) (0.059) (0.097) (0.089) (0.053) (0.096)
Extra classes with teacher after school 0.025 -0.020 -0.030 0.036 -0.025 -0.017
(0.10) (0.097) (0.090) (0.13) (0.10) (0.089)
Notebook with all/most work marked 0.20* 0.091 0.14* 0.29** 0.14* 0.14*
(0.099) (0.080) (0.074) (0.12) (0.065) (0.077)
Teacher score on pedagogy test -0.0094 0.065
(0.032) (0.052)
Lagged achievement scores From 2009-10 From 2007
Observations 721 665 632 721 709 676
R-squared 0.542 0.407 0.443 0.353 0.347 0.444
Robust standard errors in parentheses *** p<0.01, ** p<0.05, * p<0.1 Regressions also control for child and household characteristics and a constant term not reported in the table. Standard errors clustered at sub-district (mandal) level; subdistrict fixed effects included in all regressions.

SIZE AND SOURCES OF THE PRIVATE SCHOOL PREMIUM IN TEST SCORES IN INDIA
29
Table 10. Effect of subjective experience of schooling and psychosocial variables on test scores
VARIABLES (1) (2) (3) (4) (5) (6) (7) (8) (9)
Math Telugu English
Peer support index -0.0026 -0.036 -0.042 0.093** 0.033 0.014 0.036 -0.0061 -0.026
(0.036) (0.036) (0.037) (0.040) (0.035) (0.035) (0.036) (0.035) (0.034)
Teacher support index 0.15*** 0.12*** 0.11*** 0.11*** 0.040 0.022 0.053 0.0094 -0.011
(0.038) (0.038) (0.038) (0.038) (0.038) (0.037) (0.037) (0.040) (0.040)
Agency index - normalized 0.071* 0.065* 0.096** 0.074* 0.084** 0.057
(0.038) (0.039) (0.038) (0.040) (0.037) (0.039)
Efficacy index - normalized 0.11*** 0.11*** 0.23*** 0.20*** 0.13*** 0.10**
(0.035) (0.036) (0.038) (0.037) (0.044) (0.045)
School experience index 0.042 0.14*** 0.15***
(0.039) (0.041) (0.044)
Observations 721 721 721 665 665 665 632 632 632
R-squared 0.555 0.563 0.564 0.425 0.470 0.479 0.447 0.464 0.475
Robust standard errors in parentheses *** p<0.01, ** p<0.05, * p<0.1 Regressions include Private school dummy and the full set of controls at home, school, class, teacher and individual level including lagged achievement.
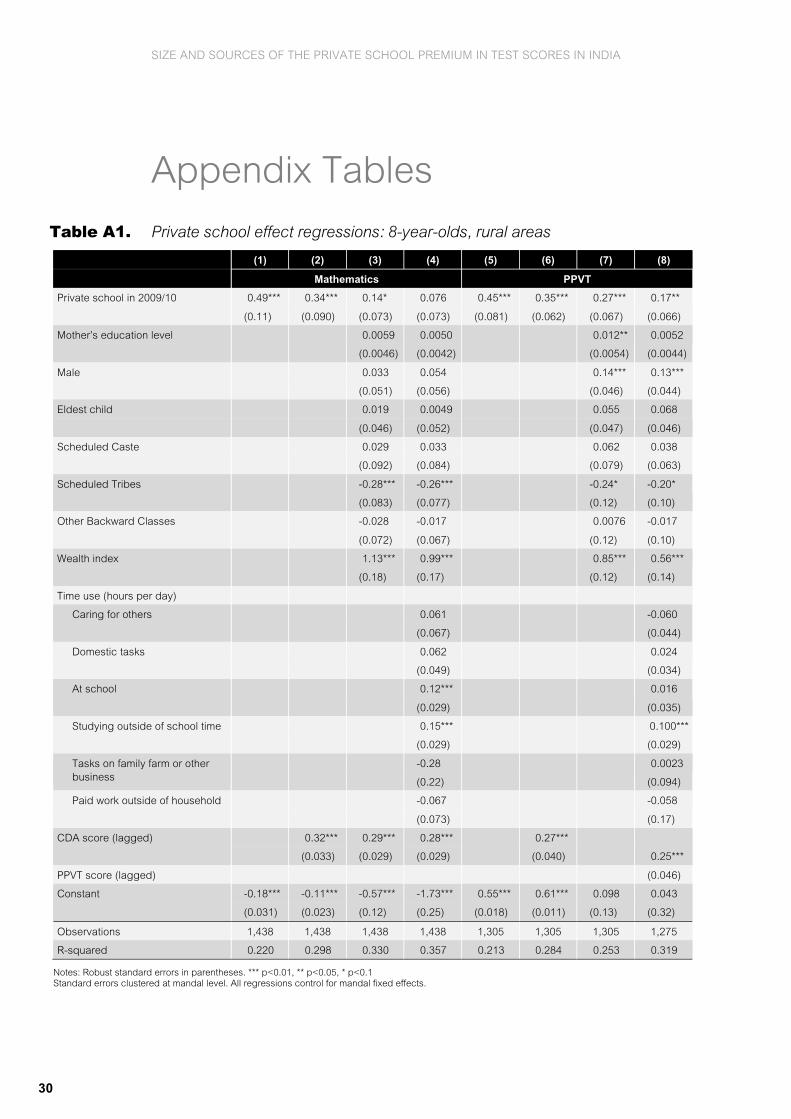
SIZE AND SOURCES OF THE PRIVATE SCHOOL PREMIUM IN TEST SCORES IN INDIA
30
Appendix Tables
Table A1. Private school effect regressions: 8-year-olds, rural areas
(1) (2) (3) (4) (5) (6) (7) (8)
Mathematics PPVT
Private school in 2009/10 0.49*** 0.34*** 0.14* 0.076 0.45*** 0.35*** 0.27*** 0.17**
(0.11) (0.090) (0.073) (0.073) (0.081) (0.062) (0.067) (0.066)
Mother’s education level 0.0059 0.0050 0.012** 0.0052
(0.0046) (0.0042) (0.0054) (0.0044)
Male 0.033 0.054 0.14*** 0.13***
(0.051) (0.056) (0.046) (0.044)
Eldest child 0.019 0.0049 0.055 0.068
(0.046) (0.052) (0.047) (0.046)
Scheduled Caste 0.029 0.033 0.062 0.038
(0.092) (0.084) (0.079) (0.063)
Scheduled Tribes -0.28*** -0.26*** -0.24* -0.20*
(0.083) (0.077) (0.12) (0.10)
Other Backward Classes -0.028 -0.017 0.0076 -0.017
(0.072) (0.067) (0.12) (0.10)
Wealth index 1.13*** 0.99*** 0.85*** 0.56***
(0.18) (0.17) (0.12) (0.14)
Time use (hours per day)
Caring for others 0.061 -0.060
(0.067) (0.044)
Domestic tasks 0.062 0.024
(0.049) (0.034)
At school 0.12*** 0.016
(0.029) (0.035)
Studying outside of school time 0.15*** 0.100***
(0.029) (0.029)
Tasks on family farm or other business
-0.28 0.0023
(0.22) (0.094)
Paid work outside of household -0.067 -0.058
(0.073) (0.17)
CDA score (lagged) 0.32*** 0.29*** 0.28*** 0.27***
(0.033) (0.029) (0.029) (0.040) 0.25***
PPVT score (lagged) (0.046)
Constant -0.18*** -0.11*** -0.57*** -1.73*** 0.55*** 0.61*** 0.098 0.043
(0.031) (0.023) (0.12) (0.25) (0.018) (0.011) (0.13) (0.32)
Observations 1,438 1,438 1,438 1,438 1,305 1,305 1,305 1,275
R-squared 0.220 0.298 0.330 0.357 0.213 0.284 0.253 0.319
Notes: Robust standard errors in parentheses. *** p<0.01, ** p<0.05, * p<0.1 Standard errors clustered at mandal level. All regressions control for mandal fixed effects.

SIZE AND SOURCES OF THE PRIVATE SCHOOL PREMIUM IN TEST SCORES IN INDIA
31
Table A2. Private school effect regressions: 9-year-olds, rural areas
(1) (2) (3) (4) (5) (6) (7) (8) (9) (10) (11) (12) (13)
Mathematics Telagu English (IRT) English
Raw
Private school 0.49*** 0.20** 0.077 0.031 0.12 -0.089 -0.20* -0.25** 1.02*** 0.83*** 0.71*** 0.67*** 0.46***
(0.13) (0.084) (0.056) (0.061) (0.10) (0.092) (0.10) (0.11) (0.13) (0.12) (0.15) (0.14) (0.090)
Male 0.051 0.052 -0.099 -0.11 -0.095 -0.092 0.091
(0.070) (0.082) (0.085) (0.081) (0.075) (0.067) (0.078)
Eldest child 0.081 0.12 0.15* 0.18** 0.067 0.081 -0.053
(0.066) (0.070) (0.072) (0.079) (0.087) (0.094) (0.084)
Scheduled Castes -0.21 -0.21 -0.12 -0.12 -0.12 -0.12 -0.10
(0.14) (0.14) (0.15) (0.15) (0.10) (0.099) (0.10)
Scheduled Tribes -0.18 -0.15 -0.14 -0.11 -0.35* -0.34* -0.44***
(0.25) (0.26) (0.16) (0.16) (0.18) (0.17) (0.12)
Other Backward Classes -0.29* -0.28* -0.26** -0.25** -0.16** -0.15*** 0.037
(0.15) (0.15) (0.11) (0.11) (0.055) (0.048) (0.077)
Mother’s education level -0.0012 -0.0010 0.0039 0.0041 0.0017 0.0022 0.0029
(0.0048) (0.0051) (0.0052) (0.0055) (0.0044) (0.0045) (0.0062)
Father’s education level 0.0076 0.0072 0.0044 0.0048 0.0021 0.0026 0.0026
(0.0051) (0.0049) (0.0047) (0.0044) (0.0057) (0.0054) (0.0081)
Home support index –
normalised
0.045 0.039 0.12*** 0.11*** 0.064 0.062 -0.045
(0.029) (0.030) (0.037) (0.035) (0.037) (0.037) (0.053)
Wealth index 0.44* 0.41* 0.43 0.39 0.62 0.58 0.32
(0.22) (0.21) (0.27) (0.27) (0.44) (0.46) (0.32)
Time use (hours per day)
Caring for others -0.17*** -0.031 0.030 -0.019
(0.056) (0.064) (0.057) (0.11)
Domestic tasks 0.0074 -0.044 -0.025 0.064
(0.058) (0.033) (0.052) (0.070)
Studying outside of
school time
0.067* 0.10*** 0.12*** 0.011
(0.033) (0.032) (0.020) (0.044)
Tasks on family farm
or other business
-0.22 0.16 -0.045 -0.055
(0.29) (0.17) (0.26) (0.31)
Paid work outside of
household
0.10 0.56** 0.32 0.26**
(0.14) (0.23) (0.25) (0.12)
Mathematics score
(lagged)
0.80*** 0.77*** 0.76***
(0.053) (0.053) (0.050) 0.52*** 0.48*** 0.47*** 0.37*** 0.33*** 0.31*** 0.24***
PPVT score (lagged) (0.079) (0.077) (0.075) (0.067) (0.066) (0.062) (0.063)
Constant 0.46*** 0.56*** 0.53*** 0.44* -0.016 -0.30*** -0.28 -0.42** -0.43*** -0.65*** -0.72*** -0.91*** -0.50**
(0.035) (0.043) (0.17) (0.21) (0.027) (0.053) (0.17) (0.18) (0.036) (0.051) (0.19) (0.22) (0.19)
Observations 769 769 769 769 768 711 711 711 729 672 672 672 712
R-squared 0.179 0.492 0.505 0.512 0.146 0.310 0.344 0.354 0.323 0.377 0.400 0.412 0.256
Robust standard errors in parentheses. All regressions include mandal fixed effects.
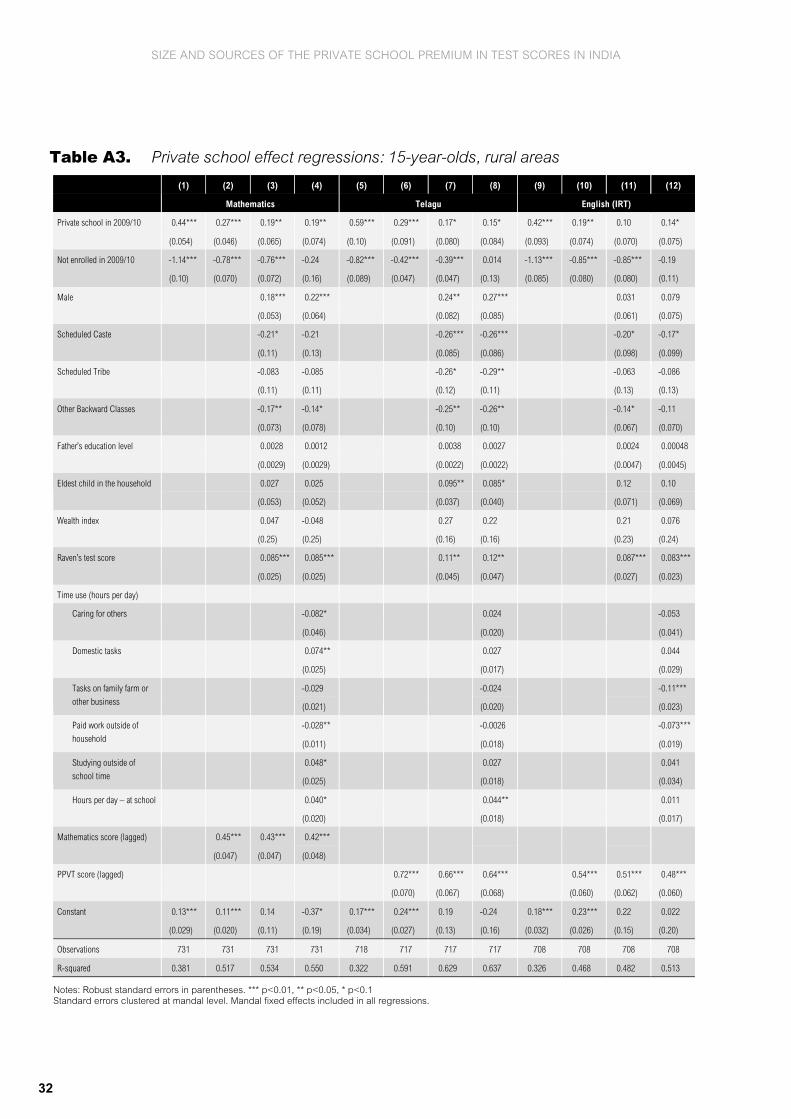
SIZE AND SOURCES OF THE PRIVATE SCHOOL PREMIUM IN TEST SCORES IN INDIA
32
Table A3. Private school effect regressions: 15-year-olds, rural areas
(1) (2) (3) (4) (5) (6) (7) (8) (9) (10) (11) (12)
Mathematics Telagu English (IRT)
Private school in 2009/10 0.44*** 0.27*** 0.19** 0.19** 0.59*** 0.29*** 0.17* 0.15* 0.42*** 0.19** 0.10 0.14*
(0.054) (0.046) (0.065) (0.074) (0.10) (0.091) (0.080) (0.084) (0.093) (0.074) (0.070) (0.075)
Not enrolled in 2009/10 -1.14*** -0.78*** -0.76*** -0.24 -0.82*** -0.42*** -0.39*** 0.014 -1.13*** -0.85*** -0.85*** -0.19
(0.10) (0.070) (0.072) (0.16) (0.089) (0.047) (0.047) (0.13) (0.085) (0.080) (0.080) (0.11)
Male 0.18*** 0.22*** 0.24** 0.27*** 0.031 0.079
(0.053) (0.064) (0.082) (0.085) (0.061) (0.075)
Scheduled Caste -0.21* -0.21 -0.26*** -0.26*** -0.20* -0.17*
(0.11) (0.13) (0.085) (0.086) (0.098) (0.099)
Scheduled Tribe -0.083 -0.085 -0.26* -0.29** -0.063 -0.086
(0.11) (0.11) (0.12) (0.11) (0.13) (0.13)
Other Backward Classes -0.17** -0.14* -0.25** -0.26** -0.14* -0.11
(0.073) (0.078) (0.10) (0.10) (0.067) (0.070)
Father’s education level 0.0028 0.0012 0.0038 0.0027 0.0024 0.00048
(0.0029) (0.0029) (0.0022) (0.0022) (0.0047) (0.0045)
Eldest child in the household 0.027 0.025 0.095** 0.085* 0.12 0.10
(0.053) (0.052) (0.037) (0.040) (0.071) (0.069)
Wealth index 0.047 -0.048 0.27 0.22 0.21 0.076
(0.25) (0.25) (0.16) (0.16) (0.23) (0.24)
Raven’s test score 0.085*** 0.085*** 0.11** 0.12** 0.087*** 0.083***
(0.025) (0.025) (0.045) (0.047) (0.027) (0.023)
Time use (hours per day)
Caring for others -0.082* 0.024 -0.053
(0.046) (0.020) (0.041)
Domestic tasks 0.074** 0.027 0.044
(0.025) (0.017) (0.029)
Tasks on family farm or
other business
-0.029 -0.024 -0.11***
(0.021) (0.020) (0.023)
Paid work outside of
household
-0.028** -0.0026 -0.073***
(0.011) (0.018) (0.019)
Studying outside of
school time
0.048* 0.027 0.041
(0.025) (0.018) (0.034)
Hours per day – at school 0.040* 0.044** 0.011
(0.020) (0.018) (0.017)
Mathematics score (lagged) 0.45*** 0.43*** 0.42***
(0.047) (0.047) (0.048)
PPVT score (lagged) 0.72*** 0.66*** 0.64*** 0.54*** 0.51*** 0.48***
(0.070) (0.067) (0.068) (0.060) (0.062) (0.060)
Constant 0.13*** 0.11*** 0.14 -0.37* 0.17*** 0.24*** 0.19 -0.24 0.18*** 0.23*** 0.22 0.022
(0.029) (0.020) (0.11) (0.19) (0.034) (0.027) (0.13) (0.16) (0.032) (0.026) (0.15) (0.20)
Observations 731 731 731 731 718 717 717 717 708 708 708 708
R-squared 0.381 0.517 0.534 0.550 0.322 0.591 0.629 0.637 0.326 0.468 0.482 0.513
Notes: Robust standard errors in parentheses. *** p<0.01, ** p<0.05, * p<0.1 Standard errors clustered at mandal level. Mandal fixed effects included in all regressions.

SIZE AND SOURCES OF THE PRIVATE SCHOOL PREMIUM IN TEST SCORES IN INDIA
33
Table A4. Subjective statements on learning experience
Government Private Difference
Home support
There is no one at home to help me with my school homework (-) 0.58 0.64 -0.06
If I need help with my school homework, I can ask someone at home 0.64 0.67 -0.04
At least one of my parents or household members knows my rank in class 0.81 0.88 -0.07*
My homework is regularly checked by my parents or other household members 0.75 0.77 -0.02
No one at home is able to help me with my studies (-) 0.61 0.64 -0.03
Agency/Locus of control
I can do well in school if I work hard 0.76 0.82 -0.06
I cannot do well in school, even if I try hard (-) 0.68 0.71 -0.04
Making an extra effort rarely leads to success (-) 0.75 0.71 0.04
Going to school is of no use to me (-) 0.71 0.74 -0.03
Self-efficacy
I am really good at learning English 0.71 0.80 -0.10**
Doing maths is very difficult for me (-) 0.52 0.70 -0.17***
I am proud of my achievements in school 0.66 0.67 -0.01
I can do my classwork at school without help 0.72 0.82 -0.11**
I am really good at learning Telugu 0.56 0.64 -0.08
I am really good at learning maths 0.79 0.85 -0.05
Peer support
I cannot ask other students to help me with my school work when I ’get stuck’ (-) 0.62 0.62 0.00
Most of the children in my school are unkind to me (-) 0.66 0.69 -0.03
Most of the students do not want to play with me during break times (-) 0.65 0.73 -0.08*
In my class everybody is my friend 0.77 0.82 -0.06
Children in my class tease me (-) 0.72 0.69 0.03
I can ask another student to help me if I ‘get stuck’ with my school work 0.74 0.83 -0.09**
School experience
I feel bored when I am listening lessons (-) 0.73 0.76 -0.04
I feel lonely when I am at school (-) 0.68 0.73 -0.05
I am not happy in this class (-) 0.76 0.78 -0.01
I feel proud that I go to this school 0.79 0.83 -0.05
I feel nervous (worried) about being at school (-) 0.68 0.71 -0.03
I feel happy going to school every day 0.83 0.92 -0.10***
I enjoy all my lessons at this school 0.79 0.88 -0.09**
This is the best school for me to attend 0.80 0.92 -0.12***
I’m afraid of going to the toilet at school (-) 0.62 0.71 -0.09*
I feel safe when I am at school 0.85 0.92 -0.07**
Teacher support
My teacher treats me fairly 0.75 0.86 -0.11***
My teacher treats me worse than other children (-) 0.71 0.72 -0.01
I never ask my teacher for help when I ’get stuck’ (-) 0.66 0.64 0.02
I am treated unfairly by my class teacher (-) 0.68 0.76 -0.07*
I can talk to my class teacher freely about anything that concerns me 0.58 0.58 -0.00
Girls are treated unfairly by my class teacher (-) 0.33 0.27 0.07
My class teacher notices if I do not come to school 0.77 0.79 -0.03
N 562 207 769
Negatively coded answers, indicated by (-) have been reversed in this table and in the generation of composite indexes. An affirmative response indicates a positive outcome for all statements as displayed in table above. *** p<0.01, ** p<0.05, * p<0.1

Size and Sources of the Private School Premium in Test Scores in India
This paper uses unique panel data to estimate value-added models of learning production in private and government schools in Andhra Pradesh (India), examine heterogeneity in the value-added of private schools, and identify the sources of learning in these schools. In rural areas there is a substantial positive effect of private schools on English, no effect on mathematics and heterogeneous effects on Telugu for 8–10 year old children; at 15 years, there are significant but modest effects on Telugu, mathematics and receptive vocabulary. In urban areas, there is no evidence of a positive private school effect. Teachers’ absence and effort, teaching practices and class size significantly affect learning but teachers’ education, tenure and experience do not. Children in private schools report more positive assessments of their school experience. Results correspond closely with comparable experimental estimates.
www.younglives.org.uk
About Young Lives
Young Lives is an international study of childhood poverty, involving 12,000 children in 4 countries over 15 years. It is led by a team in the Department of International Development at the University of Oxford in association with research and policy partners in the 4 study countries: Ethiopia, India, Peru and Vietnam.
Through researching different aspects of children’s lives, we seek to improve policies and programmes for children.
Young Lives Partners
Young Lives is coordinated by a small team based at the University of Oxford, led by Professor Jo Boyden.
• EthiopianDevelopmentResearchInstitute,Ethiopia
• PankhurstDevelopmentResearchandConsultingplc
• SavetheChildren(Ethiopiaprogramme)
• CentreforEconomicandSocialSciences,AndhraPradesh,India
• SavetheChildrenIndia
• SriPadmavathiMahilaVisvavidyalayam(Women’sUniversity),AndhraPradesh,India
• GrupodeAnálisisparaelDesarollo(GRADE),Peru
• InstitutodeInvestigaciónNutricional,Peru
• CentreforAnalysisandForecasting,VietnameseAcademyof SocialSciences,Vietnam
• GeneralStatisticsOffice,Vietnam
• Universityof Oxford,UK
Contact:Young LivesOxford Department of International Development,University of Oxford,3 Mansfield Road,Oxford OX1 3TB, UKTel: +44 (0)1865 281751Email: [email protected]: www.younglives.org.uk