size, age and productivity of scientific and...
TRANSCRIPT

Scientometrics, Vol. 20. No.3 (1991) 395-416
REVIEW
SIZE, AGE AND PRODUCTIVITY OF SCIENTIFIC AND TECHNICAL RESEARCH GROUPS*
J.E.COHEN
The Rockefeller University, 1230 York Avenue, New York, NY 10021-6399 (USA)
(Received January 26, 1990)
Varied empirical studies show that the average output (measured in various ways) of a scientific or technical research group is directly proportional to its size (also measured in various ways), when the size and output an: measured independently. Hence groups of different sizes have the same average output per unit of size. Then: is no reliable evidence for the existence of a size or a range of sizes for a research group that maximizes output per unit of size. Present theoretical explanations for the proportionality between size and output an: largely inadequate or untested. Similarly, among reported results on group age and output, the only consistency so far is that age, measured as years since the founding or first functioning of the group, is uncorn:lated with output per capita. Again, then: is no evidence for the existence of an age or a range of ages for a research group that is optimal.
Introduction and summary
How does the size of a scientific or technical research group affect its productivity or output? Is there an optimal size or an optimal range of sizes for a research group? Evidently both size and output can be measured in many different ways. Is there a consistent relation between the size and the output of scientific or technical research
groups that is not sensitive to how size and output are measured? If so, how can the observed relation between the size and the output of research groups be described . and then explained? Similar questions may be asked regarding the relation between the age and the output of research groups. This paper reviews what is known empirically about the answers to these questions.
"This paper was prepared for the conference on "Generational Dynamics and Innovation in Basic Science," June 1-2, 1989, organized by Karl Urlich Mayer, and held at the Max-Planck-Gesellschaft zur Forderung der Wissenschaften, Schlo8 Ringberg, Tegernsee, B. R. D. (West Germany). A German translation of this article has been published in the Mitteilungen der Max-Pianck-Gese/lschaft, Heft 3/90.
·. Scientometrics 20 (1991) Elsevier, Amsterdmn-Oxford-New York- Tokyo
Akadlmiai J(jad6

J.E. COllEN: SIZE. AOE AND PRODUCllVITY
Si:l';e Siu
Size Siu
j
Size
Si:!';e Sia
396 Scientometrlcs 20 (1991)

J.E. COHEN: SIZE, AGE AND PRODUCTIVITY
The size and the output of a research group could, in principle, be related in many different ways,17,5 some of which are shown in Fig. 1. The various possible relationships between size and output have very different consequences for the organization of multiple research groups within an institution (or country). Suppose an institution's resources (such as personnel salaries, equipment, or space) can be allocated to a few large research groups, or to many small research groups, or to some combination of small and large groups. Suppose that the managers of the institution view the output of the whole institution as the sum of the output of the research groups in it. If the output of a single research group enjoys economies of scale, then the overall output of the institution is maximized by allocating the resources to a single large group (Fig. la). If the output of a single research group suffers from diseconomies of scale, then the overall output of an institution is maximized by supporting many small groups (Fig. lb). If the output of a single group is an S-shaped function of size, then the overall output of the institution is maximized by supporting groups in some intermediate range of sizes (Fig. lc). Fmally, if the output of a single group is proportional to its size, then the overall output of the institution is not affected by the sizes of the different groups (Fig. ld); resources may be allocated on some basis other than size, and the sizes of individual research groups may be determined on some basis other than maximal output.
In informal conversation, many a scientist appears to believe that the most productive size for a research group is the size that happens to be necessary or appropriate to carry out the kind of research she or he likes to do. Scientific questions that require large and complex instruments (such as high-energy particle accelerators) cannot be tackled productively by groups that contain small numbers of scientists, while certain kinds of theorizing and exploratory experimentation (e. g., in high-temperature superconductivity) may benefit from the attention of many small groups.
Fig. 1. Possible relations between the size and the output of a single research group. The figures on the left show different possible relations between the aggregate output (e. g., total number of scientific publications) and size (e. g., total number of working scientists) of an individual research group. The figures on the right show the corresponding output per unit of size (c. g., publications per capita) as a function of group size. The units of measurement on both axes an: arbitrary. (a) Incn:asing returns to scale. Output/size is maximized by large groups. (b) Dccn:asing returns to scale. Output/size is maximized by small groups. (c) Incn:asing then dccn:asing n:tums to scale. Output/size is maximized by intermediate groups. (d) Proportional returns. Output/size is independent of size
Scientometrics 20 (1991) 397
J.E. COHEN: SIZE, AGE AND PRODUCTIVITY
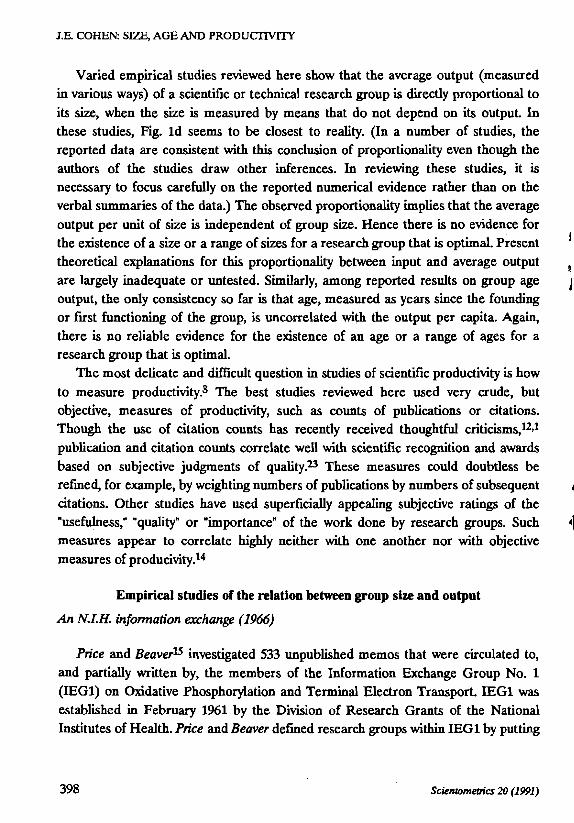
Varied empirical studies reviewed here show that the average output (measured in various ways) of a scientific or technical research group is directly proportional to its size, when the size is measured by means that do not depend on its output. In these studies, Fig. 1d seems to be closest to reality. (In a number of studies, the reported data are consistent with this conclusion of proportionality even though the authors of the studies draw other inferences. In reviewing these studies, it is necessary to focus carefully on the reported numerical evidence rather than on the verbal summaries of the data.) The observed proportionality implies that the average output per unit of size is independent of group size. Hence there is no evidence for the existence of a size or a range of sizes for a research group that is optimal. Present theoretical explanations for this proportionality between input and average output are largely inadequate or untested. Similarly, among reported results on group age output, the only consistency so far is that age, measured as years since the founding or first functioning of the group, is uncorrelated with the output per capita. Again, there is no reliable evidence for the existence of an age or a range of ages for a research group that is optimal.
The most delicate and difficult question in studies of scientific productivity is how to measure productivity.8 The best studies reviewed here used very crude, but objective, measures of productivity, such as counts of publications or citations. Though the use of citation counts has recently received thoughtful criticisms, 12,1
publication and citation counts correlate well with scientific recognition and awards based on subjective judgments of quality.23 These measures could doubtless be refmed, for example, by weighting numbers of publications by numbers of subsequent citations. Other studies have used superficially appealing subjective ratings of the "usefulness; "quality" or "importance" of the work done by research groups. Such measures appear to correlate highly neither with one another nor with objective measures of producivity.l4
Empirical studies of the relation between group size and output
An N.I.H. infonnation exchange (1966)
Price and Beaver15 investigated 533 unpublished memos that were circulated to, and partially written by, the members of the Information Exchange Group No. 1 (IEG1) on Oxidative Phosphorylation and Terminal Electron Transport. IEG1 was established in February 1961 by the Division of Research Grants of the National Institutes of Health. Price and Beaver defmed research groups within lEG 1 by putting
398 Scientometrics 20 (1991)
J.E. COHEN: SIZE, AGE AND PRODUCTIVITY
together authors who had jointly written a memo or who were linked by a chain of joint authorships. For example; if A wrote a memo with B, and B wrote a memo with C, and C wrote a memo with D, then Price and Beaver placed A, B, C, and D, and all their coauthors, together in one research group. Individuals who wrote no memos do not appear in any group. Price and Beaver measured output as the number of memos or papers produced by each group. The following figure and computations are based on the data of Price and Beaver (their Table 2) but were executed specifically for this review.
• Obser~d - Lin~r
o Quadrat
Nurnl:ler of aiAhors group
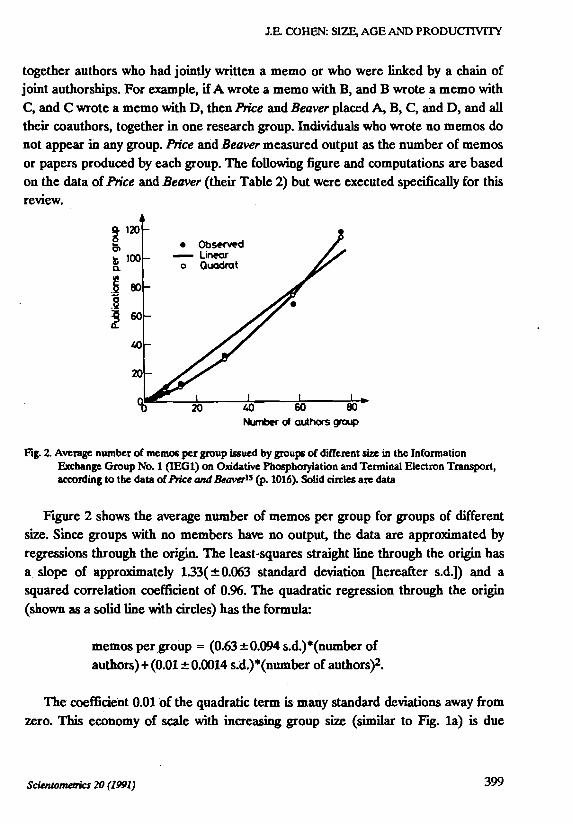
Fig. 2. Average number of memos per group issued by groups of different size in the Information Exchange Group No. 1 (IEG1) on Oxidative Phosphorylation and Terminal Electron Transport, according to the data of Price and Beaver15 (p. 1016). Solid cin:les are data
Figure 2 shows the average number of memos per group for groups of different size. Since groups with no members have no output, the data are approximated by
regressions through the origin. The least-squares straight line through the origin has a. slope of approximately 133( ±0.063 standard deviation [hereafter s.d.]) and a squared correlation coefficient of 0.96. The quadratic regression through the origin
(shown as a solid line with circles) has the formula:
memos per group = (0.63 ± 0.094 s.d.)*(number of
authors)+ (0.01 ± 0.0014 s.d.)*(number of authors)2.
The coefficient 0.01 of the quadratic term is many standard deviations away from zero. This eCOboJily. of scale with increasing group size (similar to Fig. 1a) is due
Sckntometrics 20 (1991) 399
J.E. COHEN: SIZE, AGE AND PRODUCilVITY
entirely to the largest group. When that group is omitted from the regression, the linear regression through the origin has a slope of 0.85 and a squared correlation coefficient· of 0.997; little improvement in fit is obtained by adding a quadratic term to the regression. Except for the largest group, the data are closest to the model of Fig. 1d among the models in Fig. 1.
Others2 have shown that "co~authored research tends to be associated with scientists of superior productivity." The method of defending groups adopted by Price and Beaver makes the size of each group dependent on the "collaborativeness" and, by correlation, on the output of its members. More productive individuals, who tend to collaborate widely, tend to end up in larger groups. This method of defining groups may create an apparent economy of scale in output.
The conclusion I draw from the data of Price and BeaverlS is that, in this study, an exceptionally large "group" of scientists, i. e., a group linked by coauthorship, contains unusually productive individuals; the output of smaller research "groups", with 60 or
fewer members, is very nearly proportional to their size.
Pakistan scientific and industrial research laboratories (1972)
Qurashil6 tabulated the numbers of published papers or reports, the numbers of patents or industrial processes, the numbers of Class I scientific officers, and the
numbers of other persons with an M. Sc. degree or equivalent engaged in research projects in the laboratories of the Pakistan Council of Scientific and Industrial Research (PCSIR). He reported aggregated numbers for all laboratories combined, for a sequence of biennial time intervals from 1953~54 to 1961~62, and annually from 1963 to 1967. The following figure and computations are based on Qurashi's data (his Table 1) but were executed specifically for this review.
Since the reported numbers of other persons with an M. Sc. degree or equivalent were all divisible by 10 from 1963 to 1967, I infer that these numbers represent estimates rather than exact counts. For comparability with later studies, in which only
professional scientists were enumerated, I measured the aggregate size of the laboratories by the number of Class I scientific officers. To put the numbers of published papers or reports on an annual basis, I divided the tabulated numbers of published papers or reports by two for the biennial intervals from 1953~54 to 1961~62
but did not correct the annual figures from 1963 to 1967. I made no adjustment to the numbers of Class I scientific officers, on the assumption that the numbers shown from the biennial intervals were present for both years.
400 Scientometrics 20 (1991)

• Observ~ -Linear
J.E. COHEN: SIZE, AGE AND PRODUCfiVITY
llaJmbeor of class I scie-ntific office-rs
Fig. 3. Number of published papers or reports per year of the laboratories of the Pakistan Council of Scientific and Industrial Research as a function of numbers of aass I scientific officers, according to the data of QurashJ16 (p. 114), as adjusted here. Solid circles are data
Figure 3 plots the annualized numbers of published papers or reports as a function of the number of Class I scientific officers. The data are drawn from a period of steady growth in PCSIR scientific personnel. Hence the larger the number of scientists, the later the biennial or annual interval it refers to. The least-squares straight line through the origin with slope approximately 1.26( ± 0.073 standard deviation) gives a squared correlation coefficient of 0.89. The quadratic regression through t4e origin results in little improvement of fit and therefore is not plotted. Thus the proportionality between the number of Class I scientific officers ~d annual publications is maintained through the time-series of data.
Qurashi (his Table 2} also gave parallel data for the Karachi laboratories of PCSIR. I carried out a parallel analysis of these data and obtained parallel results. I did not carry out such an analysis for the Peshawar laboratories (Ourashi's Table 3} because it was not possible to disaggregate the reported numbers of scientists into Class I scientific officers and others.
The conclusion I draw from Qurashi's data is that the average output of the PCSIR laboratories is directly proportional to their size.
This conclusion contrasts with Qurashi's firm conclusion that "the above analysis certainly underlines the desirability of keeping most applied research laboratories or
functional divisions within a strength of 100 scientists, and the individual sections of
Scientometrics 20 (1991) 401

J.E. COHEN: SIZE,AGEAND PRODUCI1VITY
these to within 30. • Apparently Qurashi did not convert his data on numbers of publications to an annual basis. Since there were fewer scientists in earlier years
when he reported publications for two years at a time, those scientists appeared
highly productive; in the later years, when there were more scientists, he reported each year's publications separately and larger number of scientists appeared to be
relatively less productive. This possible oversight may explain why he found a higher output in the earlier years than in the later years.
Research teams studying the Gunn effect (1973)
Wallmark et al.20 collected the references (not the citations) of articles that dealt with the Gunn effect from seven journals over a five-year period. They defined a
team as an institution where an author of the references worked, e. g., Cornell
University or International Business Machines (ffiM) Corporation. Wallmark et al. did not discuss how valid it is to consider all 125 authors at mM, or all162 authors at
Bell Telephone Laboratories, as a single team, nor whether there were collaborative
publications by authors from different institutions. They defmed the size of a team as the number of different individuals from an institution who appeared as authors of
one or more references. As in the study of Price and Beaver, IS but not the study of Qurashi, 16 this defmition of group size depends on the output of individuals; members of a research team who were not recognized by authorship of a paper are
not counted. The measure of output was the number of net references, defined as the number
of references to papers written by members of a team after deleting references by a
team to its own work. Wallmark et al. defined research efficiency as the ratio of the number of net references to the team size. Research efficiency measures output per unit of size, and corresponds to the ordinate of the figures on the right side of Fig. 1.
Wallmark et al. concluded that their data "show that research efficiency, as
defined, increases exponentially with size of the research team." Wallmark et al. did not describe the statistical procedure they used to conclude that research efficiency
increased with team size.
Using the reported counts of net references and team size, JS recomputed research efficiency (because some of the values Wallmark et al. give in their Table 1
are not correct to the number of decimal places they show). Then I performed a linear regression of research efficiency on team size and a linear regression of the natural logarithm of research efficiency on team size, using the method of ordinary
402 Scientometrics 10 (1991)

J.E. COHEN: SIZE, AGE AND PRODUCI1VITY
least squares (i. e., assuming that the variance of the ordinate is independent of the value of the abscissa). The linear correlation coefficients (0.1581 and 0.1233), based on 18 data points or 16 degrees of freedom, are not close to being significantly different from 0. These data thus do not provide statistically significant evidence that research efficiency increases linearly or exponentially with the size of a research group.
• Observed -Linear
•
•
Number of authors
Fig. 4. Numbers of net references and numbers of authors in institutional teams publishing on the Gunn effect, according to data of WaJJmark et al.20 (p. 81). Solid circles are data
The following figure and computations are based on the data of Wallmark et al. (their Table 1) but were executed specifically for this review. Figure 4 plots the numbers of net references as a function of the numbers of authors of each team. The !inear regression through the origin has a slope of 3.13 ± 0.59 s.d. and a squared correlation coefficient of 0.48. The quadratic regression results in no significant improvement of fit.
Wallmark et al. also analyzed a larger sample of references by methods that were not fully explicit. Since they did not publish this larger set of data, I cannot confirm the analysis.
The conclusion I draw from the data of Wallmark et. al. is that the number of net references garnered by an institution is loosely but roughly linearly related to the number of authors in the institution.
Scientomelrics 20 (1991) 403
J.E. COHEN: SIZE, AGE AND PRODUCI1VITY
American space exploration groups (1978)
Dailey? used voluntary questionnaires to study the size, the productivity and four other socio-psychological variables of 45 space research "project groups" in the
western United States. He did not describe how the boundaries of the groups were established. Nor did he define group size explicitly. It seems that he measured group size by the number of technical members of each group. He measured a team's
productivity by summing two subjective ratings, each on a scale from 0 to 100, made by a superviser of the team. One rating measured "the team's contributions to knowledge in its field along established lines of research and development" while the
other measured "contributions to knowledge in their fields that were useful and new."
Dailey reported a correlation between team size and team productivity of 0.055, not significantly different from 0 at 0.10 leve~ the highest level of significance Dailey used. While Dailey's measure of productivity makes the interpretation of this result unclear, it offers no suggestion of an association between group size and productivity.
Swedish academic groups from natural science and technology (1979)
Stankiewicz11 measured the size, the age and the output of 172 randomly selected Swedish academic research groups from the fields of natural science and technology.
He defmed size as the average number of academic scientists in a group during the
three years prior to his survey, including doctoral students but excluding technical personnel. He defmed a group's age as the number of years since it was formed. He
measured productivity by the "total output of published papers" (as well as by an index of scientific recognition, which I do not consider further because of its subjectivity). He defmed output per scientist as the ratio of total output of published
papers to size. He found that size and age, separately or in combination, bear little relation to
the output per scientist (Stankiewicz,l1 p. 203, his paragraph 6). If the average output
per scientist is constant for groups with different numbers of scientists, then the total average output of published papers is directly proportional to the group size. Unfortunately, I am unable to estimate the constant of proportionality (i. e., the
number of publications per scientist) from the reported summary statistics.
The research groups belonged to a large number of different institutions. The diversity of the groups' institutions raises the question whether the absence of a
relation between group size and output per scientist may be an artifact of pooling
404 Scientometrics 20 (1991)
J.E. COHEN: SIZE,AGEAND PRODUCITVITY
groups from different institutions. Does group size vary independently of average output per scientist within a single institution?
Laboratories in three biomedical research institutions (1980, 1981)
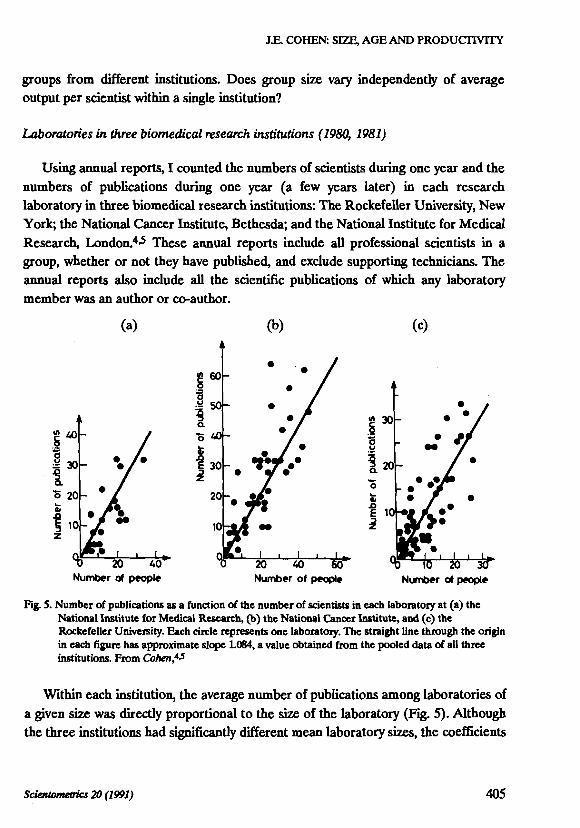
Using annual reports, I counted the numbers of scientists during one year and the numbers of publications during one year (a few years later) in each research laboratory in three biomedical research institutions: The Rockefeller University, New York; the National Cancer Institute, Bethesda; and the National Institute for Medical
Research, London.4.S These annual reports include all professional scientists in a group, whether or not they have published, and exclude supporting technicians. The annual reports also include all the scientific publications of which any laboratory member was an author or co-author.
(a) (b) (c)
N~r of people
Fig. S. Number of publications as a function of the number of scientists in eacb laboratoey at (a) the National Institute for Medical Research, (b) the National Cancer Institute, and (c) the Rockefeller University. Each circle represents one laboratoey. The straight line through the origin in each figure has approximate slope 1.084, a value obtained from the pooled data of all three institutions. From Co1Jen,4~
Within each institution, the average number of publications among laboratories of
a given size was directly proportional to the size of the laboratory (Fig. 5). Although the three institutions had significantly different mean laboratory sizes, the coefficients
Scienlometrics 20 (1991) 405
J.E. COHEN: SIZE, AGE AND PRODUCilVITY
of proportionality between laboratory size and number of publications were not significantly different between institutions. In these 127 laboratories, ranging in size from one to 46 scientists, with each additional scientist, the expected annual number of publications of a laboratory increased by approximately 1.1 (more precisely, 1.084±0.048 s.d.), regardless of the size of the laboratory. The variance in output among laboratories of given size clearly increased with increasing laboratory size, and this heteroscedasticity was taken into account in performing the linear regression through the origin. Quadratic regressions revealed little evidence for a curvilinear relation between the numbers of publications and numbers of scientists, either within any single institution or altogether.
These findings for individual institutions show that the homogeneity of output per scientist in Stankiewicz's study17 may reflect the homogeneity of output per scientist within institutions, rather than being an artefact of pooling across institutions.
At Rockefeller University, I also counted each laboratory's number of primary publications, defmed as a· publication with journal title, volume, and page numbers; or sole or joint authorship of a book; or a doctoral thesis. I excluded from primary publications any chapters contributed to edited books or other collective works; book reviews; editorials in scientific or medical journals; and the editorship of collective works. A scatter diagram of the number of primary publications as a function of laboratory size for 60 laboratories offered no suggestion of a nonlinear relationship. According to the fitted ordinary least squares line, for every additional ten people, there were seven additional primary publications per year per laboratory. Each laboratory's fraction of publications which were primary publications (i. e., the ratio of the number of primary publications to the number of all publications), plotted as a function of laboratory size, revealed no increasing or decreasing trend. The results applied to each field of science within Rockefeller University (the behavioral sciences; biochemistry and cell biology; medicine and physiology; and chemistry), although the numbers of laboratories in some of these categories were small.
Corporate research in large American companies (1987)
Halperin and Chakrabam"10 selected 225 publicly-held American companies that spent, presumably annually (though they do not say so), either a minimum of one million dollars on research and development (R & D) between 1975 and 1983 or at least one percent of sales on R & D between 1975 and 1983. They measured output by the number of published papers included in the SCISFARCH data base and by the
406 Scil .• tometrics 20 (1991)

J.E. COHEN: SIZE, AGE AND PRODUC11VlTY
number of awarded patents according to the BRS/PATSEARCH data base. They measured the size of the research effort by several variables: the number of elite scientists employed by each company (presumably at any time from 1975 to 1983, though they do not say so), R & D expenditures, profits, and sales.
For comparability with the other studies reviewed here, only the results relating to published papers will be described. The number of published papers is most highly correlated with the number of elite scientists (the correlation coefficient is 0.74; the slope of the regression is unfortunately not given), slightly less correlated with R & D expenditures and profit, and weakly correlated with sales (correlation coefficient 0.48).
Publication intensity was defined as the ratio of the number of papers to the volume of sales (in millions of dollars). Publication intensity was found to be well correlated with the ratio of the number of elite scientists to sales (0.67) but not well correlated with the other input variables divided by sales.
~ 0.6 a: Ill 0 0.5 15 "Q ::::: 04 ·e 8.03
iQ2 0
r~.__----=~---=±=---±:---=---;;;-;~ Curnulativt' n.Jmber of firms, by salt'S
Fig. 6. The average number of published papers per million dollars spent on R & D in 225 American fmns, cumulated in order from largest to smallest sales, according to data of Halperin and ChaJaabartJlO (p.172). The abscissa (horizontal coordinate) represents then largest firms ranked by sales, and the corresponding ordinate (vertical coordinate) represents the total number of papers in those n biggest firms divided by the total dollars (in millions) spent on R & D in those firms. Solid circles an: data
When Halperin and ChakrabflltilO (p. 171, their Table 8) ranked the 225 firms by
sales from biggest to smallest, and calculated the number of papers per million dollars spent on R & D in the first four firms, in the first eight firms, in the first twelve firms, and so on, they found a rising trend in the number of papers per million
Scientometrics 20 (1991) 407

J.E. COHEN: SIZE, AGE AND PRODUCI1VITY
dollars spent on R & D, up to roughly the frrst thirty firms. The further to the right one moves in Fig. 6, which I plotted from their data, the more small firms are
included Halperin and ChakrabaTti concluded that "R & D productivity in terms of both paper publication and patents increases as frrms decrease in size" as measured by sales. GarfieltP repeated this conclusion and reprinted their article, along with a
useful bibliography on the scientific productivity of organizations.
The interpretation of this fmding is ambiguous. As Joshua Lederberg observed succinctly (personal communication, June 6, 1988), it may suggest that "small is
beautiful (or is it that large firms are the ones who know better how to get a higher multiple of R & D as sales?)."
The data plotted in Fig. 6 say nothing about the effect on scientific or technical
output (measured by papers or patents) of an increasing number of scientists within a firm or of increasing expenditures on research. Sales are weakly correlated with dollars spent on R & D, numbers of elite scientists, papers published, or patents awarded. (Unfortunately Halperin and ChakrabaftilO do not report the actual
correlations.) Hence a ranking of frrms by sales, as in Fig. 6, is not equivalent to a
ranking of frrms by any of these other measures. Therefore the data plotted in Fig. 6
cannot be used to infer whether the number of papers published per million dollars spent on R & D is higher, lower or constant in frrms that spend more on R & D or have more scientists.
According to Fig. 6, on the average, these large corporations produce roughly half
a published paper (per year, I assume) per million dollars of R & D money (again, per year, I assume). Thus the average R & D expenditure per paper is roughly two million dollars. Of course, the purpose of industrial research is to produce not published papers but profitable knowledge and patents. For comparison, in three biomedical research institutions, the average cost per paper ranged from forty to
eighty thousand dollars per year (Cohen,s p. 473).
Empirical studies of the relation between group age and output
American psychology departments ( 1969)
Wisplll studied 9n psychologists who, between 1926 and 1963, were members of
28 American psychology departments that granted at least one doctorate in
psychology between 1895 and 1948 . To measure their output, he devised a "weighted
408 Scitr1lometric.s 20 (1991)

J.E. COHEN: SIZE, AGE AND PRODUCTIVITY
productivity score" based on singly or jointly written articles, book chapters and books. Unfortunately, Wupe did not present raw counts of publications.
Measuring a department's age by the number of years since it first granted a doctorate, he found (p.1 665) that in the 1950s, older departments were more
productive than younger departments. By the 1960s, the newer departments raised
their output to the level of the older departments.
Wispe also measured a department's age by its turnover, defmed as the number of
new psychologists joining a department plus the number of psychologists leaving the
department. The higher the turnover, the lower the average number of years psychologists were in the department. For the 1960 decade, he found (p. 667) that
"department productivity and turnover were unrelated."
American government and industry groups (1976)
Wells and Pelz (in Pelz and Andrews, 14 pp. 242-4) identified 49 industrial research
groups and 34 government research groups "by examining formal organization charts
to locate nonsupervisory scientists or engineers reporting to one administrative
chief." This defmition does not imply cooperation in a common task any more than does membership in the same psychology department21 or university.20 "'Group age'
was defined simply as the average number of years that each member had belonged." Presumably "belonged" means "belonged to the member's present supervisor or
group," and not to the larger organization, but the defmition is not explicit. The productivity of a group was evaluated by obtaining, for each member of a
group, two subjective scores ("scientific contribution" and "over-all usefulness")
assigned by his or her colleagues, converting these scores to percentiles, and
averaging over the group. Then "the performance scores were adjusted by adding or subtracting appropriate constants in such a way that the adjusted scores were no
longer related to the 'extraneous' factors of individual age, proportion of Ph. D.'s,
departmental autonomy or coordination, etc." Considering the very weak correlation
between the initial subjective scores and measurable scholarly output such as reports
or papers (Pelz and Andrews,14 Appendix D, pp. 284-285), this elaborate procedure
yields numbers that are practically uninterpretable in terms of observable scholarly
output.
Both the adjusted "scientific contribution" score and the adjusted "over-all
usefulness" score showed a weakly downward trend with increasing group age, but
the trend in the latter case was not statistically significant. The attempt by Wells and
Scientometrics 20 (1991) 409

J.E. COHEN: SIZE, AGE AND PRODUCTIVITY
Pelz to identify a peak (the locus of a putative "optimal age") in the zigzag curve of "over-all usefulness" as a function of group age is not supported by any statistical evaluation. It may reflect hot pursuit of a statistical fluctuation in a variable of uncertain meaning.
Swedish academic groups from natural science and technology ( 1979)
As described above, in 172 Swedish academic research groups from the fields of natural science and technology, Stankiewicz11 (p. 203, his paragraph 6) found that size and age, separately or in combination, bore little relation to output per scientist. Jointly, size and age explained 4% of the variation in output per scientist, and even less when other characteristics of the research groups were controlled statistically.
Empirical generalizations and theoretical interpretations
This review of empirical studies of the relations between group size, group age, and group scientific or technical output makes no claim to completeness. Additional studies are reviewed or mentioned by Stankiewicz11 (pp. 192-195) and Beaver.2 However, enough major, recent, empirical studies are included to suggest tentative answers to the questions which began this review.
Different studies have defined the boundaries, the output or productivity, the size, and the age of a research group in different ways, and have established different criteria for sampling research groups. Given these different definitions and methods, it is not surprising that the results of different studies sometimes appear to be inconsistent. Some studies claim that small is beautiful, others that big is beautiful, others that the middle way is beautiful, and yet others that size alone does not influence output per capita. The few studies of group age claim variously that, for
research groups, young is beautiful, old is beautiful, middle aged is beautiful, and age does not matter; some studies make more than one of these claims.
Based on the artifacts of procedure described above, the wishful thinking found in some reports, and reanalyses of reported data, I do not believe all these claims are right. The following comments represent my perspective. ·
410 Scienlometrics 20 (1991)
;.
J.E. COHEN: SIZE, AGE AND PRODUCI'IVITY
Size and output
When the size of a research group is measured by the number of professional scientists in it, and these scientists are identified independently of what they have published, and when output is measured by the total number of publications of that group, then the average output of groups with a given number of scientists is directly proportional to the number of scientists, according to Qurashi's,16 Stankiewicz's,17 and my4.S data. This proportionality applies to cross-sectional data (Stankiewicz, Cohen) and to times-series data (Qurashi); within institutions (Qurashi, Cohen) and among institutions (Stankiewicz). If correct, this conclusion implies that no size or range of sizes for a research group maximizes the average number of publications per unit of size. This conclusion is limited to the range of group sizes observed in these studies: up to 46 scientists in three biomedical research institutions,4.S up to 155
scientists in the Pakistani laboratory.16 Over a wide range of time and space, studies consistently fmd average per capita
annual publication rates in the range from 0.8 to 1.9. Based on Qurashi's and my data, I estimate the coefficient of proportionality (i. e., the annual number of publications per scientist) to be between one and 1.5. By way of comparison, the average annual number of publications per researcher in different types of institutes of the Ukrainian S. S. R. Academy of Sciences is:22 mathematics and theoretical physics, 1.9 publications per researcher per year; general biology, 1.5; geology 1.2;
biochemistry and theoretical medicine, 1.1; applied physics 1.0, chemistry and chemical technology 0.9; and technical sciences 0.8. These values cover the range observed in the United States and England4.S and Pakistan.16 Yankevich22 also observed that the higher the ratio of certificates of invention (analogous to patents) to publications in a category of institutes, the lower the average annual number of publications per researcher; in institutes more oriented to technological innovation, researchers produce fewer publications. A study in 1917 "found that the 84 'professional psychologists listed in the American Psychological Association' produced 1.3 publications per-year per-man between 1906 and 1915" (according to Wispe,22 p. 664). Later studies quoted by Wispe gave publication rates per personyear of 0.78, 1.35 and 0.79.
The number of publications of different research groups of the same size varies substantially; the larger the groups the greater the variation. Similarly, in the numbers of patents awarded to the 500 largest industrial firms listed by Fortune magazine for 1977, "the Patent/Sales ratio ... varies by about a factor of 1,000 for
Scientometrics 20 (1991) 411
J.E. COHEN: SIZE, AGE AND PRODUCTIVITY
companies of similar size. This suggests that one should look to something other than company size for an explanation of variations in inventivity" (Jackson et al.ll p. 216).
Finding factors other than group size (and age, to be dealt with next) to account for variations in the output of scientific and technical research groups is an important research problem. Decades of studies show vast differences in output and scientific contribution by the most and the least productive individual scientists. Perhaps it will be necessary to couple the study of individual differences in scientific output to the study of the scientific working group before either will become fully intelligible.
Available modeJs18,5 of the productivity of scientific groups make very different assumptions about the causal relations, if any, between size and output. The details of all existing models leave much to be desired.
Age and output
For an individual scientist, the relation between chronological age or professional age (years since the doctorate) and scientific output is remarkably subtle,24 contrary to folklore popular among scientists. A recent review concluded: "The jury is still out on the interconnections between the codification of scientific knowledge and stratification in research performance" (Zuckerman,23 p. 534).
Among the reported results on group age and output, the only consistency is that Wlspill and Stankiewicz11 both found no effect on output per capita when age is measured as years since founding or first functioning of the group. This conclusion is limited to the range of group ages observed in these studies, which were not clearly stated.
In .addition to time since formation, there are many other ways to measure the age of a research group: total or average years of membership in the group; total or average years since the highest degree; average, maximal or minimal chronological age of members; total or average years of research experience in the industry or the institution; and so on. It requires little ingenuity to hypothesize varied effects on output of different measures of age. I know no studies that examine empirically the relation of output to these different measures of age. It would be interesting to know, for example, if some of the variation in output of groups that have the same number of scientists is associated with variation in the average chronological age or average years of research experience of the scientists in the group or of the group leader.
412 Scientometrics 20 (1991)

J.E. COHEN: SIZE, AGE AND PRODUCTIVITY
Implications for research and management
Implications for research
There are two methodological patterns in past studies of the relation between group size and output. I will call these patterns "output-based" and "input-based."
In output-based studies, a corpus of papers, memos, or bibliographic references is
chosen. As examples, the corpus may contain all the memos of an information exchange group, 15 all the papers cited in a review paper and two bibliographies on prompt nuclear analysis3 or all the papers published in a specific journal over a span of years.19,13 The membership of a population of scientists is restricted to the authors
of one or more papers in the corpus. Groups within the populations are defined in terms of co-authorship or cross-citation; such definitions of group membership
depend on output. Output-based studies seem appropriate for studies of the sociology of knowledge because they begin with a corpus of written knowledge.
In output-based studies, the groups do not necessarily have any administrative or
institutional reality. Groups defmed in term of co-authorship or cross-citation are not (directly, at least) amenable to institutional management. Such groups generally have no localized requirements for resources, since the members may be dispersed
geographically. Nonpublishing scientists, who nevertheless receive a salary and occupy space, are omitted. The publications selected in output-based studies omit any works that escaped the particular filter chosen, such as publications by the same scientists on other topics or publications in journals not covered by the bibliography or citation index. Thus starting from a corpus of publications may give an incomplete picture of the scientific output of even those scientists who are among the authors of
the corpus. In input-based studies, groups of scientists are defined by existing administrative
arrangements, such as laboratories, research institutes, project groups or teams
headed by an identified leader. All the scientists, whether or not they publish, in the selected set of social units constitute the population under study. The corpus of publications consists of all the publications listed by the scientists in the population.
These publications may be listed either in an institutional report or in a special survey conducted by the investigator; either way the information about publications is furnished by the scientists in the population. Because abundant publications are often
associated with status, recognition and material rewards,23 it is fair to assume that
Sciemometrics 20 (1991) 413

J.E. COHEN: SIZE, AGE AND PRODUCI1VITY
few scientific publications are omitted from such institutional reports, but substantively trivial publications may well be included.
In input-based studies, the groups have administrative or institutional reality from the start. Because the groups have localized requirements for resources, they are amenable to institutional management. It is possible to relate the publications produced by a group to the resources expended on or by it. However, the groups defined administratively need not necessarily, and rarely will in fad, correspond to groups of collaborators or groups with common scientific interests. The "invisible colleges" of scientists working on a shared topic typically cross institutional and national boundaries. Publications selected in input-based studies may be jointly written with individuals outside of the group, and hence may credit the group with publications for which it is only partly responsible.
This account of the virtues and drawbacks of output-based and input-based studies of scientific productivity naturally suggests the possibility of combining both kinds of studies. For example, starting with an input-based study of a defined collection of biomedical research institutions, one could assemble all the publications of the resident scientists and conduct a typical output-based study of their publications. In reverse, one could start with an output-based study of a defined collection of biomedical research publications on a particular theme over a certain time period, and then conduct an input-based study of the institutional homes of all
or some of the authors of that corpus. Either approach would make it possible to study the relation between administrative arrangements and patterns of collaborations and cross-citations. For example, do laboratories of different size have different patterns of extramural collaboration? (Stankiewicz11 reports some inforniation on collaboration as a function of group size.) I am not aware of studies that have combined input-based and output-based approaches.
Implications for management
At the present level of ignorance, management based on simple notions about a hypothetical optimal size or optimal age of research groups is likely to do more harm than good. The limited data presently available provide no grounds for encouraging or discouraging scientific or technical research groups of small or large size, or young or old ages, if the goal of management is to maximize output as measured by publications or citations. More germane for management than size or age are the
414 Scientometrics 20 (1991)
J.E. COHEN: SIZE, AGE AND PRODUCTIVITY
technical requirements, social preferences, and actual productivity of particular groups.
I. Lederbetg and H. Zuckerman wete most helpful in providing tefetences used in this paper. I am grateful to W. S. Lyon, Jr., X. U. Mayer, R. X. MerttJn, H. Zuckerman and many members of the MaxPlanck-Gesellschaft zur Forderung der Wis&enschaften for vety helpful comments on a ptevious draft. This work wu aupPOrted in part by U. S. National Science Foundation grant BSR 87..{)5047 and the hospitality of Mr. and Mrs. W. T. Golden. '
References
1. S. .ARUNACHAlAM, K. MANoRAMA, Are citation-baaed quantitative technique& adequate for measuring acience on the periphety'? Scientometrics, 15 (S-6): (1989) 393-408.
2. D. DB B. BEAVER, Collaboration and team-work in physica, CUchoslovak JourtJQ/ of Physics B, 36 (1): (1986) 14-18.
3. E. BuJDos6, W. S. LYoN, I. NOSZLOPI Prompt nuclear analysia: growth and trends; a acientometric study, JourtJQ/ of Rol:lioan4lytical Chemistry, 74 (1): (1982) 197-238.
4. J. E. CoHEN, Publication rate 81 a function of laboratoty size in a biomedical research institution, Scienlometrics, 2: (1980) lS-52.
5. J. E. CoHEN, Publication rate 81 a function of laboratoty size in thtee biomedical IeSCarch institutions, Scientometrics, 3: (1981) 467-487.
6. J. E. CoHEN, Statiatical theoty aids infetence in acientometrica, Scienlometrics, 6 (1): (1984) 27-32. 7. R. C. DAitBV, The role of team and task characteriatica in R & D team collaborative ·problem
solving and productivity, Manogement Science, 24 (15): (1978) 1579-1588. B. Y. ElxANA, J. LHDBRBERG, R. K. MBRToN, A. 'I'HACJCRAY, H. ZuCKERMAN, Toward a Metric of
Science: The Advent of Science lndicaton, New York, J. Wiley, 1978. , 9. E. GARFimD, Measuring R & D productivity through scicntometrica, Current Contents, pp. 3-4, July
25,1988. 10. M. R. liALPBRJN, A. K. ClfAxRABAJm, Firm and industty characteriatica influencing publications of
acientiats in large American companiea, R & D MtuUlgement, 17 (3): (1987) 167-173. 11. K. A. JACKSON, G. H. GII.MBR, R. A. MATUlA, 'lnventivity' issue joined: small firm concept
challenged,/ndust7i41 Research and DtMlopment, 210-216, Feb. 1982. 12. D. LINDSEY, Using citation counts as a measute of quality in acience, Scientometrics, 15 (3-4): (1989)
189-203. 13. R. OVER, Collaborative research and publication in psychology, American Psychologist, 3'7 (9): (1982)
~1001.
14. D. C. Pm.z, F. M. ANDREWS, Scientists in Organizations, Rev. ed. Ann Arbor, Michigan, Institute for Social Research, The University of Michigan, 1976.
15. D. DB SoUA PRies, D. DB B. BEAVER, Collaboration in an invisible collage, American Psychologist, 21: (1966) 1011-1018.
16. M. M. QURASHI, The optimum aize of Iele&lCh groupa for maximum effectiveness. Part Ill. The dependence of scientific output on the aize of research groupa of laboratoriea and verification of size parameters in Parkinsonian law, Proceedin&r of 1M Pakistan Academy of Sciences, 9: (1972) 109-117.
17. R. STANXIBWICZ, 'lbc lizc and age or Swcdiah academic research groupa and their scientific performance, Cllapter 8 in Scienlifk Productivity: The Etfrctiveness of &search Groups in Six CoUIIII'iu, F. M. ANDREWS, (Ed.), Cambridge UniversityPieSS and Uneaco, 1979.
18. R. Smcx, J. SONDBRMANN, The effects of group aize and cooperation on the success of interdiaciplinaxy groupa in R & D , R & D MtuUlgement, 8 (2): (1978) 59-64.
Scientometrics 20 (1991) 415

J.E. COHEN: SIZE, AGE AND PRODUCI1VITY
19. J. Vucuf, Physics journal in retrospect and comparisons, Czechoslovak Journal of Physics B, 20: (1970) 501-526.
20. J. T. WAILMARK, S. Ec:KHRSTEJN, B. ~ANGERED, H. E. S. HoLMOVJST, The increase in efficiency with size of research teams, IEEE Transactions on Engineering Managemmt, EM-20 (3): (1973) 80-86.
21. L. G. WISP~ The bigger the better: productivity, size, and turnover in a sample of psychology departments, American Psyhologist, 24: (1969) 662-668.
22. W. F. YANXIMCH, Comparative analysis of publication and invention productivity of physics institutes, Czechoslovak loumDl of Physics B, 36 (1): (1986) 200-204.
23. H. ZuCKERMAN, The 50ciology of science. In: N. S. SMELSER, (Ed.), Handbook of Sociology, pp. 526-541, Newbuzy Park, CA.: Sage Publications, 1988.
24. H. ZuCKERMAN, R K. MERTON, Age, aging, and age structure in science. In: M. W. RILEY, M.
416
JoHNSON, ANNI! FoNBR, (Eds), A Sociology of Age Stratification, Vol. 3 of Aging and Society, New York, Russell Sage Foundation, 1m. Reprinted in: R K. MERTON, The Sociology of Science: Theoretical and Empirical Investigations, N. W. STORER, (Ed.), Chicago: University of Chicago Press, 1973.
•
Scientometrics 20 (1991)