six sigma applied to the pharmaceutical and...
TRANSCRIPT

TE Dr. Wayne Taylor – www.variation.com 1
Six Sigma Applied to the Six Sigma Applied to the
Pharmaceutical and Pharmaceutical and
Medical Device IndustriesMedical Device Industries
Dr. Wayne A. TaylorDr. Wayne A. Taylor
www.variation.comwww.variation.com
June 24, 2009

TE Dr. Wayne Taylor – www.variation.com 2
Evolution of QualityEvolution of Quality
� Six Sigma is the next step in the evolution
of management and quality practices
� It builds on previous stages: TQM,
Deming, SPC and much more
� While much will be familiar, it has new
elements:
“What accounts for the clearly superior
performance these companies have achieved?”

TE Dr. Wayne Taylor – www.variation.com 3
Lessons of Six SigmaLessons of Six Sigma
1. Tie to Business Goal (Six Sigma Quality,
Reduce Cost, Regulatory Compliant …)
2. Not Just Tools but Processes for Achieving
Results:
� Six Sigma Improvement Process
� Six Sigma Design Process
3. Dedicated Resources
4. Not Just Training but a Deployment Strategy

TE Dr. Wayne Taylor – www.variation.com 4
Six SigmaSix Sigma
� Six Sigma is about the rapid deployment of
the Six Sigma tools and processes into an
organization and the effective use of these
tools to achieve key business initiatives:
� Scrap and cost reduction
� Quality improvements (Six Sigma Quality)
� Time to market and cycle time reductions

TE Dr. Wayne Taylor – www.variation.com 5
Six Sigma Improvement - MAIC
Measure Analyze Improve Control(12) Verify Capability of Outputs
(13) Perform Other Testing
(7) Evaluate Stability and Capability of Outputs
(11) Reduce Variation by Identifying VIP and Robust Design
(8) Reduce Errors Using Mistake Proofing
(9) Improve Stability by Identifying Causes of Shifts
(10) Improve Average by Adjusting Key Inputs
(3) Identify Gaps in Performance
(5) Develop Measureable Outputs
(4) Separate into Mistake Proofing and Variation Reduction
(2) Establish Measures and Goals
(1) Determine CTQ Characteristics
15 20 25 30 35
Seal Strength
LSL USL
X1X2X3 X4X5X6 X7X8X9 X10
Seal S
tren
gth
Dwell Time
Tem
pera
ture
Ho
t B
ar
(oF
)
Dwell Time (sec)
0.5 0.75 1.0
200
175
150
Seal Strength Std. Dev.
1.4
1.4
1.1
1.7
1.7
2.0
2.0
5.61.02
70
60
40
30
50
TORQUE
L36.0 37.0 38.0
K = 20
K = -20
Subgroup
1 5 10 15 20
10.2
10.0
9.8
9.6
Radius
Upper Control Limit
Lower Control Limit
USLLSLVOC
PRESS
2 4 6 8 10
Percent Defective
0.0
0.5Pa
1.0
0
OC Curve
© Copyright 2000, Taylor Enterprises Inc.
(14) Implement Controls
15 20 25 30 35
Seal Strength
LSL USL
Item Function Failure Mode Causes Effects Control
Control Plan
(2) Lid Prevents Spills Lid falls of f due to loosness
Leaks from drinking hole
Spill when removing lid
Lid diameter too large
Body diameter
to small
Surfaces too slick
Hole too large
Hole has too
direct of path
Lid diameter too small
Body diameterto large
Material catches
Burn
Burn
Burn
Stain
Stain
Burn
Burn
Burn
Go-no go guage
Go-no go guage
Sampling Plan
Pin guage
(above)
(above)
Sampling Plan
Month
Jan Jul
100
99
98
97
Yield
Goal
Jan Jul
Cost
TimeQuality
(6) Validate Measurement System

TE Dr. Wayne Taylor – www.variation.com 6
Six Sigma Problem Solving - MAIC
Measure Analyze Improve Control
(8) Collect Additional Data Until Root Cause Identified
(12) Implement Solution
(9) Determine Best Solution
(10) Pilot Solution
(2) Determine When Problem Started
(6) Construct List of Verified Facts
(4) Identify Potential Causes
(3) Measure Problem Magnitude
(1) Describe the Problem
15 20 25 30 35
Seal Strength
LSL USL
2 4 6 8 10
Percent Defective
0.0
0.5Pa
1.0
0
OC Curve
© Copyright 2000, Taylor Enterprises Inc.
Item Function Failure Mode Causes Effects Control
Control Plan
(2) Lid Prevents Spills Lid falls off due to looseness
Leaks from drinking hole
Spill when removing lid
Lid diameter too large
Body diameter
to small
Surfaces too slick
Hole too large
Hole has toodirect of path
Lid diameter
too small
Body diameter
to large
Material catches
Burn
Burn
Burn
Stain
Stain
Burn
Burn
Burn
Go-no go gauge
Go-no go gauge
Sampling Plan
Pin gauge
(above)
(above)
Sampling Plan
(7) Compare Causes to Facts
(5) Analyze Existing Data
70
60
40
30
50
TORQUE
L36.0 37.0 38.0
K = 20
K = -20
19
12.5
6
Jan '87 Jul '87 Jan '88 Jul '88
Month
IS NOTIS
What
Where
When
Extent
Subgroup
1 5 10 15 20
10.2
10.0
9.8
9.6
Radius
Upper Control Limit
Lower Control Limit
(11) Verify Solution Works
1 2 3 4
T M B T M B T M B T M B
0.251
0.250
0.249
0.248
Fact 1
Fact 2
Fact 3
Fact 4
Fact 5
Cause 1 O X X O A
Cause 2 X O A A O
Cause 3 O O A A O
Cause 4 X A X O O
Cause 5 O O O O X
FACTS
(1) All Machines
(2) Second Shift
(3) Certain Codes
(4) Started 8/22
(5) Steadily Worse
(6) All Operators
A B C E H
Code
Nu
mb
er
D F G

TE Dr. Wayne Taylor – www.variation.com 7
Design for Six Sigma - IDOV
Identify Design Optimize Validate(12) Verify Capability of Outputs
(13) Perform Other Testing
(7) Candidate Inputs
(11) Set Targets and Tolerances
(8) Key Inputs
(9) Characterize Behaviors of Key Inputs
(10) Discover Variable Relationships
(3) Identify Potential Failure Modes
(5) Develop Measureable Outputs
(4) Mistake Proof
(2) Establish Measures and Standards
(1) Define Customer Requirements
1 5 2 0 2 5 3 0 3 5
S e a l S tre n g th
L S L U S L
0.9 1.0 1.1
Radius
X1X2X3 X4X5X6 X7X8X9 X10
Seal S
tren
gth
Dwell Time
Tem
pera
ture
Ho
t B
ar
(oF
)
Dwell Time (sec)
0.5 0.75 1.0
200
175
150
Seal Strength Std. Dev.
1.4
1.4
1.1
1.7
1.7
2.0
2.0
5.61.02
70
60
40
30
50
TORQUE
L36.0 37.0 38.0
K = 20
K = -20
Subgroup
1 5 10 15 20
10.2
10.0
9.8
9.6
Radius
Upper Control Limit
Lower Control Limit
VOC
Item Function Failure Mode Causes Effects O S D RPN
FMEA
(2) Lid Prevents Spills Lid falls off due to loosness
Leaks from drinking hole
Spill when removing lid
Lid diameter
too large
Body diameterto small
Surfaces too slick
Hole too large
Hole has toodirect of path
Lid diameter too small
Body diameter
to large
Material catches
Burn
Burn
Burn
Stain
Stain
Burn
Burn
Burn
5
5
5
2
2
5
5
5
3
3
2
1
2
3
3
5
1
3
2
2
3
1
3
3
15
45
20
4
12
15
45
75
PRESS
Pump
INPUT/
OUTPUTSYSTEM
R : Piston Radius (in.)
L : Stroke Length (in.)
S : Motor Speed (rpm)
B : Valve Backflow (ml)
F : Flow Rate (ml/min)
D ev eo lp ed B y : Wa yn e T ay lo rC op y rig ht 2 00 0, T ay lo r E n ter pr is es In c.
Category Requirement Verification Segment Importance
RequirementsDefinition
Function
Fit
Maintenance
Environment
Asetics
Cup not spill whentipped over br iefly
Cup not spill whendropped
Cup keep coffee hot
Cup keep cold dr inks cold
Cups are stackable
Cup fits into cup holdersprovided in cars
Cup can be easily
washed
Cup is dishwashersafe
Recycable
No dangerous substances
Pleasing color
Pleasing shape
All customers
All customers
All customers
All customers
Customers buying multiple cups
Most customers
All customers
All customers
All customers
All customers
All customers
All customers
Roll cup on side for 5 seconds
Body diameterto small
Coffee initially heatedto 150oF should stay above 130oF for at least 15 minutes
Water initially cooled to 50oF should stay below 60oF for at least 15 minutes
Cups should easilystack with the baseof one cup fitting insidethe lid of another
With lids removedcups should fit insideeach other and lidsshould easily stack
Should fit all major models of Ford, GM,Chrysler, Toyota,BMW, Opel
No hard to clean
crevices or surfaces
Should be no warpingwhen placed in 200oF water for 60minutes
Made of type A-Cplastic material
Test for traces of lead,heavy metals, orcanerogenicsubstanses
Variety of colorsincluding br ight and
nuetral colors
Get customer input of differentshapes
1
1
2
2
3
1 2 3 4 5 6 7 8 9 10
Years
0.0
0.2
0.6
Failu
re R
ate
0.8
1.0
0
0.4
Life Testing
2 4 6 8 10
Percent Defective
0.0
0.5Pa
1.0
0
OC Curve
© Copyright 2000, Taylor Enterprises Inc.
(6) Validate Measurement System
(14) Implement Controls
Item Function Failure Mode Causes Effects Control
Control Plan
(2) Lid Prevents Spills Lid falls of f due to loosness
Leaks from drinking hole
Spill when removing lid
Lid diameter too large
Body diameterto small
Surfaces too slick
Hole too large
Hole has toodirect of path
Lid diameter too small
Body diameterto large
Material catches
Burn
Burn
Burn
Stain
Stain
Burn
Burn
Burn
Go-no go guage
Go-no go guage
Sampling Plan
Pin guage
(above)
(above)
Sampling Plan

TE Dr. Wayne Taylor – www.variation.com 8
Validation / Validation /
Six Sigma ToolsSix Sigma Tools� GHTF Annex A (pages 12-20) describe the tools useful for validation and their roles:
� Statistical Process Control (SPC)
� Acceptance Sampling
� Designed Experiments
� Mistake Proofing
� FMEA
� Robust Design and Tolerance Analysis
� Statistical Methods (confidence intervals, hypothesis testing, ANOVA, regression)

TE Dr. Wayne Taylor – www.variation.com 9
Validation Tools
IQ OQ PQ
(10) Process PQ Testing
(7) Determine VariableRelationships
(8) Finalize Control Plan
(9) Determine and TestWorst-Case Conditions
(6) Determine and Characterize Key Inputs
(3) EquipmentChallengeTesting
(4) Develop Measurable Outputs
(2) Mistake Proof
(1) Risk Assessment
15 20 25 30 35
Seal Strength
LSL USL
70
60
40
30
50
TORQUE
L36.0 37.0 38.0
K = 20
K = -20
USLLSL
PRESS
2 4 6 8 10
Percent Defective
0.0
0.5Pa
1.0
0
OC Curve
©Copyright 2000, Taylor Enterprises Inc.
Item Function Failure Mode Causes Effects Control
Control Plan
(2) Lid Prevents Spills Lid falls off due to looseness
Leaks from drinking hole
Spill when removing lid
Lid diameter too large
Body diameterto small
Surfaces too slick
Hole too large
Hole has toodirect of path
Lid diameter too small
Body diameterto large
Material catches
Burn
Burn
Burn
Stain
Stain
Burn
Burn
Burn
Go-no go gauge
Go-no go gauge
Sampling Plan
Pin gauge
(above)
(above)
Sampling Plan
(5) Validate Measurement System
Item Function Failure Mode Causes Effects O S D RPN
FMEA
(2) Lid Prevents Spills Lid falls off due to looseness
Leaks from drinking hole
Spill when removing lid
Lid diameter too large
Body diameterto small
Surfaces too slick
Hole too large
Hole has toodirect of path
Lid diameter too small
Body diameterto large
Material catches
Burn
Burn
Burn
Stain
Stain
Burn
Burn
Burn
5
5
5
2
2
5
5
5
3
3
2
1
2
3
3
5
1
3
2
2
3
1
3
3
15
45
20
4
12
15
45
75
Te
mp
era
ture
Ho
t B
ar (
of)
Dwell Time (sec)
0.5 0.75 1.0
200
175
150
1.4
1.4
1.1
1.7
1.7
2.0
2.0
5.61.02
(11) Product PQTesting
1 2 3 4 5 6 7 8 9 10
Years
0.0
0.2
0.6
Fail
ure
Rate
0.8
1.0
0
0.4

TE Dr. Wayne Taylor – www.variation.com 10
Control PlanControl Plan� In GHTF Guidance Document:
� “One output of process validation is a
control plan.”
� “The final phase of validation requires
demonstrating that this control plan works.”
� We will learn about the elements that
make up a control plan
� Control Plan to be completed prior to
OQ Limit Testing
TE Dr. Wayne Taylor – www.variation.com 11
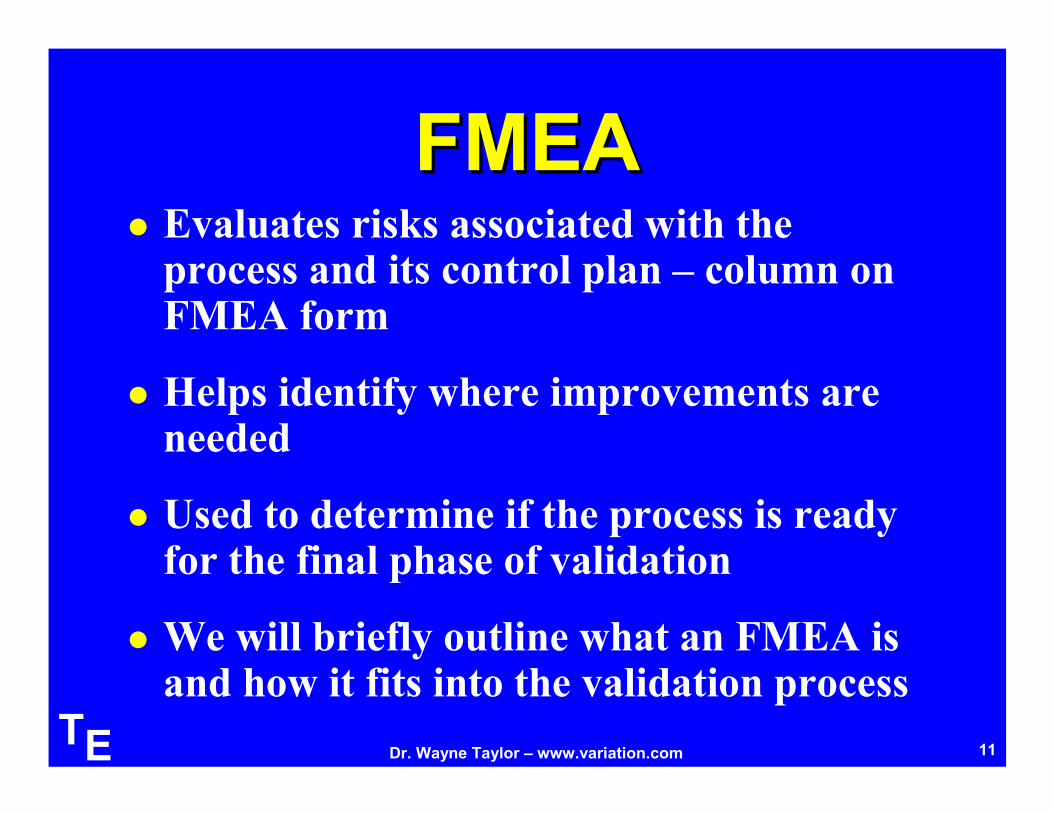
FMEAFMEA� Evaluates risks associated with the process and its control plan – column on FMEA form
� Helps identify where improvements are needed
� Used to determine if the process is ready for the final phase of validation
� We will briefly outline what an FMEA is and how it fits into the validation process
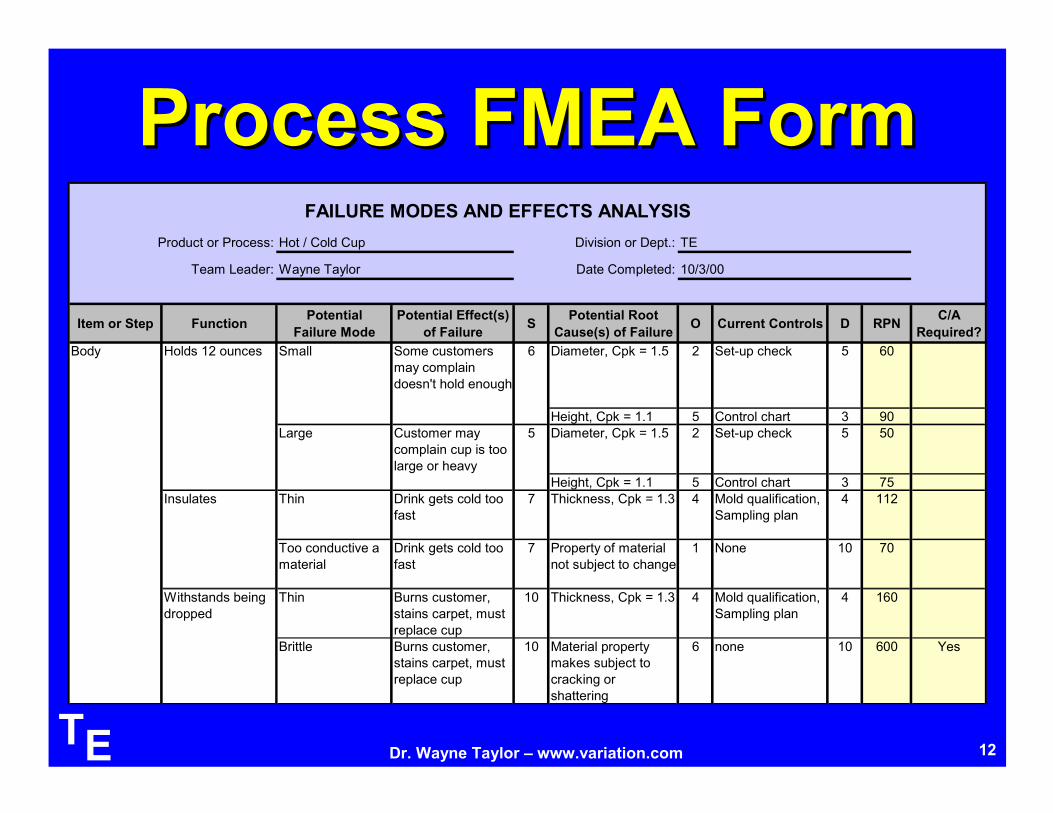
TE Dr. Wayne Taylor – www.variation.com 12
FAILURE MODES AND EFFECTS ANALYSIS
Product or Process: Hot / Cold Cup Division or Dept.: TE
Team Leader: Wayne Taylor Date Completed: 10/3/00
Item or Step FunctionPotential
Failure Mode
Potential Effect(s)
of FailureS
Potential Root
Cause(s) of FailureO Current Controls D RPN
C/A
Required?
Body Holds 12 ounces Small Some customers
may complain
doesn't hold enough
6 Diameter, Cpk = 1.5 2 Set-up check 5 60
Height, Cpk = 1.1 5 Control chart 3 90
Large Customer may
complain cup is too
large or heavy
5 Diameter, Cpk = 1.5 2 Set-up check 5 50
Height, Cpk = 1.1 5 Control chart 3 75
Insulates Thin Drink gets cold too
fast
7 Thickness, Cpk = 1.3 4 Mold qualification,
Sampling plan
4 112
Too conductive a
material
Drink gets cold too
fast
7 Property of material
not subject to change
1 None 10 70
Withstands being
dropped
Thin Burns customer,
stains carpet, must
replace cup
10 Thickness, Cpk = 1.3 4 Mold qualification,
Sampling plan
4 160
Brittle Burns customer,
stains carpet, must
replace cup
10 Material property
makes subject to
cracking or
shattering
6 none 10 600 Yes
Process FMEA FormProcess FMEA Form

TE Dr. Wayne Taylor – www.variation.com 13
Statistical RequirementsStatistical RequirementsPart 820-Quality Systems Regulations
Subpart 0, 820.250 Statistical Techniques
(a) Where appropriate, each manufactures shall establish and
maintain procedures for identifying valid statistical
techniques required for establishing, controlling, and
verifying the acceptability of process capability and
product characterization.
(b) Sampling plans, when used, shall be written and based on
a valid statistical rationale. Each manufacturer shall
establish and maintain procedures to ensure that sampling
methods are adequete for their intended use and to ensure
that when changes occur the sampling plans are reviewed.
These activities shall be documented.

TE Dr. Wayne Taylor – www.variation.com 14
Valid Statistical TechniquesValid Statistical Techniques
� Recognized Technique
� Properly Applied
� Assumptions are Met
TE Dr. Wayne Taylor – www.variation.com 15
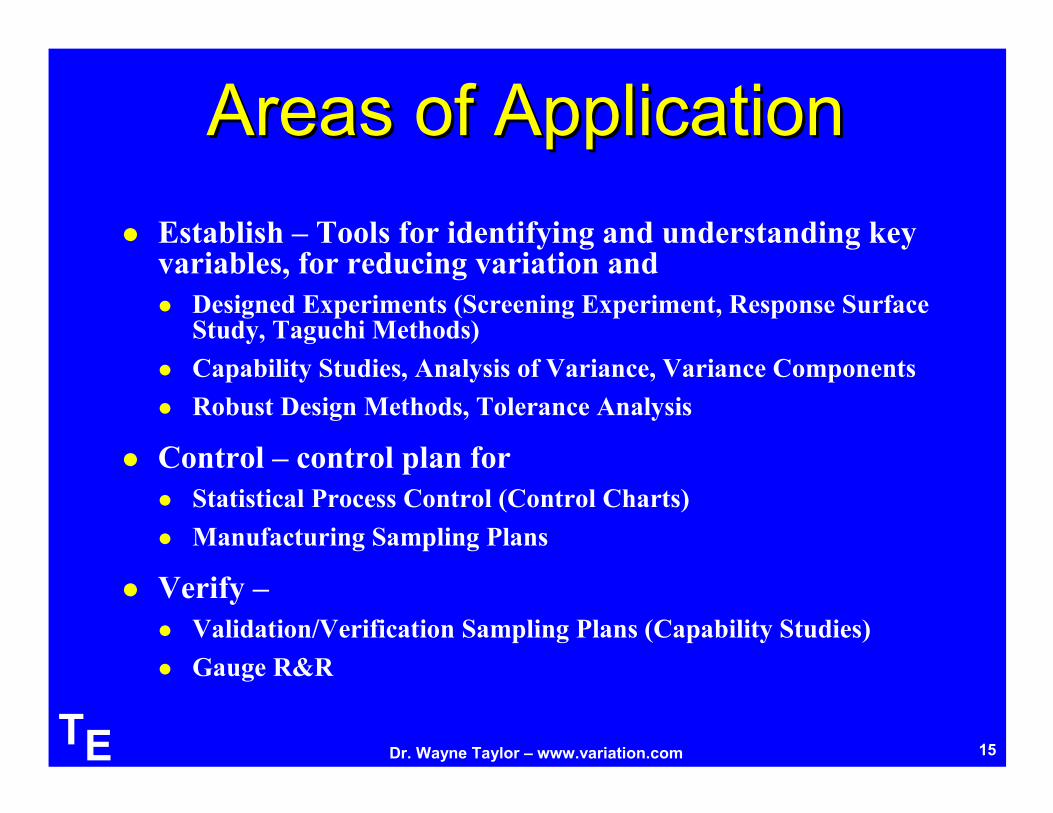
Areas of ApplicationAreas of Application
� Establish – Tools for identifying and understanding key variables, for reducing variation and setting specifications
� Designed Experiments (Screening Experiment, Response Surface Study, Taguchi Methods)
� Capability Studies, Analysis of Variance, Variance Components
� Robust Design Methods, Tolerance Analysis
� Control – control plan for maintaining specs
� Statistical Process Control (Control Charts)
� Manufacturing Sampling Plans
� Verify – demonstrating specs are met
� Validation/Verification Sampling Plans (Capability Studies)
� Gauge R&R

TE Dr. Wayne Taylor – www.variation.com 16
Establish Establish –– Setting SpecsSetting Specs
� Translate Customer Requirements into Product, Process and Material Requirements
� Assumes customer requirements are identified and translated into verifiable specifications
� Must identify key product/process/material parameters that must be controlled
� Must understand the effect these key parameters have
� Must understand ability to control these key parameters
� Use all this to establish targets and tolerances on these parameters

TE Dr. Wayne Taylor – www.variation.com 17
Establish Establish –– Setting SpecsSetting Specs
PUMP
Flow RateRadius of Piston
Stroke Length
Motor Speed
Valve BackflowMOTOR
Voltage
Number Windings
Wire Diameter
Tightness WindingsWIRE
Roller Speed
Head Speed
Temperature
Melt Index

TE Dr. Wayne Taylor – www.variation.com 18
Pump Case StudyPump Case Study
� The Requirement:
� Flow Rate of 10 ± 1 ml/min
� The Concept:
� Piston and Valves
1 2
TE Dr. Wayne Taylor – www.variation.com 19
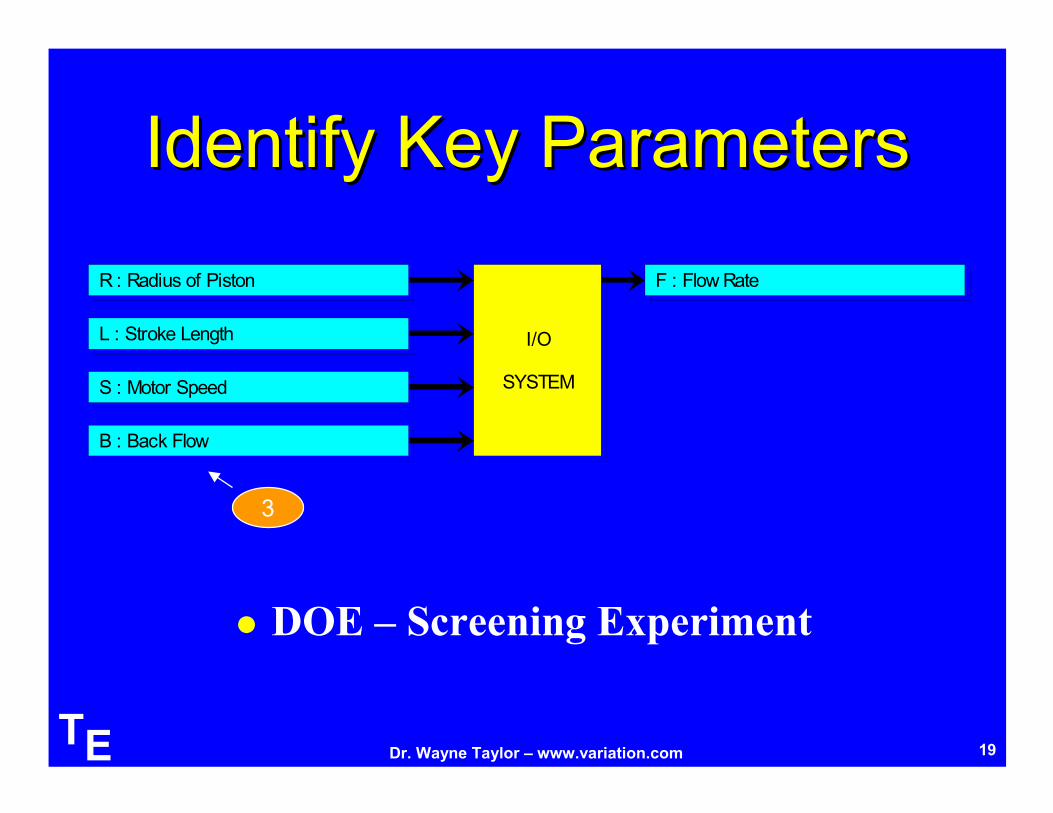
Identify Key ParametersIdentify Key ParametersMedical Pump
I/O
SYSTEM
R : Radius of Piston
L : Stroke Length
S : Motor Speed
B : Back Flow
F : Flow Rate
3
� DOE – Screening Experiment

TE Dr. Wayne Taylor – www.variation.com 20
Effect of Key ParametersEffect of Key Parameters
� DOE – Response Surface Study
S)BLR388.16(F2
−π=
4

TE Dr. Wayne Taylor – www.variation.com 21
Control of Key ParametersControl of Key Parameters
� Capability Studies
Inputs Initial Targets Standard Deviation
Piston Radius (R) --- 0.0005”
Stroke Length (L) --- 0.0017”
Motor Speed (S) --- 0.17 rpm
Back Flow (B) 0.05 0.005 ml
5

TE Dr. Wayne Taylor – www.variation.com 22
Initial DesignInitial Design
� Designer has freedom to select targets for
R, L and S.
Inputs Initial Targets Standard Deviation
Piston Radius (R) 0.1 0.0005”
Stroke Length (L) 0.5 0.0017”
Motor Speed (S) 48.2 0.17 rpm
Back Flow (B) 0.05 0.005 ml

TE Dr. Wayne Taylor – www.variation.com 23
Tolerance StackTolerance Stack--upup
PredictedPredicted
PerformancePerformance
Initial DesignInitial Design

TE Dr. Wayne Taylor – www.variation.com 24
Tolerance StackTolerance Stack--upup
� One way of predicting the variation is by performing a simulation
OUTPUT
INPUT
Relationship BetweenInput and Output
Variation of Input
TransmittedVariation

TE Dr. Wayne Taylor – www.variation.com 25
Optimal/Robust DesignOptimal/Robust Design� There are many ways to achieve a 10 ml/min flow
rate. One minimizes the variation. The design
minimizing the defect rate is:
Inputs Initial Targets Standard Deviation
Piston Radius (R) 0.1737 0.0005”
Stroke Length (L) 0.4094 0.0017”
Motor Speed (S) 17.06 0.17 rpm
Back Flow (B) 0.05 0.005 ml

TE Dr. Wayne Taylor – www.variation.com 26
Optimal/Robust DesignOptimal/Robust Design
PredictedPredicted
PerformancePerformance
Robust DesignRobust Design

TE Dr. Wayne Taylor – www.variation.com 27
Robust Design Robust Design -- Adjust TargetsAdjust Targets
Seal
Strength
Dwell Time

TE Dr. Wayne Taylor – www.variation.com 28
Tighten TolerancesTighten Tolerances
OUTPUT
INPUT
Relationship BetweenInput and Output
Variation of Input
TransmittedVariation

TE Dr. Wayne Taylor – www.variation.com 29
Tolerance Sensitivity AnalysisTolerance Sensitivity Analysis
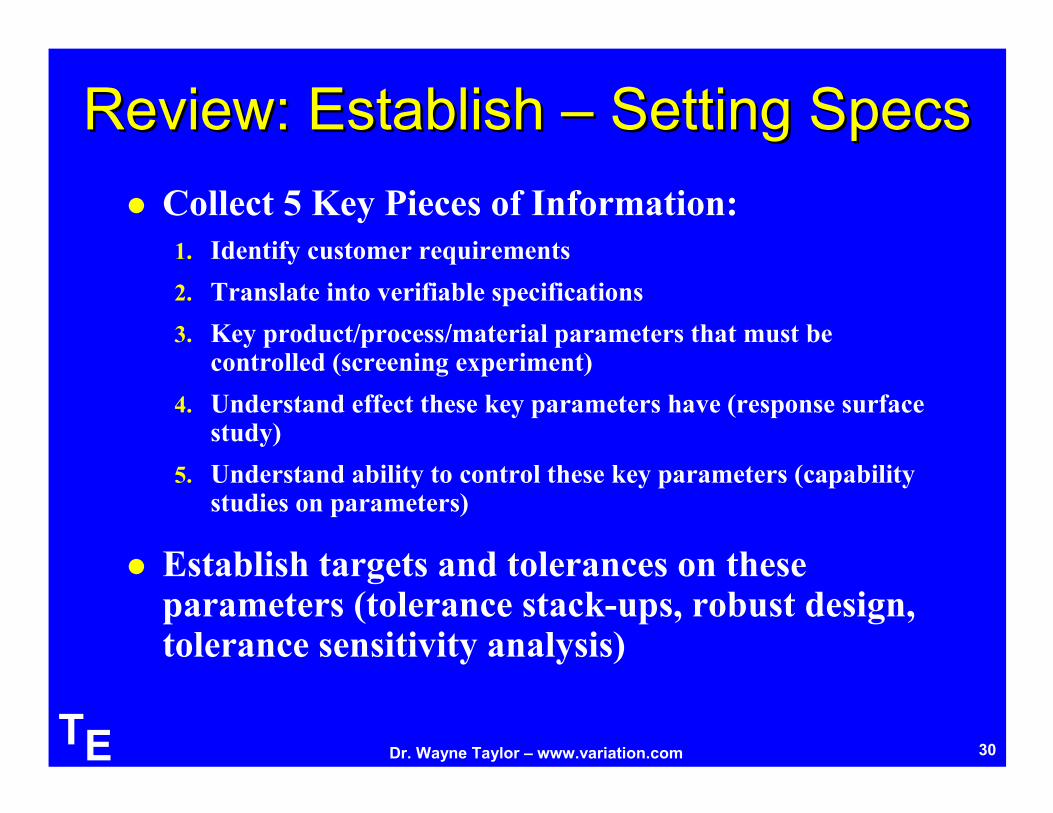
TE Dr. Wayne Taylor – www.variation.com 30
Review: Establish Review: Establish –– Setting SpecsSetting Specs
� Collect 5 Key Pieces of Information:
1. Identify customer requirements
2. Translate into verifiable specifications
3. Key product/process/material parameters that must be controlled (screening experiment)
4. Understand effect these key parameters have (response surface study)
5. Understand ability to control these key parameters (capability studies on parameters)
� Establish targets and tolerances on these parameters (tolerance stack-ups, robust design, tolerance sensitivity analysis)

TE Dr. Wayne Taylor – www.variation.com 31
Control Control –– Maintaining SpecsMaintaining Specs
� Statistical Process Control (Control
Charts)
� Manufacturing Sampling Plans
� 100% Inspections
� Mistake Proofing
� Close Loop Feedback

TE Dr. Wayne Taylor – www.variation.com 32
Verify Verify –– Demonstrating Specs MetDemonstrating Specs Met
� Validation/Verification Sampling Plans
(Capability Studies)
� Gauge R&R

TE Dr. Wayne Taylor – www.variation.com 33
Validation Tools
IQ OQ PQ
(10) Process PQ Testing
(7) Determine VariableRelationships
(8) Finalize Control Plan
(9) Determine and TestWorst-Case Conditions
(6) Determine and Characterize Key Inputs
(3) EquipmentChallengeTesting
(4) Develop Measurable Outputs
(2) Mistake Proof
(1) Risk Assessment
15 20 25 30 35
Seal Strength
LSL USL
70
60
40
30
50
TORQUE
L36.0 37.0 38.0
K = 20
K = -20
USLLSL
PRESS
2 4 6 8 10
Percent Defective
0.0
0.5Pa
1.0
0
OC Curve
©Copyright 2000, Taylor Enterprises Inc.
Item Function Failure Mode Causes Effects Control
Control Plan
(2) Lid Prevents Spills Lid falls off due to looseness
Leaks from drinking hole
Spill when removing lid
Lid diameter too large
Body diameterto small
Surfaces too slick
Hole too large
Hole has toodirect of path
Lid diameter too small
Body diameterto large
Material catches
Burn
Burn
Burn
Stain
Stain
Burn
Burn
Burn
Go-no go gauge
Go-no go gauge
Sampling Plan
Pin gauge
(above)
(above)
Sampling Plan
(5) Validate Measurement System
Item Function Failure Mode Causes Effects O S D RPN
FMEA
(2) Lid Prevents Spills Lid falls off due to looseness
Leaks from drinking hole
Spill when removing lid
Lid diameter too large
Body diameterto small
Surfaces too slick
Hole too large
Hole has toodirect of path
Lid diameter too small
Body diameterto large
Material catches
Burn
Burn
Burn
Stain
Stain
Burn
Burn
Burn
5
5
5
2
2
5
5
5
3
3
2
1
2
3
3
5
1
3
2
2
3
1
3
3
15
45
20
4
12
15
45
75
Te
mp
era
ture
Ho
t B
ar (
of)
Dwell Time (sec)
0.5 0.75 1.0
200
175
150
1.4
1.4
1.1
1.7
1.7
2.0
2.0
5.61.02
(11) Product PQTesting
1 2 3 4 5 6 7 8 9 10
Years
0.0
0.2
0.6
Fail
ure
Rate
0.8
1.0
0
0.4