six sigma 9 analyze-2
TRANSCRIPT

8/10/2019 Six Sigma 9 Analyze-2
http://slidepdf.com/reader/full/six-sigma-9-analyze-2 1/46
Upendra Kachru SIX SIGMA
Six Sigma – Analyze Phase

8/10/2019 Six Sigma 9 Analyze-2
http://slidepdf.com/reader/full/six-sigma-9-analyze-2 2/46
Upendra Kachru SIX SIGMA
Step in Analyze Phase
Process Map Value Stream Mapping
Cause & Effect
Fishbone Diagram (Minitab)
C&E Matrix (Excel)
Process Capability Cpk
Cp
8/10/2019 Six Sigma 9 Analyze-2
http://slidepdf.com/reader/full/six-sigma-9-analyze-2 3/46
Upendra Kachru SIX SIGMA
• Defines value from the customer’s perspective• All of the actions and tasks, both value added and
non-value added, required to bring an item (an idea,information, product or service) from its inception
through delivery. – These include actions to process information from the
customer and actions to transform the product on its wayto the customer.
• Value streams vary in scope: reach beyond theenterprise to single process size
What Is a Value Stream?

8/10/2019 Six Sigma 9 Analyze-2
http://slidepdf.com/reader/full/six-sigma-9-analyze-2 4/46

8/10/2019 Six Sigma 9 Analyze-2
http://slidepdf.com/reader/full/six-sigma-9-analyze-2 5/46
Upendra Kachru SIX SIGMA
Value and Waste
Value is that for the sake of which a process exists; e.g., to produce designs that meet customer needs within the constraints
of time, money, and regulatory requirements.
Waste in a process is anything not needed to get the job done to
the satisfaction of the customer and other stakeholders.
Only processing adds value.
All the rest is waste:
– Waiting
– Moving
– Inspecting or Approving – Reworking
8/10/2019 Six Sigma 9 Analyze-2
http://slidepdf.com/reader/full/six-sigma-9-analyze-2 6/46
Upendra Kachru SIX SIGMA
Ohno’s 7 Types of Waste
• Inventories of goods awaiting processing or consumption• Unnecessary transport of goods
• Defects in products
• Overproduction of goods not needed
• Unnecessary processing• Waiting by employees for process equipment to finish work or
for an upstream activity to complete.
• Unnecessary movement of people
8/10/2019 Six Sigma 9 Analyze-2
http://slidepdf.com/reader/full/six-sigma-9-analyze-2 7/46
Upendra Kachru SIX SIGMA
Value Categories
– Value categories as defined below
• Value Added: – Physically transforms the “thing” going through the process
– Must be done right the first time
– Meaningful from the customer’s perspective (is the customer willing
to pay for it?)
• Value Enabling:
– Satisfies requirements of non-paying external stakeholders
(government regulations)
• Non-Value Added
– Everything else

8/10/2019 Six Sigma 9 Analyze-2
http://slidepdf.com/reader/full/six-sigma-9-analyze-2 8/46
Upendra Kachru SIX SIGMA
A Simple Example
Pick Up Paper Walk to Stapler Staple Paper
Walk to Desk Put Down Paper
Time: 1 sec.
Distance: 0
Time: 5 sec.Distance: 20 ft.
Time: 5 sec.
Distance: 20 ft.
Time: 2 sec.
Distance: 0
Time: 1 sec.Distance: 0
Total Time: 14 sec.Total Dist: 40 ft.
Value Added Time: 4 sec. Value Added Dist: 0
Value Added Time: 28%
Info: Where to place stapleInfo: Location of stapler
Excess Travel
Customer Need:Stapled pages

8/10/2019 Six Sigma 9 Analyze-2
http://slidepdf.com/reader/full/six-sigma-9-analyze-2 9/46
Upendra Kachru SIX SIGMA
Value Stream Process Steps
1. Prepare
2. Gather Data & Develop Current State
3. Develop Future State & Action Plan
4. Execute to Plan
5. Align
8/10/2019 Six Sigma 9 Analyze-2
http://slidepdf.com/reader/full/six-sigma-9-analyze-2 10/46
Upendra Kachru SIX SIGMA
Value Stream Process
Step 1 - Prepare• Gather Preparatory Information
– Document the Case for Change
– Define the Scope (start and end of process)
– Identify the Requirements
– Review/establish Measurements
• Set Logistics for Event
– Participants
– Location
– Materials – Meals/Refreshments
– Etc.
8/10/2019 Six Sigma 9 Analyze-2
http://slidepdf.com/reader/full/six-sigma-9-analyze-2 11/46
Upendra Kachru SIX SIGMA
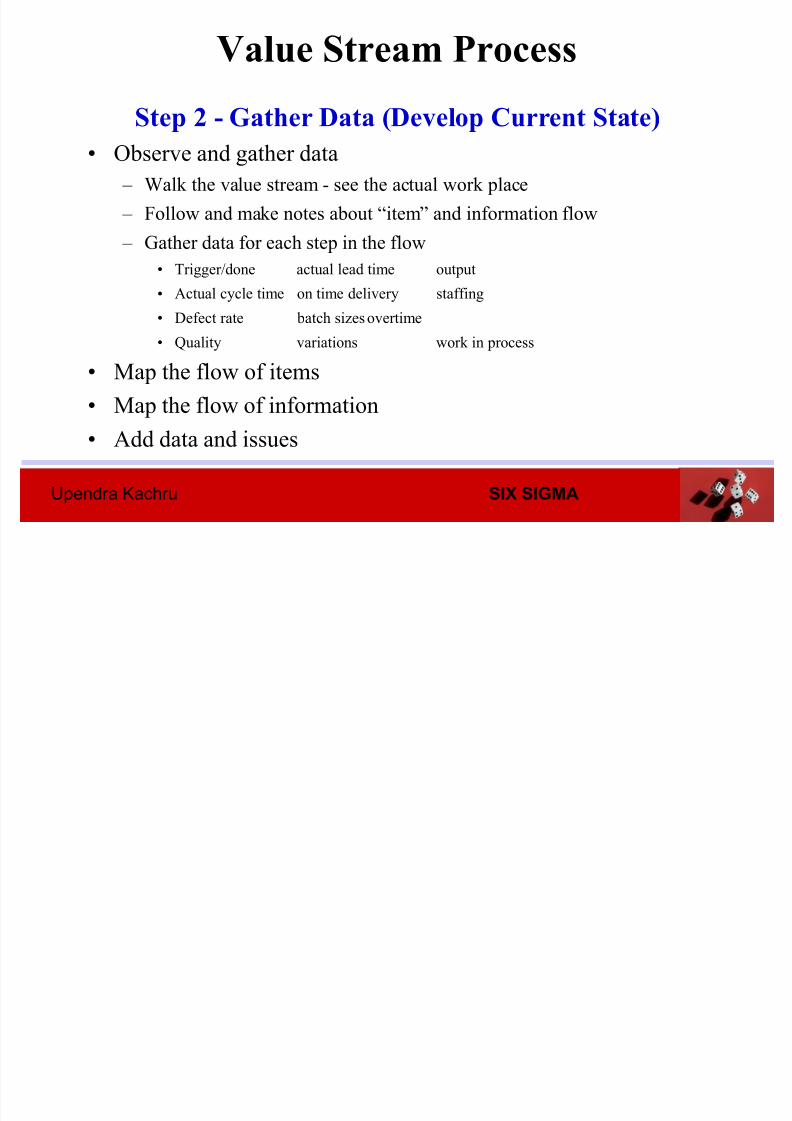
Value Stream Process
Step 2 - Gather Data (Develop Current State)
• Observe and gather data
– Walk the value stream - see the actual work place
– Follow and make notes about “item” and information flow
– Gather data for each step in the flow
• Trigger/done actual lead time output
• Actual cycle time on time delivery staffing
• Defect rate batch sizes overtime
• Quality variations work in process
• Map the flow of items
• Map the flow of information
• Add data and issues

8/10/2019 Six Sigma 9 Analyze-2
http://slidepdf.com/reader/full/six-sigma-9-analyze-2 12/46
Upendra Kachru SIX SIGMA
Characterising Inputs
• Inputs can be classified as one of three types
• Controllable (C)
– Things you can adjust or control during the process
• Speeds, feeds, temperatures, pressures….
• Standard Operating Procedures (S)
– Things you always do (in procedures or common sense things)
• Cleaning, safety….
• Noise (N)
– Things you cannot control or don't want to control
(too expensive or difficult)• Ambient temperature, humidity, operator...

8/10/2019 Six Sigma 9 Analyze-2
http://slidepdf.com/reader/full/six-sigma-9-analyze-2 13/46
Upendra Kachru SIX SIGMA
Characterising Inputs- Example
Machining a shaft
on a latheInputs (x’s)
Rotation speed
Traverse speed
Tool typeTool sharpness
Shaft material
Shaft length
Material removal per cut
Part cleanliness
Coolant flow
Operator
Material variation
Ambient temperature
Coolant age
Outputs (Y’s)
Diameter Taper
Surface finish
C
C
CC
C
C
C
S
C
N
N
N
S

8/10/2019 Six Sigma 9 Analyze-2
http://slidepdf.com/reader/full/six-sigma-9-analyze-2 14/46
Upendra Kachru SIX SIGMA
Detailed Example
KLNS
(Y' AcDe(Y's)Surf - Re- Re- 'De
TB
(SS
N
NDT A
A
N
(x'CCNSNNNNSCN(x's)C TN PN OS RS M(x's)C Ma HydC PicS AgN QuN CoN Pr S PaN OpS Sh
BATH
(Y's)Uniformity ofNo excess fl
TUNN
(Y's)Dry castinWarm cas
IN ZINH / BU
(Y's)
Coating- Thickn- Unifor - Total- Appea- Rough- Comp
TER SPNOCK
RUM
(
A
S
(Y's)Zinc : AppeRemoFittin
COAFITTI
(x's)
C Speed of c
C Temperatu
C Make up of
S Cleanliness
N Geometry
S Pendant st
S Amount per
S Weight of p
(Heat remo
S Time fromN Humidity
(x's)
C Speed of
S Tempera
N Geometr
N Humidity
S Air veloci
(x's)
S Quality
C Tempe
S Level
S Level
N Geom
N Operat
S Quality
N Specifi
S Rate oS FluidityN Power
(x's)
S Wat
N Wat
C Spe
N Mas
(Rate
(x'CCNS

8/10/2019 Six Sigma 9 Analyze-2
http://slidepdf.com/reader/full/six-sigma-9-analyze-2 15/46
Upendra Kachru SIX SIGMA
Value Stream Process
Step 3 – Future State & Action Plans
• Discuss the ideal state
• Develop the future state map
• Develop action plans & cadence tracking
– Build draft time line for implementation
• Communication & training as required
Designing for 6-sigma
• Reduce the number of parts in a product
• Reduce the number of steps in a process
8/10/2019 Six Sigma 9 Analyze-2
http://slidepdf.com/reader/full/six-sigma-9-analyze-2 16/46
Upendra Kachru SIX SIGMA
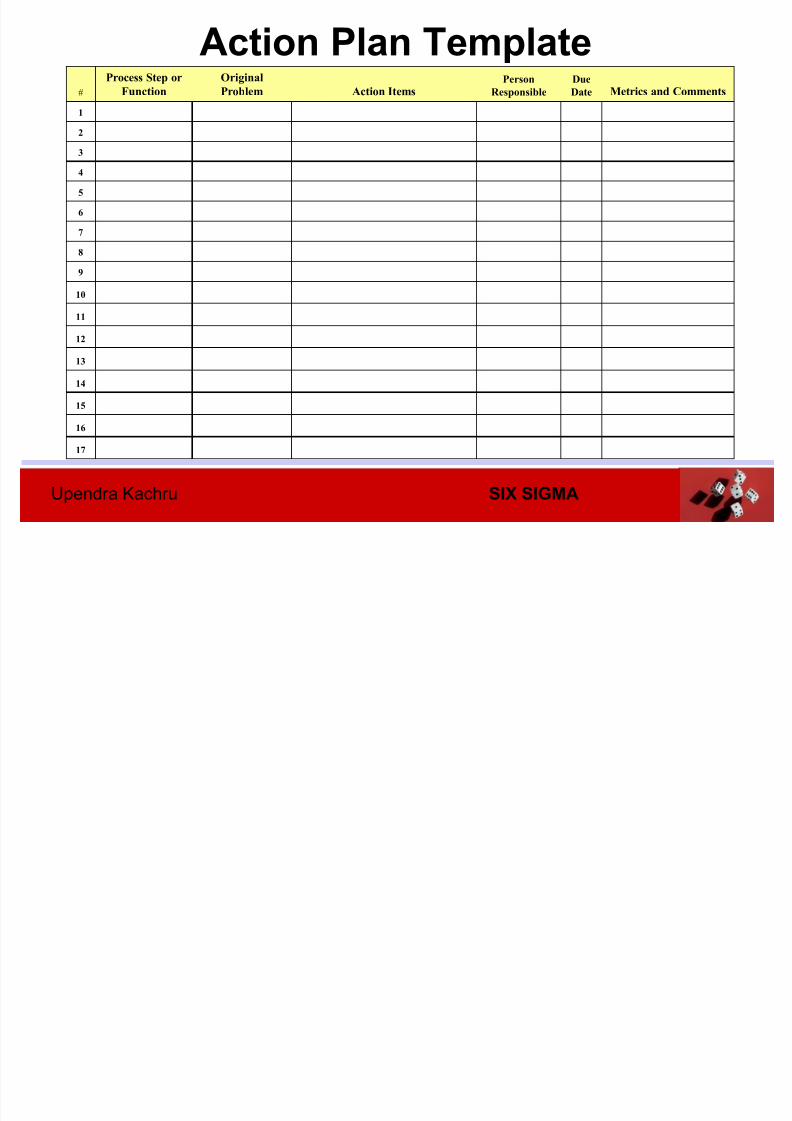
Action Plan Template#
Process Step or
Function
Original
Problem Action ItemsPerson
Responsible
Due
Date Metrics and Comments
1
2
3
4
5
6
7
8
9
10
11
12
13
14
15
16
17

8/10/2019 Six Sigma 9 Analyze-2
http://slidepdf.com/reader/full/six-sigma-9-analyze-2 17/46
Upendra Kachru SIX SIGMA
Swimlane Diagram
Prepare ArchitecturalDrawings
Prepare
Engineering
Drawings based on
Loads
Modify
Engineering
Drawings
Subcontract Detailing
to Fabricator
Subcontract Detailing
To Detailer
Prepare Details
Check details
& modify asappropriate
Check details& modify as
appropriate
Check details
& modify as
appropriate
Check details
& modify asappropriate
Return modifieddetails to fabricator
Structural
Engineer
Architect
General
Contractor
Fabricator
Detailer
RFI Process for Placing Drawings

8/10/2019 Six Sigma 9 Analyze-2
http://slidepdf.com/reader/full/six-sigma-9-analyze-2 18/46
Upendra Kachru SIX SIGMA
Example: RFI Process for Placing Drawings
Check RFI
& modify drawing as
appropriate
Structural
Engineer
LEAD
TIME
PROCESS
TIME
Q?
What is the percentage of actual processing
time compared to the amount of time it sits in
someone’s In tray?
Example: RFI Process for Placing Drawings

8/10/2019 Six Sigma 9 Analyze-2
http://slidepdf.com/reader/full/six-sigma-9-analyze-2 19/46
Upendra Kachru SIX SIGMA
Assumptions:
8 hour work days (weekends not deducted)
Sections of RFI log where time spent was not recorded are
not included in the calculation.
Sample entry :
Lead time
(LT)
Time spent
to respond
to RFIs
(VAT)
Example: RFI Process for Placing Drawings
8/10/2019 Six Sigma 9 Analyze-2
http://slidepdf.com/reader/full/six-sigma-9-analyze-2 20/46
Upendra Kachru SIX SIGMA
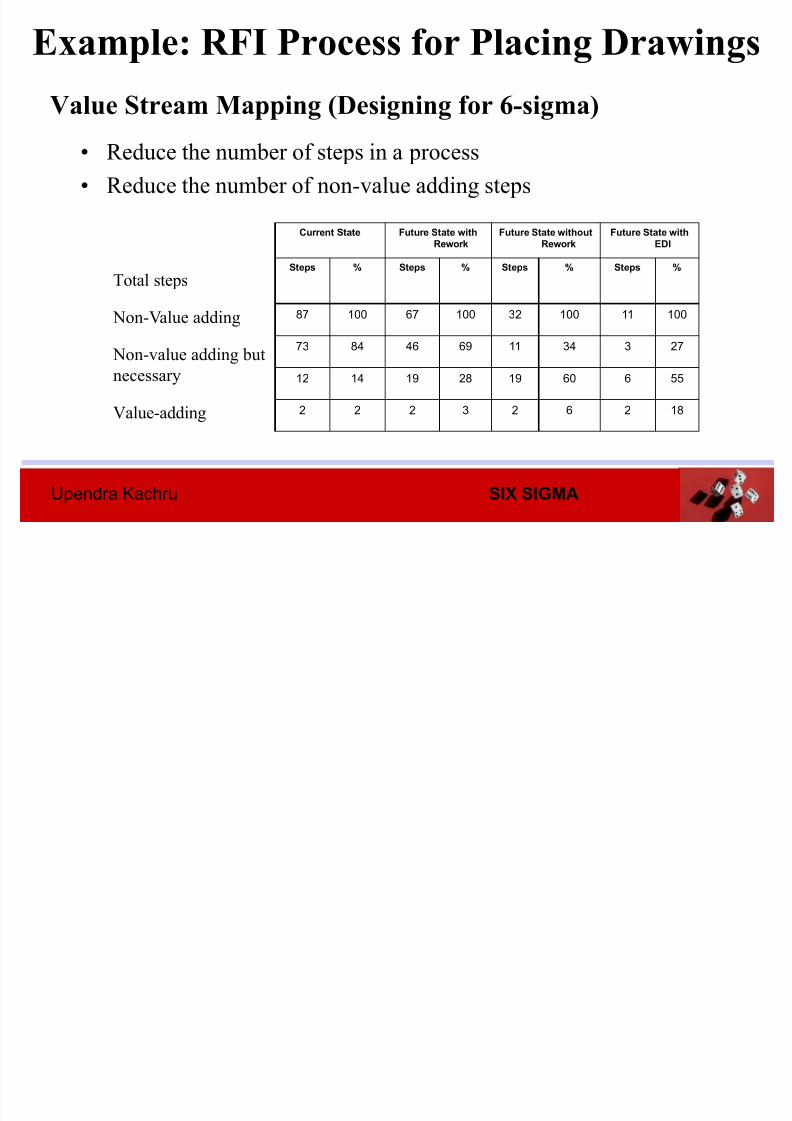
Value Stream Mapping (Designing for 6-sigma)
Current State Future State with
Rework
Future State without
Rework
Future State with
EDI
Steps % Steps % Steps % Steps %
87 100 67 100 32 100 11 100
73 84 46 69 11 34 3 27
12 14 19 28 19 60 6 55
2 2 2 3 2 6 2 18
Total steps
Non-Value adding
Non-value adding but
necessary
Value-adding
Example: RFI Process for Placing Drawings
• Reduce the number of steps in a process
• Reduce the number of non-value adding steps
8/10/2019 Six Sigma 9 Analyze-2
http://slidepdf.com/reader/full/six-sigma-9-analyze-2 21/46
Upendra Kachru SIX SIGMA
Cause & Effect (Fishbone) Diagram
C & E Analysis – A method a work group can use to identify the possible causes of
a problem
– A tool to identify the factors that contribute to a qualitycharacteristic
• Visual means for tracing a problem to its causes
• Identifies all the possible causes of a problem and how they relate
before deciding which ones to investigate
• C & E analysis is used as a starting point for investigating a problem

8/10/2019 Six Sigma 9 Analyze-2
http://slidepdf.com/reader/full/six-sigma-9-analyze-2 22/46
Upendra Kachru SIX SIGMA
• All the factors that could affect the problem or the quality
characteristic
• Five Major Categories
– Materials
– Methods – People
– Machines
– Environment
The problem or quality
characteristic
The effect is the outcome of the factors that affect it
Cause & Effect (Fishbone) Diagram
C & Eff M i

8/10/2019 Six Sigma 9 Analyze-2
http://slidepdf.com/reader/full/six-sigma-9-analyze-2 23/46
Upendra Kachru SIX SIGMA
The C&E matrix is constructed from the fishbone diagram using the
following procedure:1. List the process output variables
2. Rate each output on a 1-to-10 scale to importance to the
customer
3. List process input variables (from the process map)4. Rate each input's relationship to each output variable using a 0,
1, 3, 9 scale
5. Select the high ranking input variables to start the FMEA
process;
6. Determine how each selected input variable can "go wrong" and
place that in the Failure Mode column of the FMEA.
Cause & Effect Matrix

8/10/2019 Six Sigma 9 Analyze-2
http://slidepdf.com/reader/full/six-sigma-9-analyze-2 24/46
Upendra Kachru SIX SIGMA
Cause and Effect Matrix
Benefit – Gain new knowledge and perspectives by sharing ideas with
others
– Helps us understand our processes
– Provides a basis for action
• Whenever a problem is discovered, using C&E analysis
forces us to take a proactive stance by seeking out causes
C & Eff t M t i

8/10/2019 Six Sigma 9 Analyze-2
http://slidepdf.com/reader/full/six-sigma-9-analyze-2 25/46
Upendra Kachru SIX SIGMA
• Define the Effect
• Identify the Major Categories
• Generate Ideas
• Evaluate Ideas
• Vote for the Most Likely Causes
• Rank the Causes
• Verify the Results• Recommend Solutions
Eight Steps in Cause and Effect Analysis:
Effect
Cause & Effect Matrix
C & Eff t M t i

8/10/2019 Six Sigma 9 Analyze-2
http://slidepdf.com/reader/full/six-sigma-9-analyze-2 26/46
Upendra Kachru SIX SIGMA
Cause & Effect Matrix
Process Capability

8/10/2019 Six Sigma 9 Analyze-2
http://slidepdf.com/reader/full/six-sigma-9-analyze-2 27/46
Upendra Kachru SIX SIGMA
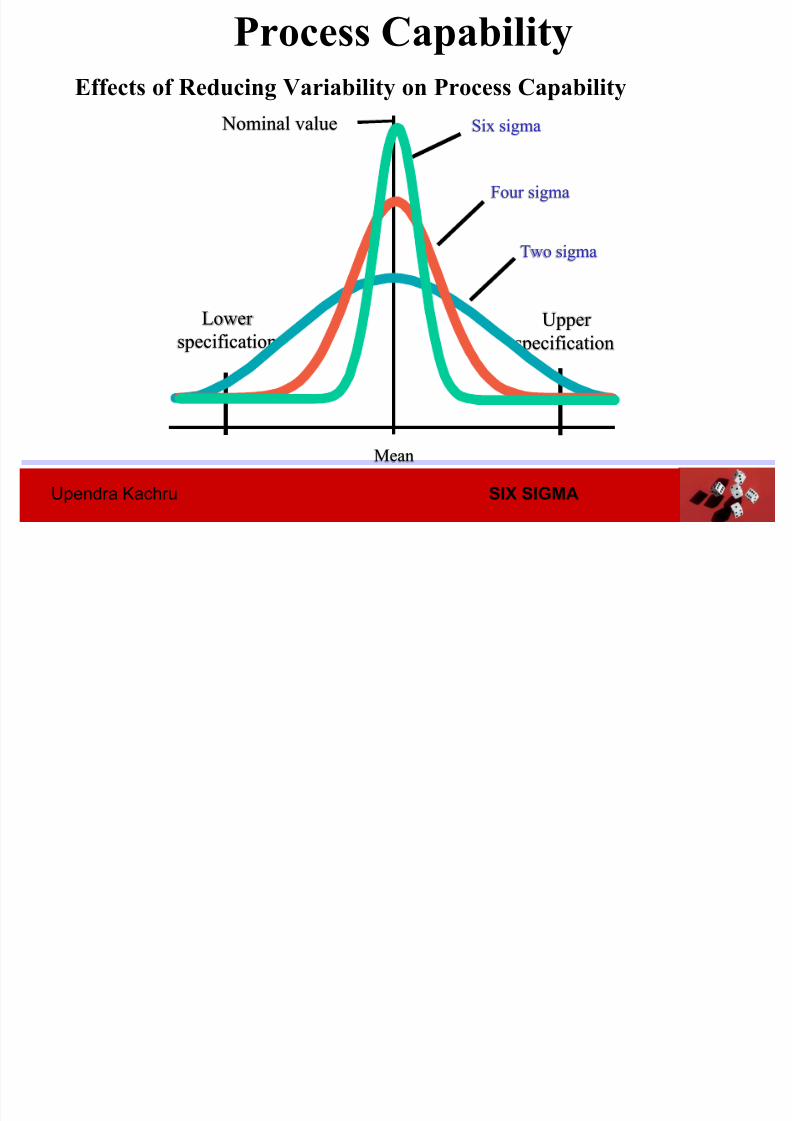
20 25 30
Upper
specification
Lower
specification
Nominal value
Process Capability
This process is capable
Process distribution
Process capability is the ability of the process to meet the design
specifications for a service or product.
• Nominal value is a target for design specifications.
• Tolerance is an allowance above or below the nominal value.
P C bili

8/10/2019 Six Sigma 9 Analyze-2
http://slidepdf.com/reader/full/six-sigma-9-analyze-2 28/46
Upendra Kachru SIX SIGMA
Capable Process
A stable process that meets customer requirements.
Capability assessments for unstable processes, may not be indicative
of how the process is actually performing.
Spec limits or tolerances for product quality characteristics are:
– Characteristic of the part/item (product) in question
– Based on functional design considerations
– Related to/compared with an individual part measurement
– Used to establish a part’s conformance to design intent
Process Capability

8/10/2019 Six Sigma 9 Analyze-2
http://slidepdf.com/reader/full/six-sigma-9-analyze-2 29/46
Upendra Kachru SIX SIGMA
Process is not capable
20 25 30
Upper
specification
Lower
specification
Nominal
value
Process distribution
Process Capability
8/10/2019 Six Sigma 9 Analyze-2
http://slidepdf.com/reader/full/six-sigma-9-analyze-2 30/46
Process Capability
8/10/2019 Six Sigma 9 Analyze-2
http://slidepdf.com/reader/full/six-sigma-9-analyze-2 31/46
Upendra Kachru SIX SIGMA
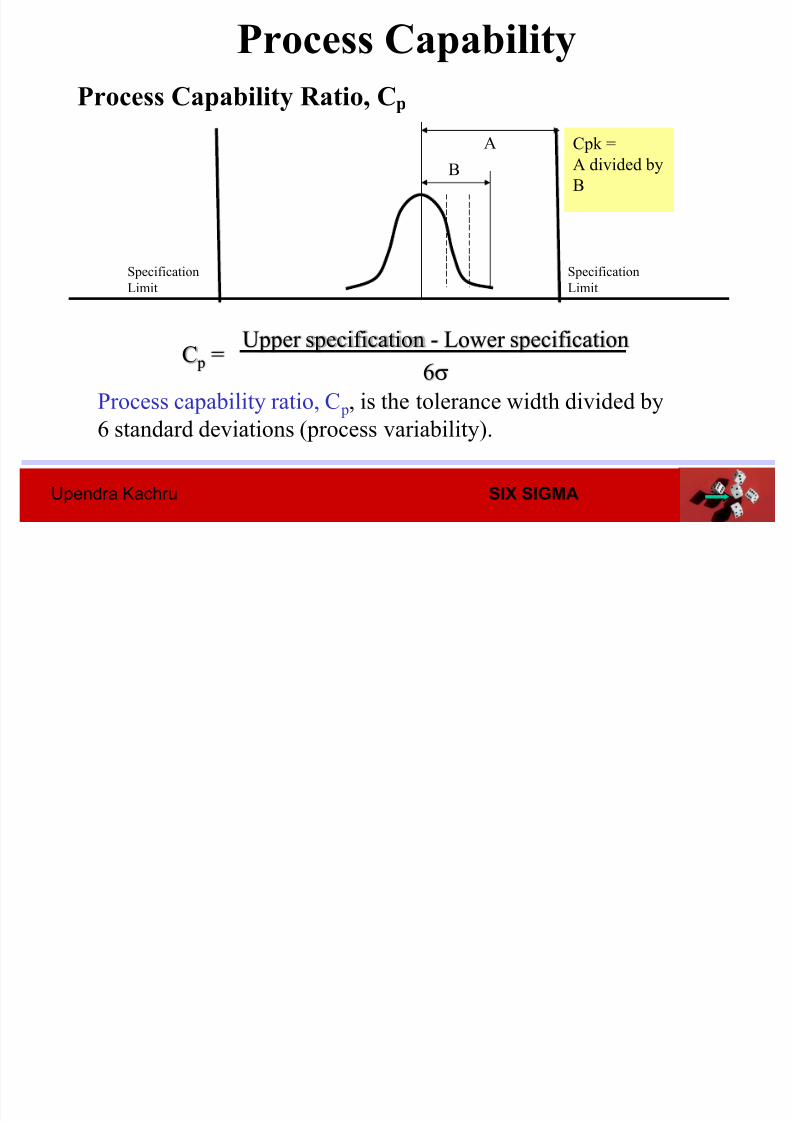
Process capability ratio, C p, is the tolerance width divided by6 standard deviations (process variability).
Process Capability Ratio, Cp
C p =Upper specification - Lower specification
6
Process Capability
A
B
SpecificationLimit
SpecificationLimit
Cpk =A divided by
B
P C bili

8/10/2019 Six Sigma 9 Analyze-2
http://slidepdf.com/reader/full/six-sigma-9-analyze-2 32/46
Upendra Kachru SIX SIGMA
C pk = Minimum of Upper specification – x3s
x – Lower specification3s
,
=
=
Process Capability Index, C pk , is an index that measures the
potential for a process to generate defective outputs relative to
either upper or lower specifications.
Process Capability Index, Cpk
We take the minimum of the two ratios because it gives the worst-
case situation.
Process Capability
P C bili

8/10/2019 Six Sigma 9 Analyze-2
http://slidepdf.com/reader/full/six-sigma-9-analyze-2 33/46
Upendra Kachru SIX SIGMA
Cpk & Cp
Cpk incorporates information about both the process spread and
the process mean, so it is a measure of how the process is
actually performing.
Cp relates how the process is performing to how it should be
performing. Cp does not consider the location of the process
mean, so it tells you what capability your process could achieve
if centered.
Process Capability
E ample: Intensi e Care Lab
8/10/2019 Six Sigma 9 Analyze-2
http://slidepdf.com/reader/full/six-sigma-9-analyze-2 34/46
Upendra Kachru SIX SIGMA
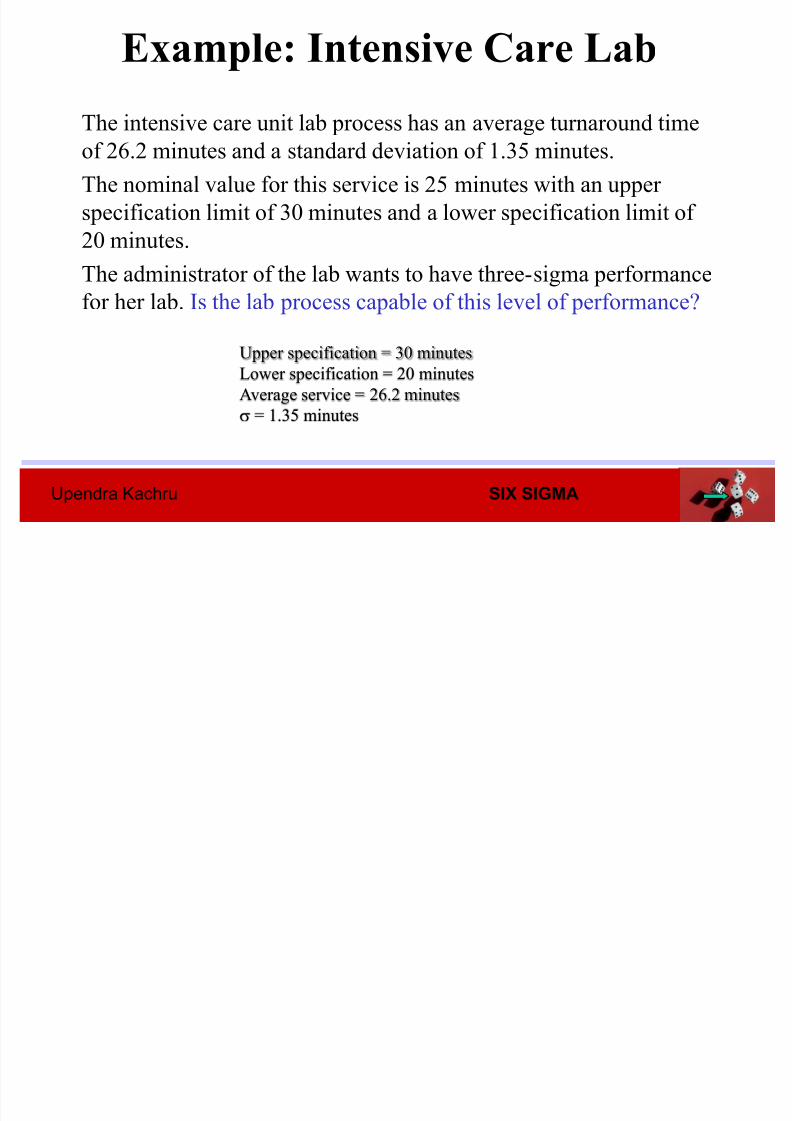
Example: Intensive Care Lab
Upper specification = 30 minutes
Lower specification = 20 minutes
Average service = 26.2 minutes
= 1.35 minutes
The intensive care unit lab process has an average turnaround time
of 26.2 minutes and a standard deviation of 1.35 minutes.
The nominal value for this service is 25 minutes with an upper
specification limit of 30 minutes and a lower specification limit of
20 minutes.
The administrator of the lab wants to have three-sigma performancefor her lab. Is the lab process capable of this level of performance?
Intensive Care Lab

8/10/2019 Six Sigma 9 Analyze-2
http://slidepdf.com/reader/full/six-sigma-9-analyze-2 35/46
Upendra Kachru SIX SIGMA
C pk
=Minimum of
Upper specification – x
3s
x – Lower specification
3s,
= =
Upper specification = 30 minutesLower specification = 20 minutes
Average service = 26.2 minutes
= 1.35 minutes
Intensive Care Lab
C pk = Minimum of 26.2 – 20.0
3(1.35),
30.0 – 26.2
3(1.35)
C pk = Minimum of 1.53, 0.94 = 0.94ProcessCapability
Index
Assessing Process Capability
i C

8/10/2019 Six Sigma 9 Analyze-2
http://slidepdf.com/reader/full/six-sigma-9-analyze-2 36/46
Upendra Kachru SIX SIGMA
C p =Upper specification - Lower specification
6
C p =30 - 20
6(1.35)= 1.23 Process Capability Ratio
Before Process Modification
Upper specification = 30.0 minutes Lower specification = 20.0 minutes
Average service = 26.2 minutes = 1.35 minutes C pk = 0.94 C p = 1.23
Intensive Care Lab
Does not meet 3 (1.00 C pk ) target due to a shift in mean (Note
variability is ok since C p is over 1.0)
Assessing Process Capability
P C bilit

8/10/2019 Six Sigma 9 Analyze-2
http://slidepdf.com/reader/full/six-sigma-9-analyze-2 37/46
Upendra Kachru SIX SIGMA
Statistical Assessment of Process Capability
• Get Process in Statistical Control
• Statistical Assessment (Minitab or Excel)
– Construct histogram of individual measurements
– Compute probability of exceeding specifications P(•)• Empirically (observed)
• Convert to defects per million (DPM) and sigma capability
• Compute process capability indices … C p, C pk
Process Capability
P C bilit

8/10/2019 Six Sigma 9 Analyze-2
http://slidepdf.com/reader/full/six-sigma-9-analyze-2 38/46
Upendra Kachru SIX SIGMA
Control Charts for Attributes
p -chart: A chart used for controlling the proportion of
defective services or products generated by the process.
p = p(1 –
p)/nWhere
n = sample size
p = central line on the chart, which can be either the historical average
population proportion defective or a target value.
z = normal deviate (number of standard deviations from the average)
Control limits are: UCL p = p+z p and LCL p = p−z p – –
Process Capability

8/10/2019 Six Sigma 9 Analyze-2
http://slidepdf.com/reader/full/six-sigma-9-analyze-2 39/46
Upendra Kachru SIX SIGMA
Process Capability Requirements
• Process must be normally distributed
• Process must be in control
• Process capability result:
– > 1.34 = capable
– < 1.33 = not capable
– = 1.33 = barely capable
– > 5 or 10 is “overkill”, excessive resource use
Process Capability

8/10/2019 Six Sigma 9 Analyze-2
http://slidepdf.com/reader/full/six-sigma-9-analyze-2 40/46
Upendra Kachru SIX SIGMA
Process Capability
Spreadsheet Template
Process Capability Study

8/10/2019 Six Sigma 9 Analyze-2
http://slidepdf.com/reader/full/six-sigma-9-analyze-2 41/46
Upendra Kachru SIX SIGMA
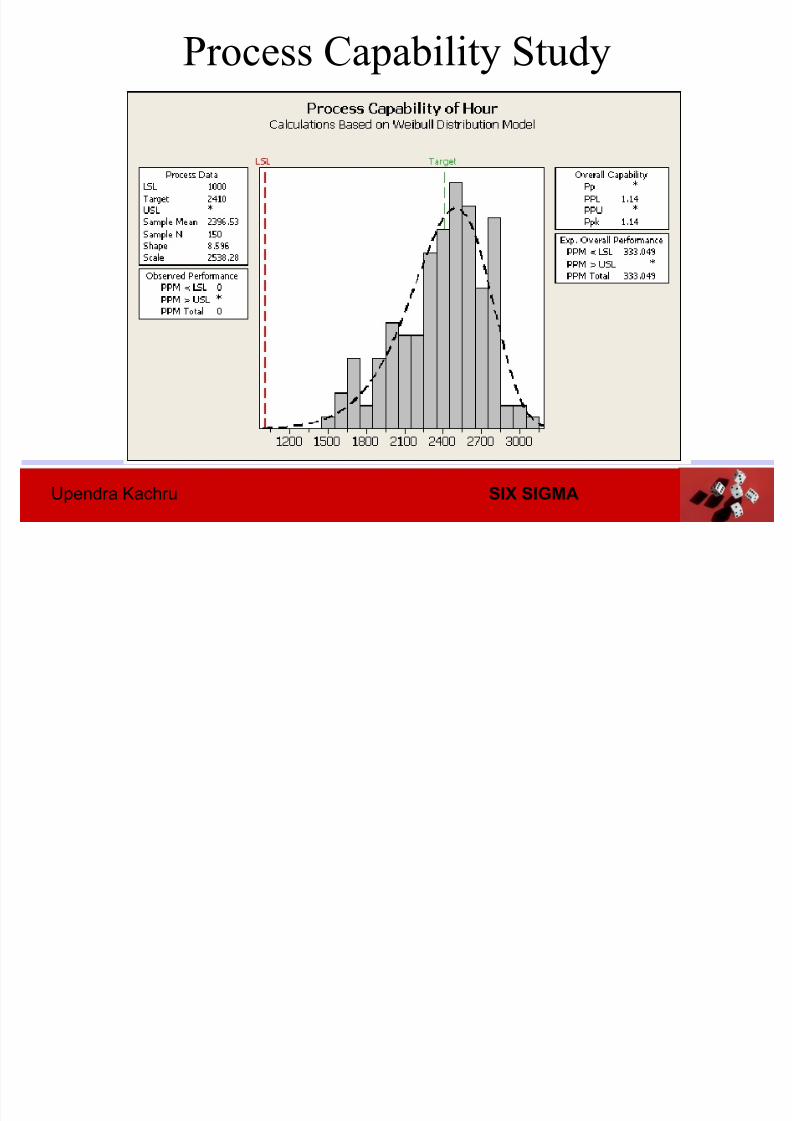
Process Capability Study
Process Capability Study
8/10/2019 Six Sigma 9 Analyze-2
http://slidepdf.com/reader/full/six-sigma-9-analyze-2 42/46
Upendra Kachru SIX SIGMA
Process Capability Study
Process Capability

8/10/2019 Six Sigma 9 Analyze-2
http://slidepdf.com/reader/full/six-sigma-9-analyze-2 43/46
Upendra Kachru SIX SIGMA
Alternatives for Improving Process Capability
• If bias
– Recenter and recompute P(•), dpm, and sigma capability
• If too much variation
– Sort by 100% inspection
– Widen tolerance
– Use a more precise process (e.g., better or new technology)to reduce variation
– Use statistical methods to identify variation reduction
opportunities for existing process
Process Capability
Process Capability

8/10/2019 Six Sigma 9 Analyze-2
http://slidepdf.com/reader/full/six-sigma-9-analyze-2 44/46
Upendra Kachru SIX SIGMA
Non-normal distributions
•Use Capability Analysis (Nonnormal) to assess the capability
of an in-control process when the data are from the nonnormal
distribution. A capable process is able to produce products or
services that meet specifications.
•The process must be in control and follows a nonnormal
distribution before you assess capability. If the process is not in
control, then the capability estimates will be incorrect.
• Nonnormal capability analysis consists of a capability
histogram and a table of process capability statistics
Process Capability
Process Capability

8/10/2019 Six Sigma 9 Analyze-2
http://slidepdf.com/reader/full/six-sigma-9-analyze-2 45/46
Upendra Kachru SIX SIGMA
How it helps
• A Process Capability study is the end result of the analysis done
on process output data.
• A Process Capability study reflects what our customer sees.
• It indicates what our short term and long term situation looks
like.
• Recognise however that our processes need to be stable (in
statistical control) as well as capable.
• Before anything, we must have faith in our measurements, hence
the need for a measurement system analysis.
Process Capability

8/10/2019 Six Sigma 9 Analyze-2
http://slidepdf.com/reader/full/six-sigma-9-analyze-2 46/46
Upendra Kachru SIX SIGMA
C l i c k t o e d i t c o m p a n y s l o g a n .