siva prasad kumpatla - indiana university
TRANSCRIPT

COMPUTATIONAL MINING AND SURVEY OF SIMPLE SEQUENCE
REPEATS (SSRs) IN EXPRESSED SEQUENCE TAGS (ESTs) OF
DICOTYLEDONOUS PLANTS
Siva Prasad Kumpatla
Submitted to the faculty of the School of Informatics
in partial fulfillment of the requirements for the degree
Master of Science in Bioinformatics
in the School of Informatics,
Indiana University
July, 2004

Accepted by the Graduate Faculty, Indiana University in partial fulfillment
of the requirements for the degree of Master of Science
________________________
(Dr. Snehasis Mukhopadhyay)
Master’s Thesis Committee
________________________
(Dr. Douglas Perry)
________________________
(Dr. Jeffrey Huang)

©2004
Siva Prasad Kumpatla
ALL RIGHTS RESERVED

D E D I C A T I O N This thesis is dedicated to the memory of my father,
Venkateswara Rao Kumpatla,
My role model for hard work and perseverance
Acknowledgments
“Imagination is more important than knowledge…”
- Albert Einstein (1879 - 1955)
What started out to be an idea for a small bioinformatics project, later developed into a
full blown project culminating in the current thesis. I am extremely grateful to the
guidance and help extended to me by the faculty of School of Informatics and a number
of colleagues and friends during this journey of converting my imagination and desire of
mining SSRs in a large number of dicotyledonous species into reality.
First of all, I would like to thank my advisor, Dr. Snehasis Mukhopadhyay, for his
guidance, constant encouragement, helpful suggestions and for providing me resources
and feedback throughout the project. I extend my sincere gratitude to Dr. Douglas Perry
for enthusiastically agreeing to be on my committee and for his strong support for the
project idea. I am particularly thankful for his careful review and critique of the project
proposal and thesis and for providing me valuable suggestions from time to time. I would
like to thank Dr. Jeffrey Huang for his guidance in the development of the RepeatFetcher
program and for his encouragement extended to me throughout the project.
My heartfelt thanks are due to Dr. Yong Yue for his help in the development of the
RepeatFetcher program, Changhong Tang for sharing her expertise in the processing of
large sequence datasets and Dr. Sun Kim and Arvind Gopu for running the large
sequence sets through BAG program at IU, Bloomington.
It gives me immense pleasure in acknowledging Dr. Steve Thompson, Dr. Manju
Gupta and Dr. Raghav Ram of Dow AgroSciences LLC, Indianapolis, IN, for

enthusiastically supporting my participation in educational enrichment program and the
thesis work.
I am very grateful to my wife, Srilakshmi Kumpatla, for the support and help
extended during the period without which this project would have taken much longer. I
also extend my heartfelt thanks to my mother, Sitamahalakshmi Kumpatla, for her
constant encouragement and appreciation.
This material is based upon work supported by the National Science Foundation
under Grant No. 0116050. This research was supported in part by the Indiana Genomics
Initiative (INGEN). The Indiana Genomics Initiative (INGEN) of Indiana University is
supported in part by Lilly Endowment Inc.
I would like to sincerely thank Dow AgroSciences LLC educational enrichment
program for funding most of my MS program and for providing computational resources.
Abstract
DNA markers have revolutionized the field of genetics by increasing the pace of genetic
analysis. Simple sequence repeats (SSRs) are repetitions of nucleotide motifs of 1 to 5
bases and are currently the markers of choice in many plant and animal genomes due to
their abundant distribution in the genomes, hypervariable nature and suitability for high-
throughput analysis. While SSRs, once developed, are extremely valuable, their
development is time consuming, laborious and expensive. Sequences from many
genomes are continuously made freely available in the public databases and mining of
these sources using computational approaches permits rapid and economical marker
development. Expressed sequence tags (ESTs) are ideal candidates for mining SSRs not
only because of their availability in large numbers but also due to the fact that they
represent expressed genes. Large scale SSR mining efforts in plants to date focused on
monocotyledonous plants. In this project, an efficient SSR identification tool was
developed and used to mine SSRs from more than 53 dicotyledonous species. A total of
92,648 non-redundant ESTs or 6.0% of the 1.54 million dicotyledonous ESTs
investigated in this study were found to contain SSRs. The frequency of non-redundant-
ESTs containing SSRs among the species investigated ranged from 2.65% to 16.82%.
More than 80% of the non-redundant ESTs having SSRs contained a single SSR repeat
while others contained 2 or more SSRs. An extensive analysis of the occurrence and
frequencies of various SSR types revealed that the A/T mononucleotide, AG/GA/CT/TC
dinucleotide, AAG/AGA/GAA/CTT/TTC/TCT trinucleotide and TTTA and TTAA
tetranucleotide repeats are the most abundant in dicotyledonous species. In addition, an
analysis of the number of repeats across species revealed that majority of the
mononucleotide SSRs contained 15-25 repeats while majority of the di- and tri-
nucleotide SSRs contained 5-10 repeats. By providing valuable information on the
abundance of SSRs in ESTs of a large number of dicotyledonous species, this study
demonstrates the potential of computational mining approach for rapid discovery of SSRs
towards the development of markers for genetic analysis and related applications.
T A B L E O F C O N T E N T S LIST OF TABLES
xi
LIST OF FIGURES
xii
I. Introduction
1
A. Molecular marker technology and simple sequence repeats (SSRs)
1
B. Importance of the subject
3
C. Knowledge gap and contribution of the project
4
II. Sequence data sources and Methods
7
A. Sequence data sources
7
B. SSR mining with RepeatFetcher
7
C. Trimming poly A and poly T ends of ESTs
8
D. EST clustering and analysis
8

E. Compositional analysis of SSR mining results
10
III. Development of a tool for SSR identification
11
A. Background
11
B. Review of existing SSR finding tools
12
C. Development of RepeatFetcher program
15
IV. Mining of SSRs from EST sequences of dicotyledonous plants
17
A. ESTs and target dicotyledonous species for the project
17
B. Mining of SSRs using RepeatFetcher
20
C. Clustering and identification of non-redundant ESTs
26
V. Analysis of occurrence and frequency of different SSR motifs
31
A. Single vs. Multiple SSR stretches
31

B. Distribution of repeat length classes in ESTs
33
C. Relative frequencies of different SSR repeat types
34
D. Relative frequencies of different SSR repeat length classes
41
VI. Conclusion and biological implications of the findings
45
A. Overview of significant results
45
B. Findings in context of current knowledge
48
C. Biological implications and practical applications of the findings
50
VII. Discussion and future work
54
A. Overview of the study
54
B. Recommendations for future work
54
References
56

L I S T O F T A B L E S
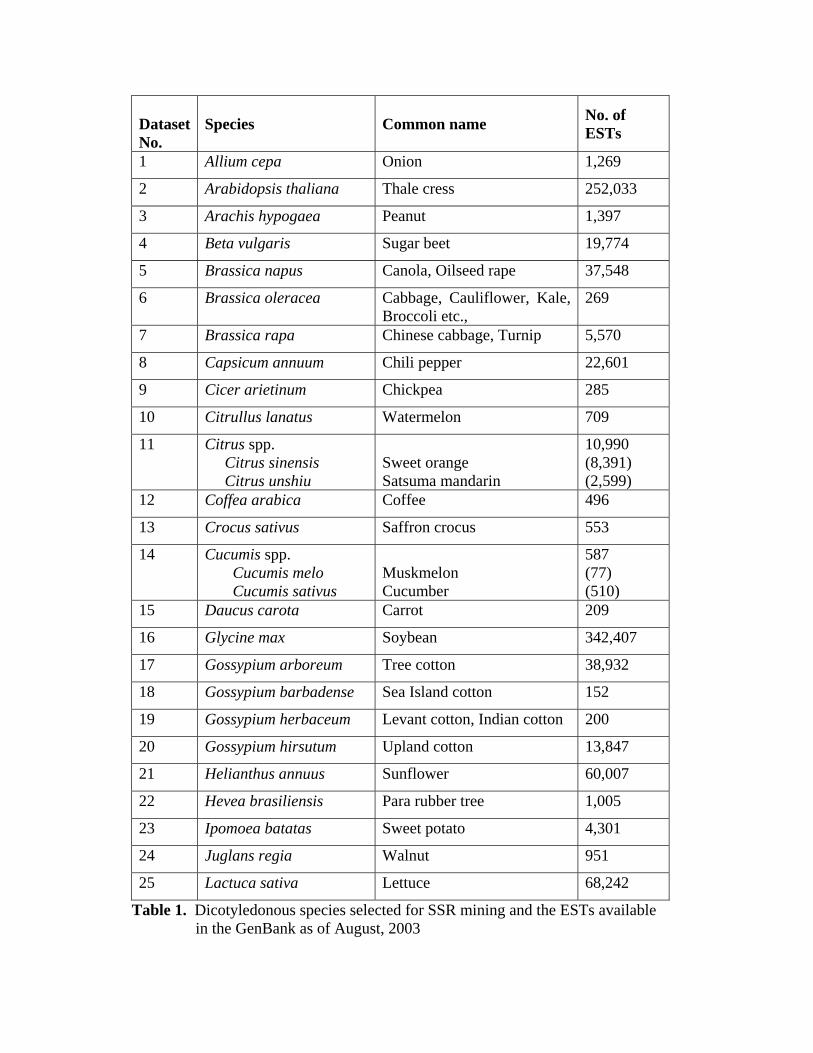
Table 1. Dicotyledonous species selected for SSR mining and the ESTs
available in the GenBank as of August, 2003 18
Table 2. Microsatellite-containing ESTs identified using RepeatFetcher
21
Table 3. Clustering results of microsatellite-containing ESTs
24
Table 4. Non-redundant (NR) ESTs containing SSRs 27

L I S T O F F I G U R E S
Figure 1. Output from RepeatFetcher showing the results obtained using a
test sequence file in FASTA format 16
Figure 2. ESTs containing single or multiple stretches of SSR repeats
32
Figure 3. Frequency of mono-, di-, tri- and tetra-nucleotide SSRs in ESTs
containing a single SSR.
34
Figure 4. Frequency of mononucleotide SSRs in ESTs of dicotyledonous
plants
36
Figure 5. Frequencies of dinucleotide SSRs in ESTs of dicotyledonous

plants
37
Figure 6. Frequencies of trinucleotide SSRs in ESTs of dicotyledonous
plants (Set 1)
38
Figure 7. Frequencies of trinucleotide SSRs in ESTs of dicotyledonous
plants (Set 2)
39
Figure 8. Predominant tetranucleotide SSRs in ESTs of dicotyledonous
plants
40
Figure 9. Distribution of mononucleotide SSRs into different repeat
length classes
42
Figure 10. Distribution of dinucleotide SSRs into different repeat
length classes
43
Figure 11. Distribution of trinucleotide SSRs into different repeat
length classes
44

I. Introduction
The advent of DNA marker technology has revolutionized the field of genetics (Cullis,
2002; Dodgson et al., 1997; Rafalski and Tingey, 1993). Although phenotypic or
morphological markers and later isozyme (protein) markers have dominated the field of
classical genetics for more than a century, the introduction of DNA-based markers during
the second half of 20th century changed the pace and precision of genetic analysis
(Dodgson et al., 1997). During the last two decades DNA-based markers have led to the
construction of whole genome linkage maps in many plant and animal genomes, a crucial
step for several downstream applications such as gene cloning, genome analysis and
marker-assisted selection of agricultural crops (Cullis, 2002; Dodgson et al., 1997;
Paterson, 1996a). DNA markers are also being increasingly used in genetic diagnostics,
population studies, comparative genomics, pharmacogenomics, drug discovery and
molecular evolution studies (Bennetzen, 2000; McCarthy and Hilfiker, 2000; Pfost et al.,
2000; Rafalski and Tingey, 1993; Terauchi and Konuma, 1994).
A. Molecular marker technology and simple sequence repeats (SSRs)
While the earliest DNA markers, restriction fragment length polymorphism (RFLP)
markers, have proved to be very useful, their development and utilization is laborious,
time-consuming, expensive and not suitable for high-throughput automation (Paterson,
1996b; Rafalski and Tingey, 1993). For these reasons, PCR-based markers such as
random amplified polymorphic DNA (RAPD), amplified fragment length polymorphism
(AFLP), simple sequence repeats (SSRs) etc., have become popular for molecular genetic
studies (Paterson, 1996b). Out of the PCR-based markers, SSR markers quickly became
the markers of choice for plant and animal genomes during the last decade because of the
small sample size (genomic DNA) requirement for their analysis and their suitability for
automation and high-throughput (Hearne et al., 1992). SSRs, also called microsatellites
or short tandem repeats (STRs), are in general repetitions of nucleotide motifs of 1 to 5
bases (Powell et al., 1996). Two major features that made SSRs very popular are their
abundant distribution in the genomes examined to date and their hypervariable nature
(Powell et al., 1996; Tautz and Renz, 1984; Toth et al., 2000). For example, Cardle et
al., (2000) have reported that SSRs occur as abundantly as once in approximately every 6
kb in plant genomes. The term ‘hypervariable’ refers to the property where the number
of repeats in an SSR stretch differs from individual to individual or genotype to genotype
thus making them extremely useful as genetic markers. While di-, tri- or tetra-nucleotide
SSRs are most commonly used for the construction of linkage maps of nuclear genomes,
single nucleotide repeats have been used in the population genetic analyses of chloroplast
genomes (Powell et al., 1995). Since SSRs can be assayed using PCR technology, they
can be screened using high-throughput platforms for molecular genetic linkage
(Morgante and Olivieri, 1993) and population (Powell et al., 1995) studies. In humans,
triplet repeat SSRs are known to be associated with more than fourteen inherited
neurodegenerative diseases and SSR typing is being used as a diagnostic measure in these
cases (Bryant-Greenwood, 2002; Sinden et al., 2002).
Another area where SSR markers are extremely valuable and are increasingly
becoming popular is comparative genomics where SSR markers developed from one
species could be utilized in a related or heterologous species towards genetic mapping,
characterization, gene cloning, diversity and evolutionary studies (Cordeiro et al., 2001;
Eujayl et al., 2001; Killian et al., 1997; Moore et al., 1991; Peakall et al., 1998; Rallo et

al., 2003; Westman and Kresovich, 1998). This approach gained momentum in plant
genomics during the recent years based on the observation that despite a wide range in
genome sizes, plants were found to exhibit extensive conservation of both gene content
and gene order (Bennetzen and Freeling, 1993). Comparative genetic analyses have
begun to show that different plant species often use homologous genes for very similar
functions (Ahn et al., 1993; Bennetzen and Freeling, 1997).
B. Importance of the subject
Bioinformatics approaches are increasingly being used for molecular marker
development since the sequences from many genomes are made freely available in the
public databases (Gu et al., 1998; Kantety et al., 2002; Varshney et al., 2002). These
sources could be mined for SSRs using computational tools thereby eliminating the need
for costly library construction and screening required for obtaining sequence information.
This not only reduces marker development costs but also permits development of a large
number of markers in a short span of time. Additionally, bioinformatics tools also
supplement existing approaches by automating the task of SSR identification from
available DNA sequences. One source of sequences for marker development are
expressed sequence tags (ESTs) that are obtained by sequencing 5' and/or 3' ends of a
complementary DNA (cDNA) molecule synthesized from a messenger RNA (mRNA).
ESTs are particularly attractive for marker development since they represent coding
regions of the genome and are also being developed at an extremely faster pace for many
genomes (Gu et al., 1998; Kantety et al., 2002; Picoult-Newberg et al., 1999). Moreover,
recent studies have observed that the frequency of microsatellites was significantly higher

in ESTs than in genomic DNA in several plant species investigated (Morgante et al.,
2002; Toth et al., 2000).
Most of the efforts to date for finding SSRs in EST sequences of plants focused on
monocotyledonous crops (Kantety et al., 2002; Thiel et al., 2003; Varshney et al., 2002).
Also, efforts in the identification of transferable SSRs for comparative genetic studies in
dicotyledonous species (dicots) were limited to a few studies where portability of SSRs
was assessed between closely related species or genera (Decroocq et al., 2003; Peakall et
al., 1998; Whitton et al., 1997; Yamamoto et al., 2001). Dicots comprise many
economically important plants such as soybean, cotton, sunflower, tomato, potato,
brassicas, beans etc., as well as the model plant for plant genomics, Arabidopsis thaliana.
The discovery of SSRs from the ESTs of a large number of dicot species and information
on the occurrence and frequency of different SSR categories is extremely valuable not
only for the development of SSR markers in different species but also for understanding
the abundance SSRs in dicots. Moreover, SSRs derived from ESTs essentially represent
expressed genic sequences and hence are potential candidates for markers for
comparative genomic studies.
C. Knowledge gap and contribution of the project
The most important requirement for the computational mining of SSRs is an efficient tool
to accomplish the task. Although several public domain tools are available, as described
in section III, they have one or more drawbacks because of which not all SSRs could be
mined efficiently. For example, several existing programs do not identify sequences
containing single nucleotide SSRs that are very useful for chloroplast genome analyses as
well as for some crucial regions of nuclear genomes that do not contain di-, tri- or tetra-
nucleotide repeats. Moreover, users of several of these tools have to spend a considerable
amount of time in interpreting and organizing results. For some relatively efficient tools,
the web interfaces are not available until a long time following their development and/or
publication. Thus, there is a need for a simple, efficient and high-throughput SSR
identification tool. Such a tool can quickly discover SSRs in previously unfathomed EST
sequences in several dicot species or improve the SSR identification efficiency in other
dicot species for which some work exists.
As mentioned in the previous section, although dicotyledons comprise many
important crop species, large scale studies on SSR identification and survey in EST
sequences are currently not available. SSR markers derived from ESTs could be used for
standard genetic analysis and applications while some of them could even be used for
cross-taxa or cross-specific comparative studies. However, efforts to date for
identification of markers for comparative studies were limited to cereal or monocot
species (Kantey et al., 2002; Varshney et al., 2002). This is due to the fact that a number
of cereals were known to have remarkable micro-colinearities i.e., homology of DNA
segments across different genomes (Bennetzen and Freeling, 1997; Bennetzen, 2000).
Although a few reports of such studies exist in dicots, they are limited to comparisons of
closely related species but not across different dicot plants (Decroocq et al., 2003;
Yamamoto et al., 2001). Thus, there is a need for mining and survey of SSRs in a large
number of dicotyledonous species.
The major contribution of this project is threefold: (i) developing an efficient tool for
mining SSRs from large sequence datasets; (ii) mining of SSRs from ESTs of a large
number of dicotyledonous genomes using the developed tool and surveying the

occurrence and frequencies of various SSRs and (iii) identifying non-redundant EST
sequences containing SSRs for marker development and other molecular genetic
analyses.
II. Sequence data sources and Methods
A. Sequence data sources
EST sequences for all of the plants investigated in this project have been downloaded
from GenBank at NCBI website (http://www.ncbi.nlm.nih.gov). Initially, a total of 53
dicotyledonous species were selected where the number of ESTs available per species
ranged from 49 to 342,407 as of August 2003. In addition, two groups of sequences
representing (i) additional Rosa species and hybrids and (ii) additional Vicia species were
also selected to have more ESTs from these genera. As shown in Table 1 (Section IV),
sequences of these selected species and groups have been grouped into a total of 49
dicotyledonous species sequence datasets for the purpose of the project. Five of these 49
sequence sets (Citrus spp., Cucumis spp., Rosa spp., Vicia spp., and Vigna spp.) represent
groups that were generated by combining ESTs from two or more species belonging to
the respective genera. Batch files of EST sequences for these species were downloaded
from GenBank in FASTA format. It must be noted that for some of the genes, full-
length cDNA sequences are available as opposed to ESTs. In those cases, entire cDNAs
are utilized for mining purpose. Thus, for a given species, all entries in the GenBank that
belong to EST or cDNA categories are included in the datasets.
B. SSR mining with RepeatFetcher
RepeatFetcher tool, the development of which is described in section III, has been used
for the identification SSRs in EST sequences. This is a command line program and has
been run on Phoenix server (phoenix.cs.iupui.edu) of IUPUI computer science
department. Four classes of SSRs were targeted for identification using this program:
mono-, di-, tri-, and tetra-nucleotide repeats. The default settings used in the program for
minimum number of repeats is 15 for mononucleotides and 5 for di-, tri-, or tetra-
nucleotides. In addition, the program also identifies interrupted repeats with a maximum
interruption (spacer) of 7 base pairs. Batch files of the target species were exported to
Phoenix server using an FTP protocol and were run through RepeatFetcher by passing the
sequence file as input to the program at the command prompt. The output files from a
given session were transferred to desktop using FTP protocol and were opened using
Notepad or Wordpad programs for visualizing the results.
C. Trimming of poly A and poly T ends of ESTs
TRIMEST program of EMBOSS (http://ngfnblast.gbf.de/uk/emboss.html) has been used
for removing the poly A / poly T ends of the EST sequences prior to running the
sequence sets through RepeatFetcher so that they are not retrieved by the program as
mononucleotide repeats. This is a publicly available free software tool and the interface
available at http://ngfnblast.gbf.de/cgi-bin/emboss.pl?_action=input&_app=trimest has
been used for this purpose. Batch sequences were loaded to the program using the
‘Browse’ option of the interface and the program was run using the following settings
that were found to give optimal performance based on trial runs on several sequences:
Minimum length of a poly-A tail (integer): 4
Number of contiguous mismatches allowed in a tail (integer): 4
Write the reverse complement when poly-T is removed? Yes
Remove poly-T tails at the 5’ end of the sequence? Yes
D. EST clustering and analysis
SSR-containing EST sequences identified after using trimmed sequences were clustered

by using Sequencher (Gene Codes Corporation, Ann Arbor, Michigan) or BAG program
(at computing facility of IU, Bloomington) to eliminate redundancies. Contigs for 45
sequence sets were assembled using Sequencher, whereas the 4 large sequence datasets
(Arabidopsis thaliana, Glycine max, Lycopersicon esculentum and Medicago truncatula)
were clustered on a computer cluster at IU, Bloomington using BAG software developed
by Dr. Sun Kim (Kim, 2003) using cut-off scores of 200, 300 and 400. For Sequencher
contig assembly, the rigorous data algorithm option was chosen with the settings of
minimum match percentage of 85 and a minimum overlap of 20 bases. In order to further
correlate the BAG results with those of Sequencher that has been used for majority of the
datasets (45 out of 49), the ESTs that were assembled into clusters by BAG program were
run again on Sequencher. BAG results obtained with 400 cut-off score are in close
agreement with Sequencher as judged by the minimum number of sequences left over as
singletons by Sequencher. Clusters from all of the species were manually inspected,
evaluated and redundancies were removed using the following criteria:
(i) If a contig has 2 or more identical sequences, longest EST sequence was retained
(ii) If the overlaps are just due to stretches of homopolymers i.e., poly A/T/C/G or SSRs,
those contigs were not considered valid and all members were retained as unique
(iii) If the members of a contig were similar and of varying lengths, one representative
member of each of the variant group has been retained such that the total possible contig
length is retained through the selected members
(iv) Contigs generated due to overlap of ambiguous bases were not considered and the
sequences with large stretches of ambiguous bases were discarded

(v) ESTs that contained short homopolymer stretches or SSRs as the only sequences were
discarded
E. Compositional analysis of SSR mining results
The analysis of occurrence and frequency of SSRs among the 49 species was carried out
by exporting the RepeatFetcher results to Microsoft Excel spreadsheets. Results on repeat
types, number of repeats and frequency were first collected for each of the species by
using a combination of sorting and counting functions and the results across all species
were tabulated and significant results and observations were charted.

III. Development of a tool for SSR identification
A. Background
While SSRs, once developed, are very useful markers, their development is expensive
since it requires prior knowledge of sequence information. The initial step in the
development of SSR markers is the identification of sequences containing such repeats
from the genomic sequences. This will be followed by the design of PCR primers
flanking the SSR repeat stretch. There are two approaches for the identification of SSR
containing sequences: 1) Molecular and 2) Computational. The molecular approach for
the development of SSRs is to construct genomic libraries (with or without enrichment
for SSRs), screen the libraries, sequence candidate clones and identify SSR motifs either
manually or using computer programs. The computational or bioinformatics approaches
take advantage of the available sequences such as those in the public databases and by
scanning through them, they identify the ones that contain SSRs. They also supplement
the molecular approaches by identifying SSR repeats in candidate sequences derived
from the libraries.
Based on the nature of the algorithms used, the computational approaches for the
identification of SSRs could be broadly divided into 1) Model-based approaches and 2)
Dictionary approaches. In model-based approaches, a model is defined for a repeat and
then used on the sequences to locate regions satisfying the definition. This approach
provides a comprehensive list of repeats, either exact or degenerate, and does not require
prior knowledge of the type of repeat motifs for its implementation. The programs such
as Tandem Repeat Finder (Benson, 1999) and Sputnik (Abajian, 1994) belong to model-
based approach. The dictionary approach provides a faster and more scalable solution to

the problem of repeat identification when the repeat sequence motifs are known a priori.
In this method, the program uses a dictionary of known motifs and scans the input
sequence for the entries in the dictionary.
B. Review of existing SSR-finding tools
A high-throughput tool that can efficiently identify all SSR types and provides a simple
and user-friendly output is a crucial prerequisite for this study. Before initiating the
development of a program for SSR identification for this project, a survey and evaluation
of existing SSR-finding tools has been conducted to see if any one of them serves the
purpose of high throughput identification of SSR-containing sequences. The following
criteria have been set as the ideal features for a desired SSR-identification program:
• Ability to identify mono-, di-, tri- and tetra-nucleotide repeats
• Ability to identify a compound repeat, i.e., a combination of two or more types of
repeat motifs
• Ability to identify a large number of SSR types and locations in the target sequence
• Ability to identify repeats that are interrupted by a spacer sequence
• Ability to handle and process large batch files of thousands of sequences for SSR
identification i.e., high throughput
• Ability to identify repeats in large input sequences that are of the order of several
thousand or hundreds of thousands of base pairs (not for ESTs but for genomic
sequences and large clones)
• Output should contain sequence ID, type, number and location of the repeats
Following is the assessment of dedicated or general-purpose SSR-finding tools for which
web interfaces were available at the time of the survey.
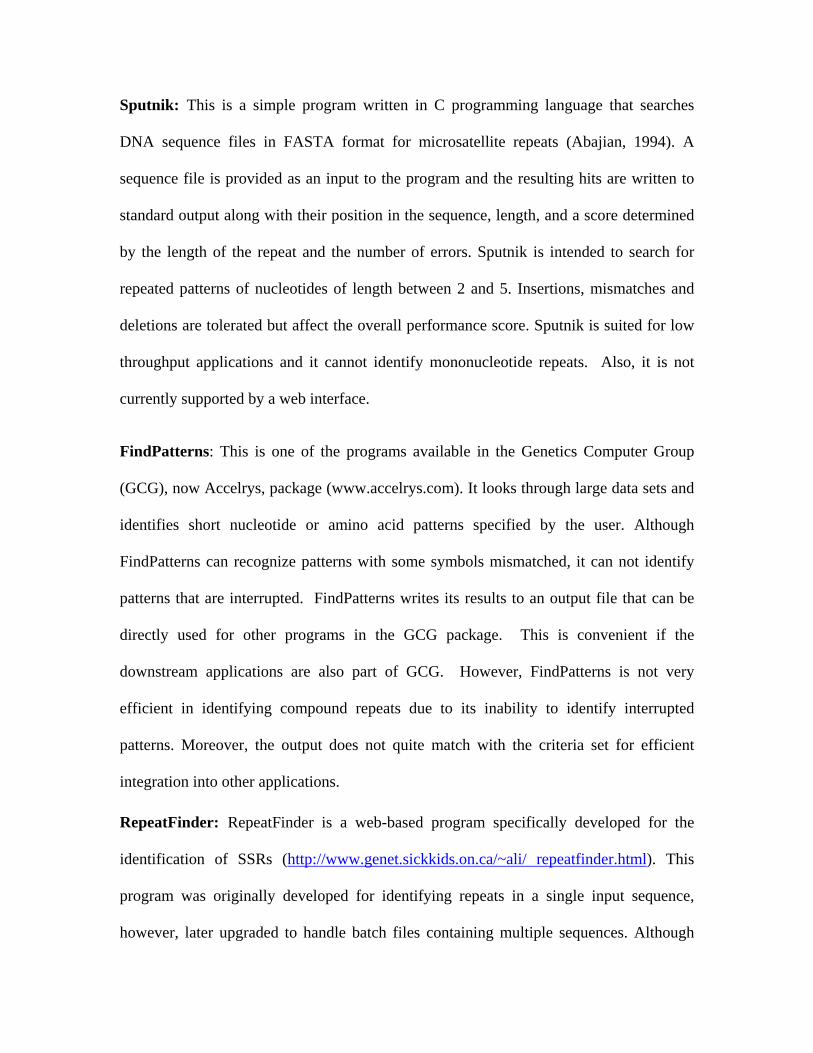
Sputnik: This is a simple program written in C programming language that searches
DNA sequence files in FASTA format for microsatellite repeats (Abajian, 1994). A
sequence file is provided as an input to the program and the resulting hits are written to
standard output along with their position in the sequence, length, and a score determined
by the length of the repeat and the number of errors. Sputnik is intended to search for
repeated patterns of nucleotides of length between 2 and 5. Insertions, mismatches and
deletions are tolerated but affect the overall performance score. Sputnik is suited for low
throughput applications and it cannot identify mononucleotide repeats. Also, it is not
currently supported by a web interface.
FindPatterns: This is one of the programs available in the Genetics Computer Group
(GCG), now Accelrys, package (www.accelrys.com). It looks through large data sets and
identifies short nucleotide or amino acid patterns specified by the user. Although
FindPatterns can recognize patterns with some symbols mismatched, it can not identify
patterns that are interrupted. FindPatterns writes its results to an output file that can be
directly used for other programs in the GCG package. This is convenient if the
downstream applications are also part of GCG. However, FindPatterns is not very
efficient in identifying compound repeats due to its inability to identify interrupted
patterns. Moreover, the output does not quite match with the criteria set for efficient
integration into other applications.
RepeatFinder: RepeatFinder is a web-based program specifically developed for the
identification of SSRs (http://www.genet.sickkids.on.ca/~ali/ repeatfinder.html). This
program was originally developed for identifying repeats in a single input sequence,
however, later upgraded to handle batch files containing multiple sequences. Although

RepeatFinder is a good program for identifying SSRs from small to medium throughput
datasets, currently it has the following limitations: (i) cannot identify single nucleotide
repeats; (ii) slower performance with large batch files (iii) speed of the program reduces
significantly for sequences larger than 3 kb; (iv) output is a single long concatenated
sequence that makes the identification of individual sequences time consuming.
SSRIT (Simple Sequence Repeats Identification Tool): SSRIT is a simple program
available through Gramene / Genome databases portal at Cornell University
(http://brie2.cshl.org:8082/gramene/searches/ssrtool). The program as available is good
for the identification of “perfect” simple sequence repeats and can handle moderate-sized
datasets. Although the output does contain sequence ID, motif (repeat) type, no. of
repeats, SSR start and end, it does have the following limitations against criteria: (i) the
program currently is not capable of detecting mononucleotide repeats; (ii) the output is
not perfected currently due to which it requires some additional work by the user which is
especially cumbersome when dealing with medium-sized (hundreds of sequences)
datasets.
After the development of the SSR identification tool for this project, interfaces for
two new SSR identification tools were made available on the web: Tandem repeats finder
or TRF (Benson, 1999) and Tandem repeat occurrence locator or TROLL (Castelo et al.,
2002). Out of these two programs, TROLL meets several of the criteria mentioned
before. However, it still does not meet other criteria such as handling very large
sequences and processing of very large batches of sequences. Moreover, it occasionally
mis-identifies the motif due to a phenomenon called "motif shifting" wherein repeats are
counted starting from second base of the 'repeat stretch' rather than the first base. This

results in the non-identification of anticipated repeat motif type and recording of less than
expected number of repeats.
C. Development of RepeatFetcher program
As discussed above, existing SSR-identification tools surveyed have one or more
limitations with respect to the desirable features sought for an efficient and high-
throughput program for this project as well as for routine use. Hence, an attempt has been
made to develop a new program that meets the preset criteria. The result is a program,
named RepeatFetcher that has been developed using Perl scripting language. This is a
command-line program and has been run on Phoenix (Unix) platform for mining ESTs
for this study. A brief outline of the algorithm behind RepeatFetcher is provided below:
Algorithm:
• The program has been created using the pattern recognition (regular expression)
concept of Perl language
• Set the minimum number of repeats (mono-, di-, tri- and tetra-nucleotide) and
maximum spacer length allowed in the program code
• Scan the sequence file (in FASTA format) from the beginning to the end and look
for '>' sign and sequence ID headers, eliminate white spaces and specified
characters; after finishing each line eliminate \n feature using 'chomp' function
• Find repeats with (2-4)n or (1-4)n pattern: Find the sequence length, divide it by the
repeat size and move through the whole sequence by the repeat size; repeat the
process for all frames and all repeat patterns; after completing the sequence, i.e,
when the next '>' sign is encountered, repeat the process until the end of the file is
reached

• Save the sequence ID, repeat type, number of repeats and the start and end of the
repeats for all the 'hits' in an array and the ‘hits’ information in a file
In order to assess the functionality of the tool, several test files that interrogate different
criteria were created and run through RepeatFetcher. Figure 1 shows the output from
RepeatFetcher using a test file that has sequences containing one or more SSRs. As can
be seen, RepeatFetcher has identified SSRs from all of the sequences and displayed the
sequence IDs, repeat type, number and locations of each of the SSRs. RepeatFetcher has
been shown to perform well on all datasets tested to date including large sequences such
as the whole chromosome 1 sequence of yeast (230,207 bp).
Figure 1. Output from RepeatFetcher showing the results obtained using a test
sequence file in FASTA format

IV. Mining of SSRs from EST sequences of dicotyledonous plants
The standard molecular biology method for developing SSR markers is the construction
of small insert libraries followed by nucleic acid hybridization-based identification of
candidate clones and sequencing (Liu et al., 1996). While improved SSR enrichment
methods reduce marker development costs, they still require some time-consuming steps
for the development (Kumpatla et al., 2004). Computational methods to mine SSRs from
sequences freely available in public databases provide a novel alternative for rapid
development of SSR markers with minimal development costs.
A. ESTs and target dicotyledonous species for the project
ESTs provide an attractive source for mining SSRs since they are fast accumulating in
public databases due to current emphasis on functional genomics in several organisms.
ESTs are sequences that are typically a few hundred base pairs in length that are obtained
by the single-pass sequencing of the 5’ or 3’ ends of cDNA clones generated from gene
transcripts. Currently there are more than 2 million ESTs available for major
monocotyledonous species and more than 1.5 million ESTs for dicots. However, studies
on multi-species computational SSR mining in plants to date were conducted on monocot
species only. As mentioned in the introduction, dicots comprise of several economically
important crop species and SSR mining from ESTs of these species could greatly
enhance development of markers for genetic mapping, marker-assisted selection as well
as for cross-species comparative studies. This study represents the first attempt to mine
SSRs from EST sequences of a large number of dicotyledonous species using a
computational tool. A total of 53 dicotyledonous species and two groups (genera)
containing varying numbers of species have been chosen for this study (Table 1).
Dataset No.
Species Common name No. of ESTs
1 Allium cepa Onion 1,269
2 Arabidopsis thaliana Thale cress 252,033
3 Arachis hypogaea Peanut 1,397
4 Beta vulgaris Sugar beet 19,774
5 Brassica napus Canola, Oilseed rape 37,548
6 Brassica oleracea Cabbage, Cauliflower, Kale, Broccoli etc.,
269
7 Brassica rapa Chinese cabbage, Turnip 5,570
8 Capsicum annuum Chili pepper 22,601
9 Cicer arietinum Chickpea 285
10 Citrullus lanatus Watermelon 709
11 Citrus spp. Citrus sinensis Citrus unshiu
Sweet orange Satsuma mandarin
10,990 (8,391) (2,599)
12 Coffea arabica Coffee 496
13 Crocus sativus Saffron crocus 553
14 Cucumis spp. Cucumis melo Cucumis sativus
Muskmelon Cucumber
587 (77) (510)
15 Daucus carota Carrot 209
16 Glycine max Soybean 342,407
17 Gossypium arboreum Tree cotton 38,932
18 Gossypium barbadense Sea Island cotton 152
19 Gossypium herbaceum Levant cotton, Indian cotton 200
20 Gossypium hirsutum Upland cotton 13,847
21 Helianthus annuus Sunflower 60,007
22 Hevea brasiliensis Para rubber tree 1,005
23 Ipomoea batatas Sweet potato 4,301
24 Juglans regia Walnut 951
25 Lactuca sativa Lettuce 68,242
Table 1. Dicotyledonous species selected for SSR mining and the ESTs available in the GenBank as of August, 2003

Dataset No. Species Common name No. of
ESTs 26 Linum usitatissimum Flax 1,328
27 Lotus corniculatus Bird’s-foot trefoil 36,379
28 Lycopersicon esculentum Tomato 151,312
29 Lycopersicon hirsutum Wild species of tomato 2,518
30 Lycopersicon pennellii Wild species of tomato 8,361
31 Manihot esculenta Cassava 889
32 Medicago truncatula Barrel medic 187,933
33 Mentha piperita Peppermint 1,329
34 Nicotiana tabacum Tobacco 11,197
35 Phaseolus coccineus Scarlet runner bean 20,129
36 Phaseolus vulgaris French bean, Kidney bean 804
37 Pisum sativum Pea 3,713
38 Prunus armeniaca Apricot 4,685
39 Prunus dulcis Almond 3,904
40 Prunus persica Peach 10,286
41 Pyrus communis Pear 263
42 Raphanus sativus Radish 169
43 Ricinus communis Castor bean 821
44 Rosa spp. Rosa chinensis Other Rosa spp.
China rose
4,709 (1,800) (2,909)
45 Solanum tuberosum Potato 95,611
46 Spinacea oleracea Spinach 249
47 Vicia spp. Vicia faba Other Vicia spp.
Broad bean
179 (148) (31)
48 Vigna spp. Vigna unguiculata Vigna radiata Vigna angularis
Black-eyed pea, Cowpea Mung bean Adjuki bean
307 (155) (103) (49)
49 Vitis vinifera Grape 111,948
TOTAL 1,543,357
Table 1 (contd). Dicotyledonous species selected for SSR mining and the ESTs available in the GenBank as of August, 2003

As indicated in Sequence data sources and Methods section (section II), these were
grouped into 49 sequence datasets representing individual species as well as groups of
closely related species under the same genera (Table 1, column 1). The 49 species
datasets together contain a total of more than 1.5 million EST sequences.
B. Mining of SSRs using RepeatFetcher
For the initial SSR mining, sequence batch files of 49 species in FASTA format,
downloaded from GenBank at NCBI website (www.ncbi.nlm.nih.gov/Entrez/html), were
run through RepeatFetcher program. Table 2 (column 3) shows the number of SSR-
containing ESTs for all the 49 species. A total of 250,641 ESTs or 16.24% of total
available ESTs for the 49 species contained SSRs. In general, di-, tri- and tetra-
nucleotides are widely used for molecular genetics work and hence a majority of the
existing reports address the discovery of these SSRs only (Morgante and Olivieri, 1993;
Varshney et al., 2002). However, one of the goals of this study is to mine mono- (single)
nucleotide SSRs in addition to the di-, tri- and tetra-nucleotide SSRs. Since ESTs are the
target sequences for SSR mining, it must be noted that several of them still contain poly
A or poly T sequence stretches at their ends unless they are trimmed prior to their
submission to GenBank. For this reason, it is important to trim the poly A/T sequences
prior to SSR mining otherwise the As and Ts at the ends of ESTs would be identified by
the RepeatFetcher as mononucleotide repeats. The trimming step ensures that the A or T
at the ends of ESTs are not identified by RepeatFetcher as SSRs.
All of the 49 sequence batch files were subjected to trimming using TRIMEST
program of EMBOSS (www.hgmp.mrc.ac.uk/software/EMBOSS/Apps/trimest.html)
using the settings mentioned in Methods section (section II). The trimmed sequences of

No. of SSR-containing ESTs Species Total
ESTs Before trimming
After trimming
Percent of Trimmed ESTs out of total
Allium cepa 1,269 181 116 9.14%
Arabidopsis thaliana 252,033 24,911 20,230 8.03%
Arachis hypogaea 1,397 175 158 11.31%
Beta vulgaris 19,774 3,287 2,222 11.24%
Brassica napus 37,548 5,620 5,471 14.57%
Brassica oleracea 269 88 40 14.87%
Brassica rapa 5,570 719 648 11.63%
Capsicum annuum 22,601 3,844 2,186 9.67%
Cicer arietinum 285 189 28 9.82%
Citrullus lanatus 709 73 63 8.89%
Citrus spp. 10,990 3,586
1,205 10.96%
Coffea arabica 496 175 29 5.85%
Crocus sativus 553 288 38 6.87%
Cucumis spp. 587 117 61 10.39%
Daucus carota 209 72 24 11.48%
Glycine max 342,407 49,091 28,959 8.48%
Gossypium arboreum 38,932 17,222 4,991 12.82%
Gossypium barbadense 152 41 17 11.18%
Gossypium herbaceum 200 34 33 16.5%
Gossypium hirsutum 13,847 3,257 1,682 12.15%
Helianthus annuus 60,007 5,176 3,708 6.18%
Hevea brasiliensis 1,005 248 168 16.72%
Ipomoea batatas 4,301 1,443 496 11.53%
Juglans regia 951 812 89 9.36%
Lactuca sativa 68,242 7,248 7,194 10.54%
Linum usitatissimum 1,328 192 186 14.01%
Table 2. Microsatellite-containing ESTs identified using RepeatFetcher
No. of SSR-containing ESTs Species Total
ESTs Before trimming
After trimming
Percent of Trimmed ESTs out of total
Lotus corniculatus 36,379 3,746 3,370 9.26%
Lycopersicon esculentum 151,312 14,540 11,189 7.39%
Lycopersicon hirsutum 2,518 158 153 6.07%
Lycopersicon pennellii 8,361 682 661 7.91%
Manihot esculenta 889 84 36 4.05%
Medicago truncatula 187,933 35,630 25,589 13.62%
Mentha piperita 1,329 307 222 16.70%
Nicotiana tabacum 11,197 857 481 4.30%
Phaseolus coccineus 20,129 1,943 1,257 6.24%
Phaseolus vulgaris 804 318 93 11.57%
Pisum sativum 3,713 426 230 6.19%
Prunus armeniaca 4,685 4,212 245 5.23%
Prunus dulcis 3,904 1,877 1,010 25.87%
Prunus persica 10,286 1,378 1,323 12.86%
Pyrus communis 263 86 17 6.46%
Raphanus sativus 169 43 14 8.28%
Ricinus communis 821 61 42 5.12%
Rosa spp. 4,709 912 726 15.42%
Solanum tuberosum 95,611 5,807 5,373 5.62%
Spinacea oleracea 249 93 43 17.27%
Vicia spp. 179 55 16 8.94%
Vigna spp. 307 105 30 9.77%
Vitis vinifera 111,948 49,232 10,753 9.61%
TOTAL 1,543,357 250,641 142,915 9.26%
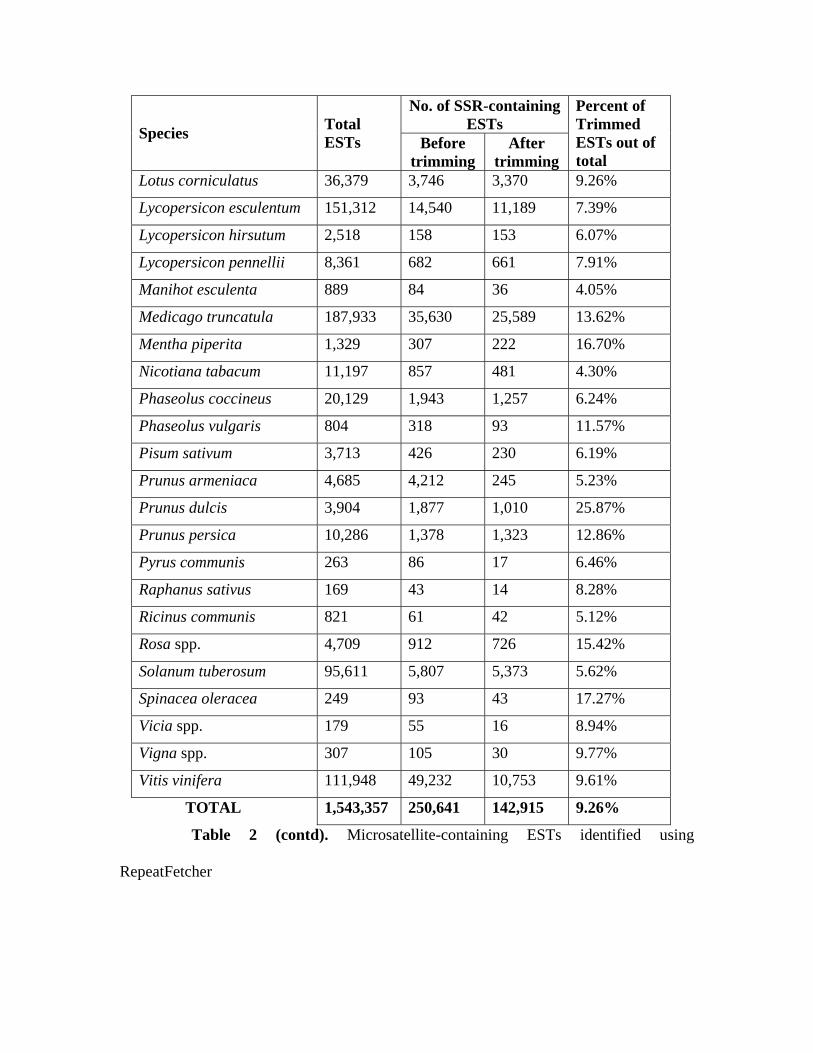
Table 2 (contd). Microsatellite-containing ESTs identified using
RepeatFetcher
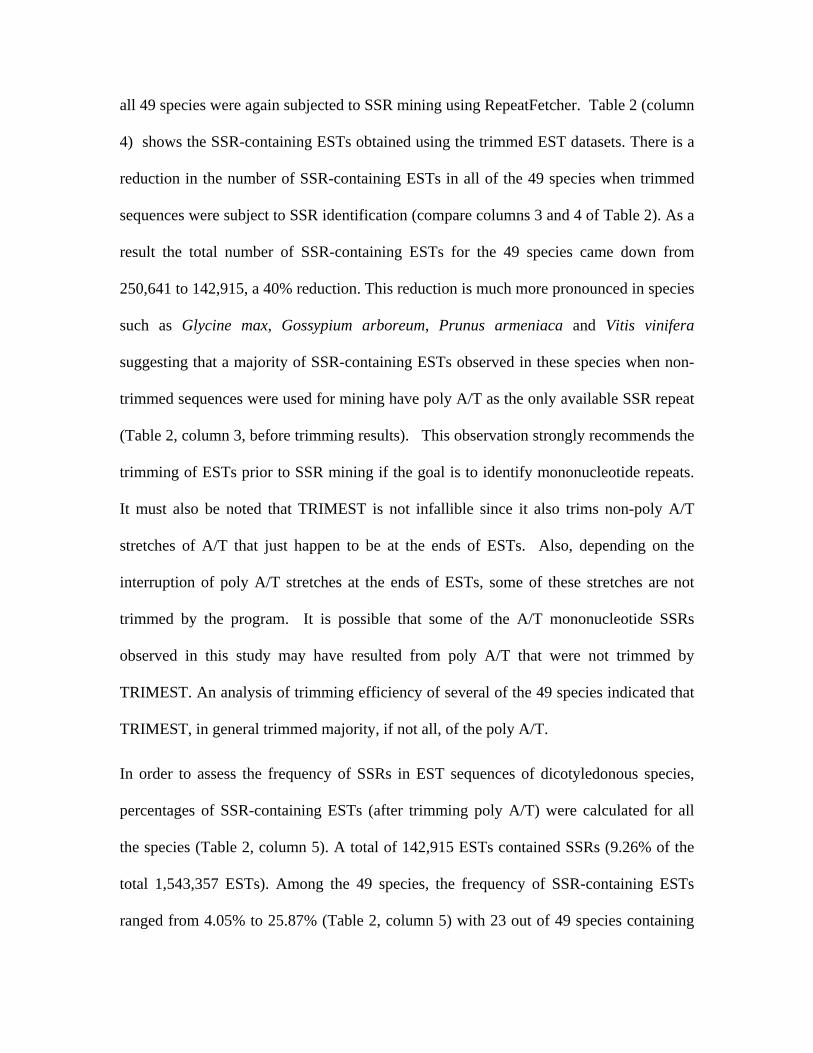
all 49 species were again subjected to SSR mining using RepeatFetcher. Table 2 (column
4) shows the SSR-containing ESTs obtained using the trimmed EST datasets. There is a
reduction in the number of SSR-containing ESTs in all of the 49 species when trimmed
sequences were subject to SSR identification (compare columns 3 and 4 of Table 2). As a
result the total number of SSR-containing ESTs for the 49 species came down from
250,641 to 142,915, a 40% reduction. This reduction is much more pronounced in species
such as Glycine max, Gossypium arboreum, Prunus armeniaca and Vitis vinifera
suggesting that a majority of SSR-containing ESTs observed in these species when non-
trimmed sequences were used for mining have poly A/T as the only available SSR repeat
(Table 2, column 3, before trimming results). This observation strongly recommends the
trimming of ESTs prior to SSR mining if the goal is to identify mononucleotide repeats.
It must also be noted that TRIMEST is not infallible since it also trims non-poly A/T
stretches of A/T that just happen to be at the ends of ESTs. Also, depending on the
interruption of poly A/T stretches at the ends of ESTs, some of these stretches are not
trimmed by the program. It is possible that some of the A/T mononucleotide SSRs
observed in this study may have resulted from poly A/T that were not trimmed by
TRIMEST. An analysis of trimming efficiency of several of the 49 species indicated that
TRIMEST, in general trimmed majority, if not all, of the poly A/T.
In order to assess the frequency of SSRs in EST sequences of dicotyledonous species,
percentages of SSR-containing ESTs (after trimming poly A/T) were calculated for all
the species (Table 2, column 5). A total of 142,915 ESTs contained SSRs (9.26% of the
total 1,543,357 ESTs). Among the 49 species, the frequency of SSR-containing ESTs
ranged from 4.05% to 25.87% (Table 2, column 5) with 23 out of 49 species containing

more than 10%. Studies on the abundance of SSRs in monocots revealed that SSRs were
present in about 7% to 10% of the total ESTs (Varshney et al., 2002).
Species ESTs subjected to clustering
No. of contigs (sequences fell into contigs)
Sequences / contig Singletons
Allium cepa 116 8(17) 2-3 99
Arabidopsis thaliana* 20,230 2,032(10,122) 2-262 10,108
Arachis hypogaea 158 29(75) 2-10 83
Beta vulgaris 2,222 438(1,172) 2-13 1,050
Brassica napus 5,471 933(4,024) 2-102 1,447
Brassica oleracea 40 7(15) 2-3 25
Brassica rapa 648 86(233) 2-11 415
Capsicum annuum 2,186 326(1,120) 2-34 1,066
Cicer arietinum 28 1(2) 2 26
Citrullus lanatus 63 10(26) 2-5 37
Citrus spp. 1,205 152(773) 2-93 432
Coffea arabica 29 2(4) 2 25
Crocus sativus 38 7(14) 2 24
Cucumis spp. 61 5(14) 2-4 47
Daucus carota 24 2(4) 2 20
Glycine max* 28,959 1,638(8,388) 2-85 20,571
Gossypium arboreum 4,991 630(2,657) 2-27 2,334
Gossypium barbadense 17 - - 17
Gossypium herbaceum 33 2(5) 2-3 28
Gossypium hirsutum 1,682 211(755) 2-12 927
Helianthus annuus 3,708 442(2,431) 2-99 1,277
Hevea brasiliensis 168 18(81) 2-19 87
Ipomoea batatas 496 57(367) 2-68 129
Juglans regia 89 11(30) 2-5 59
Lactuca sativa 7,194 1,046(5,475) 2-264 1,719

Linum usitatissimum 186 29(63) 2-4 123
Table 3. Clustering results of microsatellite-containing ESTs
Species ESTs subjected to clustering
No. of contigs (sequences fell into contigs)
Sequences / contig Singletons
Lotus corniculatus 3,370 517(2,662) 2-115 708
Lycopersicon esculentum*
11,189 712(4,147) 2-143 7,042
Lycopersicon hirsutum 153 14(45) 2-9 108
Lycopersicon pennellii 661 77(484) 2-46 177
Manihot esculenta 36 1(2) 2 34
Medicago truncatula* 25,589 1,517(7,005) 2-96 18,584
Mentha piperita 222 34(110) 2-18 112
Nicotiana tabacum 481 40(81) 2-3 400
Phaseolus coccineus 1,257 184(870) 2-36 387
Phaseolus vulgaris 93 4(8) 2 85
Pisum sativum 230 24(126) 2-40 104
Prunus armeniaca 245 30(119) 2-33 126
Prunus dulcis 1,010 58(868) 2-158 142
Prunus persica 1,323 160(1,034) 2-322 289
Pyrus communis 17 1(2) 2 15
Raphanus sativus 14 2(4) 2 10
Ricinus communis 42 8(25) 2-11 17
Rosa spp. 726 70(438) 2-213 288
Solanum tuberosum 5,373 1,247(4,472) 2-61 901
Spinacea oleracea 43 6(13) 2-3 30
Vicia spp. 16 - - 16
Vigna spp. 30 - - 30
Vitis vinifera 10,753 1,418(8,931) 2-420 1,822
*Contigs obtained from the clustering of ESTs resulted from BAG program Table 3 (contd). Clustering results of microsatellite-containing ESTs

Compared to these numbers, the observed frequencies in several of the
dicotyledonous species are much higher. Two most likely reasons for these observations
are: (i) the frequency estimates in some species may not represent the actual values due to
the availability of smaller number of ESTs and (ii) several of the ESTs in species with
high frequency of SSR-ESTs may be redundant.
C. Clustering and identification of non-redundant ESTs
In order to address the possibility of redundancy among ESTs, all of the SSR-containing
ESTs (after trimming) were subjected to clustering using
Sequencher software (www.genecodes.com) as per the settings mentioned in Methods.
Since Sequencer can not handle larger datasets (>5,000 sequences) efficiently, they were
first run through BAG clustering program (Kim, 2003) followed by a second clustering
analysis using Sequencher. Table 3 provides EST clustering results for the 49 species.
As can be seen from number of contigs obtained (column 3), contigs were obtained in all
but three species (Gossypium barbadense, Vicia spp. and Vigna spp.). Whereas about half
of the ESTs in species such as Arabidopsis thaliana, Beta vulgaris and Capsicum annuum
fell into contigs (Table 3, column 3, contigs and the number of sequences per contig),
majority of the ESTs remained as singletons (unique) in case of Glycine max, Medicago
truncatula etc. One likely reason for the presence of a large proportion of singletons in
these species is the elimination of redundancies prior to the loading of sequences in
GenBank.
The number of sequences per cluster (contig) varied widely. Species such as
Arabidopsis thaliana, Lactuca sativa, Prunus persica, Vitis vinifera recorded some large
clusters containing as many as 260 sequences per cluster. As described in Methods, all of

the clusters were manually analyzed as per preset criteria and only unique/representative
members from each cluster were retained which, together with the singletons, formed the
Species Total ESTs EST-SSRs after trimming
NR ESTs containing SSRs
Allium cepa 1,269 116 (9.14%)
109 (8.59%)
Arabidopsis thaliana 252,033 20,230 (8.03%)
12,693 (5.04%)
Arachis hypogaea 1,397 158 (11.31%)
127 (9.10%)
Beta vulgaris 19,774 2,222 (11.24%)
1,575 (7.97%)
Brassica napus 37,548 5,471 (14.57%)
2,602 (6.93%)
Brassica oleracea 269 40 (14.87%)
37 (13.75%)
Brassica rapa 5,570 648 (11.63%)
515 (9.07%)
Capsicum annuum 22,601 2,186 (9.67%)
1,508 (6.67%)
Cicer arietinum 285 28 (9.82%)
27 (9.47%)
Citrullus lanatus 709 63 (8.89%)
51 (7.19%)
Citrus spp. 10,990 1,205 (10.96%)
669 (6.09%)
Coffea arabica 496 29 (5.85%)
28 (5.64%)
Crocus sativus 553 38 (6.87%)
32 (5.79%)
Cucumis spp. 587 61 (10.39%)
53 (9.03%)
Daucus carota 209 24 (11.48%)
23 (11.00%)
Glycine max 342,407 28,959 (8.48%)
23,367 (6.82%)
Gossypium arboreum 38,932 4,991 (12.82%)
3,616 (9.29%)
Gossypium barbadense 152 17 (11.18%)
17 (11.18%)
Gossypium herbaceum 200 33 (16.5%)
30 (15.00%)

Gossypium hirsutum 13,847 1,682 (12.15%)
1,324 (9.56%)
Table 4. Non-redundant (NR) ESTs containing SSRs
Species Total ESTs EST-SSRs after trimming
NR ESTs containing SSRs
Helianthus annuus 60,007 3,708 (6.18%)
2,117 (3.53%)
Hevea brasiliensis 1,005 168 (16.72%)
108 (10.75%)
Ipomoea batatas 4,301 496 (11.53%)
213 (4.95%)
Juglans regia 951 89 (9.36%)
160 (16.82%)
Lactuca sativa 68,242 7,194 (10.54%)
3,346 (4.90%)
Linum usitatissimum 1,328 186 (14.01%)
181 (13.63%)
Lotus corniculatus 36,379 3,370 (9.26%)
1,356 (3.73%)
Lycopersicon esculentum 151,312 11,189 (7.39%)
7,143 (4.72%)
Lycopersicon hirsutum 2,518 153 (6.07)
123 (4.88%)
Lycopersicon pennellii 8,361 661 (7.91%)
440 (5.26%)
Manihot esculenta 889 36 (4.05%)
35 (3.94%)
Medicago truncatula 187,933 25,589 (13.62%)
19,962 (10.62%)
Mentha piperita 1,329 222 (16.70%)
155 (11.66%)
Nicotiana tabacum 11,197 481 (4.30%)
449 (4.01%)
Phaseolus coccineus 20,129 1,257 (6.24%)
614 (3.05%)
Phaseolus vulgaris 804 93 (11.57%)
90 (11.19%)
Pisum sativum 3,713 230 (6.19%)
139 (3.74%)
Prunus armeniaca 4,685 245 (5.23%)
178 (3.80%)
Prunus dulcis 3,904 1,010 281

(25.87%) (7.20%)
Prunus persica 10,286 1,323 (12.86%)
513 (4.99%)
Pyrus communis 263 17 (6.46%)
16 (6.08%)
Table 4 (contd). Non-redundant (NR) ESTs containing SSRs
Species Total ESTs EST-SSRs after trimming
NR ESTs containing SSRs
Raphanus sativus 169 14 (8.28%)
12 (7.10%)
Ricinus communis 821 42 (5.12%)
26 (3.17%)
Rosa spp. 4,709 726 (15.42%)
379 (8.05%)
Solanum tuberosum 95,611 5,373 (5.62%)
2,532 (2.65%)
Spinacea oleracea 249 43 (17.27%)
36 (14.46%)
Vicia spp. 179 16 (8.94%)
16 (8.94%)
Vigna spp. 307 30 (9.77%)
31 (10.10%)
Vitis vinifera 111,948 10,753 (9.61%)
3,594 (3.21%)
TOTAL 1,543,357 142,915 (9.26%)
92,648 (6.00%)
Table 4 (contd). Non-redundant (NR) ESTs containing SSRs non-redundant (NR) ESTs containing SSRs. Table 4 shows the number of SSR-
containing non-redundant ESTs obtained for each of the 49 species (column 4) in
comparison to the SSR-ESTs obtained after trimming (column 3). It is clear from the
comparison that there is a marked decrease in the number of ESTs due to the elimination
of redundancies. In particular, few hundred to few thousand sequences were eliminated
from the datasets containing >2,000 sequences. For example, Arabidopsis thaliana,
Glycine max and Medicago truncatula lost 37.3%, 19.3% and 22.0% sequences,
respectively, due to elimination of redundancies (Table 4, compare columns 3 and 4).

Examples on the higher side include species such as Lactuca sativa and Vitis vinifera that
lost 53.4% and 66.6% of the sequences, respectively, compared to SSR-ESTs obtained
after trimming (compare values from Table 4, columns 3 and 4).
The total number of non-redundant ESTs mined from all 49 species thus came to
92,648 which is 6.0% of the 1.54 million dicotyledonous ESTs investigated in this study.
The frequency of non-redundant-ESTs containing SSRs among 49 species ranged from
2.65% to 16.82%. Thirty three of the 49 species had more than 5% SSR containing NR
ESTs out of total ESTs and further breakdown of the frequency among these 33 revealed
that 12, 9 and 12 species had frequencies in the ranges of 5%-8%, 8%-10% and >10%,
respectively. It must be noted that the frequencies in species with smaller number of
available ESTs may not represent the actual scenarios.
Based on the frequencies observed in 18 species containing large number of
sequences (>10,000) (Table 4, column 4), 13 of them had frequencies in the range of
4.72% to 10.75% whereas the remaining 5 had frequencies in the range of 2.65% to
3.73%. Based on the data from these 18 species it can be concluded that the frequency of
SSRs in dicotyledonous plants ranges from 2.65% to 10.75% and that half of these
species contain SSR-containing ESTs in the frequency range of 6.09% to 10.75%. Thus,
about half of the 18 dicotyledonous species with large datasets have SSR-containing
ESTs frequencies comparable to the 7% to 10% range observed for monocots (Varshney
et al., 2002), whereas the remaining have relatively lesser frequencies. It is possible that
more ESTs would have been identified in these species with lesser frequencies if lower
stringencies had been implemented in eliminating redundancies.

V. Analysis of occurrence and frequency of different SSR motifs
Simple sequence repeats have proven to be highly abundant and uniformly distributed in
human and other mammalian genomes (Weber and May, 1989). Several studies have
demonstrated the occurrence, distribution, informativeness and Mendelian inheritance of
SSRs in plant genomes also (Wang et al., 1994 and references therein). It has also been
reported that SSRs occur as frequently as once in about 6 kb in case of plant genomes
(Cardle et al., 2000). Recent studies on several plant genomes have also demonstrated
that the frequencies of SSRs were significantly higher in ESTs than in genomic DNA
(Morgante et al., 2002). The knowledge of the occurrence and frequency of different
types of SSRs in different genomes is valuable not only for an understanding of their
distribution but also in developing SSR markers for genetic analysis and diagnostics. To
this end the frequencies of different classes and types of SSRs has been carried out for the
dicotyledonous species investigated in this study.
A. Single vs. Multiple SSR stretches
ESTs, in general, are a few hundred base pairs in length and could harbor one or more
stretches of SSRs. The utility of a given EST containing multiple SSRs could be higher
since one or more of the available SSRs could be variable thereby improving the
usefulness of that EST in developing a marker. Figure 2 (a, b) shows the frequency of
ESTs containing a single or multiple (2 or more) SSRs among the non-redundant SSR-
containing ESTs. It is clear that in all the 49 species investigated, ESTs containing a
single SSR stretch are predominant. While the frequency of single SSR-containing ESTs

range from 71.3% (Hevea brasiliensis) to 100% (Vicia spp.) majority of the species had
80% or more ESTs containing single SSRs. In species that have large number of non-
Figure 2. ESTs containing single or multiple stretches of SSR repeats
redundant SSR-containing ESTs (>10,000) such as Arabidopsis thaliana, Glycine max
and Medicago truncatula, the percent of single SSR-containing ESTs is 84.4%, 83.1%
and 87.2%, respectively. The average frequency of ESTs containing multiple SSRs
across all 49 species is about 14%. It is interesting to note that although the total number
of ESTs containing SSRs is lower in Hevea brasiliensis and Linum usitatissimum, the

number of ESTs with multiple SSRs in these species is as high as 28.7% and 26.0%,
respectively.
B. Distribution of repeat length classes in ESTs
The relative abundance of mono-, di-, tri- and tetra-nucleotide repeats in all of the 49
dicotyledonous species were determined by calculating their frequencies in NR ESTs
containing single SSR stretches. Figure 3 (a, b, c) shows these different classes of SSRs.
While the length of the bars shows the frequency of classes, the numbers inside them
indicate the actual number of sequences of that particular category. Theoretically, the
probability of finding mononucleotide repeats in a genome is higher followed by
dinucleotide repeats and then by trinucleotide repeats followed by tetranucleotide repeats.
While the results observed for ESTs in Figure 3 show this trend for some species (A.
cepa, H. brasiliensis, L. usitatissimum, P. armeniaca, C. annuum, G. arboreum, G.
hirsutum and M. truncatula), in majority of the remaining species (38 species),
dinucleotide SSRs are the most abundant followed by tri- or mononucleotide repeats. On
the other hand, trinucleotide repeats are the most abundant class of repeats in C. arabica
and L. sativa. In M. piperita, di- and tri-nucleotide repeats are observed in equal
proportions while the mononucleotide repeats are predominant class. Computational
mining and analysis of SSRs in ESTs of some cereal species revealed that trimeric
repeats are the most abundant class followed by dinucleotide repeats (Varshney et al.,
2002). Although the number of ESTs available in several of the dicotyledonous species
investigated here is small, nevertheless the general trend shows that dinucleotides are the
most abundant repeats in 38 out of the 49 species followed by mono- or tri-nucleotide

repeats. Excluding mononucleotide repeats, di- and trinucleotides are the most abundant
in ESTs in all of the species investigated.
S. tu
bero
sum
V. v
inife
ra
S. tu
bero
sum
V. v
inife
ra
Figure 3. Frequency of mono-, di-, tri- and tetra-nucleotide SSRs in ESTs containing a
single SSR.

C. Relative frequencies of different SSR repeat types
The available SSR motif combinations could be grouped into unique classes based on the
property of DNA base complementarity. For mononucleotides, although A, T, C and G
are possible, A and T could be grouped into one since an A repeat on one strand is same
as a T repeat on the opposite strand and a polyC on one strand is the same as a polyG on
the opposite strand, resulting in two unique classes of mononucleotides, A/T and C/G
(Katti et al., 2001). Similarly, all dinucleotides can be grouped into four unique classes:
(i) AT/TA; (ii) AG/GA/CT/TC; (iii) AC/CA/TG/GT and (iv) GC/CG. Thus, the number
of unique classes possible for mono-, di-, tri- and tetra-nucleotide repeats is 2, 4, 10 and
33, respectively (Katti et al., 2001; Jurka and Pethiyagoda, 1995).
The relative frequencies of repeats were calculated for 20 species (Figures 4, 5, 6 and
7) that have >1,000 non-redundant SSR-containing ESTs in order to obtain relevant
estimates. Moreover, the frequency estimates shown are based on the total number of
SSRs observed in all NR ESTs that have either single or multiple SSRs. Figure 4 shows
the frequencies of A/T and C/G repeats. It is clear that A/T repeats are the predominant
mononucleotides in all of the 20 species. It can also be seen that A/T SSRs represent
more than 40% of the total SSRs in C. annuum, G. arboreum and G. hirsutum species. It
is also interesting to note that although not abundant as A/T repeats, C/G repeats make up
as much as 15% of the total SSRs observed in G. arboreum. Relative frequencies of four
unique classes of dinucleotide repeats are shown in Figure 5. Out of the dinucleotide
repeats, AG/GA/CT/TC group is the predominant class of dinucleotide repeats in all of
the species investigated (14.6% to 54.5% of the total SSRs observed in a species) except
L. pennelli (Figure 5, b) where AT/TA repeats are present at a slightly higher frequency

(23.6%) than AG/GA/CT/TC class (21.2%). AT/TA is the second most abundant
dinucleotide repeat type in all of the species investigated excluding N. tabacum where
Figure 4. Frequency of mononucleotide SSRs in ESTs of dicotyledonous plants
AC/CA/TG/GT is the abundant class next to AG/GA/CT/TC (Figure 5, b). That
AG/GA/CT/TC is the predominant class of repeats is in concurrence with the results
observed by Varshney et al., (2002) in some cereal species. However, the second most
abundant repeat observed by Varshney et al., (2002) was AC repeat (same as
AC/CA/TG/GT group in the present study), whereas AT/TA is the second most frequent
repeat in the present study following AG/GA/CT/TC.
An analysis of the frequencies of trinucleotide repeats out of total SSRs observed
indicate the predominance of AAG/AGA/GAA/CTT/TTC/TCT repeat class in 16 out of
20 species (2.7% to 15.5% of all the SSRs available in those species) (Figures 6 and 7).
Out of the remaining 4 species, the class ACC/CCA/CAC/GGT/GTG/TGG is

predominant in two species (H. annuus and L. sativa), ATG/TGA/GAT/CAT/ATC/TCA
is the predominant class in one species (B. vulgaris) and
AGC/GCA/CAG/GCT/CTG/TGC is the most frequent class in other (Citrus) species.

Figure 5. Frequencies of dinucleotide SSRs in ESTs of dicotyledonous plants
Figure 6. Frequencies of trinucleotide SSRs in ESTs of dicotyledonous plants
(Set 1)
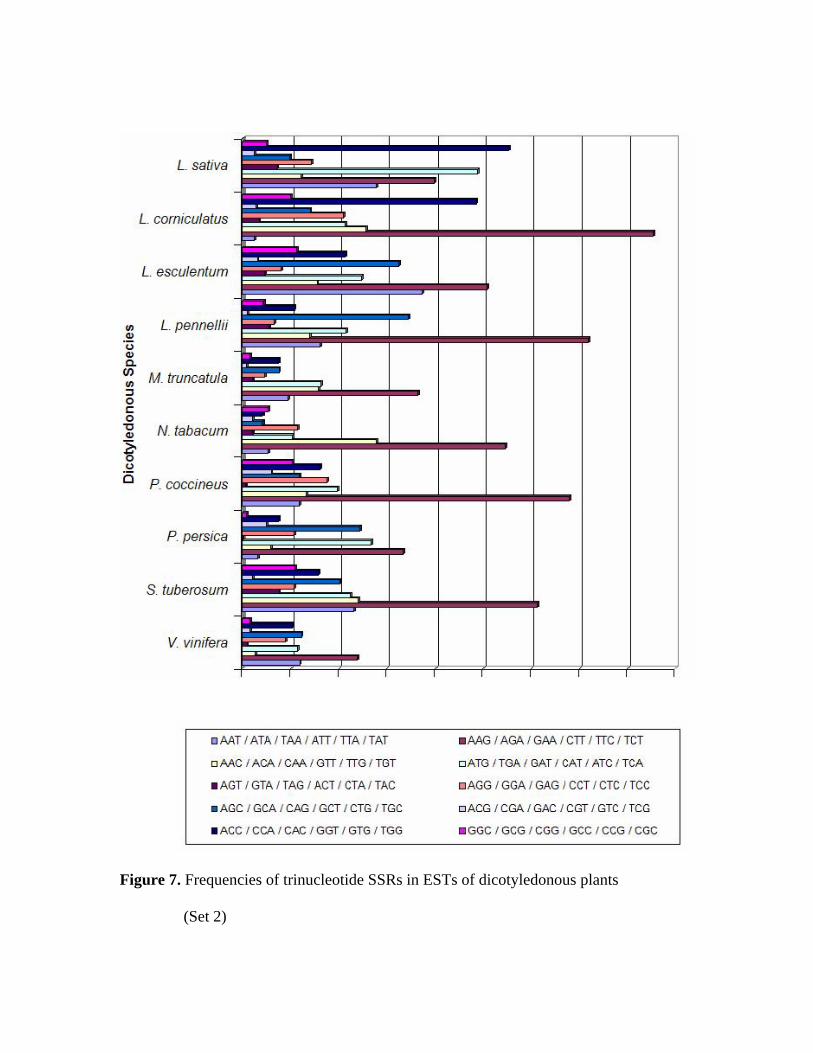
Figure 7. Frequencies of trinucleotide SSRs in ESTs of dicotyledonous plants
(Set 2)

The second most frequent repeat class is different across the 20 species. While
ATG/TGA/GAT/GAT/ATC/TCA is the second frequent repeat class in 8 species,
AAC/ACA/CAA/GTT/TTG/TGT is the second predominant in 5 species. Varshney et
al., (2002) observed that the CCG trinucleotide repeat (belongs to the
GGC/GCG/CGC/GCC/CCG/CGC class) is the most predominant SSR in cereal species.
However, this repeat is not the predominant class in any of the 20 species investigated
here for which large numbers of ESTs are available. This probably reflects the higher
G+C content of monocot species compared to dicots (Morgante et al., 2002).
As mentioned above, 33 unique classes of tetranucleotide repeats are possible.
However, only a small number of tetranucleotides were observed among the species
investigated here. The top 5 species containing the highest number of tetranucleotides
are G. max, M. truncatula, V. vinifera, L. sativa and H. annuus with 256, 233, 67, 61 and
56 repeats, respectively.
Figure 8. Predominant tetranucleotide SSRs in ESTs of dicotyledonous plants

Since the numbers are too low for frequency estimates in individual species, all of
the observed tetranucleotide repeats for 20 species were collated in order to identify the
most frequent tetranucleotide SSRs across these dicotyledons. Figure 8 shows the top 21
tetranucleotide repeats observed in these species. The TTTA and TTAA repeats seem to
be the most abundant SSRs followed by ATTA and TTTC.
Thus, the analysis of mono-, di- and tri-nucleotide repeats across 20 dicotyledonous
species shows that A/T mononucleotide repeats, AG/GA/CT/TC dinucleotides and
AAG/AGA/GAA/CTT/TTC/TCT trinucleotides are the predominant repeat types in
majority of the species. Although the number of tetranucleotide repeats observed are low,
trends show that TTTA and TTAA are found most frequently in these dicotyledonous
species compared to other tetranucleotides.
D. Relative frequencies of different SSR repeat length classes
One of the important features of SSRs that make them ideal candidates for genetic
analysis is their highly polymorphic nature, i.e., a large number of allelic variants are
possible across different genotypes (Akkaya et al., 1992; Powell et al., 1996). A
knowledge of the distribution of SSRs into different repeat length classes is useful in
assessing the abundance of potentially informative markers. It is a general experience in
molecular genetics community that the utility or informativeness of SSRs increases with
increased number of repeats in a given SSR stretch. For example, di- and tri-nucleotide
repeats with 5 or more repeats are very likely to be informative compared to 2-4 repeats.
This is the reason behind choosing 5 repeats as the minimum criteria for di- and tri-
nucleotide repeats mining using RepeatFetcher program. In order to assess the frequency
of SSRs belonging to different repeat length classes (number of repeats) in 20 species

containing large number of NR SSR-ESTs, three classes were arbitrarily chosen for
mono-, di- and tri-nucleotide repeats (see Figures 9, 10 and 11).
Figure 9. Distribution of mononucleotide SSRs into different repeat length classes
While the three classes chosen for mononucleotide SSRs are 15-25 repeats, 26-35
repeats and 36 or more repeats, the classes chosen for di- and tri-nucleotide repeats are 5-
10 repeats, 11-16 repeats and 17 or more repeats. As can be seen from Figure 9, in 19 out
of 20 species, majority of mononucleotide SSRs fall in 15-25 repeat class followed by
26-35 repeat class. In case of Vitis vinifera, the 15-25 and 26-35 classes share nearly
equal proportions of the SSRs. Although SSRs with 36 or more repeats are less frequent,
in species like Glycine max, they make up as much as 15.3% of the total mononucleotide
SSRs and are even more frequent than 26-35 repeat class (9.3%) in this species.
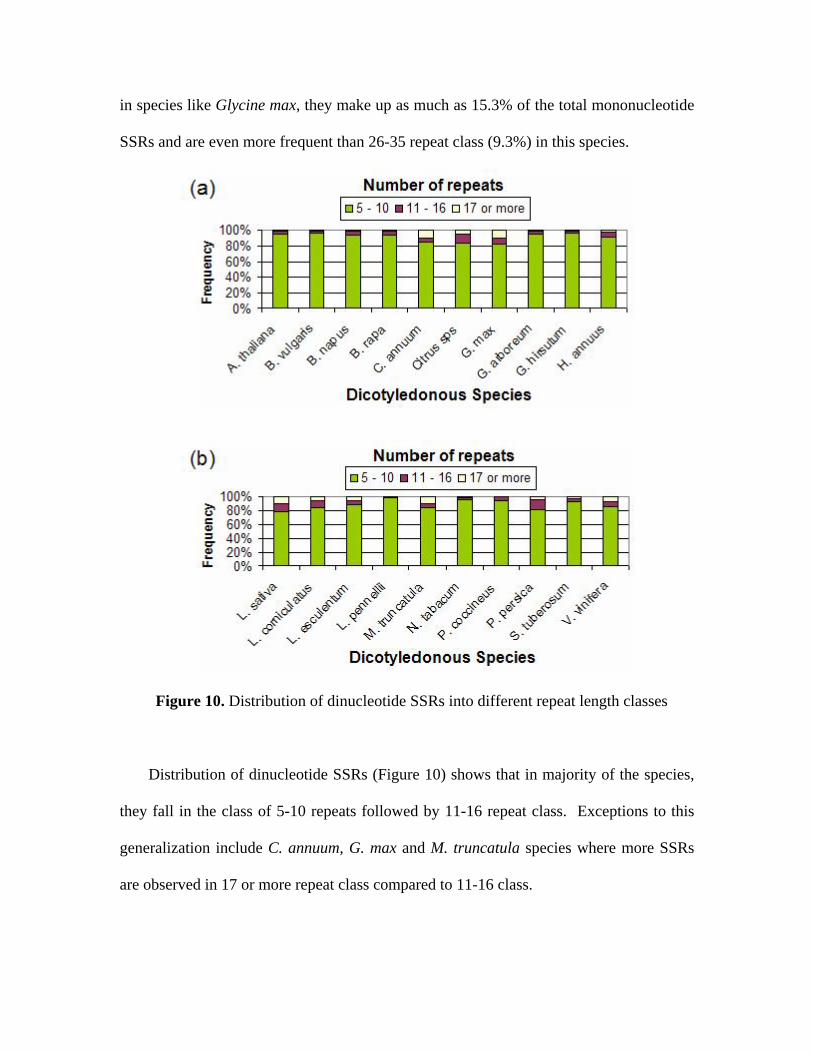
Figure 10. Distribution of dinucleotide SSRs into different repeat length classes
Distribution of dinucleotide SSRs (Figure 10) shows that in majority of the species,
they fall in the class of 5-10 repeats followed by 11-16 repeat class. Exceptions to this
generalization include C. annuum, G. max and M. truncatula species where more SSRs
are observed in 17 or more repeat class compared to 11-16 class.

With respect to the distribution of trinucleotide SSR distribution into repeat length
classes, as shown in Figure 11, the 5-10 repeat class is predominant in all of the species
investigated containing more than 99% of the SSRs in this class.
Figure 11. Distribution of trinucleotide SSRs into different repeat number classes
Thus, the distribution analysis of SSRs in non-redundant ESTs in 20 dicotyledonous
species provided here clearly indicates the abundance of mononucleotide SSRs
containing 15-25 repeats and di- and tri-nucleotide SSRs containing 5-10 repeats. This
information coupled with the frequencies of different types of mono-, di- and tri-
nucleotide motifs detailed in previous section demonstrates that ESTs are a rich source of
SSRs towards marker development for genetic analysis in dicotyledonous species.
VI. Conclusion and biological implications of the findings
The development of DNA-based genetic markers has been the driving force behind the
current revolution in animal and plant genetics (Dodgson et al., 1997). The abundance
and hypervariability associated with SSRs make them ideal candidates for the
development of markers for genetic mapping, fingerprinting, gene tagging, marker-
assisted selection and evolutionary studies (Kantety et al., 2002; Powell et al., 1996;
Rafalski and Tingey, 1993; Tautz, 1989). Computational approaches provide an
attractive alternative to conventional laboratory methods for rapid and economical
development of SSR markers by utilizing freely available sequences in public databases.
A knowledge of the occurrence and composition of SSRs across a large number of
species also helps a great deal in targeting specific SSRs for marker development.
A. Overview of significant results
The contributions of this project could be divided into three areas: (i) development of a
high-throughput tool for efficient and rapid identification of SSRs; (ii) mining of SSRs
from a large number of dicotyledonous species and demonstrating the potential of ESTs
as a source of SSRs and (iii) compositional analysis of mined SSRs to understand the
abundance and distribution of different types of SSRs in ESTs.
Since several of the existing SSR identification tools did not meet all of the
requirements of an ideal tool for this project, a program, named RepeatFetcher, was

developed. This tool has been found to be very efficient in handling large datasets
(hundreds of thousands of sequences) as well as large input sequences. A user can
directly utilize the results obtained from RepeatFetcher for downstream processes such as
designing PCR primers for target sequences towards marker development.
One of the noteworthy observations of this project in terms of SSR mining from
ESTs is that several of the ESTs in GenBank still contain polyA / polyT stretches at their
ends due to their non-processing prior to deposition in GenBank. If the goal of SSR
mining includes mononucleotide repeats also, it is essential to trim the ESTs prior to
mining; otherwise these poly A / T stretches would be retrieved as mononucleotide
repeats although in reality they are post-transcriptional additions. As detailed in section
IV, as many as 107,726 out of 250,641 ESTs contained mononucleotides A or T at ends
and thus have been eliminated from SSR-EST set by introducing a trimming step prior to
SSR mining by RepeatFetcher. Another important aspect is to remove the redundancies
in the ESTs. This step can be undertaken before subjecting the ESTs for mining or after
obtaining results from trimmed ESTs. The second approach has been taken in this
project since it considerably reduced the size of the datasets for easier handling and
analysis for downstream steps such as in-depth contig/cluster analysis and elimination of
redundancies. Obtaining a non-redundant set of SSR-containing ESTs also saves marker
development costs due to elimination of duplicates. The frequency of NR-ESTs
containing SSRs among 49 species investigated ranged from 2.65% to 16.82% of the
total ESTs available. Thirty three of the 49 species recorded frequencies of more than 5%
while 21 out of these 33 species contained 8% or more NR-ESTs containing SSRs.

An analysis of abundance of SSRs in 18 species containing large number of
sequences (>10,000) led to the conclusion that the frequency of SSRs in these
dicotyledonous plants ranges from 2.65% to 10.75% and that half of these species contain
SSR-containing ESTs in the range of 6.09% to 10.75% of total ESTs. In all of the 49
species investigated, ESTs containing a single SSR stretch are predominant (frequencies
of single SSR-containing ESTs ranged from 71.3% to 100%) with majority of the species
containing 80% or more ESTs with a single SSR stretch. Although the average frequency
of multiple SSR-containing ESTs across 49 species is about 14%, Hevea brasiliensis and
Linum usitatissimum are exceptions where the averages are 28.7% and 26.0%,
respectively.
The information on the occurrence and composition of different SSRs in a large
number of dicotyledonous species is important for understanding their abundance in
ESTs towards using them as a source for marker development and other applications. The
frequency analysis of mono-, di-, tri- and tetra-nucleotide repeats for all of the 49 species
revealed interesting and useful trends in this regard. In 38 out of 49 species, dinucleotide
SSRs are the most abundant followed by tri- or mono-nucleotide repeats. There are two
species; C. arabica and L. sativa, where trinucleotides are the most frequent class of
repeats.
The mononucleotide A/T has been found to be most abundant SSR in this category
based on the analysis of 20 species with large number of NR-ESTs. They represent as
high as 40% of total SSRs in C. annuum, G. arboreum and G. hirsutum species. An
interesting observation is that C/G repeats make up as much as 15% of the total SSRs in
G. arboreum although they are lower in abundance than A/T in that species. Relative

frequencies of dinucleotide repeats revealed that AG/GA/CT/TC group is the
predominant class of dinucleotide repeats in almost all of the species investigated (make
up 14.6% to 54.5% of the total SSRs). AT/TA is the second most abundant dinucleotide
repeat class in all species investigated with the exception of N. tabacum where
AC/CA/TG/GT is the abundant class next to AG/GA/CT/TC.
The trinucleotide repeat AAG/AGA/GAA/CTT/TTC/TCT is the most frequently
observed (16 out of 20 species investigated) comprising of 2.7% to 15.5% of the total
SSRs while ACC/CCA/CAC/GGT/GTG/TGG is predominant in two species (H. annuus
and L. sativa), ATG/TGA/GAT/GAT/ATC/TCA is the predominant class in B. vulgaris
and AGC/GCA/CAG/GCT/CTG/TGC is the most frequent class in Citrus spp. Although
the second most frequent repeat class is different across the 20 species,
ATG/TGA/GAT/GAT/ATC/TCA and AAC/ACA/CAA/GTT/TTG/TGT are second most
frequent repeat classes in 8 and 5 species, respectively. Although not many
tetranucleotides were observed relative to other repeat types, based on the analysis of
frequently observed tetranucleotide motif patterns, TTTA and TTAA repeats are the most
abundant across the species followed by ATTA and TTTC.
B. Findings in context of current knowledge
The frequency of SSR-containing NR ESTs identified among 49 dicotyledonous species
ranged from 2.65% to 16.82% with 33 species recording more than 5%. These
frequencies are higher than those observed in previous studies and strongly support recent
observations in selected plant species that SSRs are abundant in ESTs compared to
genomic sequences (Morgante et al., 2002). For example, an extensive comparison of
abundance of SSRs in genomic DNA and ESTs of three monocotyledonous species (rice,

maize and wheat) and two dicotyledonous species (Arabidopsis thaliana and soybean)
revealed that the frequency of SSRs was significantly higher in ESTs (Morgante et al.,
2002). It is possible that many more SSR-containing ESTs would have been mined and
retained in the species investigated here if lower stringencies had been implemented with
respect to RepeatFetcher criteria (minimum number of repeats) and elimination of
redundancies. The frequencies observed for 9 out of 18 species with large number of
ESTs are in the range of 6.09% to 10.75% and are comparable to the 7% to 10% range
observed for monocots where SSRs from ESTs were mined using computational
approaches (Varshney et al., 2002).
Dinucleotide repeats are found to be the most abundant SSRs (in 38 out of 49
species), followed by tri- or mono-nucleotide repeats. While two species, C. arabica and
L. sativa, have trinucleotide repeats as the most frequent class of repeats, mononucleotide
repeats are the predominant in other species. In silico mining and analysis of SSRs in
ESTs of some cereal species revealed that trinucleotide repeats are the most abundant
class followed by dinucleotide repeats (Varshney et al., 2002) and this prevalence of
trinucleotides has been attributed to the non-interruption of codons, which are triplets.
The repeat pattern AG/GA/CT/TC is found to be the most abundant of dinucleotide
repeats in the dicotyledonous species (14.6% to 54.5% of the total SSRs in a given
species) followed by AT/TA repeat. Morgante et al., (2002) and Varshney et al., (2002)
have demonstrated that AG/CT are the most frequently observed dinucleotide SSRs in
ESTs of plants and the results observed here with respect to this repeat are in strong
agreement with their findings. However, unlike the observations by Morgante et al.,
(2002) that AT repeats occur at a lower frequency, it was found that they are the second

most abundant in the dicotyledonous species investigated here. The second most
frequently observed repeat in ESTs of some cereals as reported by Varshney et al., (2002)
was AC repeat (same as AC/CA/TG/GT group in the present study), whereas AT/TA is
the second most frequent repeat in the present study. With respect to AC/CA/TG/GT
repeats, the findings of this study are in general agreement with the observations of
Morgante and Olivieri (1993) and Lagercrantz et al., (1993) who reported the scarcity of
AC/GT repeats in plants compared to mammalian genomes. However, the
dicotyledonous species N. tabacum is an exception where AC/CA/TG/GT is the second
most abundant repeat next to AG/GA/CT/TC.
The most abundant trinucleotide repeat observed in the present study is
AAG/AGA/GAA/CTT/TTC/TCT (16 out of 20 species) making up between 2.7% and
15.5% of the total SSRs mined in the species investigated. Varshney et al., (2002)
observed that the CCG trinucleotide repeat (belonging to the
GGC/GCG/CGC/GCC/CCG/CGC group) is the most predominant SSR in cereal species.
However, this repeat is not the predominant class in any of the 20 species investigated
here for which large numbers of ESTs are available. Previous studies have indicated that
trinucleotide repeats are significantly more abundant in ESTs, especially in rice
(Morgante et al., 2002). For example, the CCG/CGG repeats accounted for half of the
trinucleotide repeats in rice, whereas they were rare in the dicotyledonous plants
(Arabidopsis and soybean) and moderately abundant in monocots other than rice (maize
and wheat). The results observed here strongly support the notion of rarity of CCG/CGG
repeats in dicotyledonous plants. As hypothesized by Morgante et al., (2002), the higher

G+C content and consequent codon usage bias in monocot ESTs may largely account for
the differential occurrence of CCG/CGG in monocots and dicots.
C. Biological implications and practical applications of the findings
ESTs are ideal candidates for mining SSRs not only because of their availability in large
numbers but due to the fact that they represent expressed genes. SSR markers developed
from ESTs could be of great value in filling the existing linkage maps and in identifying
markers for cross species studies. For example, Monforte (2003) reported a higher
transferability of SSRs developed from melon ESTs between melon and cucumber
species compared to SSRs developed from genomic libraries. The use of SSRs for
comparative genomics and intra and inter-specific studies is gaining momentum in both
monocots and dicots (Eujayl et al., 2002; Rallo et al., 2003 and Westman et al., 1998)
and ESTs are ideal candidates since the expressed sequences have a higher degree of
conservation across species.
Simple sequence repeats are hypothesized to originate due to unequal crossing-over
or replication errors leading to the formation of unusual DNA secondary structures such
as hairpins or slipped strands (Pearson and Sinden, 1998; Tautz and Schlotterer, 1994).
For a long time, it has been assumed that SSRs are abundant in repetitive sequences or
non-coding fraction of the genome and that SSR densities increase with increasing
genome size in animals (The Arabidopsis Genome Initiative; Hancock, 1996). However,
a growing body of knowledge in plants is indicating that SSRs are preferentially
associated with transcribed regions of the genomes (Morgante et al., 2002). It has been
demonstrated that 3’ untranslated regions (UTRs) contain a higher SSR frequency than
the whole genome, with trinucleotide and tetranucleotide repeats contributing most to this

increase (Morgante et al., 2002). Similarly, 5’ UTRs were also shown to have about
threefold higher frequency of SSRs than any other genomic fraction due to the abundance
of dinucleotide (in particular AG/CT) and trinucleotide repeats (in particular AAG/CTT )
(Morgante et al., 2002). Based on these and other results, it has been hypothesized that (i)
coding sequences are under negative selection for all SSR types except trinucleotides
(since they do not interrupt codon usage); (ii) 5’UTRs are under very strong positive
selection; (iii) 3’ UTRs are under moderate positive selection; (iv) repetitive DNA is
under mutational (slippage) pressure that increases SSR frequency (Tautz and
Schlotterer, 1994) and (v) single-copy nontranscribed DNA sequences are at equilibrium
(Morgante et al., 2002). Since the SSRs other than trinucleotides, if expanded could be
detrimental to the coding region by interrupting codons and reading frames, it is likely
that majority of the mono-, di- and tetra-nucleotides observed in the present study are
actually located in 5’ and 3’UTRs. Even then these are useful since markers developed
from these SSRs are adjacent (linked) to functional genes.
Studies on EST-derived SSRs are also extremely important in dissecting their origin
and distribution. While previous reports emphasized the repetitive DNA-derived origin of
SSRs in animals (Nadir et al., 1996) and plants (Ramsay et al., 1999), the comprehensive
analysis of Morgante et al., (2002) in 5 species (including 2 dicots) demonstrated that
low-copy fraction of plant genomes (transcribed regions, especially UTRs) are the
sources of SSRs. If this is the case, we should observe more SSRs in non-repetitive
fraction of genomes. In a study that addressed this aspect, highest frequency of SSRs
were observed in Arabidopsis thaliana with increasingly lower frequencies in genomes
with increasing genome size (Morgante et al., 2002). This clearly indicates that SSR

frequencies are higher in more streamlined genomes compared to large genomes where
repetitive DNA makes up the bulk of a genome. With respect to the composition of SSRs,
it has been reported for Arabidopsis thaliana that AT repeats are typical of
nontranscribed regions and AG/CT are predominant in transcribed regions. Moreover, the
frequency of these SSR motifs in 5’UTRs is found to be more than an order of magnitude
higher compared to whole genome. The results observed here for dicotyledons show that
AG/CT are the most abundant dinucleotides in ESTs that represent the transcribed
regions of the genome. However, it is interesting to note that AT/TA repeats are the
second most frequent repeats in several of the dicotyledonous ESTs investigated here.
While their association with specific components of transcribed regions has not been
addressed here, it is likely that they are coming from 5’ and/or 3’ UTRs.
Practical applications: One major and direct utility of SSR mining is the development
of markers for genetic mapping and downstream applications. In order to experimentally
validate the EST-SSR approach, SSR-containing ESTs identified in cotton (Gossypium
species) were subjected to marker development. Since di-, tri- and tetra-nucleotide SSRs
are most commonly used, initial efforts were focused on these categories. In the
preliminary analysis, PCR primers could be designed for a total of 500 di-, tri- and tetra-
nucleotide SSRs (65% primer design success rate). Out of these 500, successful PCR
amplifications were achieved for 315 markers (63% success rate). These markers were
screened on a panel of 5 cotton varieties and 79 (25%) of them were found to be
polymorphic or informative and could be used for genetic mapping and other studies.
Another application is the transferability of EST-SSRs to other related species or crops.
As discussed above, SSRs are increasingly being used for cross-species applications and

the SSRs identified in this study could be used for screening on species of interest for the
identification of potential candidates for such comparative genomic studies.
VII. Discussion and Future Work
A. Overview of the study
This study demonstrates the utility of a computational approach for mining SSRs from
ever increasing sequence information in biological sciences by focusing on
dicotyledonous plants. While such approaches have been used for mammalian and
several monocotyledonous plant species, large-scale mining studies corroborating the
abundance of SSRs in ESTs of a wide range of dicotyledonous plants are lacking and this
study attempts to fill this void. There are some aspects of the study that could have been
further enhanced to improve the knowledge regarding SSRs in dicots. For example, a
comparison of SSR information derived from genomic sequences with that of EST-SSRs
and the distribution of EST-SSRs across different parts of the transcribed regions could
be very valuable. However, such an analysis is currently possible only for species such
as Arabidopsis thaliana for which complete genomic sequence information is available
and a few others for which at least some genomic coverage is achieved. Another aspect
that would extend the value of the findings of this study for comparative genomics is the
cross-species clustering of ESTs to understand the extent of homology and the frequency

of ESTs that fall into these clusters could potentially be useful for comparative mapping
studies.
B. Recommendations for future work
By mining and evaluating the composition of SSRs from a large number of
dicotyledonous species, this project has demonstrated that ESTs could be used as
potential sources for marker development. In order to effectively utilize this information
and to extend the utility of SSRs to comparative genomics and other studies, future work
should focus on both computational and molecular biology fronts. In case of
computational enhancements, it is very valuable to have a pipeline for the entire process
of SSR mining. For example, automated sequence handling, trimming and SSR mining
improves the speed of the process and when coupled with PCR primer design and SSR
information archiving, it also enhances the pace of marker development. Another
bioinformatics project that would extend the value of current project is the comparison of
genomic SSR frequencies with those of EST-SSRs in dicotyledonous plants and
distribution analysis of EST-SSRs among different transcribed regions (5’ and 3’ UTRs
and open reading frame). On the molecular biology front, one project that could be of
great value is the study of portability of EST-SSR markers for cross-species or cross-
genera amplification and their utilization in comparative mapping and related
applications.

References Abajian, C. (1994) Sputnik. http://abajian.net/sputnik/
Ahn, S., Anderson, J.A., Sorrells, M.E. and Tanksley, S.D. (1993) Homoeologous
relationships of rice, wheat and maize chromosomes. Mol. Gen. Genet. 241:483-490.
Akkaya, M.S., Bhagwat, A.A. and Cregan, P.B. (1992) Length polymorphisms of simple
sequence repeat DNA in soybean. Genetics 132:1131-1139.
Bennetzen, J.L. (2000) Comparative sequence analysis of plant nuclear genomes:
microcolinearity and its many exceptions. Plant Cell 12:1021-1029.
Bennetzen, J.L. and Freeling, M. (1993) Grasses as a single genetic system: Genome
composition, collinearity and compatibility. Trends Genet. 9:259-261.
Bennetzen, J.L. and Freeling, M. (1997) The unified grass genome: synergy in synteny.
Genome Res. 7:301-306.
Benson, G. (1999) Tandem repeats finder: a program to analyze DNA sequences. Nucleic
Acids Res. 27:573-580.
Bryant-Greenwood, P. (2002) Molecular diagnostics in obstetrics and Gynecology. Clin
Obstet Gynecol. 45:605-621.

Cardle, L., Ramsay, L., Milbourne, D., Macaulay, M., marshall, D. and Waugh, R. (2000)
Computational and experimental characterization of physically clustered simple
sequence repeats in plants. Genetics 156:847-854.
Castelo, A.T., Martins, W. and Gao, G.R. (2002) TROLL-Tandem Repeat Occurrence
Locator. Bioinformatics 18:634-636.
Cordeiro, G.M., Casu, R., McIntyre, C.L., Manners, J.M. and Henry, R.J. (2001)
Microsatellite markers from sugarcane (Saccharum spp.) ESTs cross transferable to
erianthus and sorghum. Plant Sci. 160:1115-1123.
Cullis, C.A. (2002) The use of DNA polymorphisms in genetic mapping. Genet Eng.
(N Y) 24:179-89.
Decroocq, V., Fave, M.G., Hagen, L., Bordenave, L. and Decroocq, S. (2003)
Development and transferability of apricot and grape EST microsatellite markers
across taxa. Theor. Appl. Genet. 106:912-922.
Dodgson, J.B., Cheng, H.H. and Okimoto, R. (1997) DNA marker technology: A
revolution in animal genetics. Poultry Sci. 76:1108-1114.
Eujayl, I., Sorrells, M.E., Baum, M., Wolters, P. and Powell, W. (2001) Assessment of
genotypic variation among cultivated durum wheat based on EST-SSRs and genomic
SSRs. Euphytica 119:39-43.
Eujayl, I., Sorrells, M., Baum, M., Wolters, P. and Powell, W. (2002) Isolation of EST-
derived microsatellite markers for genotyping the A and B genomes of wheat. Theor.
Appl. Genet. 104:399-407.
Gu, Z., Hillier, L. and Kwok, P-Y. (1998) Single nucleotide polymorphism hunting in
cyberspace. Hum Mutation 12:221-225.

Hancock, J.M. (1996) Simple sequences and the expanding genome. BioEssays 18:421-
425.
Hearne, C.M., Ghosh, S. and Todd, J.A. (1992). Microsatellites for linkage analysis of
genetic traits. Trends Genet. 8:288-294.
Jurka, J. and Pethiygoda, C. (1995). Simple repetitive DNA sequences from primates:
compilation and analysis. J. Mol. Evol. 40:120-126.
Kantety, R.V., La Rota, M., Matthews, D.E. and Sorrells, M.E. (2002) Data mining for
simple sequence repeats in expressed sequence tags from barley, maize, rice, sorghum
and wheat. Plant Mol. Biol. 48:501-510.
Katti, M.V., Ranjekar, P.K. and Gupta, V.S. (2001) Differential distribution of simple
sequence repeats in eukaryotic genome sequences. Mol. Biol. Evol. 18:1161-1167.
Killian, A., Chen, J., Han, F., Steffenson, B. and Kleinhofs, A. (1997) Towards map-
based cloning of the barley stem rust resistance gene Rpg1 and rpg4 using rice as a
intergenomic cloning vehicle. Plant Mol. Biol. 35:187-195.
Kim, S. (2003) Graph Theoretic Sequence Clustering Algorithms and Their Applications
to Genome Comparison. In Computationa biology and genome informatics. Wang,
J.T.L, Wu, C.H and Wang, PP (eds) Chapter 4. World Scientific publishers.
Kumpatla, S.P., Manley, M.K., Horne, E.C., Gupta, M. and Thompson, S.A. (2004) An
improved enrichment procedure to develop multiple repeat classes of cotton
microsatellite markers. Plant Mol. Biol. Reptr. 22:85a-85i.
Lagercrantz, U., Ellegren, H. and Andersson, L. (1993) The abundance of various
polymorphic microsatellite motifs differs between plants and vertebrates. Nucleic
Acids Res. 21:1111-1115.

Liu, Z.W., Biyashev, R.M and Saghai Maroof, M.A. (1996) Development of simple
sequence repeat DNA markers and their integration into a barley linkage map. Theor.
Appl. Genet. 93: 869-876.
McCarthy, J.J. and Hilfiker, R. (2000) The use of single-nucleotide polymorphism maps
in pharmacogenomics. Nat. Biotechnol. 18:505-508.
Monforte, A.J. (2003) Development and mapping of SSR markers from melon ESTs. 7th
International congress of plant molecular biology. ISPMB 2003. Barcelona, June 23-
28, 2003.
Moore, S.S., Sargeant, L.L., King, T.J., Mattick, J.S., Georges, M. and Hetzel, D.J.
(1991) The conservation of dinucleotide microsatellites among mammalian genomes
allows the use of heterologous PCR primer pairs in closely related species. Genomics
10:654-660.
Morgante, M., Hanafey, M. and Powell, W. (2002) Microsatellites are preferentially
associated with nonrepetitive DNA in plant genomes. Nature Genet. 30: 194-200.
Morgante, M. and Olivieri, A.M. (1993) PCR-amplified microsatellites as markers in
plant genetics. Plant J.3:175-182.
Nadir, E., Margalit, H., Gallily, T. and Ben-Sasson, S.A. (1996). Microsatellite spreading
in the human genome: evolutionary mechanisms and structural implications. Proc.
Natl. Acad. Sci. USA 93:6470-6475.
Paterson, A.H. (1996a) DNA Marker-Assisted crop improvement. In "Genome mapping
in plants". (Paterson, A.H. ed). R.G. Landes Co. pp. 71-79.
Paterson, A.H. (1996b) Making Genetic Maps. In "Genome mapping in plants".
(Paterson, A.H. ed). R.G. Landes Co. pp. 23-37.

Peakall, R., Gilmore, S., Keys, W., Morgante, M. and Rafalski, A. (1998) Cross-species
amplification of Soybean (Glycine max) simple sequence repeats (SSRs) within the
genus and other legume genera: implications for the transferability of SSRs in plants.
Mol. Biol. Evol. 15:1275-1287.
Pearson, C.E. and Sinden, R.R. (1998) Trinucleotide repeat DNA structures: Dynamic
mutations from dynamic DNA. Curr. Opinion in Structural Biol. 8:321-330.
Pfost, D.R., Boyce-Jacino, M.T. and Grant, D.M. (2000) A SNPshot: pharmacogenetics
and the future of drug therapy. Trends Biotechnol. 18:334-338.
Picoult-Newberg, L., Ideker, T.E., Phol, M.G., Taylor, S.L., Donaldson, M.A.,
Nickerson, D.A. and Boyce-Jacino, M. (1999) Mining SNPs from EST databases.
Genome Res. 9:167-174.
Powell, W., Morgante, M., McDevitt, R., Vendramin, G. and Rafalski, J. (1995)
Polymorphic simple sequence repeat regions in chloroplast genomes: applications to
the population genetics of pines. Proc. Natl. Acad. Sci. USA, 92:7759-7763.
Powell, W., Machray, G.C. and Provan, J. (1996) Polymorphism revealed by simple
sequence repeats. Trends Plant Sci. 1:215-222.
Rafalski, J.A. and Tingey, S.V. (1993) Genetic diagnostics in plant breeding: RAPDs,
microsatellites and machines. Trends Genet. 9:275-280.
Rallo, P., Tenzer, I., Gessler, C., Baldoni, L., Dorado, G. and Martin, A. (2003)
Transferability of olive microsatellite loci across the genus Olea. Theor. Appl. Genet.
107:940-946.
Ramsay, L., Macaulay, M., Cardle, L., Morgante, M., Ivanissevich, S-d., Maestri, E.,
Powell, W. and Waugh, R. (1999) Intimate association of microsatellite repeats with

retrotransposons and other dispersed repetitive elements in barley. Plant J. 17:415-
425.
Sinden, R.R., Potaman, V.N., Oussatcheva, E.A., Pearson, C.E., Lyubchenko, Y.L. and
Shlyakhtenko, L.S. (2002) Triplet repeat DNA structures and human genetic disease:
dynamic mutations from dynamic DNA. J. Biosci. 27:53-65.
Tautz, D. and Schlotterer, C. (1994) Simple sequences. Curr Opin Genet Dev 4:832-837.
The Arabidopsis Genome Inititative. (2000) Analysis of the genome sequence of the
flowering plant Arabidopsis thaliana. Nature 408:796-815.
Tautz, D. and Renz, M. (1984) Simple sequences are ubiquitous repetitive components of
eukaryotic genomes. Nucl Acids Res 12:4127-4138.
Tautz, D. (1989) Hypervariability of simple sequences as a general source for
polymorphic DNA markers. Nucl. Acids Res. 17:6443-6471.
Terauchi, R. and Konuma, A. (1994) Microsatellite polymorphism in Dioscorea tokoro, a
wild yam species. Genome 37:794-801.
Thiel, T., Michalek, W., Varshney, R.K. and Graner, A. (2003). Exploiting EST
databases for the development and characterization of gene-derived SSR-markers in
barley (Hordeum vulgare L.). Theor. Appl. Genet. 106:411-422.
Toth, G., Gaspari, Z. and Jurka, J. (2000) Microsatellites in different eukaryotic genomes:
survey and analysis. Genome Res. 10:967-981.
Varshney, R.K., Thiel, T., Stein, N., Langridge, P. and Graner, A. (2002) In silico
analysis on frequency and distribution of microsatellites in ESTs of some cereal
species. Cell Mol. Biol. Lett. 7:537-546.

Yamamoto, T., Kimura, T., Sawamura, Y., Kotobuki, K., Ban, Y., Hayashi, T. and
Matsuta, N. (2001) SSRs isolated from apple can identify polymorphism and genetic
diversity in pear. Theor. Appl. Genet. 102:865-870.
Wang, Z., Weber, J.L., Zhong, G. and Tanksley, S.D. (1994) Survey of plant short
tandem DNA repeats. Theor. Appl. Genet. 88:1-6.
Weber, J.L. and May, P.E. (1989) Abundant class of human DNA polymorphisms which
can be typed using the polymerase chain reaction. Am. J. Hum. Genet. 44: 388-396.
Westman, A.L. and Kresovich, S. (1998) The potential for cross-taxa simple-sequence
repeat (SSR) amplification between Arabidopsis thaliana L. and crop brassicas.
Theor. Appl. Genet. 96:272-281.
Whitton, J., Rieseberg, L.H. and Ungerer, M.C. (1997) Microsatellite loci are not
conserved across the asteraceae. Mol. Biol. Evol. 14:204-209.