situation of children and women in nepal 2006 · · 2010-06-21situation of children and women in...
TRANSCRIPT

10
S I T U AT I O N O F C H I L D R E N A N D W O M E N I N N E PAL 2 0 0 6
UN
ICE
F/N
EP
/IM
AG
E 0
1358
/ N
orik
o Iz
umi

11
B A C K G R O U N D
2
Background
C H A P T E R
Nepal is a country of tremendous naturaldiversity, stretching along the centralHimalayas. Its physical geography can bedivided into five regions that range from thesouthern terai plains at less than 100 m to thenorthern high mountains that rise to nearly8850 m (Figure 2). This enormous range ofaltitude has resulted in a variety of ecologicalzones that have had a significant impact onthe lives of local inhabitants. In times past, therugged and remote landscape isolatedpeoples into distinct communities with theirown language and cultures. However, in recentcenturies, migration has blurred thegeographic boundaries between groups tosome extent.
Nepal is one of the poorest countries in theworld and is among the 50 ‘least developedcountries’, as defined by the UN GeneralAssembly. Per capita income in 2004 wasUS$ 300 [17]. In terms of human and socialdevelopment, Nepal ranks 136 out of 177countries in the Human Development Index[18]. Nepal is riven by political, economic andsocial crisis. The combination of poverty,social exclusion and political conflictsystematically undermines the rights of thechild, particularly in rural areas. Theescalation of the conflict since 2001 has
increased and diversified vulnerabilities forchildren and women such as separation fromfamily, extended periods as household heads,poorer access to basic social services, andpossible recruitment into Maoist forces.
POLITICAL DEVELOPMENTS
Since the re-establishment of democracy in1990, Nepal has seen 10 electedadministrations and three appointed by theKing, led by six different Prime Ministers.Governments have been drawn from variousfactions of both the Nepali Congress and theUnited Marxist–Leninists. There have alsobeen coalitions of these two major parties andthe minor parties. As well as having to facethe challenges associated with trying to run adesperately poor country, all governmentssince 1996 have had to confront the Maoistinsurgency.
Politics in Nepal’s recent past have beencharacterized by a struggle for power thathas, at times, resulted in party politics beingplaced before the country’s greater needs.The process of government has beengenerally ineffectual, and overalldevelopment of the country has been

12
S I T U AT I O N O F C H I L D R E N A N D W O M E N I N N E PAL 2 0 0 6
�
���������� �������
��������
����
����
������
�������
�������
����������
����������� �����
������������� ��������
��������
������
��
������������
�����������
��� ���
! ������
�������
"������
������
���
�� �
���
������
��� ����
���
�����
����
��
����
�
�����
�������
"������
"����� ����
#�����������
$��������
"���� �
�� � ����
#��������
#������
"�� ���
������
��������
�����
�����
�����������
����
�������
"������
���� �
�� ����
������
#� ��
������
������
%����
$����������
#������ ��
�����
����� ��&�������� �
������
'������
(������
%�����
��� ���
&������
�� ���
���������
��� ��������
#�)�
������
#������
#��*
(�������
"���*
#������ �
sluggish. Economic liberalization has,however, benefited centres of commercialactivity such as the Kathmandu Valley andother urbanized areas across the country.Much of the rural population has seen littlechange, despite the ‘promises’ of electionmanifestos. Politicians, often tainted byscandal and corruption, are increasinglyviewed by the public as acquisitive andwithout a sense of duty towards the peoplethey represent. The feeling of generaldissatisfaction with politicians has becomeuniversal. In November 2004, a survey of 60districts found that more than two in fivepeople believed that political parties play amostly negative role in Nepal’s politics, andnearly three in five people felt that politicalparties would benefit from having newleadership [19].
The ineffectiveness of the body politic hasresulted in various interest groups, includingpolitical parties, unionized groups, specialinterest groups, and the Maoists, organizingfrequent demonstrations, and nationwide,regional and local strikes (bandh). Thesestrikes usually last one or two days but canbe much longer and even ‘indefinite’. These
disruptions are often general in nature;however, some have been directed atparticular sectors, with the education andtransport sectors being the worst affected. Attimes, there has also been civil unrest andrioting usually associated with a trigger eventthat is often fed by wild rumours (e.g., apopular Hindi film star allegedly said Nepalwas part of India, or the events surroundingthe ‘royal massacre’, or the abduction andkilling of 12 Nepali workers in Iraq). Theseevents have usually been followed by a periodof daily curfews until calm is restored by theauthorities.
Throughout this period, there have been anumber of important events that haveprofoundly influenced the direction of Nepalipolitics.
First and foremost, the Maoist insurgencythat began in 1996 has affected a growingnumber of political decisions since then.Today, it dominates all political thinking, andhas had a serious impact on governmentbudgetary allocations and economicdevelopment. There have been two periods ofceasefire. The first was in mid-2001. The
FIGURE 2:
Map of Nepal

13
B A C K G R O U N D
newly appointed Deuba governmentannounced a truce and initiated peace talkswith Maoists. However, these talks collapsedafter three rounds and the Maoists attacked amilitary camp in the west of the country. On26 November 2001, the government declared aState of Emergency and mobilized the RoyalNepalese Army against the Maoists. Asecond ceasefire was announced in January2003 by the Chand government, ending a 14-month period of open conflict. A code ofconduct was agreed upon by both parties,although no system for monitoring wasestablished; the media reported violations onboth sides. During the ceasefire, threerounds of peace negotiations took place butfinally broke down when the Maoistsannounced their withdrawal on 27 August2003. In addition to these two ceasefiresobserved by both parties to the conflict, on 3September 2005 the Maoists unilaterallydeclared a three-month ceasefire. Thegovernment responded by saying it did notbelieve the intention to be genuine, andrefrained from reciprocating. Reports suggestthat violence and abductions have continuedon both sides.
The massacre of the entire royal family inJune 2001 rocked the nation and plunged thecountry into a period of great instability. Onthe night of 1 June, King Birendra, QueenAishwarya and eight other members ofNepal’s royal family were murdered at afamily dinner in the Narayanhiti Royal Palace.It appears that Crown Prince Dipendra hadopened fire on his family after a dispute andthen shot himself. As he lay comatose inhospital, Dipendra was declared king.However, two days later, he was pronounceddead. Gyanendra, a younger brother of thelate King Birendra, became king and wasenthroned on 4 July. In a country where manyrevere the King as a living incarnation of thegod Vishnu, these violent deaths were asevere blow to the people.
Although Nepal is fundamentally aconstitutional monarchy, the King hasbecome increasingly active in the politics ofthe country. In May 2002, the House ofRepresentatives was dissolved by KingGyanendra upon the recommendation ofPrime Minister Deuba, with the intention that
a general election would be held within threemonths. In July 2002, the Council of Ministersdecided not to extend the tenure of electedlocal government bodies (DDCs/VDCs) uponcompletion of their five-year term. By October2002, when it became apparent that electionswould not take place, King Gyanendraappointed a new cabinet headed by PrimeMinister Chand.
Between October 2002 and February 2005,there were three Prime Ministers appointed bythe King. These governments were unable tomake any progress in tackling the Maoistinsurgency or holding general elections. Inresponse, political parties formed a loose-knitalliance to stage a series of agitations,marked by mass rallies and civil disturbance.However, on 1 February 2005, KingGyanendra dismissed Prime Minister Deuba,his third appointee, and assumed all executivepowers. A State of Emergency was declaredthat allowed for the suspension of civilliberties, censorship of the media, and thearrest of political leaders, human rightsactivists and journalists. Between 1 Februaryand 1 June, INSEC reported that 3332 politicalactivists and 82 human rights defenders hadbeen arrested (and the majority released) [22].Emergency rule was lifted on 29 April 2005,but several restrictions remain in place. Days
Governance
The World Bank has developed indicators to assess good
governance [20]. Based on these, Nepal has shown a
declining trend from 1996 to 2004 in all six aspects of
governance: political stability, control of corruption, voice
and accountability, government effectiveness, and
regulatory quality. For all but one indicator, Nepal is in the
lowest 30 per cent of the world’s countries.
Nepal was ranked at 117 of 159 countries in Transparency
International's Corruption Perceptions Index (CPI) for
2005 [21]. Nepal ranked equal to Afghanistan, amongst
other countries, but above Pakistan and Bangladesh. The
CPI is a composite index that assesses the perceived
overall extent of corruption (frequency and/or amount) in
the government and public sectors. The index is based
on a variety of sources, such as business people, country
analysts and independent institutions.

14
S I T U AT I O N O F C H I L D R E N A N D W O M E N I N N E PAL 2 0 0 6
before the expiration of the term of theNational Human Rights Commission in May,the 1997 National Human Rights CommissionAct was amended through an ordinance. Theordinance changed the procedure forappointment of commissioners and wascriticized for undermining the Commission’sneutrality and credibility. A Royal Commissionfor the Control of Corruption (RCCC) was alsoestablished and its constitutionality has beenquestioned.
The dismissal of the government in 2002 andthe subsequent dissolution of local bodieshas left a vacuum in elected representation atdistrict and village levels. Centrally appointedcivil servants have assumed authority ofdistrict bodies (DDCs). In April 2005, theposts of 14 Zonal Administrators werereintroduced. These positions existed duringthe party-less era and administrators had widepowers under the King; however, they hadbeen abolished with the introduction ofdemocracy in 1990. Although there have beennumerous calls for general elections from allsides of the political arena, to date notimetable for national elections has beenprepared. In February 2006, municipalelections were held. However, main politicalparties did not participate.
CONFLICT
The current Maoist insurgency in Nepal hasits roots in the mid-western districts ofRukum and Rolpa, where political activistswere able to make use of growingdissatisfaction with the lack of reforms thathad been expected from democracy tolaunch a violent movement—‘the People’sWar’—in February 1996. The demands of theinsurgency are laid out in a 40-point charter[23]. They include actions that claim toreinforce Nepal’s nationalism in its relationswith India and other countries; introduce anew political system that would guarantee therights and empowerment of all, including the‘downtrodden’ and ‘backward’; end corruption;and achieve economic and social upliftment ofthe rural poor through land reform andpractices such as fixed prices for fertilizersand minimum wages for workers. The charteralso demands the abolishment of ‘privileges’
for the King and royal family, and the placingof the army, police and bureaucracy under the‘control’ of the people.
During the first six years of the insurgency,the Maoists conducted over 1000 assaults onisolated, poorly armed police posts, killingmany police officers [24]. However, the RoyalNepalese Army was not mobilized until thefirst State of Emergency was declared inNovember 2001, following the breakdown ofpeace talks. It is generally accepted that theviolence associated with the insurgency hasescalated since that time, with manyencounters between the Maoists and thesecurity forces (the army and armed policeforce). In November 2003, the Armed PoliceForce, the Nepal Police and the NationalInvestigation Department were brought togetherunder the unified command of the army.
The conflict has been characterized by bombattacks on government offices andinfrastructure. For example, it is estimatedthat in over one-third of VDCs the VDC’sadministrative building has been damaged ordestroyed [25]. Police and army personnel,politicians and party workers have also beentargeted by the Maoists. There have beenseveral attacks on high-ranking officials,including the assassination of the Chief of theArmed Police and a military colonel at hishome in Kathmandu during 2003. Someforeign aid workers have been ordered toleave the villages where they were posted,and the US Peace Corps withdrew allvolunteers from the country in 2004.
As a result of targeted attacks, local policeand army personnel in affected areas haveincreasingly withdrawn to districtheadquarters, leaving members of localadministrative bodies with little protectionfrom the Maoists. As a consequence, inmany places the functionaries of localadministrative bodies have in turn moved todistrict headquarters. Therefore, it can now besaid that in general the government iscurrently functioning within or from districtheadquarters. The Maoists have set up theirown structures at ‘regional’, ‘district’ and‘village’ levels. These structures include‘people’s governments’ and ‘people’s courts’.However, it should be noted that the Maoists’

15
B A C K G R O U N D
boundaries do not usually coincide withestablished VDC and district boundaries.
Figure 3 shows the number of people killedsince 1996 by both parties to the insurgency;from February 1996 to November 2005, INSEChas reported 12,865 deaths [22]. Although thenumbers must be viewed with caution, andare probably an underestimate, they do givean indication of the trends that have emerged.
Inevitably, people living in areas affected bythe insurgency have had their lives disrupted.For all the Maoists declared intentions toimprove local livelihoods and access to socialjustice, from the start they have levied ‘taxes’and demanded ‘contributions’ from localinhabitants [23]. The funds collected throughthese forms of extortion have been used toprocure weapons and supply the militias.Refusal or failure to contribute has resulted inthe killing of defaulters or the destruction oftheir property [26]. Such actions breed fear inthe community, and defiance of Maoistrequests for money are rare. As well asdemanding financial contributions, Maoistsmilitias also expect free food and shelter fromlocal householders when passing through theirvillages. The provision of such ‘services’ oftenleads to reprisals by agents of the securityforces who view this ‘help’ for the Maoists assynonymous with sympathy for their actions.
The Maoists have also used the deliberatekilling of civilians to spread fear and silenceopposition [27]. Those targeted includepoliticians and local administrators, teachersand journalists, captured police personnel andsuspected informants. Their bodies are oftenleft in public places. ‘Enemies of therevolution’ are brutally tortured. The trend hasbeen to accuse villagers of a ‘crime’ andtorture them to force compliance with Maoistdiktats or to ensure that they do not opposeMaoist methods [26]. There are many reportsfrom civilians of severe beatings with sticks,stones and the butts of guns, the deliberatebreaking of bones in the arms and legs, andthe use of improvised instruments of torturesuch as hammers, nails and acid [27]. Similarreports were also noted by the SpecialRapporteur of the Commission on HumanRights on Torture during his visit to Nepal inSeptember 2005 [28]. The National Human
Rights Commission has recorded that fromJanuary 2000 to April 2005 at least 275persons went missing at the hands of theMaoists [29]. The Maoists have on occasionalso included children as targets of deliberatekilling and torture; for example, children havebeen burned alive inside buses attacked bythe Maoists, and boys as young as 15 yearshave been included in village abductions andsubsequent beatings [30]. There have alsobeen media reports of Maoist executions ofchildren for alleged crimes [30].
The security forces are also alleged to carryout extra-judicial killings of suspectedMaoists, and a number of unarmed civilians,including children, have been killed in‘encounters’ with either the police or the army[27]. For example, five unarmed boys fromNuwakot District were shot dead by thesecurity forces as suspected Maoists onenight in 2003; they were in fact returning totheir village following the death ritual of arelative [30]. In addition, the security forces areallowed by the Terrorist and DestructiveActivities (Prevention and Control) Ordinance(TADO) to detain people (including children),suspected of affiliation with the Maoists, for upto one year without trial. They have beenaccused of using brutal ‘interrogation’methods on those arrested, including severebeatings and electric shocks. A number ofpeople have died while in detention. TheSpecial Rapporteur of the Commission on
FIGURE 3:
Number of people killed by the insurgency
��
��
���
���
'� +���,-������.,/�&
�)*
'� +���,0����*�.,1�$
��*
/002 /001 ,333 ,33/ ,33, ,334 ,335/006 /000
�������������������������������������� ����
,33-
27352��+��� +��
18 ��
-7/,-����� ����� +��
/,8 ��
/7205����� ��+��+�� ��� +��
3*08 ��
3
/33
,33
433
533
-33
233
133
633
033
Source: [22]

16
S I T U AT I O N O F C H I L D R E N A N D W O M E N I N N E PAL 2 0 0 6
Human Rights on Torture ‘concludedunequivocally’ after his visit to Nepal inSeptember 2005 that ‘… torture and illtreatment is systematically practiced in Nepalby the police, armed police and the [RoyalNepalese Army] in order to extractconfessions and to obtain intelligence …’ [28].Disappearances and unacknowledgeddetention are also reported, and includechildren [27]. As of April 2005, the NationalHuman Rights Commission had registered1545 complaints of missing persons detainedor disappeared at the hands of securityforces since 2000 [29]. Almost 600 of thesewere in 2004, and over 500 were registeredin the first four months of 2005. In addition,as of 30 March 2005, INSEC had recorded1232 disappearances by security forces, 133of which were of women [22].
In response to particularly brutal Maoistsactivities, there have been some reportssince 2004 of vigilante groups spontaneouslyerupting in villages along the terai. Thesemobs have tended to burn the houses ofalleged Maoist sympathizers (sometimeshundreds of houses). In a few cases,suspected Maoists have been captured andinjured or killed. There have also beenreports of rapes. Their activities have resultedin large, though temporary, displacements ofpeople across the Indian border. Reportsindicate that in some instances the State hastolerated or colluded with the actions of suchillegal armed groups [325].
Reporting of the insurgency has been difficult,with journalists and human rights activiststargeted by both sides [26]. Nonetheless,members of these and other groups areconsidered part of an extremely vibrant humanrights community in Nepal, and are generallystill highly active.
DisplacementThe Maoist insurgency in Nepal continues toaffect the lives of children in many ways. Seethe sectoral chapters for more details. Themost obvious and widespread is themigration of families or parts of a family fromareas of conflict. It is normal for people whofeel that their lives or livelihoods arethreatened to move away from the perceiveddanger to places where they hope to find
greater physical and economic security.Although some form of migration has longbeen practiced by rural families in Nepal,since the start of the insurgency in 1996, andparticularly since the escalation of violence in2001, it has become much more widespread.Rather than one or two members of a familymigrating, whole families have been movingfrom village settlements to urban areas withinNepal and beyond [26]. Migration can increasea child’s vulnerability to rights violations,particularly when a child is separated from hisor her family.
Although there are official mechanisms forrecording the movement of people within thecountry and across its borders, it has proveddifficult to assess the numbers involved withaccuracy. Reliable information on the numberof internally displaced people (IDPs) islacking; the most quoted estimate, made bythe Global IDP Project in 2003 and still widelyused (in late 2005), suggests that 100,000–200,000 people are currently displaced withinthe country [31]. A high-level mission to Nepalin 2005 by the inter-agency InternalDisplacement Division of the UN’s Office forthe Coordination of Humanitarian Affairs(OCHA) referred to this estimate whenstating that ‘while the full magnitude ofpopulation displacement is unknown, bestreliable estimates suggest that up to 200,000Nepalese may have been internally displacedby the conflict ’[32]. One reason for thedifficulty in estimating these numbers is thatthe main pattern of displacement has so farbeen characterized by people taking up newresidence in an urban area, often with family,friends or employers. As such, the displacedare not especially visible. Someconcentrations of internally displaced peoplethat resemble ‘camps’ have started toemerge since 2004, but these ‘settlements’have so far been limited in size.
Some perspective of the changes affectingurban areas in conflict-affected districts canbe gauged from a study conducted by theNepal IDP Research Initiative. It found thatthe annual growth rate of 12 selectedmunicipalities had averaged 5.2 per centbetween 2001 and 2003, and somemunicipalities had reached a growth rate of10 per cent [33]. This was well above the

17
B A C K G R O U N D
average of 3.6 per cent for Nepal’smunicipalities between 1991 and 2001, andcoincides with an escalation of violence inthese districts. Indeed, about 24 per cent ofnew arrivals cited security concerns as theirprimary reason for moving [33]. Nationalnewspapers reported in 2002 that after apolice post in Rolpa District was attacked byMaoists more than half of the 1300 peopleliving in surrounding villages left the area insearch of more secure conditions [23].Kathmandu has seen a significant increase innewcomers (no figures are collected), withrental prices for housing increasing steadilyas pressure on supply grows [34]. The GlobalIDP Project has noted that some estimates ofthe total number of internally displaced peoplesince the beginning of the conflict, includingthose that have eventually crossed the borderto India, reach as high as two million, althoughthis has not been verified [31]. A more recentsmall-scale study conducted by the WorldFood Programme in Kathmandu found thatnine per cent of migrants cited conflict-relatedreasons for moving to Kathmandu [35].
The displacement of whole families cancause serious disruption to the lives ofindividuals and result in many problems forthose affected. So far, very little is knownabout the actual situation of the displaced inNepal; to date, only small pilot surveys havebeen done. The inter-agency InternalDisplacement Division mission to Nepal in2005 stated that ‘there is an acute lack ofnew and reliable information from across thecountry on protection and humanitarianconcerns, including on the needs of internallydisplaced persons’ [32]. Displaced peoplesuffer dislocation from support networks thatare readily available in their villages, and arelikely to move more frequently within their newarea of residence. A pilot survey of 200displaced families in Kathmandu andBirendranagar found that many had movedseveral times after coming to the city, oftensearching for affordable housing [34].
Being displaced makes people morevulnerable to exploitation and less able toexercise their rights. They might find it moredifficult to access services such ashealthcare, education and the justice system.Lack of proper nutrition, unhygienic living
conditions, heavy workloads and poor accessto sanitation can lead to increased healthproblems for displaced people [26]. Theirvulnerable situation can also increase theprobability of their exposure to HIV/AIDSthrough high-risk behaviours. In addition,being in a stressful situation and possiblysuffering from anguish they might haveexperienced before they fled, the displacedmay also present serious psychologicalvulnerabilities. Although there is amechanism for individuals to register asinternally displaced persons, for a variety ofreasons, most people do not do so. However,it is extremely difficult, if not impossible, foran individual living outside the district or VDCwhere he/she was born to obtain birth ordeath certificates, citizenship papers,landownership papers, and voter ID cards,etc. Women and children are at a furtherdisadvantage as they are dependent on malefamily members to obtain such documents.The lack of these documents increases thevulnerability of these people to violations oftheir rights. Without these papers it is difficultfor individuals to obtain paid employment insectors where workers’ rights are legallyprotected. This forces workers into theinformal sector, where jobs are poorly paidand employees are vulnerable to exploitation.
UN Consolidated Appeal
In November 2005, the UN issued a Consolidated Appeal
for Nepal to generate additional support from the
international community. The appeal presents a variety of
new projects to address current humanitarian gaps not
covered by planned development interventions, in
particular, the needs of the most vulnerable conflict-affected
populations and the building of an in-country emergency
and disaster response capacity. It covers the period
October 2005 to December 2006, and is for almost US$ 65
million, with projects presented by 25 organizations.
It also covers the expansion of the Nepal Office of the High
Commissioner for Human Rights the (OHCHR), following
the signing of an agreement in April 2005 between the
government and the UN High Commissioner for Human
Rights. This agreement allows for an OHCHR presence in
Nepal and its monitoring of human rights abuses and
violations of international humanitarian law.

18
S I T U AT I O N O F C H I L D R E N A N D W O M E N I N N E PAL 2 0 0 6
The low pay that must be accepted by somefamilies leads to women and children takingup work as well as men.
An important effect of increaseddisplacement is the pressure it places onbasic services at urban destinations. Manytowns in the mid- and far west of Nepal havebeen strained by the arrival of substantialnumbers of internally displaced persons [33].In some districts, schools in districtheadquarters have become seriouslyovercrowded, making conditions for teachingand learning extremely difficult [23]. In somedistrict headquarters, the student-to-teacher inschools has more than doubled [23]. A studyin Birendranagar found that many schools had60–100 students in classrooms intended for40 children [36]. The same study, however,found that for Kathmandu, which has seen thelargest influx of displaced people, there is alack of this type of information.
As well as whole families being displaced, aneven greater number of young men have fledthe countryside to avoid recruitment by theMaoists or harassment by the security forces,and to find work as employment conditionsworsen in the countryside [23; 26; 37]. Thisdeparture of the most productive has placedan extra burden on those who remain, usuallywomen. All 450 participants in recent focusgroup discussions said that the economicand household workloads of women haveincreased [37]. Farmland is often poorlymanaged, agricultural productivity is low andincomes dwindle, making it more difficult forrural households to cope [26]. As thishappens, the remaining members of thesehouseholds may be forced to opt fordisplacement as well.
Women and the conflictWomen have long borne the brunt of povertyand social injustice in rural Nepal, and manywere initially willing to support the aims of theinsurgency with its focus on fightingalcoholism, gambling and polygamy [23]. In aneffort to mobilize women’s support for themovement, the widows of Maoist militiamenare helped and their ‘sacrifice’ is publiclylauded [38]. It is believed that women makeup almost a third of the Maoist fighting forces[23]. However, women are also the victims of
insurgency-related violence. They have tocontend with the separation of familymembers, the extortion, the fear andreprisals, the disruption to health andeducation services, and in some cases thedeath of husbands and sons.
Explosive devicesThe use of explosive devices by both partiesto the conflict has resulted in hundreds ofdeaths and injuries annually, both tocombatants and to civilians. Initialsurveillance indicates that the majority ofcasualties are caused by the extensive useof improvised explosive devices (IEDs) by theMaoists rather than by mines and improvisedexplosive devices used by the securityforces [39]. However, should the conflictcause large-scale movements of people, thenumber of mine casualties could risesignificantly.
Socket bombs (improvised hand grenades)tend to be the key unexploded ordinance(UXO) causing post-engagement risk tocivilians. The Maoists also make use oflarger IEDs such as pressure-cooker bombsto destroy buildings, pylons,telecommunication towers and otherstructures as well as in roadside ambushesof military and civilian vehicles, includingbuses and ambulances. Most devicesappear to be detonated on command throughthe use of timers, radio signals or othermechanisms. Very few devices used by theMaoists appear to be victim activated.
The security forces are reported to be layingmines as defensive perimeters aroundmilitary installations and infrastructure, suchas bridges, dams and pylons, as well asaround potential vantage points abovemilitary installations. Anecdotal evidencesuggests that other components of thesecurity forces, such as the armed police,are more likely to use improvised explosivedevices than mines for defensive perimeters,and are less likely to map or to mark them.
One final hazard that should be mentionedconcerns the siting and safety of ammunitionstorage areas in the Kathmandu Valley,given that it is in an earthquake zone. Thereis concern that there may be ammunition

19
B A C K G R O U N D
storage depots within built-up areas, perhapsclose to medical facilities and schools.
Nepal is not a signatory to the 1997 Anti-Personnel Mine Ban Convention, althoughthe government did announce in June 2004that it would form a committee to examinethe issues involved. Nepal is also not asignatory to the 1980 Convention on CertainConventional Weapons. Protocol V of thisconvention, which has not yet been enteredinto force, would make State parties controllingan area with explosive remnants of warresponsible for identifying and clearing suchmunitions following the cessation of hostilities.
Gathering accurate and comprehensive dataabout incidents involving explosive devicesremains a major challenge: there is nocentralized collection system; there isconfusion about nomenclature for describingdevices; communication flow from somedistricts is severely limited; and information onsuch injuries is sensitive and may be recordedin the health system as having another cause.However, the annual death toll is believed to bein the low hundreds, and the injury rate betweentwo and four times the rate of the death toll.
DEMOGRAPHIC PROFILE
The 2001 census estimated the population ofNepal at 23.15 million, with a male-to-femalesex ratio of 99.8 [13]. The population is veryyoung; almost half (46 per cent or 10.6million) are children aged less than 18 years.About 39 per cent of the population is agedless than 15 years, and 14 per cent is underfive years. This equates to nine millionchildren under 15 years and 3.2 million under-fives [13]. Currently, over 6.1 million womenare of reproductive age. Given the currentfertility rate of 4.1, the Ministry of Health andPopulation projects that the number of birthsfor 2006 will be about 900,000 [40]. Thepopulation growth rate between 1991 and2001 was 2.25 per cent [13]. It is projected torise at 1.98 per cent between 2001 and 2011
[41], and at 1.83 per cent from 2001 to2016 [41].
The population density for the whole of Nepalwas about 157.3 persons per km2 in 2001[13]. However, distribution is far from uniform.The terai is the most densely populated area(329.6 persons per km2) and the mountainsare sparsely inhabited (32.6 persons per km2).About 49 per cent of the population lives in theterai, 44 per cent lives in the hills, and sevenper cent lives in the mountains [13]. About 86per cent of the population is classified asrural. The variations in population densitymean that the costs of running social servicesdiffer a great deal from one part of the countryto another.
ETHNICITY, LANGUAGE ANDRELIGION
The current social composition of Nepalexhibits great diversity. In the 2001 census,the people of Nepal were divided into morethan 100 ethnic or caste groups [13]. Forsimplicity, these groups are usually classifiedby a particular characteristic into fewercategories. For example, the report on thecensus divides the people of Nepal into sixbroad cultural groups: caste-origin hill Hindugroups (38 per cent); caste-origin terai Hindugroups (21 per cent); the Newar (5.5 per cent);the janjati1 (sometimes described asindigenous or ethnic minorities) (31 per cent);Muslim (4.25 per cent); and others (0.25 percent) [13]. Owing to the difficulty of fittingmarkedly heterogeneous groups into broadcommon categories, other researchers havedivided the groups somewhat differently. Forexample, in a recent study by the TankaPrasad Acharya Memorial Foundation forDFID, the three divisions of caste-originHindus, janjati, and religious minorities andothers are divided into seven sub-categories(Table 1) [42].
As can be imagined, this vast ethnic diversityhas resulted in great linguistic plurality. The
1 A 1996 taskforce, formed to establish a Foundation for the Upliftment of Nationalities, defined janjati as a community having its'own mother tongue and traditional culture, but not belonging to the Hindu caste system'. Another definition published in theOfficial Gazette in 1997 defines janjati as a community having an 'original and distinct language and culture' that is 'sociallybackward in comparison to other caste groups'.

20
S I T U AT I O N O F C H I L D R E N A N D W O M E N I N N E PAL 2 0 0 6
2001 census identified 92 languages spokenas a mother tongue [13]. The two mainlanguage groups are Indo-European andSino-Tibetan. The Indo-European languagesare spoken by 79 per cent of the population,and include Nepali (49 per cent), Maithili (12per cent), Bhojpuri (eight per cent) and Tharu(six per cent). The Sino-Tibetan languagesare spoken by 18 per cent of the population,and include Tamang (five per cent), Newari(four per cent) and Magar (three per cent).Nepali is the official language of the country.About half of the people whose mothertongue is not Nepali are reported to bebilingual in Nepali [13]. The language ofinstruction in school is Nepali, which canplace children of other mother tongues at adisadvantage.
Although Nepal is often referred to as aHindu kingdom, in fact, three forms ofreligion prevail in the country: Hinduism,Buddhism and animism. The first dominatesamong the Indo-Aryan peoples, while thesecond is practiced mainly by the Tibeto-
Mongoloid peoples. The 2001 census foundthat 81 per cent of the population claimed tobe Hindu, 11 per cent claimed to be Buddhist,four per cent claimed to follow Islam, and fourper cent claimed to be Kirat (a religiontraditionally observed by Rai and Limbu ethnicgroups) [13]. However, in reality, theboundaries between the different faiths areblurred by the way people practice theirbeliefs, often without clear distinction betweenthe three religions. While there is relativelylittle crossover between Hinduism andBuddhism, almost all ethnic groups, with theexception of extremely orthodox Hindus,make some use of traditional healers(shaman). Over the years, and particularlysince the restoration of democracy, there hasbeen a steady increase in the number ofpeople who do not consider themselves to beHindu (Table 2). Some peoples have followersof either Hinduism or Buddhism, for example,the Newar, and some peoples are sheddingtheir Buddhist roots to become moreHinduized, as a consequence of socialupward mobility.
High-caste Brahman–Chhetri from the hills Brahman (hill), Chhetri, Thakuri, Sanyasi(31 per cent)
High-caste Brahman–Chhetri from the terai Brahman (terai), Rajput, Kayastha, Baniya, Marwadi, Jaine,(two per cent) Nurang, Bengali
Middle-caste Hindu groups from the terai Yadav, Teli, Kalwar, Sudhi, Sonar, Lohar, Koiri, Kurmi, Kanu,(13 per cent) Haluwai, Hajam/Thakur, Badhe, Bahae, Rajbhar, Kewat,
Mallah, Nuniya, Kumhar, Kahar, Lodha, Bing/Banda,Bhediyar, Mali, Kamar, Dhunia
Hill Dalits (seven per cent) Kami, Damai, Sarki, Gaine, Badi
Terai Dalits (five per cent) Chamar, Musahar, Dhusadh/Paswan, Tatma, Khatway,Bantar, Dom, Chidimar, Dhobi, Halkhor, Dalit/unidentifiedDalit
Newar and Thakali (hill janjati) (five per cent) Newar, Thakali
Other hill janjati (23 per cent) Magar, Tamang, Rai, Gurung, Limbu, Sherpa, Bhote,Walung,Byansi, Hyolmo, Gharti/Bhujel, Kumal, Sunuwar, Baramu,Pahari, Adivasi Janjati, Yakkha, Chhantal, Jirel, Darai, Dura,Majhi, Danuwar, Thami, Lepcha, Chepang, Bote, Raji, Hayu,Raute, Kusunda
Janjati from the terai (nine per cent) Tharu, Dhanuk, Rajbanshi, Tajpuriya, Gangai, Dhimal,Meche, Kisan, Munda, Santhal/Satar, Dhangad/Jhangad,Koche, Pattarkatta/Kusbadiya
Religious minorities and others (five per cent) Muslim, Churoute, Panjabi/Shikh, unidentified/others
Source: [42]
TABLE 1: Castes/ethnic groups by residence with percentage distribution

21
B A C K G R O U N D
CASTE
Caste distinctions are prevalent in all Hinducultures. They tend to be stronger in thecaste-origin Hindu communities and weakerin the Hindu janjati groups. Althoughdiscrimination on the basis of caste is illegalaccording to the Country Code of 1963, it isstill common across Nepal, particularly in themore orthodox communities where Dalits areconsidered ‘untouchable’. Untouchability ismanifested by a refusal to accept food ordrink, including water, from a Dalit. Thismeans that high-caste Hindus will not marryDalits, will not allow Dalits to enter a roomwhere food is prepared and cooked, will notinvite Dalits to their lifecycle rituals andceremonies, and will not take water from thesame sources as Dalits. Dalits are alsoforbidden to enter Hindu temples.Contravention of these prohibitions requireshigh-caste Hindus to perform cleansing ritualsto purge themselves of the ‘pollution’.
As a consequence of their perceived‘impurity’, Dalits are considered to be low-born by high-caste Hindus, and are oftendisadvantaged within local power structures.Membership of a ‘lower’ caste can restrict achild’s or parent’s ability to gain access toeducation, healthcare, economic opportunities,capital, justice and other things necessary fora living and the possibility of improving one’ssituation. This can be clearly seen in thefindings of one study where Brahman–Chhetrigroups and Newar–Thakali groups scoredhighest on indicators for living conditions, andaccess to education, professional andtechnical jobs, and decision-making [43].Most members of these groups were living incement/mortar houses with modern toiletfacilities, had access to electricity and, usedliquid petroleum gas or kerosene as cookingfuel. They also enjoyed the best education
and employment opportunities, and haddisproportionate access to decision-makingpositions. Dalits, particularly terai Dalits, andterai janjati fared the worst on mostindicators [43]. Regional variation wassignificant in differentiating households withineach caste. For example, Brahman–Chhetriand Dalits of the Mid-Western and FarWestern Development Regions were moredisadvantaged than the same castes in otherdevelopment regions [43]. The urban–rural andecological divides also resulted in substantialvariations, with terai communities and urbanhouseholds having better access to marketand modern amenities than other groups,irrespective of caste [43].
HOUSEHOLD POVERTY
Poverty is widespread in Nepal, where all buta small minority of households can beconsidered poor by many international
Source: [13]
Hindu Buddhist Islam Kirat Christian Other
1981 89.50 5.32 2.66 – 0.03 2.49
1991 86.51 7.78 3.53 1.72 0.17 0.28
2001 80.62 10.74 4.20 3.60 0.45 0.39
Millennium Development Goals for poverty
In 1996, 34 per cent of the population had an income
below US$ 1 (PPP) per day. By 2004, this had
decreased to 24 per cent.
In 1996, the poverty headcount ratio (percentage of
population below the national poverty line) stood at 42
per cent (urban 22 per cent; rural 43 per cent). By 2004,
this had fallen to 31 per cent (urban 10 per cent; rural 35
per cent).
In 1996, the poverty gap ratio (incidence x depth of
poverty) was 11.8 per cent. By 2004, it had fallen to 7.6
per cent.
In 1996, the poorest quintile accounted for 7.6 per cent
of national consumption. By 2004, this quintile
accounted for 6.2 per cent of national consumption
Sources: [44; 46; 76; 77]
TABLE 2: Percentage of population by religion (from 1981, 1991 and 2001 censuses)

22
S I T U AT I O N O F C H I L D R E N A N D W O M E N I N N E PAL 2 0 0 6
standards. It can be particularly serious forchildren and women, as their low status insociety makes them the most vulnerable to itsimpacts.
The National Living Standards Survey 2003/04found that 31 per cent of Nepal’s populationwas below the national poverty line [44].Approximately 7.5 million people live inabsolute poverty, defined as a level of income
insufficient to procure a basket of minimumfood (2124 kilocalories per person per day)and non-food items [45]. Most of the poor—over 90 per cent—live in rural areas. Poverty isalso more severe and intense in remote areas,especially in the Mid-Western and FarWestern Development Regions [46]. Povertywas also found to be higher among Dalits andethnic minorities (janjati) (Figure 4) [43].
The National Living Standards Survey 2003/04found that nominal per capita consumption forthe poorest quintile was NRs 4913 (or US$ 66at an exchange rate of NRs 74) compared toNRs 42,236 among the richest quintile [44].The share of consumption by the richest 20per cent of the population increasedmarginally from 50 per cent in 1996 to 53 percent in 2004 [44].
The Tenth Five-Year Plan has identified severalkey factors contributing to rural poverty inNepal [47]. Economic growth anddevelopment have been skewed, urban-centric and inequitable; the rural poor havehad little access to basic social andeconomic services and infrastructure; therehas been widespread social exclusion ofcertain caste and ethnic groups, women, andthose living in remote areas; and there havebeen high levels of poor governance.
However, the number of people living belowthe poverty line has been reduced (from 42per cent in 1995/96), even against thebackdrop of the conflict. There are threepossible reasons for this. Firstly, Nepal’s GDPgrowth averaged 4.8 per cent between 1996and 2001. Secondly, agricultural production—the largest sector in the economy—grew at3.7 per cent per year during the same period.Finally, remittances from overseas haveincreased by about 30 per cent a year sincethe late 1990s [46]. However, it should benoted that economic growth since 2001has slowed.
Remittances are becoming an increasinglyimportant contributor to the nationaleconomy. The National Living StandardsSurvey 2003/04 found that the remittanceamount per person had increased overthreefold in the last eight years from NRs 625to NRs 2100 [44]. The proportion of
FIGURE 5:
Average remittance among recipient households
,/76,3
/,7402
,57,,-
/374,,
4/7264 437-01
2-7-/5
/47032
17/,0 673-2
���� � ,� ���� �
�� � ,� ��� �
��� �
,334835
/00-802
&� �13�9�!��:�/�;� ��+������,335<$����� ������������&�������� *
Sources: [44; 48]
FIGURE 4:
Population below the poverty line
3=
-=
/3=
/-=
,3=
,-=
43=
4-=
53=
5-=
-3=
#����
�� �
!���������
>� ���
'�����
? ���
�� .? ���
@��.?
���
!����� ��;����<
!����� ��;��
���<
&���
>�����������;����<
>�����������;
�����<
������;����<
������;��
���<
@������� ��� ���
��! ���������!�� ��
Source: [44]

23
B A C K G R O U N D
households receiving remittances has alsoincreased, from 23 per cent to 32 per cent.However, the gap between rich and poor hasnot been reduced (Figure 5). About one-thirdof remittances are from India, nine per centfrom the Gulf countries, and three per centfrom Malaysia. Remittance amounts from theGulf and Malaysia are four times larger thanthose from India. The poorer Mid- and FarWestern Development Regions have thegreatest share of remittances from India.While remittances increase the income of ahousehold for spending and may give femalemigrants greater power, the absence of one orboth primary caregivers over longer periods oftime can also disrupt normal family life andexpose women to exploitation.
Female-headed households were not foundto be particularly disadvantaged with only 24per cent below the poverty line. One possibleexplanation is that these householdsbenefited from the remittances sent by theabsent male household head [45].
Loans are often taken out by families to meetthe costs of social obligations such asweddings or crises such as crop failure orserious illnesses, with about seven in 10households having loans and/or outstandingdebts [44]. The majority of borrowing is fromnon-formal sources: relatives (55 per cent) andprivate moneylenders (26 per cent) [44]. Thetendency to borrow from relatives instead ofmoneylenders has increased recently, possiblyreflecting the growth in remittances. Interestrates vary, but average from 10 per cent to 17per cent for institutional borrowing to about 35per cent or more from informal sources.
COMMUNITY STRUCTURES
Obviously, households do not exist inisolation; they are all part of a community atsome level. A community can be definedeither by its geographical boundary or itssocio-economic status or a particular interest;and can differ in size and cohesiveness. Inmost communities, it is those with thegreatest wealth, land or influential contactswho control the power structures and dictatecommunity activities. These people may ormay not be from a ‘high’ caste. Discrimination
by power groups often leads tomarginalization of particular sub-groupswithin a community. Marginalization is notsimply a product of poverty; it is also theproduct of social and economic exclusion.Entrenched gender discrimination also putsgirls and women at a disadvantage in termsof accessing power and resources.
Although there are examples of traditionalforms of community cooperation for labour orcredit (parma, guthi, rodi, dhikuri, etc.), mostof these institutional structures are weakeningand disappearing as a consequence ofmodernization, urbanization and conflict. Intheir place, community-based organizationshave been formed to benefit members in termsof savings and credit, use and access toforests, use and access to water supplies,adult literacy, access to information, localenvironmental improvement, health inputsparticularly for mothers of small children, etc.These self-help or user groups are nowwidespread and are often well organized;some are even forming federations at villageand district levels.
Community-based organizations
The Decentralized Local Governance Support Programme
(DLGSP), formerly the Participatory Decentralized
Development Programme (PDDP) and Local Governance
Programme (LGP), has mobilized communities to
establish nearly 20,000 savings and credit groups in 60
districts [50]. Nearly 500,000 people, about half of whom
are women, are members of these community-based
organizations. These groups have saved NRs 386.75
million (US$ 5.5 million), which is used to provide loans to
group members.
Forest User Groups (FUGs) also have an extensive
network in Nepal. There are over 13,000 FUGs, mostly in
the hills and mountains, managing about 25 per cent of
Nepal's forested land. FUG membership is estimated to be
about 1.5 million households, which is about 35 per cent
of the total population. For a nominal fee, FUG members
can use forest products for household use. Timber and
fuelwood are sold at auction, and the proceeds are
deposited into a community fund. In 2001, it was
estimated that as much as US$ 10 million was being
generated by these groups each year as income from
managing forests [51].

24
S I T U AT I O N O F C H I L D R E N A N D W O M E N I N N E PAL 2 0 0 6
members of their communities. Anotherpattern of migration is for a member of ahousehold to move to an urban area forlabouring work in construction andmanufacturing sectors. Carpet factoriesaround the Kathmandu Valley have acted as astrong draw for migrant workers from acrossthe country. Often these migrants do notreturn to their villages. Instead, once they aresettled, they bring the rest of their family totheir migrant destination and start a new lifetogether there. There is also a substantialamount of international migration to India andcountries in South East Asia and the MiddleEast. This is usually by one member of afamily, who will send remittances to the rest ofthe family in their home village.
The 2001 census looked at migration flowswithin Nepal, and into and out of the country.The number of inter-regional life-time migrantshas increased fourfold and the number of inter-district life-time migrants has increasedsevenfold since 1971, suggesting that internalmigration has been steadily increasing [13].Most inter-regional migration is to neighbouringregions. In general, the mountains had thehighest levels of out-migration, followed by thehills; while the terai had the highest levels ofin-migration (Figure 6). Consequently, theproportion of people living in the terai has risenover the years. Rural-to-rural (68 per cent) andrural-to-urban (25 per cent) are the two majormigration streams. Internal migrants from ruralareas constitute 32 per cent of the populationin Kathmandu Valley towns, 23 per cent in theterai towns, and 17 per cent in the hill towns[13]. The age–sex structures of migrantpopulations tend to show a high proportion ofpeople aged 20–34 years and a largerproportion of males than females [13].
The main reasons for migration are marriage(27 per cent), agriculture (16 per cent),employment (11 per cent), study and training(nine per cent), and trading (six per cent) [13].However, the census did not capture data oncauses for migration such as poverty,unemployment, food insecurity, or the conflict.
Migrant populations are more literate thannon-migrant populations [13]. Although non-migrant populations have higher levels ofprimary and pre-SLC secondary education
Some would argue, however, that for mostNepalis the priorities of the family will almostinvariably override the interests of thecommunity when choices have to be made[49]. Most village communities in Nepalcannot be viewed as integrated, harmonious,cooperating institutions. To reach those whoare marginalized within their community,development practitioners have to address thepower disparities and social fragmentationwithin the Nepali village.
MIGRATION
Migration has long been used by householdsin rural communities as a coping strategy toovercome family poverty, especially in the hilland mountain districts of the Far Western andMid-Western Development Regions. Onetypical pattern is for one or two malemembers of a household to migrate forseasonal work to a close-by or favouredlocation in Nepal or India for between threeand six months. When the season ends,migrants will return to their families with theirearnings. Many residents of one location inNepal tend to migrate to the samedestination. This ensures that migrants haveaccess to some sort of support network, andthat families can maintain a channel ofcommunication with their migrant membersthrough the comings and goings of other
FIGURE 6:
Trends in population distribution by ecological zone
/01/ /06/ /00/ ,33/
�����������������
41*2��4*2� �2*1� �6*��
-,*-��1*1� �-*-� ��*-�
0*0� 6*1� 1*6� 1*4�
Source: [13]

25
B A C K G R O U N D
than migrant populations, migrant populationshave higher levels of SLC and post-SLCeducation than non-migrant populations. Thisindicates that migrants are either the under-educated or the well-educated. This is borneout by the occupational patterns of migrant andnon-migrant populations. Migrants are over-represented in occupations such as legislatorsand senior civil servants, professionals andtechnicians, and under-represented inoccupations such as skilled and semi-skilledlabourers [13]. The high-caste Brahman andChhetri are the most likely to migrate, whileDalits are under-represented in migrantpopulations.
In recent years, an increasing number ofNepalis have been migrating overseas foremployment, with recent estimates at about800,000 [52]. India has always been a populardestination for daily, seasonal and long-termmigrants. However, countries in the MiddleEast and South East Asia are also becomingcommon destinations. The 2001 census foundthat 77 per cent of Nepali external migrantswent to India, 16 per cent went to MiddleEastern countries, and four per cent went toEast and South East Asian countries [13]. Theproportion going to Middle Eastern countrieshas shown a particularly large increase fromless than one per cent in 1991. As ‘other’destinations have become more popular, Indiahas declined as a proportion; it was 93 percent in 1981 and 89 per cent in 1991 [13].
There is limited migration of foreign nationals toNepal. In 2001, this population was estimatedto be 600,000 [13]. The overwhelming majorityof foreign-born nationals residing in Nepal areIndians (96 per cent), with other Asiannationals making up three per cent [13]. Themost significant groups after Indians who live inNepal are people from the Tibet AutonomousRegion of China, people of Nepali-origin fromBhutan and Myanmar, and people fromPakistan (Kashmir).
Although the usual intended purpose ofmigration is to make a family better off, it canalso result in families becoming morevulnerable to violations of their rights. This isespecially true for families that have not usedmigration before and where migrants do nothave access to a support network. When
families are broken up and scattered bymigration, for example, as a consequence ofthe conflict, members both at home and atmigrant destinations can find that they areliving in worse conditions, that they are morevulnerable to exploitation and abuse, and thatthey engage in risky behaviours that canincrease their vulnerability to HIV/AIDS.Parents and children who lack the academicqualifications, training and skills required forformal jobs often end up in the informal sector[53]. Young migrants, in particular, face theconsequences of intense competition for alimited supply of jobs, which may result inextremely low daily wages and harshconditions, making them vulnerable totrafficking, abuse and exploitation. The ChildLabour (Prohibition and Regulation) Act doesnot cover the informal sector or self-employment. Therefore, there is no monitoringor regulating mechanism to protect children inthese situations.
RURAL–URBAN DISPARITIES
With significant rural-to-urban migration, thetowns and cites of Nepal are growing rapidly.Although opportunities and services in suchplaces are often better than in rural areas,there is also a danger that urban resourcesmay become over-stretched by such fastexpansion. The 2001 census estimated that13.9 per cent of the population live in urbancentres [13]. Urban growth rate is the highestin South Asia at 6.6 per cent for 2001, andthe urban–rural growth differential averaged4.9 per cent between 1991 and 2001 [13]. Theurban growth rate for 2011 is projected to be5.2 per cent, with 20 per cent of the totalpopulation living in urban centres by then [41].In 1991, there were 33 urban centres. By2001, this had risen to 58 urban centres(although this increase is partly due to achange in the definition of urban centres) [13].
All human development and economicdevelopment indicators tend to be higher inurban areas than in rural areas. Selectedmeasures of human development for urbanand rural areas in Nepal show that theperformance of urban areas is better thanrural areas [13]. Urban GDP per capita (inPPP) is almost twice that of rural areas. The

26
S I T U AT I O N O F C H I L D R E N A N D W O M E N I N N E PAL 2 0 0 6
human development index and other indices,including gender-related indices, show asimilar picture (Table 3) [54].
A comparison of basic facilities in urban andrural areas also presents noteworthydifferences (Table 4) [44]. About 87 per cent ofurban households have an electricityconnection compared to less than 27 per centof rural households. Water supply andsanitation facilities are better in urban areasthan in rural areas. There is an overwhelmingdependence on firewood as a source of fuelin rural areas (77 per cent) compared tourban areas (31 per cent).
While the extent of urbanization is stillrelatively small in Nepal compared to manycountries, the country’s capacity to manageeven these low levels is put under pressureby the high growth rate [13]. Unregulated andunguided urbanization is a problem in manylarge cities such as Kathmandu, Pokhara andBharatpur. The absolute level and quality ofurban infrastructure and services is ofteninsufficient. Drainage, sewerage, water supply,and electricity are becoming serious problems
in many urban areas. Urban congestion,increases in industrial and vehicle emissions,and air and noise pollution are also becomingevident. Unplanned urban sprawl ischaracteristic of most urban areas. Althoughlittle information is available on urban slums,this is an increasing concern in large centressuch as Kathmandu and Pokhara, particularlyin light of the conflict.
The institutional capacity of municipalities tomanage urban infrastructure and urbangrowth remains severely constrained [13]. Thelegal basis and institutional capacity toenforce land-use and zoning laws as well asenvironmental standards have still to becreated. The revenue potential of urbanareas remains unexplored and unexploited.However, urbanization is likely to remain themost significant aspect of the spatialdistribution of Nepal’s population in thecoming decades. Indeed, the rural-to-urbanmigration that accompanies urbanization willcontinue to increase, as the transportinfrastructure continues to expand, as thepressure on limited land resources in ruralareas continues to increase, as literacy ratesin rural areas continue to rise, and as thesearch for gainful employment in non-farmsectors gathers momentum [13]. The conflictis also expected to add to this migration flow.
NATIONAL ECONOMY
According to the Ministry of Finance, Nepal’sGNP per capita measured US$ 300 in 2004/05 [17]. The World Bank estimate for GNI isUS$ 260 for 2004 [55]. By either account,Nepal is one of the poorest countries in SouthAsia, and is ranked among the 50 leastdeveloped countries in the world.
Since the early 1990s, the national economyhas managed to grow modestly in most years(Figure 7) [17]. Nevertheless, although theannual per capita GDP growth rate averaged2.5 per cent between 1986 and 2001, thiswas barely higher than the population growth.Throughout the 1990s, the non-agriculturalsector accounted for three-quarters of thegrowth. The agricultural sector, which used toaccount for 70 per cent of GDP in the mid-1980s, now constitutes only 39 per cent [17].
Source: [54]
TABLE 3:Selected measures of human development in urbanand rural areas
Urban Rural
GDP per capita (PPP) US $ (2001) 2224 1162
Human Development Index (2001) 0.581 0.452
Gender-related Development Index (2001) 0.562 0.430
Gender Empowerment Measure (2001) 0.425 0.365
Human Poverty Index (2001) 25.2 42.0
Source: [44]
Urban total Kathmandu RuralValley only total
Electricity connection 87 99 27
Piped drinking water 68 88 39
No sanitation facility 19 1 70
Firewood used as fuel 31 3 77
TABLE 4: Basic facilities in urban and rural areas, 2003 (percentage)

27
B A C K G R O U N D
During the last 15 years, growth in theagricultural sector has shown much variation,ranging from -1.2 per cent to 7.8 per cent.Most variation can be attributed to weatherconditions, policy initiatives, anddisplacement of the productive populationfrom rural areas as a consequence of theconflict. On a per capita basis, agriculturaloutput remained stagnant for the 35 years to2001 [52]. As long as the majority of the ruralpopulation, particularly the poor, depends onagriculture for its livelihood, the relativevolatility and slow growth of agriculture will bea challenge for reducing poverty in Nepal.
The non-agricultural sector has also seenmuch variation, with a range from -1.9 percent to 9.8 per cent. After strong growth inthe early 1990s, the non-agricultural sectorhas faltered, especially since 2001. Factorsthat have influenced growth trends in thissector include the rise and fall of thegarments and carpet industry, the impact ofvarious security concerns, the commissioningof new electricity plants, and the expansion oftelecommunication services. Tourism hasconstituted 3–4 per cent of GDP over thepast 15 years, but has been hit in recentyears by concerns about the conflict. Therehave been notable variations over the lastfive years, with a low point in 2001/02 of anegative growth of 2.1 per cent of GDP. Touristarrivals are down by 22 per cent since thepeak year of 1999, although 2003 and 2004showed some recovery in numbers and maypoint to an improving trend [17]. Thesevariations have impacted on incomes in thetourism industry directly as well as on thosein ancillary industries (food production forhotels, handicrafts, etc.).
Nepal can be characterized as a smalleconomy dependent on trade and exports.Since the mid-1990s, the country has had atrade deficit. The volume of imports has beenabout two and a half times larger than thevolume of exports. Exports have fallen since2001 [52]. India is Nepal’s biggest tradingpartner, making up more than half of Nepal’sexports and half of its imports [52]. Importsinclude industrial raw materials and constructionmaterials such as steel, aluminium, polyesterfibre, cotton, and cement; electrical andelectronic goods; tobacco; cosmetics;
FIGURE 7:
GDP trends (at 1994/95 prices+)
"#��$���
.4*3
./*3
/*3
4*3
-*3
1*3
0*3
%��
&!'
��!
�()
*
/060
8/00
3
/003
8/00
/
/00/
8/00
,
/00,
8/00
4
/004
8/00
5
/005
8/00
-
/00-
8/00
2
/002
8/00
1
/001
8/00
6
/006
8/00
0
/000
8,33
3
,333
8,33
/
,33/
8,33
,
,33,
8,33
4
,334
8,33
5�A
,335
8,33
-�AA
B�@������ �
A��)� � �����
AA������������ �����
����%��
$��������
&��.$��������
fertilizer; salt; and drugs. Major exportsinclude various categories of textiles andclothing; carpets; and some commodities[56]. The Nepalese economy is also stronglygeared towards trade in services—mostlytourism, but also increasingly labour services(i.e., out-migration and its associatedremittances). Remittances currently constituteabout 12 per cent of GDP [52].
The expiration of the Agreement on Textilesand Clothing at the end of 2004 is expectedto impact negatively on Nepal’s carpet andgarment industries, which grew during the1990s when Nepal benefited from quotas setby developed country markets for exports fromleast developed countries. More efficientexporters from elsewhere in the world are nowdisplacing Nepal, as Nepal’s trade partnersbecome frustrated with the country’s politicalinsecurity. This situation has directimplications for household incomes and thuschildren, as many women are employed in thetextile, garment and carpet sectors.
Nepal joined the World Trade Organization(WTO) in September 2004. Since then,WTO-conforming legal and institutional
Source: [17]
28
S I T U AT I O N O F C H I L D R E N A N D W O M E N I N N E PAL 2 0 0 6
systems have been established, althoughenactment of legislation has been stalled bythe absence of a parliament. Studies on theimpact of joining the WTO are planned forvarious industries. Commitment to the WTOagreement on Trade-Related Aspects ofIntellectual Property Rights (TRIPS) will haveimplications on the import of medicines (andreduce possibilities for the local production ofsuch), but may also provide opportunitiesfor patenting and marketing indigenousmedical knowledge.
Although the rate of inflation has beencontained to below five per cent since 2000,ever-rising prices of essential items in Nepalhave exerted increasing pressure on familieswith limited incomes [17].
ECONOMICALLY ACTIVEPOPULATION
In the 2001 census, about 47 per cent of thepopulation aged 10 years and above claimedto be economically active (i.e., providinglabour for the production of economic goodsand services) [13]. During the previous 10years, the labour force grew faster than thepopulation. There has been a general shift inemployment from the agricultural to the non-agricultural sector. However, agriculture is stillthe largest sector, accounting for 66 per centof the total labour force. Commerce accountsfor 10 per cent and manufacturing for nine percent [13].
The percentage of self-employed fell from 75per cent in 1991 to 63 per cent in 2001 [13].Self-employment activities compriseagricultural labour, non-agricultural familyenterprises and off-farm work in urban areas.A larger population of women (71 per cent) areself-employed than men (57 per cent). Unpaidfamily workers constitute a rising nine percent of the employed population, accountingfor 13 per cent of economically active women.
The unemployment rate in Nepal is increasing,and currently stands at over nine per cent ofthe economically active population [13].Under-employment is also a serious problem.However, under-employment rates have fallenfrom previous estimates, with 84 per cent of
the labour force in 2001 working for at leasteight months of the year compared to 65 percent in 1991 [13]. Under-employment affectswomen more than men. Generally, under-employment is higher in rural areas than inurban areas, and higher in the hills than inthe terai.
AGRICULTURE AND FORESTS
Over two-thirds of Nepal’s labour force isengaged in agriculture. However, for many, itdoes not provide a sufficient livelihood, with80 per cent of those below the poverty linedepending on this sector for their living [44].Moreover, the conflict is having a profoundimpact on the agricultural sector, aslandowners are displaced to urban areas andagricultural production falls as aconsequence [57].
The National Living Standards Survey 2003/04 found that landholdings are becomingsmaller, having reduced from an average sizeof 1.1 hectares in 1995/96 to 0.8 hectares in2003/04. Moreover, the quality of agriculturalland, water and forest resources isdiminishing, thus reducing food security.About 28 per cent of Nepal’s area isclassified as cultivated land (includinggrassland) [58]. The national cultivatedlandholding per capita in 2001 was 0.175 ha[13]. In the terai, which has the greatest areaof cultivated land but also the greatestproportion of the population, the average percapita landholding in 2001 was 0.167 ha.Average per capita landholding in the hills was0.162 ha, and in the mountains was 0.307 ha.
Small landholdings mean that mosthouseholds are subsistence farmers. The2001/02 National Census of Agriculture foundthat about 80 per cent of Nepal’s croppedarea is planted with cereals (rice, wheat,maize, millet, etc.) [59]. The remainder isplanted mainly with legumes, oilseeds,tubers, and vegetables. Cash crops make upan extremely small proportion. Rice is themost important crop, with 92 per cent ofholdings growing it [59]. This is followed bywheat and maize. Agricultural land is eitherflat or terraced, and may be irrigated or rain-fed, although the latter is more common.

29
B A C K G R O U N D
Industrial crops such as sugarcane, tobacco,jute, cotton, tea and coffee are grown inlocalized or area-specific parts of Nepal. Fruitand vegetable cultivation are prevalent at thesubsistence level, but large-scale farming islimited. Kitchen gardening and the growing offruit and fodder trees on unused andmarginal land is widespread, and provides animportant opportunity to increase foodproduction and consumption, and generateincome at the family level.
Livestock raising is an integral part of themixed farming system in Nepal, with 90 percent of holdings owning some [59].The most common types are chickens, cattle,goats and buffalo. Sale of livestock andlivestock products can supplement ahousehold’s income.
Forests supply fodder for livestock, fuelwoodfor energy, and various non-timber forestproducts that are exploited commercially orfor home use. The National ForestryInventory of 1999 indicated that forest covers29 per cent of Nepal’s land area. Mostforestland is owned by the State. Some isprotected in national parks and reserves, andsome is managed by the Department ofForests for commercial use. However, muchis left unmanaged and is of poor quality. Toincrease productive use of forestland andmeet demand for forest products, thegovernment started a programme in the1990s to handover the management ofsuitable forestland to local communities. By2004, about 25 per cent of national forestlandwas being managed by community forestuser groups [51]. In addition to officiallyclassified forestland, about 37 per cent ofagricultural holdings grow some forest treesfor private use and sale [59].
FOOD SECURITY
Subsistence farming does not ensure anadequate livelihood for most households inNepal. The 2001/02 National Census ofAgriculture shows that, among landholdinghouseholds, over 60 per cent are food deficitfor some period during the year, and amongthese 78 per cent are food deficit for at least4–6 months a year [59]. The census also
shows that while many food-deficithouseholds will earn an off-farm incomelocally (68 per cent) and/or will utilizestrategies such as migration and sale ofassets to raise money to buy food (30 percent), a significant number will also borrowmoney to cover expenses for food purchasing(12 per cent) [59].
The average yield per hectare of basic cropswas 2.3 t per ha between 1997/98 and 2001/02 [13]. The yield per hectare of rice was 2.5 t.Total production of basic crops averaged eightmillion tonnes a year. However, nationalagricultural production is too low to meetconsumption needs. Although Nepal was anet exporter of food grains in the past,population growth means that since the late1980s it has had to import increasingquantities. Although the amounts that areimported fluctuate each year, depending onthe size of the harvest—indeed, in someyears there has been a small surplus—theFAO/UNDP has calculated that deficit for the1990s averaged 5.2 per cent of requirement[60]. In addition, the food that is available isoften of poor nutritional value. Consumption ofcereals and roots crops makes up a far largerproportion of the average diet than isrecommended, with a significant shortfall inanimal sources such as meat, milk and eggs[60]. The Nepal Living Standards Survey 2003/04 revealed that nearly 32 per cent ofhouseholds nationally perceive their foodconsumption to be ‘less than adequate’ [44].
Across the country, the hills and mountainshave tended to be food deficient, while theterai has produced a surplus. For example, in2000/01, 36 of Nepal’s 75 districts were fooddeficient, with all but two of these districtsbeing in the hills and mountains [60]. This wasa fairly good year. In 1995/96, 55 districts werefood deficient, including six terai districts [60].
While the climatic and physical nature of thecountry means that differing rates ofagricultural production are inevitable acrossthe eco-regions, limitations in thetransportation and food distribution systemsalso add to imbalances between the terai andthe hills and mountains. Indeed, hightransportation costs and easy access tomarkets in India means that surpluses usually

30
S I T U AT I O N O F C H I L D R E N A N D W O M E N I N N E PAL 2 0 0 6
do not reach deficit areas in the hills andmountains in meaningful quantities.
In an effort to improve food distributionacross the country, the governmentestablished the Nepal Food Corporation in1974, following a serious drought [60].However, the volume of cereals distributed bythe Nepal Food Corporation to remote food-deficit areas has always been small, meetingonly a modest part of the deficit. Moreover,there is limited distribution to the needy, withmuch of the supply going to governmentfunctionaries such as the police and military.The Nepal Food Corporation’s generallyineffective response to improving food securityfor the majority in food-deficit areas hasresulted in the government initiating a processof reform that includes the curtailing ofsubsidized cereal distribution; this is partof a larger economic reform package requiredunder the Second Agriculture ProgrammeLoan of the Asian Development Bank [60].
NATURAL DISASTERS
Naturally occurring changes to the physicalenvironment are common in Nepal, both on asmall and large scale, and can beexacerbated by human activities. Sometimesthese events can trigger disasters for localand regional populations. The impact that adisaster has on the lives of those it affects willdepend on their vulnerability and resilience.Those with few or no resources find it moredifficult to recover from events that might beminor for those with greater resources andresilience. Emergency preparedness is rare,although some efforts are being made toestablish improved forecasting and earlywarning systems. Efficient meteorologicaldata collection and analysis have helped toimprove prediction of weather-related events,and the monitoring of glacial lakes providesearly warning of outburst floods. The mostcommon phenomena that result in disastersare associated with the heavy monsoonrains—floods and landslides. Drought canalso cause widespread damage. Nepal islocated in a seismically active region, andearthquakes are frequent and can be large.
EM-DAT, the international disaster databaserun by USAID’s Office of Foreign DisasterAssistance (OFDA) and the Center forResearch on the Epidemiology of Disasters(CRED), identifies floods as the mostcommon natural disaster in Nepal. During thelast 70 years, there have been 25 recordedfloods that have affected over 2.2 millionpeople and caused an estimated US$ 990million of damage [61]. In 1993, one floodingevent affected 550,000 people and in 2004another affected 630,000 [61]. Floodingaffects the terai more than the hills. In thehills, the monsoon rains cause frequentlandslides. These result in varying levels ofdamage that might affect only a few people tomany hundreds. The EM-DAT records 14major landslides since 1934, affecting360,000 people [61]. Small landslides occurthroughout each monsoon on steep anddenuded hillsides. This type of land is oftenowned by the poorest in a community; lossof their land can push already vulnerablefamilies into crisis.
For subsistence farmers, drought can spelldisaster. Although they occur less often thanfloods or landslides, droughts can affect farlarger areas of the country and many morethousands of families. The EM-DAT recordsfour major droughts since 1934, affecting over4.4 million people [61].
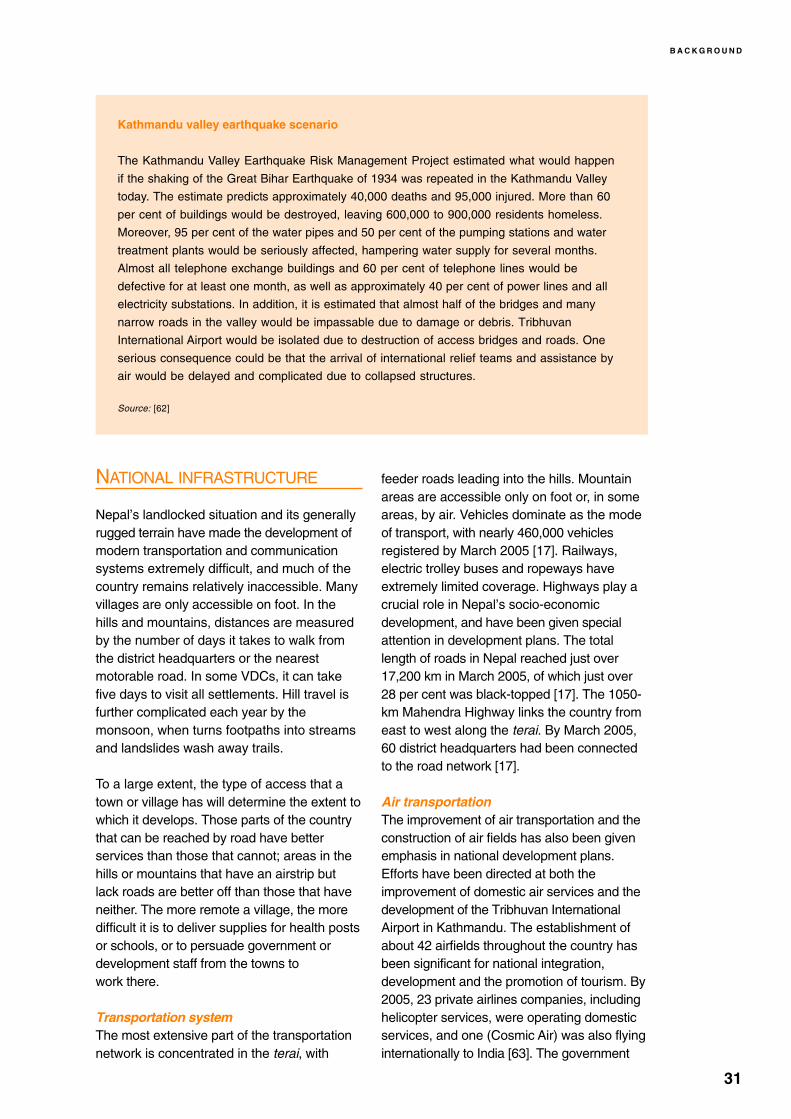
Lying as it does on the junction of the Indo-Australian and the Eurasian tectonic plates,Nepal is prone to earthquakes. Many minorquakes are recorded each year; sometimesthese result in localized damage, especiallyto poorly constructed buildings. The last bigearthquake occurred in the east of thecountry in 1988, killing over 700 peoplearound Dharan [61]. In 1934, an earthquakemeasuring over seven on the Richter scale hitKathmandu. Thousands of people were killedand 40 per cent of buildings in the valley weredamaged [62]. Although Nepal has legislationto ensure that newly constructed building areearthquake proof, it is not enforced.Predictions suggest that if the 1934earthquake happened today, theconsequences would be devastating (seebox) [62].
31
B A C K G R O U N D
NATIONAL INFRASTRUCTURE
Nepal’s landlocked situation and its generallyrugged terrain have made the development ofmodern transportation and communicationsystems extremely difficult, and much of thecountry remains relatively inaccessible. Manyvillages are only accessible on foot. In thehills and mountains, distances are measuredby the number of days it takes to walk fromthe district headquarters or the nearestmotorable road. In some VDCs, it can takefive days to visit all settlements. Hill travel isfurther complicated each year by themonsoon, when turns footpaths into streamsand landslides wash away trails.
To a large extent, the type of access that atown or village has will determine the extent towhich it develops. Those parts of the countrythat can be reached by road have betterservices than those that cannot; areas in thehills or mountains that have an airstrip butlack roads are better off than those that haveneither. The more remote a village, the moredifficult it is to deliver supplies for health postsor schools, or to persuade government ordevelopment staff from the towns towork there.
Transportation systemThe most extensive part of the transportationnetwork is concentrated in the terai, with
feeder roads leading into the hills. Mountainareas are accessible only on foot or, in someareas, by air. Vehicles dominate as the modeof transport, with nearly 460,000 vehiclesregistered by March 2005 [17]. Railways,electric trolley buses and ropeways haveextremely limited coverage. Highways play acrucial role in Nepal’s socio-economicdevelopment, and have been given specialattention in development plans. The totallength of roads in Nepal reached just over17,200 km in March 2005, of which just over28 per cent was black-topped [17]. The 1050-km Mahendra Highway links the country fromeast to west along the terai. By March 2005,60 district headquarters had been connectedto the road network [17].
Air transportationThe improvement of air transportation and theconstruction of air fields has also been givenemphasis in national development plans.Efforts have been directed at both theimprovement of domestic air services and thedevelopment of the Tribhuvan InternationalAirport in Kathmandu. The establishment ofabout 42 airfields throughout the country hasbeen significant for national integration,development and the promotion of tourism. By2005, 23 private airlines companies, includinghelicopter services, were operating domesticservices, and one (Cosmic Air) was also flyinginternationally to India [63]. The government
Kathmandu valley earthquake scenario
The Kathmandu Valley Earthquake Risk Management Project estimated what would happen
if the shaking of the Great Bihar Earthquake of 1934 was repeated in the Kathmandu Valley
today. The estimate predicts approximately 40,000 deaths and 95,000 injured. More than 60
per cent of buildings would be destroyed, leaving 600,000 to 900,000 residents homeless.
Moreover, 95 per cent of the water pipes and 50 per cent of the pumping stations and water
treatment plants would be seriously affected, hampering water supply for several months.
Almost all telephone exchange buildings and 60 per cent of telephone lines would be
defective for at least one month, as well as approximately 40 per cent of power lines and all
electricity substations. In addition, it is estimated that almost half of the bridges and many
narrow roads in the valley would be impassable due to damage or debris. Tribhuvan
International Airport would be isolated due to destruction of access bridges and roads. One
serious consequence could be that the arrival of international relief teams and assistance by
air would be delayed and complicated due to collapsed structures.
Source: [62]

32
S I T U AT I O N O F C H I L D R E N A N D W O M E N I N N E PAL 2 0 0 6
(552 MW), followed by thermal power (57MW) and solar power (100 kW) [17]. Someelectricity is also imported from India. Of totalelectricity consumed in 2003/04, the industrialsector used 38.5 per cent, followed byhouseholds (37 per cent), commerce (six percent), export (eight per cent) andmiscellaneous (10.5 per cent) [17].
Communications infrastructurePostal services cover the whole country, andthe international money order service includesIndia, Jordan, Qatar, Thailand and Hong Kong[17]. This is important for overseas workerssending remittances to their families.
Telecommunications have expanded rapidlyover the last decade to include mobiletelephone, Internet and email services as wellas more traditional terrestrial telephone andfax services. There are also an increasingnumber of satellite telephone providers.Nepal Telecommunications Corporation is thegovernment operator, with a wide variety ofprivate licensees. Since 1995, there hasbeen a nearly fivefold increase in the numberof telephone lines from just under 83,000 toover 433,000 [17]. By 2004, over 57 per cent ofVDCs had a telephone connection [17].
For its population, Nepal has a remarkablevariety of print media. As of mid-March 2005,about 4050 publications of various types hadbeen registered with the government [17].These included 298 daily newspapers, 1400weeklies and 1230 monthly magazines; over2800 of these are in Nepali, 336 in English,and the remainder are in other languagesincluding Hindi, Newari, Maithili, Bhojpuri,Tibetan, Tharu, and Urdu [17].
Television services have also expanded inrecent years. In 2004, Nepal Television (NTV)could reach 65 per cent of the population [17].Three private Nepali television companies arealso broadcasting. National televisiontransmission extends throughout the day andwell into the night. In addition, there are 326cable television operators licensed, showing ahuge variety of international programmes inmany languages around the clock [17]. Justover 13 per cent of all households own atelevision (59 per cent in urban areas andeight per cent in rural areas) [1].
had signed Memoranda of Understanding orAir Service Agreements with 34 foreign airlinesor countries. Twenty-one foreign cities in 13countries were directly linked to Kathmandu,contributing significantly to the expansion ofNepal’s external trade [63].
EnergyThere is a considerable imbalance betweenresource endowment and use in Nepal. Hydro-power has great potential, but it is not widelyexploited, resulting in continued heavyreliance on other energy sources. The percapita energy consumption at around 15 GJ isone of the lowest in the world [65]. Thecountry’s energy consumption is expected toreach over 8600 tonnes of oil equivalents in2004/05 [17]. Traditional energy sourcesaccount for 87 per cent of consumption,commercial sources account for 12.5 percent, and the rest is supplied from renewablesources [17]. In 2003/04, fuelwood represented78 per cent of energy sources and petroleumproducts represented nine per cent. Othersources include agricultural by-products,animal waste, coal, and electricity. Collectingfuelwood is traditionally considered a woman’sjob in Nepal.
Although electricity is available in all districtsof the country, it is only accessible to a smallpercentage of the population, and the servicecan be erratic. About 40 per cent ofhouseholds have electricity nationwide but, inrural areas, coverage is only a quarter [44]. In2004/05, there were estimated to be about 1.2million electricity consumers [17]. The mainsupply of electricity in Nepal is hydro-power
Millennium Development Goals for information and
communication technologies
In 1990, there were 0.32 telephone lines and cellular
subscribers per 100 people. By 2003, this had risen to
1.78 per 100 people.
In 1993, there were 0.05 personal computers in use per
100 people. By 2002, this had risen to 0.37 per 100
people.
In 1990, the Internet was yet to reach Nepal. By 2002,
there were 0.34 users per 100 people.
Source: [64]

33
B A C K G R O U N D
Radio Nepal’s short-wave transmissionreaches 100 per cent of the population, andits medium-wave transmission reaches 83per cent [17]. Since the early 2000s, FMtransmission has been opened up to theprivate sector, and there are now at least 48private FM stations [17]. About 44 per cent ofhouseholds own a radio, and 39 per cent ofall women and 55 per cent of all men listento the radio everyday [1].
Following the State of Emergency on 1February 2005, the Nepali media weresubjected to severe restrictions. Manyjournalists were imprisoned, newspaperswere heavily censored, and FM stations werebanned from broadcasting news. While thedegree of censorship has been relaxed sincethe lifting of the emergency, many journalistsstill feel under threat and fear reprisals fromthe government. In May 2005, an ordinancewas promulgated that restricted mediaownership and broadcasting operations, andlaid out fines and punishment for publicationof anything deemed defamatory to the Kingor the royal family. The airing of news by FMradio stations is formally banned by themedia ordinance; however, the SupremeCourt ruled in August 2005 that no actioncould be taken against FM stations thatdefied the ban.
THE TENTH FIVE-YEAR PLAN
The overall goal of the Tenth National Five-Year Development Plan (2002/03–2006/07) isto reduce poverty. The main strategies—the‘four pillars’—of the plan are (a) broad-basedeconomic growth that focuses on rural areas;(b) social sector development, includinghuman development; (c) social inclusion ofthe poor, marginalized groups, and regions;and, (d) good governance, as a means ofboth delivering better development resultsand ensuring social and economic justice.The Tenth Plan also seeks to redefine therole of the State by limiting publicinterventions, enlisting the private sector,NGOs, INGOs and community-basedorganizations in service delivery, andpromoting community participation andaccelerated decentralization. Different frompast plans, the Tenth Plan has also
incorporated the Medium-Term ExpenditureFramework; this framework identifies priorityprojects for meeting targets, and ensuresthat adequate resources are allocated tothem. The plan also envisages ‘normal case’and ‘low case’ scenarios: the formerenvisages a resolution to the current conflictand an annual GDP growth rate of 6.2 percent, while the latter assumes thecontinuation of insecurity and a lower GDPrate of 4.3 per cent.
The budget allocations for the Tenth Plan areset out in Table 5. The Tenth Plan budgetallocations seek to maintain the emphasison the social sector, increase the allocationto the agriculture sector, and reduceallocations to sectors where privateinvestment is expected, such as financeservices, tourism, manufacturing, electricityand transport.
Over the years, the proportion of the budgetspent on regular expenditure has been risingat the expense of development expenditure.In the early 1990s, the share of thedevelopment budget in governmentexpenditure was nearly two-thirds. Now, two-thirds is spent on the regular budget coveringrecurrent costs, and the budget fordevelopment activities has declined to one-third (Figure 8) [66]. The shift is attributableto increased spending on security in theregular budget [67]. Between 1997 and 2003,security expenditure rose nearly threefold,while development expenditure declined [67].
FIGURE 8:
Development expenditure as a proportion of totalgovernment expenditure
����
�
3/3,34353-323136303/33
/00,804
/004805
/00580-
/00-802
/002801
/001806
/006800
/000833
,33383/
,33/83,
,33,834
,334835
,33583-
Source: [66]

34
S I T U AT I O N O F C H I L D R E N A N D W O M E N I N N E PAL 2 0 0 6
Despite the reduction in the developmentexpenditure, the expenditure on socialsectors, and particularly basic social services,has not declined significantly (Figure 9). Ofconcern is the gradual increase on securityspending, which has overtaken spending onbasic social services. Following the 20/20
Initiative at the World Summit for SocialDevelopment in 1995, Nepal has attempted toallocate 20 per cent of its national budget tobasic social service programmes. Nepal’spublic expenditure on basic social servicesincreased from about 10 per cent in 1992 toabout 14 per cent in the mid-1990s, and hassince then fallen to around 12 per cent [68].
As with many other developing countries,Nepal depends heavily on foreign aid forsupporting its development activities. Foreignaid has been between NRs 15 billion and NRs20 billion since the late 1990s, and constitutesabout 20 per cent of government expenditurein the Tenth Plan. In 2004/05, it totalled nearlyNRs 35 billion (or about US$ 285 million), with66 per cent as grants and 34 per cent asloans [17]. Foreign aid comprises approximatelyhalf to two-thirds of the developmentexpenditure. A study estimated that, for Nepalto meet the Millennium Development Goals,US$ 7.6 billion of foreign aid would be requiredbetween 2005 and 2015 [69].
Nepal’s fiscal management has been prudentthroughout the 1990s, with public sector debtrelatively stable at around two-thirds of GDP[52]. The ratio of net outstanding loan to total
Note: Social services includes education, health, drinking water and local development
TABLE 5: Sectoral allocation of development expenditure for the Tenth Plan (NRs in billions)
Sectors
Agriculture, Irrigation and Forestry 32.7 19.2 56.2 24.0 42.6 32.9
Non-agriculture 137.1 80.8 177.8 76.0 135.8 76.1
Social Services 61.1 36.0 90.4 38.6 69.0 38.7
Industry and Mining 2.7 1.6 2.3 1.0 1.7 1.0
Electricity, Gas and Water 30.8 18.1 36.0 15.4 27.0 15.1
Trade, Hotel and Restaurant 3.2 1.9 3.5 1.5 2.7 1.5
Transport and Communication 29.8 17.6 36.4 15.6 28.3 15.9
Finance and Real Estate 6.6 3.9 2.7 1.2 2.1 1.2
Miscellaneous 2.9 1.7 6.5 2.8 4.9 2.8
Total 169.8 100.0 234.0 100.0 178.4 100.0
Achieved inNinth Plan
Tenth Plan target‘normal case’
Proposed in TenthPlan ‘lower case’
Amount Per centAmount Per centAmount Per cent
3=
-=
/3=
/-=
,3=
,-=
/006800 /000833 ,33383/ ,33/83, ,33,834
"� ��������� � ���������
������
"� �� ������
"� �������
"#������
FIGURE 9:
Share of government expenditure
Source: [68]

35
B A C K G R O U N D
GDP was 47 per cent in 2003/04 [17]. In2004/05, net outstanding foreign loans totalledNRs 233 billion [17].
ROLE OF NGOs AND INGOs
After the advent of multiparty democracy, thecountry witnessed an explosion of NGOs. Thecurrent number of NGOs is difficult toestimate. Approximately 18,000 NGOs areregistered with the Social Welfare Council[70]. However, some sources estimate that theactual number could be double, at about30,000 [71]. The capacity of local NGOs isvariable. The majority work in the socialservices sector. They have been successful atchannelling external resources to providevarious kinds of services, especially in theareas of community health, sanitation, out-of-school education, birth registration, etc.However, they have had limited success inlobbying and advocacy for children’s andwomen’s rights, and in reachingdisadvantaged groups.
NGOs are effective at mobilizing localresources and carrying out effective, low-costsocial mobilization; and they are seen bycommunities as legitimate actors in lobbyingand advocacy, as they display accountabilityand responsiveness to their target groups.Importantly, they are able to carry on theiractivities in conflict-affected areas. SomeNGOs have reached a certain level ofsustainability, and a few are beginning tobecome independent. However, the majoritystill depend on external sources for fundingand capacity building.
A significant amount of money is spent byINGOs in Nepal on providing basic services atvarious levels. Most INGOs implement throughlocal NGOs, by building local capacity. Someimplement directly and a handful work throughthe government. There were about 125 INGOsregistered with government in 2004/05 [72].The estimated annual expenditure by INGOsis NRs 5–6 billion a year [72]. This is theequivalent to about 15 per cent of thegovernment’s development budget. Ministry ofFinance estimates are slightly lower, sincemany INGO budgets are not reflected in thegovernment budget.
The government promulgated a new ‘Code ofConduct’ for the I/NGO sector in November2005. While the need to improve coordinationand transparency in this sector is widelyaccepted, the move sparked widespreadprotests as the code sets a range of restrictionswith regard to membership, objectives,programming, access to funding, and more. Themain bilateral donors and UN agencies in Nepalstated together that they believe the Code ofConduct provides a means for undue politicalinterference and that by undermining theindependence of I/NGOs it is likely to hindercritical development activities [73].
ADMINISTRATIVE STRUCTURE
The Constitution of the Kingdom of Nepal waspromulgated on 9 November 1990, and is basedon democratic principles, the multipartysystem, and a constitutional monarchy.According to the Constitution, there are twoHouses of Parliament: an Upper Houseconsisting of 60 members, and a House ofRepresentatives consisting of 205 members. Afive per cent quota for women representatives ismandated in the Constitution. However,parliament has been dissolved since May 2002,and the passage of government bills has beenby ordinance.
His Majesty’s Government, the officialdesignation for the government of Nepal,consists of a Council of Ministers, led by thePrime Minister. However, since February 2005,this cabinet has been under the leadership ofthe King. Each Minister heads a ministry,although Ministers may hold more than oneportfolio. The civil service, which assists theMinisters in carrying out the ministries’functions, is headed by Secretaries. Thenumber and various levels of civil servants in aministry depends on the latter’s functions. Forcertain ministries, the civil service may consistof departments or similar bodies. Manyministries, although not all, haverepresentatives at the regional and districtlevels. The number of permanent civil servicepositions has increased from 7000 in 1950 to97,272 in 2004/05 [74]. The estimated totalnumber of government functionaries is over400,000, including military, police staff andteachers.

36
S I T U AT I O N O F C H I L D R E N A N D W O M E N I N N E PAL 2 0 0 6
Administratively, Nepal has five DevelopmentRegions, 14 zones, 75 districts, about 4000VDCs (this term is used interchangeably tomean both the area that is administered andthe committee that carries out theadministration), and 36,000 wards orsettlements. The ilaka is an administrativeservice level between the district and theVDC level. There are nine ilaka per district.Constituency boundaries used for electionshave been developed across administrativedivisions and have been delineated withregard to population size rather thanexisting ilaka boundaries.
At the district level, District DevelopmentCommittees (DDCs), Municipal Councilsand Village Development Committees(VDCs) are elected to carry out developmentwork in districts, towns and villages. Thereare also ward-level committees. In theabsence of elected officials, the functions ofthese committees have been assumed bygovernment employees: the LocalDevelopment Officer at the district level, theExecutive Secretary in municipalities, andthe Village Secretary at the village level.
The five Development Regions containregional offices for almost all the ministriesand central departments. At the district level,each of the departmental or ministry officesoversees the plans and programmes for that
sector. The role of the Chief District Officer(CDO) in each of the 75 districts is to maintainlaw and order in the district, and oversee thework of district-level line agencies. The LocalDevelopment Officer (LDO) is responsible forcoordinating development at the district level. Amarked feature of the district-level structure,noted time and again, is the lack ofcoordination between, and duplication ofactivities among, district-level offices andprogrammes. Ministries such as education,health and agriculture have their servicesavailable at the DDC/VDC level.
DECENTRALIZATION
The Local Self-Governance Act 1999 hasprovided a powerful impetus for decentralizedgovernance in Nepal. It providesunprecedented latitude and leverage to localgovernment bodies (DDCs, municipalities,and VDCs) to mobilize their own resources(taxes, service charges, fees, etc.) andimplement development activities. In thesocial sector, this law makes importantprovisions for women, children anddisadvantaged sections of society toparticipate in the development process [75].However, in the absence of electedgovernment bodies since July 2002, and withincreasing security risks for governmentofficials travelling outside district
UN
ICE
F/N
EP
/IM
AG
E 0
13
42
/ H
LA
UR
EN
GE

37
B A C K G R O U N D
headquarters, decentralization efforts havebeen somewhat hampered.
Important policy reforms have been introducedat the national level. A DecentralizationImplementation Plan (DIP) has been preparedto operationalize provisions in the act throughtime-bound actions. Since 2002/03, thegovernment has attempted to devolve foursectors—primary education, primary health,agriculture, and postal services—to localbodies [75]. Over 50 DDCs have preparedperiodic plans of 5–6 years duration [75]. Localbodies have become organized intoassociations and are raising their voices toprotect their interests. They have been pushingfor a higher degree of decentralization.
The essence of Nepal’s decentralization planis to take decentralization beyond mere policyreform and technical and bureaucraticdeconcentration of responsibilities. Itenvisages a social movement that will changethe balance of power and transform society.Elected officials, by virtue of theirrepresentation, are held accountable by thepeople of their constituency and are expectedto facilitate the social movement. Although thevision of decentralization is clearly recognizedby the sections of the government systemthat are most closely involved in implementingthe Local Self-Governance Act, it is yet to befully internalized throughout the governmentsystem and by some stakeholders in thedevelopment arena. In the absence of a unifiedvision, sectoral ministries and their lineagencies have at times shaped their ownversions of decentralization. This had led to arange of implementation modalities that havereached different points on thedecentralization continuum [75].Inconsistencies between the current legal andpolicy frameworks have also posedchallenges. However, gaps have beenacknowledged and there are efforts underwayto try to remedy any misalignments.
At present, each VDC receives a block grant ofNRs 300,000 per year to spend as it chooses.At present, there is no variation in the size ofthe grant based on VDC size or population.DDCs also receive an annual block grant from
the central government. This amount varies fromdistrict to district, depending on needs andabsorption capacity. These funds can be spentas the local government sees fit, and come inaddition to funds from line ministries that havetrickled down to the district level.
THE REGIONAL CONTEXT
Nepal has been a member of the South AsianAssociation for Regional Cooperation (SAARC)since the association was established inDecember 1985. SAARC comprisesAfghanistan, Bangladesh, Bhutan, India, theMaldives, Nepal, Pakistan and Sri Lanka. Itwas established with the objectives ofpromoting the welfare of the people of SouthAsia and effecting an improvement in theirquality of life; accelerating economic growth,social progress and cultural development in theregion; and strengthening collective self-reliance among the member countries.
SAARC is essentially an economic grouping ofcountries which, due to similar levels of povertyand related development conditions, havedecided to work together to accelerate thepace of regional socio-economic development.SAARC’s current activities cover the areas ofagriculture, forestry, health, population, womenin development, rural development,telecommunications, meteorology,transportation, science and technology, postalservices, sports, arts and culture, andprevention of drug trafficking and abuse. Socialand cultural cooperation are considered to benecessary for greater economic and politicalcohesion. The SAARC Summit held in Male,the Maldives, endorsed the Goals for Childrenand Development for the 1990s and declared the1990s to be the Decade of the Girl Child. TheSeventh SAARC summit, held in Dacca in 1993,endorsed plans of action prepared by SAARCcountries to achieve the goals of the 1990 ChildSummit. The decade 2001–2010 has beendeclared the SAARC Decade of the Rights ofthe Child. The most recent SAARC summit inIslamabad in January 2004 adopted a socialcharter giving broad directions for social strategyand policy in the member states.