sito publication
TRANSCRIPT
Financial Services
The complexity imperative:
How Financial Services firms must grapple with the fundamental reality that their business operations and systems are too complex
2 Copyright © 2009 Oliver Wyman
Introduction
For senior executives facing the turbulence of today’s financial crisis, reducing the cost base of their business operations now sits squarely at the top of the agenda. After decades of product and service variation, channel diversification and geographic and operational expansion, all supported by layers upon layers of technology, many institutions are finally compelled to deal with a fundamental reality: their businesses are overly complex for the value they generate. Not only is this “excess” not valued by customers, it actually impedes value delivery, by limiting the sales force’s ability to respond, increasing service and fulfillment costs, compounding operational risk and making the organization more unwieldy to manage. The siren call for a simpler “core business” approach, incorporating elements of modular design and industrial engineering, is again being heard across the industry.
Customers are rebelling against overly complex products. To sustain success, firms must adopt the philosophy of fewer, simpler products that are engineered for low cost delivery and ease of consumption. This is a major shift in customer sentiment from the drivers of profitability over the last 15 years, and adaptation will not be culturally easy for most firms.
Grappling with underlying complexity is a thorny challenge for organizations that achieved success under a “more is better” philosophy but are now sitting atop successive generations of operations and systems decisions that cannot easily be unwound.
This paper explores the nature of the underlying business complexity in financial services – how to evaluate and get at it, and how to begin to transform the enterprise into a more flexible and scalable business. Using a case study of a leading consumer finance company that achieved 25% improvement in operating efficiency and 40% in IT, we show how it is possible to make substantial progress in complexity reduction by applying a “front-to-back optimization” approach focused on the drivers of complexity.
3Copyright © 2009 Oliver Wyman
1. Business “over-complexity” – the kudzu of financial services operations
Complexity comprises several distinct yet inter-related characteristics. In practical terms, complexity may entail:
� Too many process or product variants
� Too many interdependencies and interfaces
� Process bottlenecks and fragmentation
� Technology legacy proliferation
� Lack of structure and clear rules
� High cost and management effort attributed to running and improving the organization
Executives rarely use the words “managing complexity” when describing the challenge of upgrading the operational performance of their organizations. Instead, they struggle to cope with the symptoms of complexity – issues that have arisen out of underlying business decisions, policies and practices over time.
The following quotes from a sample of banking and insurance clients put voice to typical manifestations of the complexity problem (see Exhibit 1):

4 Copyright © 2009 Oliver Wyman
Exhibit 1: Representative quotes from Oliver Wyman clients
“Introducing a new mortgage product takes us 3 months – three times as long as it takes our competitors.”
“We have been through two cost cutting rounds in the last four years; both generated about 15% savings, but costs bounced back to prior levels two years later. After all our efforts, we are still 30% less efficient than competition – they seem to have much leaner and more automated processes.”
“We have to cope with sub-optimal customer satisfaction stemming from multiple client interfaces and too many hand-offs leading to potential errors or miscommunication”
“The new tariff model for our life insurance policies required a 2 month IT project and an investment of half a million Euros; after it was implemented, there were major disruptions in the sales and servicing areas because the process changes were unclear for many staff members.”
“Instead of enabling our business, our IT architecture seems to restrict it. We hear too often from IT that even small change requirements ‘require significant investment’ or ‘will require a major redesign of legacy systems’. I do not think we have a sustainable IT strategy.”
“We have 60 consumer finance products in our offering. The top 10 make up 80% of the revenue. We do not have a view of the relative profitability of products. We question whether our product breadth gives us an advantage over competitors – what we do know is that it makes us inefficient and costly.”
Certainly, the current financial crisis has raised the visibility of the pernicious effects of business complexity. Revenues everywhere are under pressure. Geographic expansion is being questioned. Product diversification, especially in the “synthetic” space, has mutated from a growth engine to a dysfunctional and risky adventure for most players. But when senior executives take the first steps toward “dialing down” complexity, they rapidly come up against three immutable features that overshadow their ability to make change in their environment:
1. Complexity is structural; deeply-embedded in the business and operating models of their institutions
2. Complexity is cultural; organizations have been unintentionally designed to produce complexity based on behavior that has driven profits over the last several years
5Copyright © 2009 Oliver Wyman
3. The linkages between delivery systems and product organizations have grown in an unstructured manner instead of being engineered to avoid unnecessary complexity
4. Without clear top-down definition of value to the customer, organizations will freelance and create overly complex operations, processes and systems
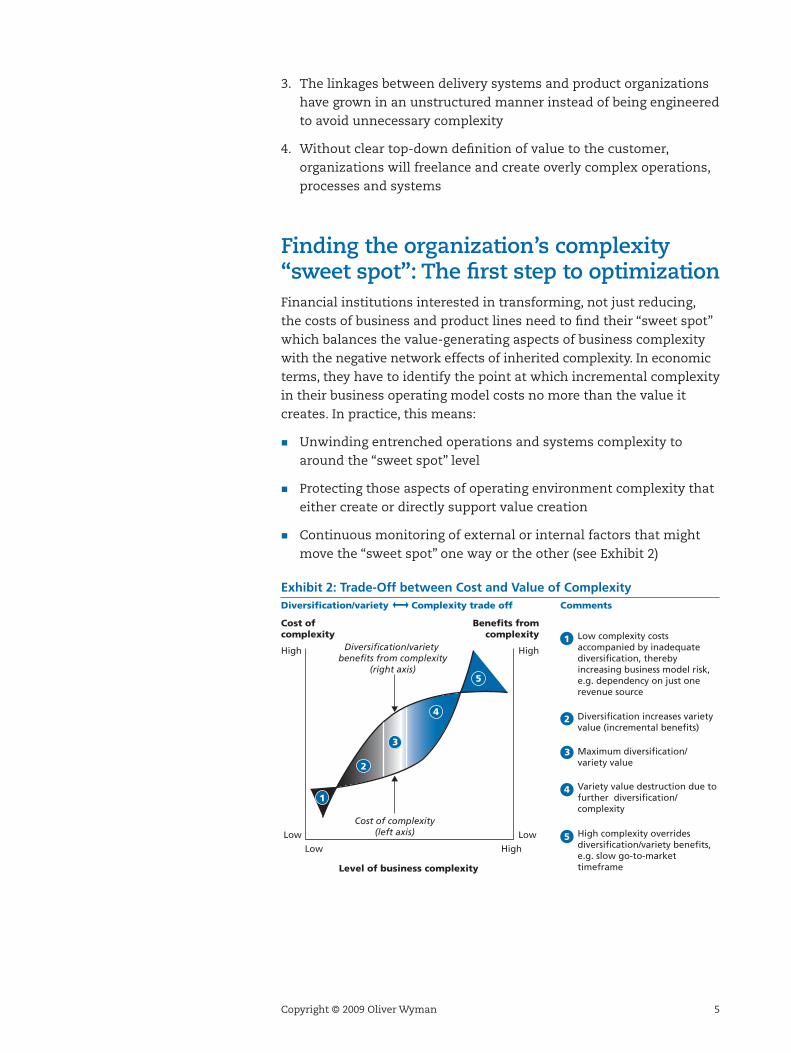
Finding the organization’s complexity “sweet spot”: The first step to optimizationFinancial institutions interested in transforming, not just reducing, the costs of business and product lines need to find their “sweet spot” which balances the value-generating aspects of business complexity with the negative network effects of inherited complexity. In economic terms, they have to identify the point at which incremental complexity in their business operating model costs no more than the value it creates. In practice, this means:
� Unwinding entrenched operations and systems complexity to around the “sweet spot” level
� Protecting those aspects of operating environment complexity that either create or directly support value creation
� Continuous monitoring of external or internal factors that might move the “sweet spot” one way or the other (see Exhibit 2)
Exhibit 2: Trade-Off between Cost and Value of ComplexityDiversification/variety Complexity trade off Comments
Low complexity costs accompanied by inadequate diversification, thereby increasing business model risk, e.g. dependency on just one revenue source
Diversification increases variety value (incremental benefits)
Maximum diversification/variety value
Variety value destruction due to further diversification/complexity
High complexity overrides diversification/variety benefits, e.g. slow go-to-market timeframe
Cost of complexity
Benefits fromcomplexity
High
Low
High
Low
Diversification/variety benefits from complexity
(right axis)
Cost of complexity(left axis)
Low High
Level of business complexity
1
2
3
4
5
1
2
3
4
5

6 Copyright © 2009 Oliver Wyman
Today’s economic climate is driving a renewed focus on front-to-back cost structure among financial institutions that want to fundamentally rationalize their business model or cost base. While short-term measures, such as headcount reduction through de-layering, are regularly adopted by organizations looking to contain costs, these costs tend to creep back over time because their structural causes have not been addressed. Plainly stated, financial institutions have too many non value-adding products and service variants, fragmented pricing and distribution models, and manual-intensive and siloed processes – all based on an unwieldy and expensive to modify IT “architecture”. Best-in-class approaches we have observed emphasize addressing root cause complexity by streamlining business and delivery models from the client interface in the front office all the way to the back office. Such “front-to-back” complexity reduction approaches remove costs radically and sustainably – and, importantly, without destroying value.
7Copyright © 2009 Oliver Wyman
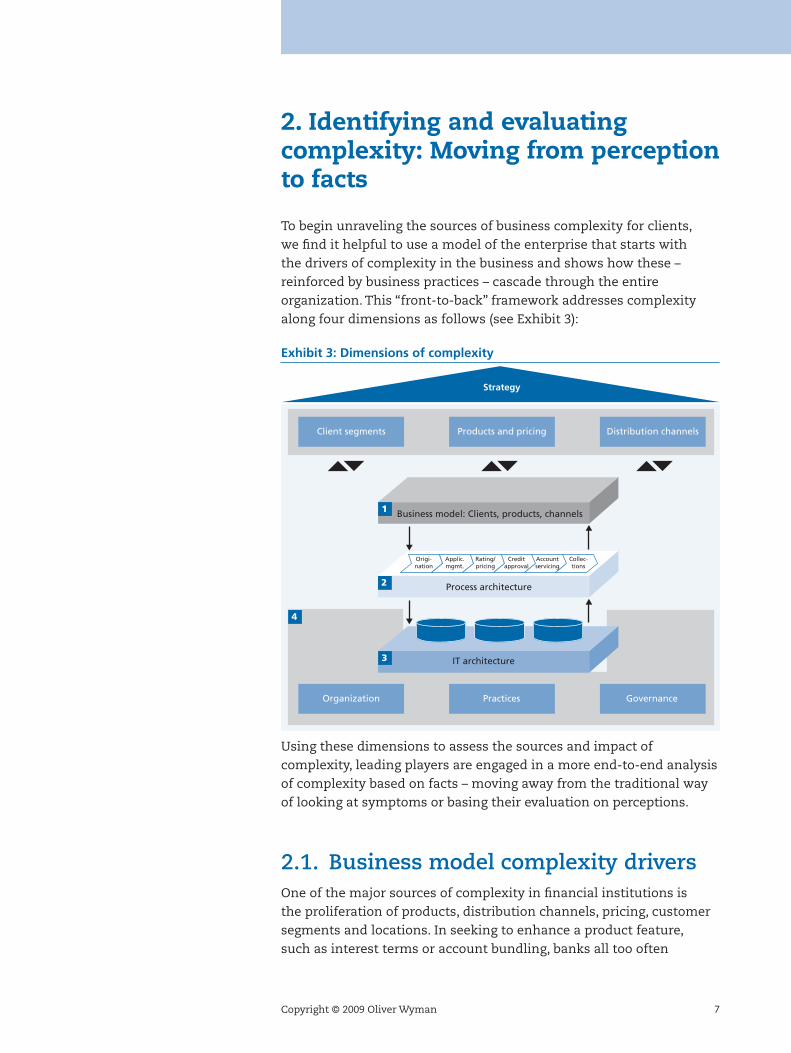
To begin unraveling the sources of business complexity for clients, we find it helpful to use a model of the enterprise that starts with the drivers of complexity in the business and shows how these – reinforced by business practices – cascade through the entire organization. This “front-to-back” framework addresses complexity along four dimensions as follows (see Exhibit 3):
Exhibit 3: Dimensions of complexity
Client segments Products and pricing Distribution channels
Organization Practices Governance
IT architecture
Business model: Clients, products, channels1
Process architecture
Origi-nation
Applic.mgmt.
Rating/pricing
Creditapproval
Accountservicing
Collec-tions
2
3
4
Strategy
Using these dimensions to assess the sources and impact of complexity, leading players are engaged in a more end-to-end analysis of complexity based on facts – moving away from the traditional way of looking at symptoms or basing their evaluation on perceptions.
2.1. Business model complexity drivers One of the major sources of complexity in financial institutions is the proliferation of products, distribution channels, pricing, customer segments and locations. In seeking to enhance a product feature, such as interest terms or account bundling, banks all too often
2. Identifying and evaluating complexity: Moving from perception to facts
8 Copyright © 2009 Oliver Wyman
simply added a new product where they lacked a product framework (i.e., structured, modular, hierarchical) that could differentiate between a new product, an existing product variant, a new product feature, a product parameter, or the associated service dimensions – and facilitate rationalization. From a sales perspective, this can compromise effectiveness as the sales force has to come to grips with a myriad of new products and pricing schemes, and the training department scrambles to design the appropriate curriculum. From an operations perspective, each new product or variant entails its own set of business rules. Managing these business rules efficiently is a challenge because the associated systems are not flexible enough to support the new requirements in a standardized way. As a result, systems must be heavily modified and the processes surrounding them become increasingly customized and siloed. This product dynamic translates into higher cost of complexity than the value to the customer and the cost-of-sales would warrant.
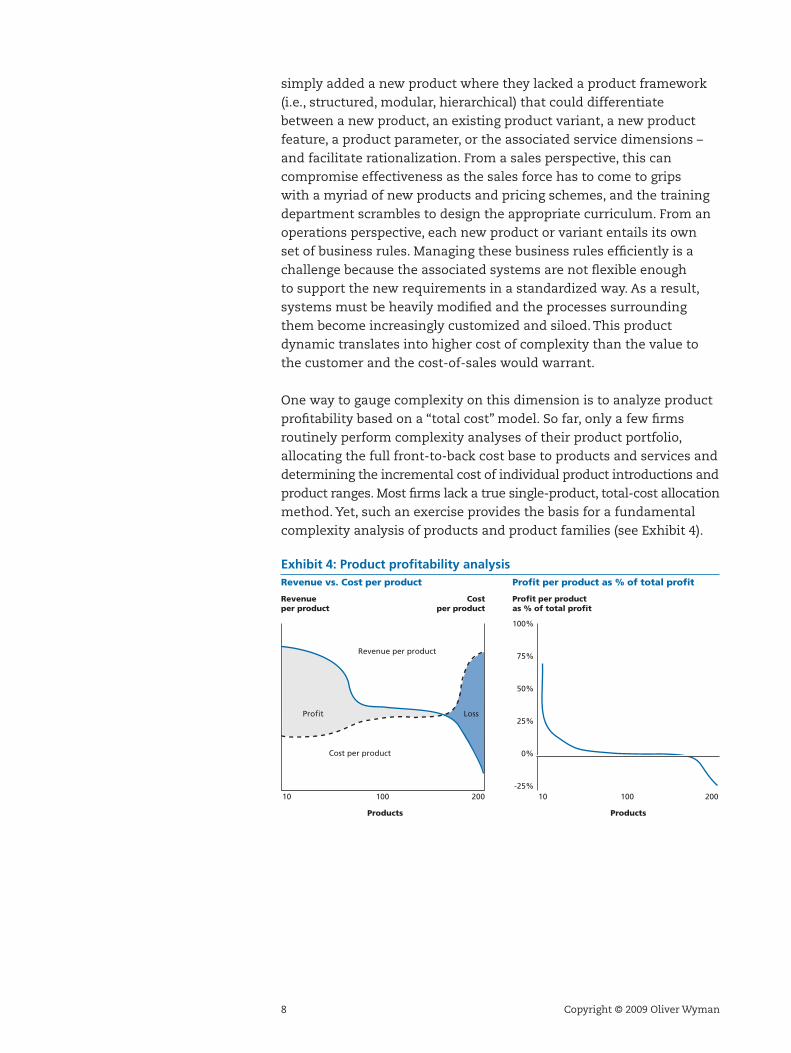
One way to gauge complexity on this dimension is to analyze product profitability based on a “total cost” model. So far, only a few firms routinely perform complexity analyses of their product portfolio, allocating the full front-to-back cost base to products and services and determining the incremental cost of individual product introductions and product ranges. Most firms lack a true single-product, total-cost allocation method. Yet, such an exercise provides the basis for a fundamental complexity analysis of products and product families (see Exhibit 4).
Exhibit 4: Product profitability analysisRevenue vs. Cost per product Profit per product as % of total profit
Revenue per product
Costper product
Products
Revenue per product
Cost per product
10 100 200
Profit Loss
Profit per product as % of total profit
100%
75%
50%
25%
0%
-25%
Products
10 100 200
9Copyright © 2009 Oliver Wyman
In multi-line financial institutions, the typical result of such analysis yields the following:
� Some products and product clusters are inherently unprofitable. If they get eliminated along with the supporting cost base (which is the challenge), value will be created, not destroyed
� Another set of products can be made profitable by simplifying and streamlining their main features, e.g. as part of a “product architecture”
� Only a smaller number of products (with higher volumes) are truly profitable and/or differentiating in the market; resources should be focused on this set of products
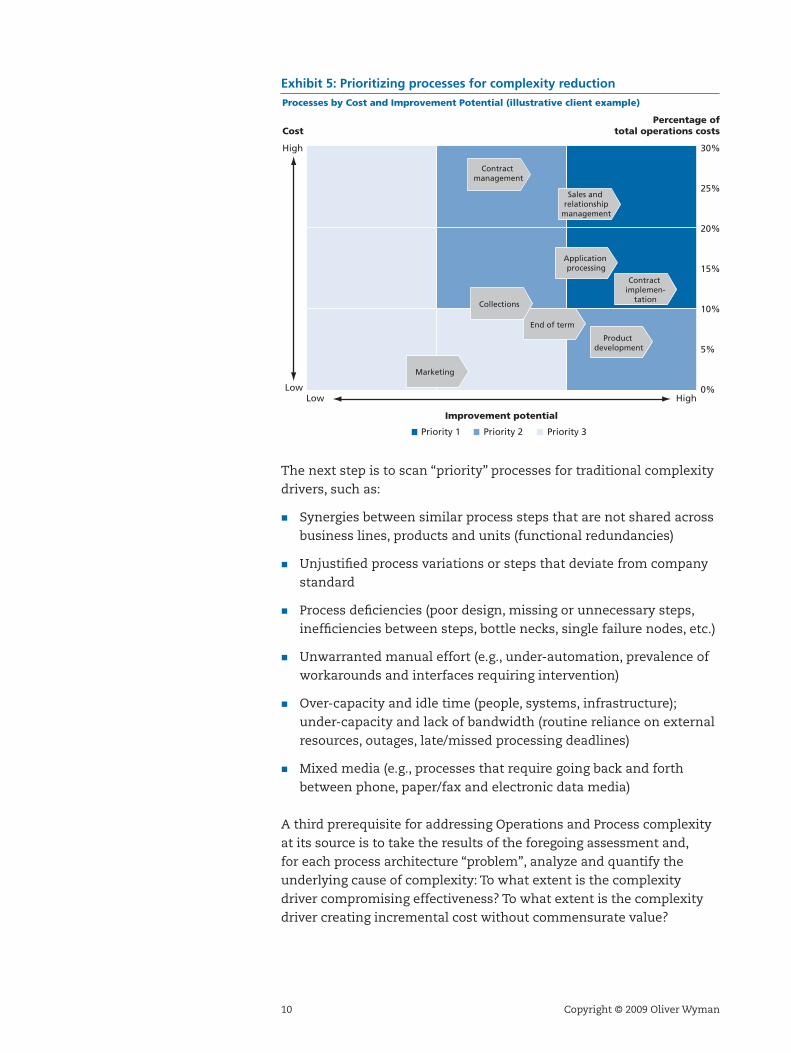
2.2. Operations and process complexity drivers Complexity in operations and process can be caused by over-customization, lack of automation, inflexibility in process design or application (e.g. a “one size fits all” process), and even unclear process ownership and roles. A more structural consideration is the complexity caused by duplicated and redundant functions. Duplication can stem from a variety of sources, but most typically from cultural or governance barriers that systematically prevent businesses from sharing operations or underlying technology, and from unfinished acquisitions, i.e., with incomplete operational or technical integration. A key success factor in complexity reduction in this arena is to focus on the highest value/highest cost components of the business and delivery model. For operations this suggests focusing on operations cost per process as a percentage of total process costs and the value-add of the process in business terms.
Processes can thus be clustered and prioritized according to their share of overall cost and value (see Exhibit 5, illustrative client example).
10 Copyright © 2009 Oliver Wyman
Exhibit 5: Prioritizing processes for complexity reductionProcesses by Cost and Improvement Potential (illustrative client example)
Percentage oftotal operations costs
30%
25%
20%
15%
10%
5%
0%
High
Cost
LowLow
Improvement potential
High
Marketing
Contract management
Product development
Contract implemen-
tation
Application processing
Sales and relationship
management
Priority 1 Priority 2 Priority 3
End of term
Collections
The next step is to scan “priority” processes for traditional complexity drivers, such as:
� Synergies between similar process steps that are not shared across business lines, products and units (functional redundancies)
� Unjustified process variations or steps that deviate from company standard
� Process deficiencies (poor design, missing or unnecessary steps, inefficiencies between steps, bottle necks, single failure nodes, etc.)
� Unwarranted manual effort (e.g., under-automation, prevalence of workarounds and interfaces requiring intervention)
� Over-capacity and idle time (people, systems, infrastructure); under-capacity and lack of bandwidth (routine reliance on external resources, outages, late/missed processing deadlines)
� Mixed media (e.g., processes that require going back and forth between phone, paper/fax and electronic data media)
A third prerequisite for addressing Operations and Process complexity at its source is to take the results of the foregoing assessment and, for each process architecture “problem”, analyze and quantify the underlying cause of complexity: To what extent is the complexity driver compromising effectiveness? To what extent is the complexity driver creating incremental cost without commensurate value?
11Copyright © 2009 Oliver Wyman
The outcome of this analysis can form the basis for a comprehensive remediation program and is a necessary corollary to the investigation into the sources and causes of IT complexity.
2.3. Information technology complexity driversComplexity in the application systems and platforms arena can be caused by a variety of well-known factors such as inflexible, outdated code; overlapping and redundant systems; excessive patching and interfacing; technology proliferation; competing IT standards, vendors, architectures and philosophies; and immature or under-developed IT management practices.
The most severe handicap for addressing IT complexity reduction in a fundamental way is the investment typically required for such an exercise. Why this is such a challenge – beyond the multi-million dollar or Euro price tag – stems from a complicated dynamic of management will vs. average executive tenure, the inter-temporal nature of the investment vs. the realized benefit, and the generally reliable performance of legacy infrastructure (mainframes) vs. the hidden effects of compounding systems complexity over years. Unlike in a manufacturing plant where operational complexity is in plain view, the raw material of finance is information, and it is difficult for senior FS management to experience the “spaghetti” that characterizes their information processing plant. If they could, it might make it easier to gain consensus on the need for re-architecting and re-platforming core applications.
It is this compounding effect of business complexity on IT over time that must be understood (quantified) to break the cycle of successive layers of kudzu in the business operations over time. In our client experience, two sets of analyses are needed:
1. Identification of IT complexity drivers resulting from the business or operating model. IT systems architecture generally reflects underlying business requirements, responding to business demands. Thus, business complexity inevitably “propagates” into IT and creates a corresponding, but more persistent, level of complexity. This “persistence of legacy complexity” over time creates a non-linear increase in the complexity of IT, which is much harder to change than the business it supports
12 Copyright © 2009 Oliver Wyman
2. Examination of the main complexity drivers in IT itself. IT in turn can create cost and complexity back in the business if requirements are over-specified or not well implemented, systems are costly or unstable and services are spotty or of low quality. Typical analytic lenses would include:
– How many systems and applications deliver the same or similar functionality to the business?
– Which systems have a user base or actual usage below efficient scale?
– How many point-to-point interfaces are connecting applications and data stores?
– How many redundant or highly overlapping data stores are being accessed by different applications?
– What is the extent of additional efforts such as data consistency checks, data cleansing and data integrity analyses?
2.4. Governance and organizational complexity driversA fourth major instigator of complexity can often be traced to governance and organizational design. Many financial institutions have evolved structures, governance models, planning and budgeting processes that are prone to create non-value adding complexity. Moreover, autonomous organizations, along with decentralized incentives, motivate business heads to optimize their own units’ performance at the expense of externalizing complexity costs to the wider group.
Most often, there is no business-aligned “operating architecture” that would define the overall target operational blueprint across business model, operations and IT in a clear and binding way. This lack contributes to misalignment between businesses, operations and IT, and can lead directly to greater complexity. Similarly, long term planning that does not consider the choices and tradeoffs that could result in reducing or contributing to complexity is the norm and often does not go so far as to address standardization and sharing opportunities.
Finally, most financial institutions lack a market-emulating and transparent chargeback mechanism for shared IT and operational services which could make enterprise cost impacts more apparent and would permit establishing a “complexity tax” for decentralized decisions that increase costs to the group.
13Copyright © 2009 Oliver Wyman
Front-to-back complexity reduction is not easy, and it does not come for free. Rather, it requires material investments to effect the kind of high-impact change this paper describes. The benefit of addressing complexity at its source is not just a dramatically improved cost structure, but one that is more sustainable into the future. Leading organizations therefore combine structural complexity reduction initiatives with more traditional cost measures to allow for a degree of “self-funding”. The following client case provides a real-life example of what such a transformation can look like and the benefits to be gained.
Situation:
Our client, a major consumer finance company, had a complex product, process and IT architecture that was restricting its growth and had driven unit costs to levels far above peer averages. The company decided to launch a “back to basics” program aimed at reducing complexity front-to-back, targeting a 10% revenue lift and a 30% cost improvement within two years.
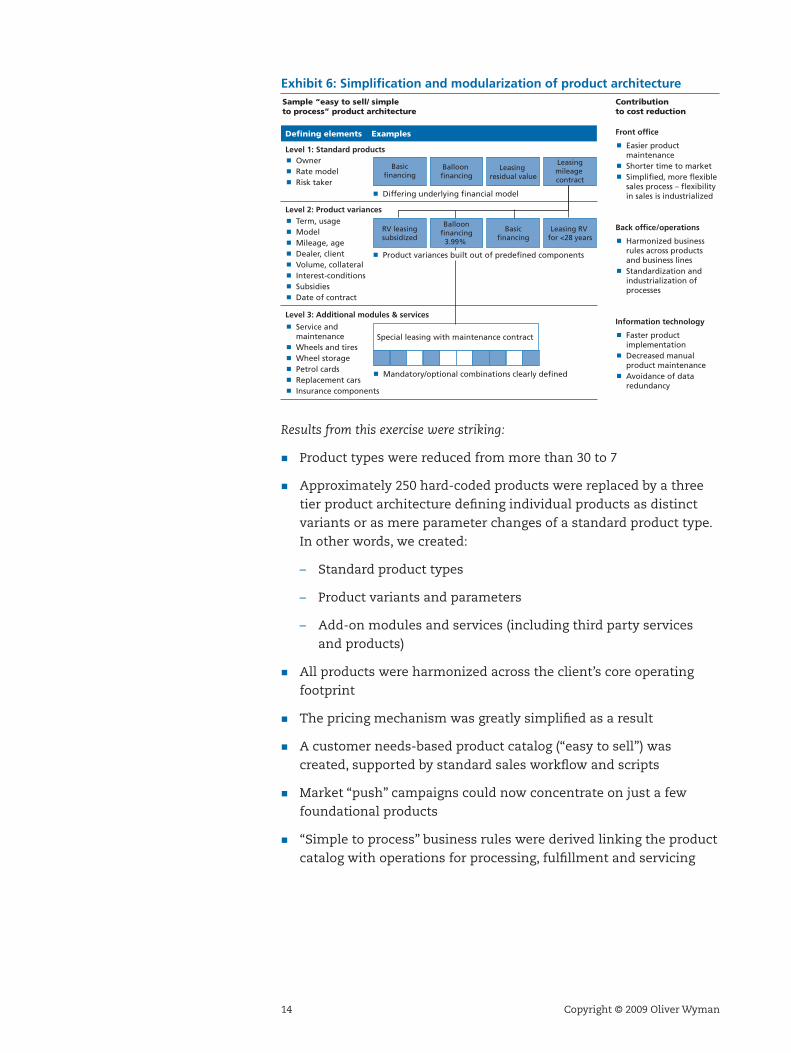
As a starting point, the company focused on simplifying its product portfolio. First, a decision on reducing the number of products was made based on quantitative analysis and strategic priorities. Second, the migration of customers of existing niche products to newly defined target products was carefully staged. Third, the remaining, most profitable and income-generating products were “disassembled” in a modular fashion as part of a coherent, “easy to sell, simple to process” product architecture (see Exhibit 6).
3. Case example: Making front-to-back complexity reduction a reality
14 Copyright © 2009 Oliver Wyman
Exhibit 6: Simplification and modularization of product architectureSample “easy to sell/ simple to process” product architecture
Level 1: Standard products
Level 2: Product variances
ExamplesDefining elements
Owner Rate model Risk taker
Term, usage Model Mileage, age Dealer, client Volume, collateral Interest-conditions Subsidies Date of contract
Level 3: Additional modules & services
Service and maintenance Wheels and tires Wheel storage Petrol cards Replacement cars Insurance components
Basicfinancing
Balloon financing
Leasing residual value
Leasingmileage contract
Front office
Easier product maintenance Shorter time to market Simplified, more flexible sales process – flexibility in sales is industrialized
Back office/operations
Harmonized business rules across products and business lines Standardization and industrialization of processes
Information technology
Faster product implementation Decreased manual product maintenance Avoidance of data redundancy
Contribution to cost reduction
Differing underlying financial model
RV leasing subsidized
Basicfinancing
Leasing RV for <28 years
Special leasing with maintenance contract
Mandatory/optional combinations clearly defined
Balloonfinancing
3.99%
Product variances built out of predefined components
Results from this exercise were striking:
� Product types were reduced from more than 30 to 7
� Approximately 250 hard-coded products were replaced by a three tier product architecture defining individual products as distinct variants or as mere parameter changes of a standard product type. In other words, we created:
– Standard product types
– Product variants and parameters
– Add-on modules and services (including third party services and products)
� All products were harmonized across the client’s core operating footprint
� The pricing mechanism was greatly simplified as a result
� A customer needs-based product catalog (“easy to sell”) was created, supported by standard sales workflow and scripts
� Market “push” campaigns could now concentrate on just a few foundational products
� “Simple to process” business rules were derived linking the product catalog with operations for processing, fulfillment and servicing
15Copyright © 2009 Oliver Wyman
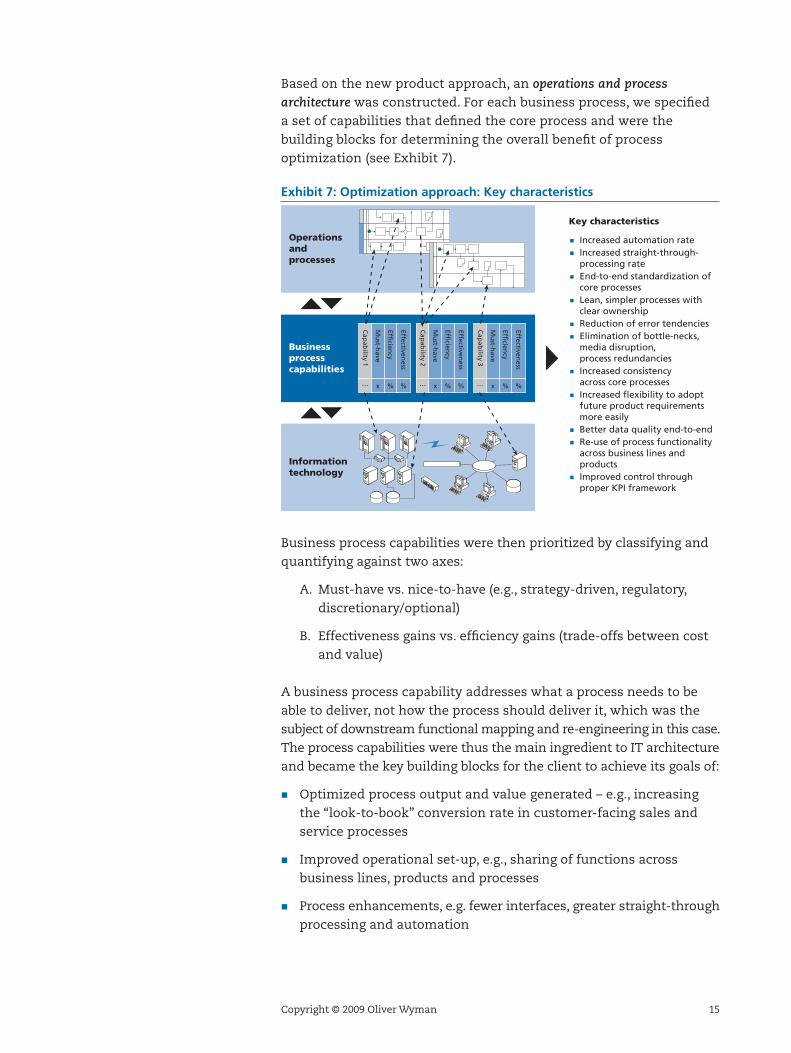
Based on the new product approach, an operations and process architecture was constructed. For each business process, we specified a set of capabilities that defined the core process and were the building blocks for determining the overall benefit of process optimization (see Exhibit 7).
Exhibit 7: Optimization approach: Key characteristics
Increased automation rate Increased straight-through- processing rate End-to-end standardization of core processes Lean, simpler processes with clear ownership Reduction of error tendencies Elimination of bottle-necks, media disruption, process redundancies Increased consistency across core processes Increased flexibility to adopt future product requirements more easily Better data quality end-to-end Re-use of process functionality across business lines and products Improved control through proper KPI framework
Key characteristics
Operations and processes
Business process capabilities
Informationtechnology
Effectiveness
Efficien
cy
Mu
st-have
Cap
ability 1
… % %x
Effectiveness
Efficien
cy
Mu
st-have
Cap
ability 2
… % %x
Effectiveness
Efficien
cy
Mu
st-have
Cap
ability 3
… % %x
Business process capabilities were then prioritized by classifying and quantifying against two axes:
A. Must-have vs. nice-to-have (e.g., strategy-driven, regulatory, discretionary/optional)
B. Effectiveness gains vs. efficiency gains (trade-offs between cost and value)
A business process capability addresses what a process needs to be able to deliver, not how the process should deliver it, which was the subject of downstream functional mapping and re-engineering in this case. The process capabilities were thus the main ingredient to IT architecture and became the key building blocks for the client to achieve its goals of:
� Optimized process output and value generated – e.g., increasing the “look-to-book” conversion rate in customer-facing sales and service processes
� Improved operational set-up, e.g., sharing of functions across business lines, products and processes
� Process enhancements, e.g. fewer interfaces, greater straight-through processing and automation
16 Copyright © 2009 Oliver Wyman
The outcomes we were able to attribute to operations and process architecture included:
� A 15% effectiveness improvement in the core value-generating processes (e.g., quicker lead-times, more effective customer management)
� Simplified and standardized business rules aligned to the new streamlined product architecture
� Core processes harmonized across the major region
� Operational cost savings of approximately 25% through complexity reduction
Third, IT complexity reduction went hand-in-hand with operational process streamlining. Our client, the consumer finance company, had decided to adopt a commercial, integrated software platform covering most of its business lines and European operations. This decision was not framed as an “IT replacement program”, but rather as a “back to basics transformation” of the entire business – by definition, strategic and business-led.
Key features of this transformation were:
� Replacement of 70 of the client’s 200-odd IT systems by one new commercial application
� Significant reduction in the number of interfaces (> 30%)
� Significant reduction in data redundancies, functionality redundancies and related maintenance
� Cost savings in IT of approximately 40% due to complexity reduction
� Establishment of a target platform architecture for future European acquisitions
� Enablement of operations optimization and cost reduction
� Enablement of new product architecture, through a new configurable and parameter-driven product engine
17Copyright © 2009 Oliver Wyman
As a final step, the client applied its “back to basics” approach on the business and delivery model. Organizational structure, governance rules and planning processes were simplified, (e.g., redundant layers and functions were taken out) and the enterprise was restructured around three functions – Sales & Distribution, Operations & IT, Support & Management – and incentives for cross-business complexity reduction initiatives were put in place.
Collaborative approaches involving the business units, support functions and IT were enabled by establishing a multi-year investment planning process with a “total cost-benefit” view. A business demand management capability was established to inform Operations and IT of changes and new requirements in a more comprehensive and seamless manner. This not only enables Operations and IT to adequately anticipate requirements but to respond to business needs in a less ad hoc, more systematic manner, based on a structured fulfillment approach (processes and application functionality) rather than on partial or insufficient analysis.
Other key achievements included the creation of unified, scalable shared services and operational centers of excellence across business lines and countries, which structurally embed efficiency improvements; a new set of complexity-related key performance indicators linked to the incentives programs of product, process and data owners; and a Change Control Board with a focus on sustaining complexity avoidance by evaluating each change request from a complexity angle. Complexity implications and their effects are now mandatory elements of required business cases and are assessed according to good (required) and bad (unnecessary) investments in complexity before implementation is approved.
18 Copyright © 2009 Oliver Wyman
Complexity is prevalent in the array of financial services businesses: Retail banking, Commercial banking, Wealth and Asset Management, Capital Markets and Insurance. Across business types, there is a fairly consistent “back to basics” approach that Oliver Wyman recommends to identify and realize comprehensive complexity reduction:
1. Benchmark the organization against best-in-class peers
– Benchmark using the four dimensions discussed, i.e. business model, processes, IT, and organization and governance
– Understand differences in efficiency ratios owing to products, customers, and geography mix
– Based on this benchmarking exercise, identify material opportunities for improving productivity and efficiency
2. Uncover the complexity drivers that need to be remedied
– Use the “Front-to-Back” method to uncover complexity root causes in the context of identified opportunities
– Be prepared to confront what may be inherent, long-standing drivers of operational, IT and organization complexity
3. Develop a simplified target operating model
– Focus on simplification and rationalization while directly addressing the root causes
– Look to solve issues end-to-end – across business model, process, IT, and organization and governance
4. Execute and manage change
– Mobilize the right cross-functional teams and empower them with executing the target operating model
– Put in place the right governance and incentive structure
– Ensure close measurement of the performance improvement achieved
4. Front-to-back complexity reduction: Next steps

19Copyright © 2009 Oliver Wyman
There has never been a better time to make these bold strides towards complexity reduction. Long-term rewards will be a dramatically reduced cost base as well as a business platform that can sustain complexity in the future, ensure flexibility and provide the basis for enduring operating advantage.

Copyright © 2009 Oliver Wyman. All rights reserved. This report may not be reproduced or redistributed, in whole or in part, without the written permission of Oliver Wyman and Oliver Wyman accepts no liability whatsoever for the actions of third parties in this respect.
The information and opinions in this report were prepared by Oliver Wyman.
This report is not a substitute for tailored professional advice on how a specific financial institution should execute its strategy. This report is not investment advice and should not be relied on for such advice or as a substitute for consultation with professional accountants, tax, legal or financial advisers. Oliver Wyman has made every effort to use reliable, up-to-date and comprehensive information and analysis, but all information is provided without warranty of any kind, express or implied. Oliver Wyman disclaims any responsibility to update the information or conclusions in this report. Oliver Wyman accepts no liability for any loss arising from any action taken or refrained from as a result of information contained in this report or any reports or sources of information referred to herein, or for any consequential, special or similar damages even if advised of the possibility of such damages.
This report may not be sold without the written consent of Oliver Wyman.
Oliver Wyman is an international management consulting firm that combines deep industry knowledge
with specialized expertise in strategy, operations, risk management, organizational transformation, and
leadership development.
About the authors:
John Boochever is a Partner in the North American Strategic IT & Operations Practice.
Roland Bubik is a Partner in the EMEA Strategic IT & Operations Practice.
Kenan Rodrigues is a Senior Engagement Manager in the North American Strategic IT & Operations Practice.
Sascha Coccorullo is an Engagement Manager in the EMEA Strategic IT & Operations Practice.
For more information please contact the marketing department by email at [email protected] or by
phone at one of the following locations:
North America EMEA Asia Pacific
+1 212 541 8100 +44 20 7333 8333 +65 6510 9700