site scope
TRANSCRIPT

SiteScope User Guide
Table of Contents
Introduction.........................................................................................................................................................1What is SiteScope?..................................................................................................................................1How do I use this guide?..........................................................................................................................2Where can I get help?..............................................................................................................................2Licensing Notes.......................................................................................................................................2
Getting Started With SiteScope .......................................................................................................................4Terms You Should Know........................................................................................................................4Navigation Bar.........................................................................................................................................5The SiteScope Panel..............................................................................................................................5Other Links..............................................................................................................................................6
Preferences..................................................................................................................................6Browse Monitors.........................................................................................................................7Diagnostic Tools.........................................................................................................................7How to Get Help.........................................................................................................................7
Monitor Groups..................................................................................................................................................9What is a Group?.....................................................................................................................................9The Default SiteScope Monitor Groups..................................................................................................9
Network Group...........................................................................................................................9Server Group.............................................................................................................................10
Defining Your Own Groups...................................................................................................................11Creating a Group....................................................................................................................................12Setting Group Dependencies..................................................................................................................13Renaming a Group.................................................................................................................................13Disabling and Enabling the Monitors in a Group..................................................................................13Refreshing Monitors in the Group.........................................................................................................14Reordering Monitors..............................................................................................................................14Deleting a Group....................................................................................................................................15
Manage Monitors and Groups.........................................................................................................................16The Tree View of Groups and Monitors................................................................................................16Moving Monitors and Groups................................................................................................................17Duplicating Monitors and Groups.........................................................................................................18Deleting Monitors and Groups...............................................................................................................18Disabling Monitors and Groups.............................................................................................................18Enabling Monitors and Groups..............................................................................................................19Refreshing Monitors and Groups...........................................................................................................19Replacing in Monitors and Groups........................................................................................................19
Monitors.............................................................................................................................................................21What types of monitors are available?...................................................................................................21
Application Monitors................................................................................................................21Server Monitors........................................................................................................................22Network Monitors.....................................................................................................................23Advanced Monitors...................................................................................................................23
How do I add a monitor to a group?......................................................................................................25
SiteScope User Guide
i
Table of Contents
How do I edit a monitor?.......................................................................................................................25How do I delete a monitor from a Group?.............................................................................................26How do I move a monitor to another group?.........................................................................................26How do I duplicate a monitor?...............................................................................................................26How do I monitor a remote server?.......................................................................................................27
Composite Monitor...........................................................................................................................................28Usage Guidelines...................................................................................................................................28
Status.........................................................................................................................................28Completing the Composite Monitor Form.............................................................................................29
Advanced Options.....................................................................................................................29
CPU Utilization Monitor..................................................................................................................................32Usage Guidelines...................................................................................................................................32
Status.........................................................................................................................................32Completing the CPU Utilization Monitor Form....................................................................................33
Advanced Options.....................................................................................................................33
Database Monitor..............................................................................................................................................35Usage Guidelines...................................................................................................................................35
Status.........................................................................................................................................36Completing the Database Monitor Form...............................................................................................36
Advanced Options.....................................................................................................................36Oracle Database Monitoring..................................................................................................................38Informix Database Monitoring..............................................................................................................39MySQL Database Monitoring................................................................................................................40
Directory Monitor.............................................................................................................................................42Usage Guidelines...................................................................................................................................42
Status.........................................................................................................................................42Completing the Directory Monitor Form...............................................................................................42
Advanced Options.....................................................................................................................43
Disk Space Monitor...........................................................................................................................................46Usage Guidelines...................................................................................................................................46
Status.........................................................................................................................................46Completing the Disk Space Monitor Form............................................................................................46
Advanced Options.....................................................................................................................47
DNS Monitor.....................................................................................................................................................49Usage Guidelines...................................................................................................................................49
Status.........................................................................................................................................49Completing the DNS Monitor Form......................................................................................................50
Advanced Options.....................................................................................................................50
eBusiness Transaction Chain Monitor............................................................................................................53Usage Guidelines...................................................................................................................................53
SiteScope User Guide
ii
Table of Contents
Status.........................................................................................................................................54Setting up Monitors for the eBusiness Transaction Chain.....................................................................54Completing the eBusiness Transaction Chain Monitor Form...............................................................57
Advanced Options.....................................................................................................................57Passing Values From One Monitor to Another........................................................................59
File Monitor.......................................................................................................................................................60Usage Guidelines...................................................................................................................................60Reading and Status.................................................................................................................................60Completing the File Monitor Form........................................................................................................61
Advanced Options.....................................................................................................................61
FTP Monitor......................................................................................................................................................64Usage Guidelines...................................................................................................................................64
Status.........................................................................................................................................64Completing the FTP Monitor Form.......................................................................................................65
Advanced Options.....................................................................................................................66
LDAP Monitor..................................................................................................................................................69Usage Guidelines...................................................................................................................................69Status......................................................................................................................................................69Completing the LDAP Monitor Form...................................................................................................69
Advanced Options.....................................................................................................................70
Link Check Monitor.........................................................................................................................................73Usage Guidelines...................................................................................................................................73
Status.........................................................................................................................................74Completing the Link Check Monitor Form...........................................................................................74
Advanced Options.....................................................................................................................74
Link Check Summary Report..........................................................................................................................78Link Check Summary Report................................................................................................................78
Log File Monitor...............................................................................................................................................80Usage Guidelines...................................................................................................................................80Completing the Log File Monitor Form................................................................................................80
Advanced Options.....................................................................................................................81
Mail Monitor.....................................................................................................................................................84Usage Guidelines...................................................................................................................................84Status......................................................................................................................................................84Completing the Mail Monitor Form......................................................................................................84
Advanced Options.....................................................................................................................86
Memory Monitor...............................................................................................................................................88Usage Guidelines...................................................................................................................................88
Status.........................................................................................................................................88
SiteScope User Guide
iii

Table of Contents
Completing the Memory Monitor Form................................................................................................89Advanced Options.....................................................................................................................89
Network Monitor..............................................................................................................................................92Usage Guidelines...................................................................................................................................92
Status.........................................................................................................................................92Completing the Network Monitor Form................................................................................................93
Advanced Options.....................................................................................................................93
News Monitor....................................................................................................................................................96Usage Guidelines...................................................................................................................................96Status......................................................................................................................................................96Completing the News Monitor Form.....................................................................................................97
Advanced Options.....................................................................................................................97
Ping Monitor....................................................................................................................................................100Usage Guidelines.................................................................................................................................100
Status.......................................................................................................................................100Completing the Ping Monitor Form.....................................................................................................101
Advanced Options...................................................................................................................101
Port Monitor....................................................................................................................................................104Usage Guidelines.................................................................................................................................104
Status.......................................................................................................................................104Completing the Port Monitor Form.....................................................................................................105
Advanced Options...................................................................................................................105
Radius Monitor...............................................................................................................................................108Usage Guidelines.................................................................................................................................108
Status.......................................................................................................................................108Completing the Radius Monitor Form.................................................................................................109
Advanced Options...................................................................................................................109
Script Monitor.................................................................................................................................................112Usage Guidelines.................................................................................................................................112
Status.......................................................................................................................................112Completing the Script Monitor Form.....................................................................................112Advanced Options...................................................................................................................113
Service Monitor...............................................................................................................................................115Usage Guidelines.................................................................................................................................115
Status.......................................................................................................................................115Completing the Service Monitor Form................................................................................................116
Advanced Options...................................................................................................................116
SNMP Monitor................................................................................................................................................119Usage Guidelines.................................................................................................................................119
SiteScope User Guide
iv
Table of Contents
Completing the SNMP Monitor Form.................................................................................................119Advanced Options...................................................................................................................120
URL Monitor...................................................................................................................................................123Usage Guidelines.................................................................................................................................123
Status.......................................................................................................................................124Completing the URL Monitor Form....................................................................................................125
Advanced Options...................................................................................................................126
URL Content Monitor....................................................................................................................................131Usage Guidelines.................................................................................................................................131
Status.......................................................................................................................................131Completing the URL Content Monitor Form......................................................................................132
Advanced Options...................................................................................................................133
URL List Monitor...........................................................................................................................................137Usage Guidelines.................................................................................................................................137Completing the URL List Monitor Form.............................................................................................138
Advanced Options...................................................................................................................139
URL Transaction Monitor...........................................................................................................................142Usage Guidelines.................................................................................................................................142Status....................................................................................................................................................143Using the Add URL Transaction Wizard.............................................................................................143
Beginning a new transaction monitor.....................................................................................143Defining the next steps of the transaction...............................................................................144Advanced Options...................................................................................................................144
Add URL Transaction Monitor (example)..........................................................................................147Dynamic Content Workarounds.............................................................................................152
URL Transactions and Dynamic Content...................................................................................................152
Web Server Monitor.......................................................................................................................................155Usage Guidelines.................................................................................................................................155Completing the Web Server Monitor Form.........................................................................................155Advanced Options................................................................................................................................156
SiteScope Alerts...............................................................................................................................................159Using Alerts.........................................................................................................................................159The Alert Detail Page...........................................................................................................................162
The Alert Table.......................................................................................................................162Additional Links.....................................................................................................................164
Creating Alerts.....................................................................................................................................165Editing Alerts.......................................................................................................................................165Deleting Alerts.....................................................................................................................................165Disabling Alerts...................................................................................................................................166Viewing Sent Alerts and Logs.............................................................................................................166
SiteScope User Guide
v

Table of Contents
Database Alerts...............................................................................................................................................167Completing the Database Alert Form..................................................................................................167
Advanced Options...................................................................................................................168
E-mail Alerts....................................................................................................................................................170Completing the E-mail Alert Form......................................................................................................170
Advanced Options...................................................................................................................171
Understanding SiteScope E-mail Alerts........................................................................................................173SiteScope E-mail Alert Format............................................................................................................173
Alert E-mail Subject Field......................................................................................................173Alert Message Header.............................................................................................................174More Information / Diagnostics..............................................................................................174Monitor Details.......................................................................................................................175
Questions About Alerts........................................................................................................................175
Log Event Alerts.............................................................................................................................................177Completing the Log Event Alert Form................................................................................................177
Advanced Options...................................................................................................................178
Pager Alerts.....................................................................................................................................................180Completing the Pager Alert Form........................................................................................................180
Advanced Options...................................................................................................................181
Post Alerts........................................................................................................................................................183Completing the Post Alert Form..........................................................................................................183
Advanced Options...................................................................................................................184
Script Alerts.....................................................................................................................................................186Completing the Script Alert Form.......................................................................................................186
Advanced Options...................................................................................................................187
SNMP Trap Alerts..........................................................................................................................................188Completing the SNMP Alert Form......................................................................................................188
Advanced Options...................................................................................................................189
Sound Alerts....................................................................................................................................................191Completing the Sound Alert Form.......................................................................................................191
Advanced Options...................................................................................................................192
Disable or Enable Monitor Alerts.................................................................................................................193Completing the Disable or Enable Monitor(s) Alert Form..................................................................193
Advanced Options...................................................................................................................194
Show Quick Alert Report...............................................................................................................................195Completing the Quick Alert Form.......................................................................................................195
SiteScope User Guide
vi

Table of Contents
Management Reports......................................................................................................................................197The Management Report Page.............................................................................................................197
Report Table...........................................................................................................................197Additional Links.....................................................................................................................198
Default Management Reports..............................................................................................................199Adding Management Reports..............................................................................................................199Editing Management Reports..............................................................................................................199Deleting Management Reports............................................................................................................200
Adding a Management Report......................................................................................................................201Completing the Add Management Report Form.................................................................................201
Advanced Options...................................................................................................................203
Editing a Management Report......................................................................................................................205Completing the Update Management Report Form.............................................................................205
Advanced Options...................................................................................................................206
Management Report Summary.....................................................................................................................208URL Monitor.......................................................................................................................................208
Reading Management Reports......................................................................................................................210The Management Report Format.........................................................................................................210
Uptime and Reading...............................................................................................................211Readings in Graphical Format................................................................................................211Readings in Table Format.......................................................................................................214Error Listing............................................................................................................................215Alert Listing............................................................................................................................215
Interpreting Management Reports...............................................................................................................216Component Failure..............................................................................................................................216Capacity Overload...............................................................................................................................217Slow Response Time...........................................................................................................................218
Show Quick Management Report.................................................................................................................220Completing the Quick Management Form..........................................................................................220
Advanced Options...................................................................................................................221
Monitor Description Report...........................................................................................................................222Completing the SiteScope Monitor Description Report Form............................................................222Reading the SiteScope Monitor Description Report............................................................................222
Recent Monitors......................................................................................................................224Monitoring Load.....................................................................................................................224
Progress Report...............................................................................................................................................225
Preferences.......................................................................................................................................................226
SiteScope User Guide
vii
Table of Contents
General Preferences........................................................................................................................................227Completing the General Preferences Form..........................................................................................227Other Links..........................................................................................................................................228
Using a Stand-alone Web server...................................................................................................................229Using an IIS Server..............................................................................................................................229
Restricting Access To SiteScope Using an IIS Server...........................................................230Using Apache.......................................................................................................................................230Using a Netscape or Other Server........................................................................................................231
Pager Preferences............................................................................................................................................232Completing the Pager Preferences Form.............................................................................................232
Add Additional Pager Settings......................................................................................................................235Completing the Add Additional Pager Settings Form.........................................................................235
Advanced Options...................................................................................................................236
Mail Preferences..............................................................................................................................................238Completing the Mail Preferences Form...............................................................................................238
Additional E-mail Settings......................................................................................................239
Add Additional E-Mail Settings....................................................................................................................240Completing the E-mail Additional Setting Form.................................................................................240
Advanced Options...................................................................................................................240
Log Preferences...............................................................................................................................................242Completing the Log Preferences Form................................................................................................242
Database Logging...................................................................................................................242Database Troubleshooting......................................................................................................243
Log Descriptions..............................................................................................................................................244SiteScope Log Files.............................................................................................................................244
Other Logs..............................................................................................................................245SiteScope Log Database Table............................................................................................................245
Schedule Preferences......................................................................................................................................247Adding Additional Schedules..............................................................................................................247
Completing the Schedule Preferences Form...........................................................................247
SiteSeer Preferences........................................................................................................................................249Completing the SiteSeer Preferences Form.........................................................................................249
SNMP Preferences..........................................................................................................................................250Completing the SNMP Preferences Form............................................................................................250
Add Additional SNMP Settings.....................................................................................................................251Completing the Additional SNMP Settings Form...............................................................................251
SiteScope User Guide
viii
Table of Contents
Remote Servers................................................................................................................................................252Remote Servers Table..........................................................................................................................252Adding a Remote Machine..................................................................................................................253
Advanced Options...................................................................................................................254Technical Notes...................................................................................................................................254
User Preferences..............................................................................................................................................256Completing the Add / Update User Form............................................................................................256
Browser Filter Options............................................................................................................258Browse Monitor Table............................................................................................................258
Monitor Browser.............................................................................................................................................259
Diagnostic Tools..............................................................................................................................................261
DNS Lookup....................................................................................................................................................262
Check FTP Server...........................................................................................................................................263
Mail Round Trip Test.....................................................................................................................................265Completing the Send and Receive Mail Test Form.............................................................................265
Status.......................................................................................................................................267Completing the Check URL Transaction Form...................................................................................268
Advanced Options...................................................................................................................269
Check News Server.........................................................................................................................................270
Ping...................................................................................................................................................................271
TraceRoute......................................................................................................................................................271
Get URL Tool..................................................................................................................................................271
URL Transaction Tool....................................................................................................................................272
Network Tool...................................................................................................................................................274
Services.............................................................................................................................................................275
Get URL...........................................................................................................................................................276
SiteScope Multi-view Panel............................................................................................................................277Editing the Multi-view Panel...............................................................................................................277
Advanced Options...................................................................................................................278
Servers in Multi-view Panel...........................................................................................................................279The Servers Table................................................................................................................................279
SiteScope User Guide
ix

Table of Contents
Adding a Server to the Multi-view Panel............................................................................................279Deleting a Server from the Multi-view Panel......................................................................................280Editing a Server in the Multi-view Panel.............................................................................................280
SiteScope User Guide
x

Introduction
Thank you for choosing SiteScope as your Web environment monitoring solution. This guide containscomplete instructions for installing and setting up the SiteScope software. This document is also available inPDF format,(all.pdf), in the SiteScope/docs directory.
What is SiteScope?
SiteScope provides an easy-to-use Web server administration and monitoring environment. With SiteScope,you can monitor the aspects of your server environment that are vital to keeping your Web site available andfunctioning optimally.
SiteScope has over 20 types of monitors that can be used to watch important aspects of your Webenvironment. This includes monitors to verify availability of web pages and back-end applications as well asthe status of supporting server and network parameters. In addition to these monitors, SiteScope allows youto add your own site-specific monitors for those components unique to your environment. SiteScope comeswith several fully functional custom monitor examples. See the Custom Monitor section for more informationabout creating custom monitors.
Because your Web environment may provide multiple services or functions, SiteScope allows you to createmultiple monitors and organize them into groups and subgroups. This helps simplify the administration ofcomplex web environments. The first time you start it, SiteScope automatically creates two default monitorgroups: Network and Server. The Network group contains several monitors that work together to provide youwith an overview of the health of your network connection to the Internet. The Server group containsmonitors that report on several different aspects of the server on which SiteScope is installed to give you anidea of its overall health. You may choose to keep these groups in their original form, edit them to better meetyour needs, or delete ones that do not meet your needs.
Transactions are a key part of websites designed for e-commerce. SiteScope includes several monitorsdesigned to check the availability and proper function of web based transactions. This includes the capabilityto check all the key aspects of the transaction from the web page delivery, links to other pages and images,e-mail confirmations, and database updates.
Comprehensive e-commerce monitoring includes the ability to alert support staff of system failures orpotential problems with an organizations website. SiteScope allows you to create alerts that are triggered bymonitoring criteria that you choose. The alerts can be sent in one of several media including e-mail,electronic pager, SNMP traps, or CGI POST method.
SiteScope also provides monitoring reports which allow you to view the status of your web environment overa period of time. The reports are customizable to to provide data in both graphical and tabular format.
The SiteScope panel is your window into the SiteScope monitoring environment. It appears when you startSiteScope and it displays a gauge and status icon for each defined monitor group. The first time you startSiteScope, you'll see a gauge and icon for the default Server and Network groups. Each time you add amonitor group, a new gauge and status icon is added to the SiteScope panel.
Introduction 1

How do I use this guide?
The SiteScope on-line User Guide is organized so that you can either follow the navigation links at thebottom of each page to read the guide in a book-like fashion, or you can start with the SiteScope Table ofContents and go directly to any topic or section that interests you. Each page includes a link at the top andbottom of the page that allows you to return the the Table of Contents or link the the next page.
Where can I get help?
Help for SiteScope is available in several forms.
On-line User Guide
You are reading the SiteScope User Guide. This document covers the use of SiteScope andshould be your first resource when trying to answer a question about SiteScope.
Search Our Database
Many common questions are answered in the SiteScope Support Database(http://www.freshwater.com/support/search.htm). If you can't find an answer to yourquestion in the on-line User Guide, look here next.
On-line Support
For questions and problems that aren't addressed in any other source, please e-mail us [email protected] or click the Support Request Form link on the SiteScope mainpanel to e-mail us your question. This form even allows you to easily attach importantSiteScope files that may be useful to us as we try to answer your questions. If you are alicensed customer who has purchased one of our Customer Care options, we'll typicallyrespond within 1 business day. We'll respond to all other questions as soon as possible.
Licensing Notes
You may use SiteScope on a free trial basis for 10 days. At the end of the trial period you must eitherpurchase a SiteScope license to continue using the software, or you must delete all SiteScope files anddirectories.
If you are using SiteScope on a trial basis, you will see a counter on the SiteScope main panel which willindicate how many days are remaining in your trial period. When you purchase a SiteScope license, you willbe instructed on how to use your license number to register your copy of SiteScope. The trial counter will nolonger appear once you've completed the registration process.
SiteScope User Guide
How do I use this guide? 2

The SiteScope application includes the following libraries. Click on the links to view licensinginformation specific to each of these products.
Java Runtime Environment, including JSSE, JIMI, and JDNI, from Sun Microsystems
Java SNMP package from Advent Network Management
Java Generic Library package from ObjectSpace
Java PerlTools package from ORO
Java XML Parser from Datachannel
Java MD5 library from Santeri
SiteScope User Guide
Licensing Notes 3

Getting Started With SiteScope
Getting Started introduces you to the SiteScope software product and the SiteScope Panel. SiteScope is aserver administration and monitoring environment. Using SiteScope you can monitor many of the mostimportant aspects of your server environment. SiteScope helps you stay on top of the work involved inrunning a business-critical Web site.
Before you go any further, you should install SiteScope following the installation instructions inREADME.htm.
In this section we'll discuss:
• Some terms you should know• The Navigation Bar• The SiteScope Panel• Other links
♦ Setting preferences
◊ Security and Access Control◊ SiteSeer® Access
♦ Browsing SiteScope monitors♦ Diagnostic Tools♦ How to get help
Terms You Should Know
Here are a few terms you should know.
SiteScope Panel
The SiteScope Panel is SiteScope 's visual display. It displays a status gauge and status iconfor each group.
Monitor
A monitor is a SiteScope program that tracks the status of one aspect of the Web serverenvironment.
Group
A group is a collection of one or more SiteScope monitors.
Getting Started With SiteScope 4

Navigation Bar
The navigation bar above the SiteScope Panel gives you quick access to the services described below. Thisnavigation bar is available at the top of other pages within SiteScope .
(Overview Button)
Choose this button, located on the left end of the navigation bar, to go to the SiteScopeMulti-view panel. If you are running SiteScope on more than one server, you may want touse the SiteScope Multi-view panel to display the status of all of your SiteScope installationsfrom a central location. The SiteScope Multi-view panel provides an overview of the statusof each monitor defined in each SiteScope installation, and provides links back to theoriginating SiteScope for easy administration.
SiteScope
Choose this button to return to the SiteScope Panel from other pages within SiteScope . Youcan use the Back button on your browser menu bar to return to a previous screen withoutreturning to the SiteScope panel
Alerts
Choose the Alerts button to go to the alerts detail page. An alert is a set of instructions thattell SiteScope how and when to notify you of an error or warning status being reported byone or more SiteScope monitors. From the alert detail page you can view the currentlydefined alerts. You can also add, edit, or delete alerts, see recently generated alerts, andaccess e-mail, pager, and SNMP preferences.
Reports
Choose the Reports button to go to the SiteScope Management Reports page. Here you'll seea list of the currently defined reports. You may add, edit and delete reports from this page.You may also generate quick management reports and view the Progress page, which showsa history of the monitors that have run recently.
Help
Choose the Help button to open the help text for the current page in a separate browserwindow.
The SiteScope Panel
The SiteScope Panel appears when you start SiteScope and provides a visual overview of the status of yourWeb server environment. It displays a status icon and a status gauge for each monitor group. The status iconreflects that monitor group's current status relative to the performance criteria defined for it. A warning statuscondition is considered to have a higher value than an OK status condition, and an error status condition is
SiteScope User Guide
Terms You Should Know 5

considered to have a higher value than a warning status condition. The status icon will reflect the monitorwith highest value condition (OK, warning, or error) in that monitor group. The status gauge also reflects thehighest value returned by any monitor in the group.
The status icons indicate the following status conditions:
OK status Warning status. Error status. Process in progress.
To add a new group of monitors, click the Create Group link on the SiteScope Panel. This takes you to theAdd Group form where you can define the name and dependencies for the new group. Once you have createdthe new group you can add monitors through the detail page.
To get more information about a monitor group, click on the group's name on the SiteScope Panel, locatedunder the group's status gauge. This takes you to the group's detail page. The group detail page providesseparate status information for each of the group's monitors. From the detail page you can add, edit, or deletemonitors. You can also rename or delete an entire group, as well as create sub-groups.
Other Links
Several other links are available on the SiteScope panel page below the SiteScope panel. This includes linksto allow you to configure your SiteScope installation, browse SiteScope monitors, and request support.
The first link below the SiteScope panel will normally be the name of the next monitor that SiteScope will beupdated. Click this link to go to the SiteScope Progress Report page. The Progress Report page provides anoverview of the monitors SiteScope has run most recently and the status returned by those monitors.
Preferences
Choose the "Preferences" link to go to the SiteScope General Preferences page. This page contains a place toenter your SiteScope license number. You can also set the access controls for SiteScope , including user nameand password settings. This page also contains navigation links to other pages where you can set preferencesfor e-mail, log files, schedules, and other configuration options. Two of the features that are accessed via thePreferences link are included below:
Security and Access Control
As installed, SiteScope is accessible to anyone that can access the IP address of the machine where it isinstalled. SiteScope has a number of options that allow you to control access to the program.
On the General Preferences page you can specify the IP addresses that are allowed to connect to SiteScope .
SiteScope User Guide
The SiteScope Panel 6

If SiteScope is inside the firewall or within a DMZ, you may also choose to configure the firewall to restrictwho is allowed to access the SiteScope HTTP port. It is also on the General Preferences page where youchoose to require a login for other users that you may define.
In addition, on the User Preferences page in SiteScope , you can configure login/password access toSiteScope for the built-in "administrator" (full access) and "user" (limited access) users. You may also createadditional users that have any combination of permissions and group access that you choose. This allows youto create a "view-only" mode that gives users access to SiteScope without giving them the ability to makechanges to the SiteScope monitors, alerts, reports, or configuration.
For additional information on SiteScope access controls see the Security Overview notes at the FreshwaterSoftware website.
SiteSeer® Access
One of the links within the General Preferences page is a link to configure SiteSeer. This allows SiteScopeusers who also subscribe to Freshwater Software's SiteSeer remote monitoring service can access theirSiteSeer accounts directly from the SiteScope panel. Choose the "Preferences" link on the SiteScope paneland then choose the SiteSeer link at the top of the page. Complete the SiteSeer Preferences information andsave the changes. A link to the SiteSeer account will appear as a group link on the SiteScope main panel.
If you're not currently using the SiteSeer service, choose the Add SiteSeer link on the SiteScope main panelto sign up for a free 10 day trial of the service. SiteSeer provides you with 24 x 7 information about your Website's performance from outside your firewall, alerting you immediately if it detects any problems.
Browse Monitors
Choose the Browse Monitors link to go to the SiteScope Monitor Browser page. The Monitor Browserallows you to view all or a selected group of monitors based on criteria that you choose.
Diagnostic Tools
The Diagnostic Tools link brings up Diagnostic Tools page. This page contains links to check networkservices, connectivity, and other tests.
How to Get Help
If you have any questions about SiteScope , choose the Support Request Form link near the bottom of thethe SiteScope main panel page. This will bring up a form that will help you provide us with all theinformation we need to provide you with the answer you need as quickly as possible.
SiteScope User Guide
Preferences 7

SiteScope User Guide
How to Get Help 8
Monitor Groups
This section introduces you to SiteScope monitor groups and the role they play in help organize andadminister your monitoring environment. In this section we'll discuss:
• What is a SiteScope group?• The default SiteScope monitor groups• How to define your own groups• How to create a group• How to set group dependencies• How to rename a group• How to disable or enable a group• How to refresh monitor readings• How to reorder monitors• How to delete a group
What is a Group?
A group is a collection of one or more monitors. A group might contain several of one type of monitor, suchas URL monitors, or several different monitors that track specific portion of your web environment, such asweb server, URL, network parameters related to a specific e-commerce transaction. There are no hard andfast rules for grouping monitors, but one method that works well is to group monitors that should generatesimilar alerts.
The Default SiteScope Monitor Groups
The first time you start SiteScope you'll see status gauges and icons for two default groups on the SiteScopePanel: Network and Server. SiteScope automatically creates these default groups. You can modify these twogroups to meet your own monitoring needs.
Network Group
By default the Network group contains several monitors which provide you with information about yournetwork connection to the Internet.
The monitors you will see in this group include:
Local Home Page
This is a URL Monitor that retrieves the local home page (http://localhost) to monitor
Monitor Groups 9
availability and access time.
Network Interface
This is a Ping Monitor that pings the Freshwater Software server (www.freshwater.com) tomonitor connectivity beyond your own network/localhost.
URL
A URL Monitor that retrieves the Freshwater Software home page(http://www.freshwater.com) as an additional monitor of connectivity and performance.
DNS
This includes a DNS Monitor for any Domain Name Servers in the local machine'sconfiguration. This verifies that the DNS server is accepting requests and that a specificdomain name can be located.
Ping
This includes Ping Monitors that ping all IP addresses for the local machine to verify theavailability of critical connections.
Network(NT Only)
On the NT platform a Network Monitor is also added to measure your network's saturation.
The status and readings returned by these monitors assures you that your connection to the Internet isworking well.
Server Group
The Server group created by SiteScope contains several monitors which report on different components ofyour Web server environment. The proper functioning of each of these components is vital to providingcontinuous access to your Web site visitors.
By default the monitors configured for this group are:
CPU
This is a CPU Utilization Monitor. It monitors the percentage of CPU time that is currentlybeing used on your server, helping you to pinpoint potential overloading problems.
Memory
This is a Memory Monitor, which monitors the percentage of memory in use and generatesan alert if usage exceeds the thresholds you set. By default, SiteScope sets the warningthreshold at 80% and above with the error threshold set if memory usage exceeds 90%.
SiteScope User Guide
Network Group 10
Disk Space
This is a Disk Space Monitor. It monitors the available space on the specified disk, alertingyou to disk space problems that may lead to system crashes and corruption of files. Bydefault, one Disk Space Monitor is added for each disk or file system (Unix) detected on theserver where SiteScope is installed.
Web server performance
This is a Web Server Monitor. This monitor displays hits per minute, giving you a goodindication of the amount of traffic your Web server is receiving.
Service Monitors
Several monitors are added to watch common services such as FTP, Web, Telnet and mailservices on NT and http, inetd, sendmail, and ftpd processes on Unix.
Defining Your Own Groups
SiteScope allows you to create and edit your own groups of monitors. Within each group you may also createsubgroups of monitors. This can ease the administration of monitoring large multi-server environments.
Each SiteScope monitor must belong to a group, so when you add a new monitor you either have to add it toan existing group, or you must first create a new group for it. SiteScope allows you to define virtually anynumber of groups. Each group in turn can contain any number of monitors and subgroups regardless of howmany monitors you have purchased. For ease of administration it's best to arrange monitors into groups andsubgroups that make sense for you. For example, if you intend to monitor a large number of processesrunning on your system, you may want all of them to be in a single group named "Processes". Or, if you'remonitoring processes on several machines using the Remote Monitoring feature, you could create a primarygroup called Processes with several subgroups named after each of the remote machines that you aremonitoring. This type of organization helps tremendously with administration, especially in large monitoringenvironments.
Here are some things you'll want to keep in mind when you start defining your own groups.
The total number of monitors you think you'll want to add.
The more monitors you want to add, the more important your grouping becomes. When youhave a large number of monitors, it's important that they're grouped in such a manner thatit's easy to remember where they are located for administration purposes.
How you want to structure alert generation.
SiteScope generates alerts based upon parameters set by you . You may define alerts forindividual monitors or groups of monitors. For example, you may tell SiteScope to generatean alert anytime one specific monitor is in error, or you may instruct it to generate an alert
SiteScope User Guide
Server Group 11

when any monitor in a specific group of monitors is in error. Therefore, it's important thatyou put some thought into how you want to structure your alerts prior to assigning them togroups.
How your Web environment will change down the road.
If you'll be expanding your Web environment in the near future, for example adding moreWeb servers on the machine on which SiteScope is running, you'll want to keep in mindwhat those changes will mean in terms of monitoring requirements and plan accordingly.
How often you'll want to change monitoring parameters.
If there are certain kinds of monitors that you'll want to edit fairly regularly, for exampleURL monitors, you may want to group them into a single group for easier administration.
The number of groups you really need.
Administration becomes tricky if you have a large number of randomly created groups andsubgroups. Defining well-organized groups helps you with the following:Monitor managementAlert managementReport management
No matter how you choose to setup your groups and monitors, SiteScope allows you to easily make changeswith a set of tools that manage monitors and groups.
Creating a Group
The steps to create a new group are:
1. Start or open SiteScope. The SiteScope Main Panel page appears.2. Click the "Create group" link on the SiteScope Panel. The Add Group form appears.3. Enter the name of the group in the Group Name: field. You may only use alphanumeric characters,
dashes (-), underscores (_), and periods (.) in the name. Name length is not restricted.4. Click the "Add Group" button. The group detail page for this group appears.
That's all there is to it. Once you have created the group you can add the monitors that you want to be a partof this group. Check out the instructions for adding monitors. Once you have added monitors to a group,clicking on the group name link in the SiteScope panel will take you to the group detail page. The groupdetail page gives you an overview of the latest status and readings for all the monitors defined for that group.
SiteScope User Guide
Defining Your Own Groups 12

Setting Group Dependencies
Group dependencies allow you to create groups of monitors which will only run as long as another monitor inanother group is reporting either an OK or Error status. If you choose to have SiteScope dependent uponanother monitor returning an OK status and that monitor goes into error, the monitors in this group will notrun until the depended upon monitor begins to show an OK status again. For example, you could create agroup of monitors for a specific machine which will only run if a Ping monitor for that machine returns anOK status. If the ping ever fails, the monitors in this group will not run, preventing you from being floodedwith error messages.
If you choose to have this group dependent upon another monitor being in error, the monitors in the groupwill not become enabled unless the dependency control monitor returns an error status.
To set group dependencies:
1. Click the group's name on the SiteScope Panel to open the group's detail page. The detail pageappears.
2. Click the "Edit Group Properties" link. The Edit Group page appears.3. Under Advanced Options find the Depends on field choose the name of the monitor upon which this
group should be dependent from the drop-down list.
Renaming a Group
Use the following steps to rename an existing group:
1. Click the group's name on the SiteScope Panel to open the group's detail page. The detail pageappears.
2. Click the "Edit Group Properties" link. The Edit Group form appears.3. Enter the new name for the group in the Group Name: field.4. Click the "Update Group" button. The updated group detail page for this group appears.
Disabling and Enabling the Monitors in a Group
SiteScope allows you to disable all of the monitors in a group as well as any sub-groups in that group. Thisfeature is useful for times when you know that the monitors will be in error, such as during routinemaintenance or a prolonged outage. See also:Monitor Scheduling.
To disable the monitors in a group:
SiteScope User Guide
Setting Group Dependencies 13
1. Click the group's name on the SiteScope Panel to open the group's detail page. The detail pageappears.
2. Click the Disable all the monitors in this group link.3. The updated group detail page for this group will appear showing the monitors and sub-groups in the
group are disabled.4. To enable the monitors, click the Enable all the monitors in this group link.
Refreshing Monitors in the Group
Monitors are set to run at time intervals that you select. This may vary from running several times eachminute to only running once a day. SiteScope allows you to refresh monitor readings manually regardless ofwhen the monitors are set to run. When you refresh a group, all of the monitors and sub-groups that belong tothat group are run and the status reading is updated. Use the following steps to refresh group:
1. Click the group's name on the SiteScope Panel to open the group's detail page. The detail pageappears.
2. Click the "Refresh all the monitors in this group" link. A confirmation message appears.3. Click the Refresh button to conplete the action. Click on the Return to [groupname] link to return to
the group detail page.
Reordering Monitors
The Reorder Monitors feature allows you to change the order that monitors are displayed in the group page.Use the following steps to reorder monitors:
1. click the "Reorder the monitors in this group" link on the Group Detail page.2. Complete the fields on the SiteScope Reorder Monitor Form as described below.
By Position
Select the new position that you want each monitor to have. For example, put thenumber 1 next the monitor that should appear first on the Group Detail page.
Sort
Click the Reorder Alphabetically button to order the monitors in this groupalphabetically.
3. Click either the Reorder by Position or the Reorder Alphabetically button to complete the action
.
SiteScope User Guide
Disabling and Enabling the Monitors in a Group 14

Deleting a Group
When you delete a group, all of the monitors and sub-groups that belong to that group are also deleted. Usethe following steps to delete a group:
1. Click the group's name on the SiteScope Panel to open the group's detail page. The detail pageappears.
2. Click the Delete this group link. A confirmation message appears.3. Click the Delete [group name] button to delete the group. The SiteScope Panel appears.
SiteScope User Guide
Reordering Monitors 15

Manage Monitors and Groups
The Manage Monitors and Groups page is available through a link on the monitor group detail page. Thispage allows you to move, duplicate, delete, disable, enable, and refresh monitors and groups. It also allowsyou to replace text strings that define various monitor parameters.
In this section we discuss:
• The Tree View of Groups and Monitors• Moving Monitors and Groups• Duplicating Monitors and Groups• Deleting Monitors and Groups• Disabling Monitors and Groups• Enabling Monitors and Groups• Refreshing Monitors and Groups• Replacing in Monitors and Groups
The Tree View of Groups and Monitors
The Monitor Tree View allows you to view monitors and the groups they are associated with. An example ofthe Monitor Tree View is shown below.
(Click the to expand a group, and the to collapse a group).
Base Group
Example Group
Web Server A Group
Ping main IP address
Home Page URL Monitor
Local CPU Utilization
Manage Monitors and Groups 16

Server Memory Usage
SiteScope Log Files
Web Page URL Transaction
Web Server B Group
Web Server C Group
Network
Database Monitors
Server
By default, the top level groups (Server, Network, URL's, etc.) are shown. By clicking on the , to the left ofthe group name you can expand the group to show the monitors and subgroups contained within that group.Clicking on the will collapse the group display. The display of the tree is saved across visits to the pageand the actions associated with it.
To select a monitor or group, click the check box to the left of the name of the monitor or group. Anycombination of groups or monitors can be selected. Once you have made your selection, choose the actionthat you wish to take on the selected items by clicking one of the buttons on the lower portion of the page.
Moving Monitors and Groups
To move monitors or monitor groups from one group to another, select the items you want to move in theMonitor Tree View and click the Move Selected Items button. After clicking the Move Selected Items button,a page displaying the selected monitor items appears along with a pull-down menu box allowing you tospecify the target group for the move. Choose the target group for the selected items and press the MoveMonitor button.
Moving a monitor deletes it from its current group and adds it to the destination group. Any alerts defined forthat specific monitor are transferred with the monitor.
Warning: Moving a monitor will start it's history over - any reports generated for the monitor will startfrom the time that the monitor was moved. The history data will still be in the log files, but it will beinaccessible from the reports.
SiteScope User Guide
The Tree View of Groups and Monitors 17
Moving a group will make the group a subgroup of the destination group. If it is already a subgroup, it willbecome a subgroup in the destination group. Unlike moving individual monitors, moving groups has noeffect on history.
Duplicating Monitors and Groups
To duplicate monitors or monitor groups, select the items you want to duplicate in the Monitor Tree Viewand click the Duplicate Selected Items button. After clicking the Duplicate Selected Items button, a pagedisplaying the selected monitor items appears along with a pull-down menu box allowing you to specify thetarget group. Choose the destination group for the selected items when they are duplicated. Next to each itemis a text box allowing a new name for the item to be entered - the default is "Copy of Monitor Name". Pressthe Duplicate Monitor button to complete the action.
Under the Advanced Options section there are text fields for searching and replacing text in the items beingduplicated. This is most useful when duplicating groups and allows all instances of a server name, forexample, to be changed at once. If you had a group that contained a series of monitors for the machinewww.freshtech.com and you wanted to create a similar monitoring suite for demo.freshtech.com, thenentering www.freshtech.com in the Replace field, and demo.freshtech.com in the With field would changethe setting in all of the monitors and groups being duplicated.
Duplicating a monitor makes a copy of the monitor and adds it to the destination group. Any alerts definedfor that monitor are duplicated with the monitor. When you duplicate a group of monitors a copy is made ofthe group and all of its monitors and subgroups. The duplicate group is added as a subgroup in the destinationgroup.
Deleting Monitors and Groups
To delete monitors or monitor groups, select the items you want to delete in the Monitor Tree View and clickthe Delete Selected Items button. After clicking the Delete Selected Items button, a page confirming theselected items is displayed. Clicking the Delete button will permanently delete the items from SiteScope.
Deleting a monitor will delete the monitor and any alerts defined for that monitor. Deleting a group willdelete the group, all monitors in the group, and any subgroups of the group.
Disabling Monitors and Groups
To disable monitors or monitor groups, select the items you want to disable in the Monitor Tree View andclick the Disable Selected Items button. After clicking the Disable Selected Items button a page listing theselected items is displayed. Clicking the Disable Monitor button will disable the items.
SiteScope User Guide
Moving Monitors and Groups 18
Disabling a monitor causes the monitor to stop collecting data and to stop causing alerts until it is againenabled. Disabling a group will disable all of the monitors in a group, and all monitors in subgroups of thegroup.
Enabling Monitors and Groups
To enable monitors or monitor groups that were previously disabled, select the items you want to enable inthe Monitor Tree View and click the Enable Selected Items button. After clicking the Enable Selected Itemsbutton a page confirming the selected items is displayed. Clicking the Enable Monitor button will enable theitems.
Enabling a monitor causes the monitor to resume collecting data and to resume causing alerts if it wasdisabled. Enabling a group will enable all of the monitors in a group, and all monitors in subgroups of thegroup.
Refreshing Monitors and Groups
To refresh monitors or monitor groups, select the items you want to refresh in the Monitor Tree View andclick the Refresh Selected Items button. After clicking the Refresh Selected Items button a page showing theselected items is displayed. Clicking the Refresh Monitor button will refresh the items.
Refreshing a group will refresh all of the monitors in a selected group, and all monitors in subgroups of thegroup.
Replacing in Monitors and Groups
You can use the Replace feature to find and replace text strings and values in the parameters you have used todefine various monitors. This can be very useful if there are changes made to the system which effectmultiple monitors such as a domain name change or URL change.
To replace text or values within monitors or monitor groups, select the items you want to search and replacewithin from the Monitor Tree View and click the Replace Selected Items button. After clicking the ReplaceSelected Items button, a page displaying the selected items and text field for specifying the values andattributes to find and replace is displayed. Enter the current value in the Find field and the new value in theReplace With field. Choosing the Replace Monitor button will replace all occurrences of the original valuewith the new value in the selected items.
SiteScope User Guide
Disabling Monitors and Groups 19

SiteScope User Guide
Replacing in Monitors and Groups 20
Monitors
SiteScope has many different types of monitors available to help you manage your Web server environment.These monitor types provide you with various monitoring capabilities. When you "create" a monitor, youselect which type of monitoring function you want and then define the specific parameters for the monitorinstance you are creating. You can create another instance of that monitor type but enter different monitoringparameters. For example, you can create multiple URL monitors which monitor different URL addresses.
SiteScope is sold on a number-of-monitors basis. This means you can purchase the number of monitors tomeet your monitoring objectives while also having the number of copies of the SiteScope applicationsoftware needed to scale the monitoring to your network environment. As your network grows or yourmonitoring needs increase, you will need to purchase a license for additional monitor sets.
Any single installation of SiteScope is capable of running virtually all of the monitors you have purchased.However, the type of monitors run and their run frequency may dictate that you divide your monitoringbetween multiple SiteScope installations. The calculation to keep in mind is how many monitors arescheduled to run per minute per SiteScope installation . For example, if you define 120 monitors each to runevery 2 minutes, this equates to 60 monitors per minute. Generally, monitoring load won't be a concern if theaverage number of monitors run is less than 60 monitors per minute. The upper limit is about 300 monitorsper minute. At this level the load on the monitoring system starts to affect your measurements. You can viewthe monitoring load on the server by going to the Reports page, and then click the View the Progress Pagelink. At the bottom of the Progress page you'll see the statistics for the current and maximum monitors perminute.
In this section we'll discuss:
• The types of monitors.• How to add a monitor to a Group.• How to edit a monitor• How to delete a monitor from a Group.• How to move a monitor to another Group.• How to duplicate a monitor.• How to monitor a remote server
What types of monitors are available?
Application Monitors
Application monitors test network applications by simulating end user actions. These include the following:
Database Monitor
Monitors 21

The Database Monitor connects to database and performs a query that you specify to verifythat data can be retrieved.
eBusiness Transaction Chain Monitor
This monitor verifies an eBusiness transaction by checking the complete chain of processesand actions, including front-end web servers, e-mail notifications, back-end databases, andextranet applications.
FTP Monitor
The FTP Monitor connects to an FTP server and verifies that a file can be retrieved.
Mail Monitor
The Mail Monitor verifies that the mail server is accepting requests, and that messages canbe sent and retrieved.
URL Monitor
The URL Monitor verifies availability, content, and access time for specified URLs to ensurethat your web pages are always available in an acceptable time frame. On the NT platform,SiteScope takes advantage of the platform's integrated support to monitor secure HTTPSURLs in addition to HTTP URLs.
URL Transaction Monitor
The URL Transaction Monitor simulates a user's session across several pages. An exampleof this would be entering an account name via a Web form, checking an account status forthe page that is returned, and then following a sequence of links through several more pages.
Server Monitors
Server monitors measure server and operating system attributes. These include the following:
CPU Utilization Monitor
The CPU Utilization Monitor reports the percentage of CPU currently in use to ensure thatyou know if the CPU is being overloaded.
Disk Space Monitor
The Disk Space Monitor reports the percentage and amount of disk space currently in use sothat you can act before you run out of disk space.
Memory Monitor
SiteScope User Guide
Application Monitors 22

This monitor measures virtual memory usage and notifies you before you have a problem.
Network Monitor
This monitor is available on the NT platform only and measures your network's saturationbased upon packet errors, throughput (bits/second), and open connections.
Service Monitor
The Service Monitor verifies that specified processes are running, such as Web server, Mail,FTP, News, Gopher, Telnet, and DNS.
Web Server Monitor
The Web Server Monitor reads the web server log and reports data on hits, bytes, errors, hitsper minute, and bytes per minute. It supports Netscape Enterprise, Netscape FastTrack,Microsoft IIS, O'Reilly WebSite, and any web server that uses the common log format.
Network Monitors
Network monitors test network connnectivity and performance. These include the following:
DNS Monitor
The DNS Monitor checks a Domain Name Server via the network. It verifies that the DNSserver is accepting requests, and also verifies that the address for a specific domain name canbe found.
Ping Monitor
The Ping Monitor verifies that specified hosts are available via the network to ensurecontinuous availability of critical connections.
Port Monitor
The Port Monitor determines whether a service on a port can be connected to.
SNMP Monitor
The SiteScope SNMP Monitor reads a value from an SNMP device. Many network devicessupport the SNMP protocol as a way of monitoring the devices.
Advanced Monitors
Advanced Monitors are special purpose monitors to provide specific functionality. These include thefollowing:
SiteScope User Guide
Server Monitors 23

Composite Monitor
The Composite Monitor checks the status of a set of monitors or monitor groups.
Directory Monitor
The Directory Monitor checks the file count and directory size and notifies you if any ofthese exceed criteria you specify.
File Monitor
The File Monitor checks the size, age, and, if you want, the content of a file, and notifies youif any of these change.
LDAP Monitor
The LDAP Monitor checks an LDAP server by sending a password authentication requestand reports the result.
Link Check Monitor
This monitor checks all of the internal and external links on a site to ensure that they can bereached.
Log File Monitor
The Log File Monitor allows you to generate warnings and errors based upon data in anapplication's log file. For example, many applications write error messages to a log file. Thismonitor can scan those log files, looking for error messages and generating alerts when itfinds them.
News Monitor
The News Monitor connects to a news (NNTP) server and verifies that groups can beretrieved.
NT Performance Counter Monitor
The NT Performance Counter Monitor tracks the values of any Window NT performancestatistic. These are the same statistics that can be viewed using the Performance Monitorapplication under Windows NT. This monitor is only available on the Windows NT versionof SiteScope.
NT Dial-up Monitor
This monitor verifies that a dial-up connection can be made to an ISP or Remote Accessserver and measures performance over the dial-up connection.
NT Event Log Monitor
The NT Event Log Monitor watches one of the Windows NT Event Logs (System,
SiteScope User Guide
Advanced Monitors 24

Application, or Security) and generates alerts when entries are added.
Script Monitor
This monitor verifies that a script executes correctly.
URL Content Monitor
This monitor retrieves a web page and compares and saves multiple matching values fromthe content.
URL List Monitor
This monitor allows you to monitor an entire list of URLs, rather than defining severalseparate URL monitors.
How do I add a monitor to a group?
Monitors must be added to an existing group (there are on-line instructions for creating a group if you needthem).
To add a monitor to a group:
1. From the SiteScope Panel, open the group to which you want to add the new monitor.2. Click Add a new monitor to this group link. The Add Monitor form appears.3. Choose the type of monitor that you want to add and complete the monitor set-up information. For
information about completing that monitor's information, choose the help button on the Add Monitorform.
4. Click the Add Monitor button after you complete the set-up information. The group's detail pageappears with the new monitor listed last in the monitor table.
How do I edit a monitor?
To edit an existing monitor:
1. From the SiteScope Panel, open the group that contains the monitor you want to edit. The group'sdetail page appears. NOTE: If the monitor belongs to a sub-group, click the sub-group's name on the group detail page.
2. Locate the monitor that you want to edit in the monitor table and click the Edit link associated withthat monitor. The monitor's current information appears.
3. Make the desired changes.4. Click the Update [Monitor Name] button. The group's detail page appears and the changes take
SiteScope User Guide
Advanced Monitors 25

affect.
How do I delete a monitor from a Group?
To delete a monitor from a group:
1. From the SiteScope Panel, open the group that contains the monitor you want to delete. The group'sdetail page appears. NOTE: If the monitor belongs to a sub-group, click the sub-group's name on the group detail page.
2. Locate the monitor to be deleted in the monitor table and click the X in that monitor's Del column. Aconfirmation message appears.
3. Click the Delete Monitor button. The group's detail page appears and the monitor is deleted.
How do I move a monitor to another group?
To move a monitor to another group:
1. Open the group that contains the monitor you want to move. The group's detail page appears.2. Choose the Manage Monitors and Groups link. The Manage Monitors and Groups page appears.3. Click the + symbol next to the name of the group that contains the monitor to be moved. The
monitors belonging to this group are listed.4. Select the monitor you want to move by clicking the selection box next to its name.5. Click the Move Selected Items button. The Move Monitor page appears.6. Select the group to which you want to move this monitor and click the Move Monitor button.
The monitor now appears in the new group.
How do I duplicate a monitor?
To duplicate a monitor:
1. Open the group that contains the monitor you want to duplicate. The group's detail page appears.2. Choose the Manage Monitors and Groups link. The Manage Monitors and Groups page appears.3. Click the + symbol next to the name of the group that contains the monitor to be duplicated. The
monitors belonging to this group are listed.4. Select the monitor you want to duplicate by clicking the selection box next to its name.5. Click the Duplicate Selected Items button. The Duplicate Monitor page appears.6. Enter the name you want this new monitor to have and then select the group it should appear in.7. Click the Duplicate Monitor button.
SiteScope User Guide
How do I edit a monitor? 26

The duplicated monitor now appears in the specified group.
How do I monitor a remote server?
Several SiteScope monitors (CPU, Disk Space, Memory, Service and Web Server) can monitor informationon remote servers. This includes servers running the following operating systems:
• Windows NT• Sun Solaris• SGI Irix• HP/UX• Linux
Notes:
1. Monitors that can be used to monitor remote servers directly are limited to the CPU, Disk Space,Memory, Service, Script(Unix Only), NT Performance Counter, NT Event Log, or Web Server (NTOnly) monitors.
2. Monitoring remote NT servers requires that the SiteScope service runs in a user account that haspermission to access the NT performance registry on the remote server to be monitored. Use theServices control panel to make changes to the user account used by the SiteScope service. Select theSiteScope service from the list of services, click the Startup button, and fill in the Log On As fieldswith an account that can access the remote servers. Stop and start the SiteScope service to start usingthe new account.
To monitor a remote server, perform the following steps:
1. Select one of the applicable monitors: CPU, Disk Space, Memory, Service, Script(Unix Only), NTPerformance Counter, NT Event Log, or Web Server (NT Only) monitors.
2. On the Add a new monitor page, click on the "Choose Server" link to the right of the Server displaybox.
3. Use the "Server" pull-down menu box to select a server from the list of servers in the current domain.For servers that are outside the current domain, enter the server name in the "Other Server" field.
4. Press the Choose Server button and fill out the remaining fields for the monitor.
For more information about remotely monitoring both Unix and NT servers, read the RemoteServers document.
SiteScope User Guide
How do I duplicate a monitor? 27

Composite Monitor
The SiteScope Composite Monitor is designed to simplify the monitoring of complex network environmentsby checking the status readings of a set of other SiteScope monitors and/or monitor groups.
Each time the Composite Monitor runs, it returns a status based upon the the number and percentage of itemsin the specified monitors and/or groups currently reporting an error, warning, or OK status. It writes thepercentages reported in the monitoring log file.
Usage Guidelines
Why should I use this monitor?
One reason you should use this monitor is if you want to create complex monitor alert logic. For example, ifyou wanted to trigger an alert when:
• 5 or more monitors in a group of 8 are in error• 3 or more groups have monitors with errors in them• of two monitors, exactly 1 in error
then you could create a Composite Monitor that went into error on these conditions, and then add alerts onthe Composite Monitor to take the desired actions.
What should I monitor?
If you need alert logic that is more complex than SiteScope's standard alerts will allow, the CompositeMonitor may help.
How should I schedule my monitors?
The Composite Monitor is very lightweight, so schedule it to run at least as often as the most frequentmonitor that it is watching.
Status
The status is logged as good, warning or error. By default, the Composite Monitor will be in error if any ofthe monitors and/or groups that it is monitoring are in error.
If you would like for SiteScope to respond if an error status is returned, create an alert. An alert containsinstructions that tell SiteScope to either notify you via e-mail or pager, or execute an automatic recoveryscript when a problem is detected.
Composite Monitor 28

Completing the Composite Monitor Form
To display the Composite Monitor Form, either click the name of an existing Composite Monitor in amonitor table, or click the Add a new Monitor to this Group link on a group's detail page and choose theAdd Composite Monitor link.
Complete the fields on the Composite Monitor form as follows. When all the fields are complete, click theAdd Monitor button.
Items
Choose one or more (using control-click) monitors and/or groups that the Composite Monitorwill be comprised of.
Update every:
Enter how frequently the monitor should check the status readings of the selected monitorsand/or groups. The pull-down menu to the right of the entry field lets you specify timeincrements of seconds, minutes, hours, or days. You must specify a time increment of at least15 seconds.
Title: (Optional)
Enter a name for this monitor. This name appears in the Name field on the monitor tablewhen you open the group's detail page. If you don't enter a name, a default name will becreated.
Advanced Options
The advanced options give you the ability to customize error and warning thresholds. If you choose not to setthem, SiteScope will use preset defaults if available. If a default is not available, SiteScope will not be able toutilize the condition.
Disable
Check this box to temporarily disable this monitor and any associated alerts. To enable themonitor again, un-check the box.
Run Monitors:
Check this box if you want the Composite Monitor to actually run the monitors, as opposedto just checking their status readings. Any monitors that are to be run this way probablyshouldn't be run on their own, so edit them and blank out the " Update Every" field. This willinsure that they're only run by the Composite Monitor. This is useful if you want to makesure that the monitors run one after another or run at approximately the same time.
SiteScope User Guide
Completing the Composite Monitor Form 29
Monitor Delay:
If Run Monitors is checked, this is the number of seconds to wait between running eachmonitor. This setting is useful if you need to wait for processing to occur on your systemsbefore running the next monitor.
Check All Monitors in Group(s)
By default, a group is checked and counted as a single item when checking status readings. Ifthis box is checked, all of the monitors in selected groups (and their subgroups) are checkedand counted.
Verify Error
Check this box if you want SiteScope to automatically run this monitor again if it detects anerror.
Update Every (on error)
This options allows you to set a new monitoring interval for monitors that have registered anerror condition. For example, you may want SiteScope to monitor this item every 10 minutesnormally, but as often as every 2 minutes if an error has been detected. Note that thisincreased scheduling will also affect the number of alerts generated by this monitor.
Schedule (Optional)
By default, SiteScope's monitors are enabled every day of the week. You may, however,schedule your monitors to run only on certain days or on a fixed schedule. Choose theEdit schedule link to create or edit a monitor schedule. For information about creatingschedules, read the instructions for Schedules.
Monitor Description (Optional)
Enter additional information about this monitor. The description will appear on the MonitorDetail page.
Report Description (Optional)
Enter a description for this monitor that will make it easier to understand what this monitordoes. The description will appear on Management Reports and on the info popup for amonitor.
List Order (Optional)
By default, new monitors are listed last on the Monitor Detail page. You may use thispull-down menu to choose a different placement for this monitor.
Error if:
Set the conditions under which the Composite Monitor should report an error status. Use thedrop-down menu to select a criteria based on the total number of items or a percentage (%) of
SiteScope User Guide
Advanced Options 30

items reporting a given status. Next select the logic operator(s) for the error criteria. Thenenter the value to be used as the threshold or trigger for this condition.
Warning if
Set the conditions under which the Composite Monitor should report a warning status. Usethe steps outlined in the "Error if" section above.
Good if
Set the conditions under which the Composite Monitor should report a good status. Use thesteps outlined in the "Error if" section above.
SiteScope User Guide
Advanced Options 31
CPU Utilization Monitor
The SiteScope CPU Utilization Monitor reports the percentage of CPU time that's currently being used onthe server. It's important to watch CPU usage on your Web server to ensure that it doesn't becomeoverloaded on a regular basis.
Each time the CPU Utilization Monitor runs, it returns a status message and writes it in a log file.
Usage Guidelines
Why should I use this monitor?
When CPU usage becomes too high, visitors to your site will either find it very slow, or if your web serverhangs as a result of the high usage, they simply won't be able to access it. Therefore, it's very important tokeep an eye your CPU usage and do something about high usage before it causes you problems.
What should I monitor?
Whether you're running a machine with a single CPU or one with multiple CPUs, you only need to createone CPU monitor. If you have multiple CPUs, SiteScope will report on the average usage for all of them.
How should I schedule my monitors?
In general, the CPU Monitor doesn't need to be run as often as some of the other monitors. If you don'tusually suffer from CPU problems, you can run it less frequently - perhaps every half hour or so. If you areprone to CPU usage problems, you should run it more frequently. All machines will have short spikes of CPUusage, but the primary thing that you're looking for is high usage on a regular basis. This indicates that yoursystem is overloaded and that you need to look for a cause.
Status
The reading is the current value returned by this monitor; for example, 68% used. SiteScope displays anaverage for multiple CPU systems. On NT, this is the average CPU usage between runs of the monitor. OnUnix, this is the instananeous CPU when the monitor runs.
The status is logged as either OK or warning. A warning status is returned if the CPU is in use more than90% of the time. If you would like for SiteScope to respond if a warning status is returned, create an alert. Analert contains instructions that tell SiteScope to either notify you via e-mail or pager, or execute an automaticrecovery script when a problem is detected.
CPU Utilization Monitor 32

Completing the CPU Utilization Monitor Form
To display the CPU Utilization Monitor form, either click the name of an existing CPU Utilization Monitor ina monitor table, or click the " Add a new Monitor to this group" link on a group's detail page and choose the" Add CPU Utilization Monitor" link.
Complete the fields on the CPU Utilization Monitor form as follows. When all the fields are complete, clickthe Add Monitor button.
Server:
Choose the server that you want to monitor. The default is to monitor CPU usage on thisserver. Click the choose server link to monitor CPU usage on another server.
Update every:
Enter how frequently the CPU's utilization should be monitored. The pull-down menu to theright of the entry field lets you specify time increments of seconds, minutes, hours, or days.You must specify a time increment of at least 15 seconds.
Title: (Optional)
Enter a name for this monitor. This name appears in the Name field on the monitor tablewhen you open the group's detail page. If you don't enter a name, a default name will becreated.
Advanced Options
The advanced options give you the ability to customize error and warning thresholds. If you choose not to setthem, SiteScope will use preset defaults if available. If a default is not available, SiteScope will not be able toutilize the condition.
Disable
Check this box to temporarily disable this monitor and any associated alerts. To enable themonitor again, un-check the box.
Verify Error
Check this box if you want SiteScope to automatically run this monitor again if it detects anerror.
Update Every (on error)
This options allows you to set a new monitoring interval for monitors that have registered an
SiteScope User Guide
Completing the CPU Utilization Monitor Form 33
error condition. For example, you may want SiteScope to monitor this item every 10 minutesnormally, but as often as every 2 minutes if an error has been detected. Note that thisincreased scheduling will also affect the number of alerts generated by this monitor.
Schedule (Optional)
By default, SiteScope's monitors are enabled every day of the week. You may, however,schedule your monitors to run only on certain days or on a fixed schedule. Choose theEdit schedule link to create or edit a monitor schedule. For information about creatingschedules, read these instructions.
Monitor Description (Optional)
Enter additional information about this monitor. The description will appear on the MonitorDetail page.
Report Description (Optional)
Enter a description for this monitor that will make it easier to understand what this monitordoes. The description will appear on Management Reports and on the info popup for amonitor.
List Order (Optional)
By default, new monitors are listed last on the Monitor Detail page. You may use thispull-down menu to choose a different placement for this monitor.
Error if:
By default, SiteScope only generates a warning status for the CPU monitor. You may chooseto have SiteScope generate an error based on either the actual amount of CPU in use or thepercentage of CPU in use. Use the comparison value and comparison operator pop-up tospecify an error threshold such as: >= (greater than or equal to), != (not equal to), or < (lessthan).
Warning if
By default, SiteScope generates warnings whenever CPU usage goes over 90%, but you canchange this to generate a warning based uponn a different percentage or an actual ammountof CPU in use. Complete this section just as you would for the Error if section, describedabove.
Good if
SiteScope reports a good status for CPU monitors. You may change this to a specificpercentage if you prefer.
SiteScope User Guide
Advanced Options 34

Database Monitor
The SiteScope Database Monitor checks that a database is working correctly by connecting to it andperforming a query. Optionally, it can check the result for expected content.
Each time the Database Monitor runs, it returns a status, the time it takes to perform the query, the number ofrows in the query result, and the first two fields in the first row of the result and writes them in the monitoringlog file.
In this section we include discussion of:
• Usage guidelines• Completing the Database Monitor form• Accessing Oracle databases without using ODBC• Monitoring Informix databases• Monitoring mySQL databases
Usage Guidelines
Why should I use this monitor?
If your database application is not working properly, the user may not be able to access web content andforms that depend on the database. Most importantly, the user won't be able to complete e-commercetransactions that use the database. The other reason to monitor database queries is so you can findperformance bottlenecks. If the database interaction time and the associated user URL retrieval times are bothincreasing at about the same amount, the database is probably the bottleneck. If not, the bottleneck isprobably somewhere else in the network.
What should I monitor?
The most important thing to monitor are the queries used by your most frequently used and most importantweb applications. If more than one database is used, you'll want to monitor each of the databases.
You may also choose to monitor internal database statistics. The statistics provided by each database aredifferent but may include items such as database free space, transaction log free space, transactions/second,and average transaction duration.
How should I schedule my monitors?
You may want to monitor your most critical and most common queries frequently, every 2-5 minutes. Formonitoring other database statisitics that change less frequently, every 30 or 60 minutes should be fine.
Database Monitor 35
Status
The status is logged as either good, warning, or error. A warning status or error status is returned if thecurrent value of the monitor is a condition that you have defined as other than OK. If you would like forSiteScope to send a notification if a warning or an error status is returned, create an alert. An alert containsinstructions that tell SiteScope to either notify you via e-mail, pager, or SNMP trap. An alert can also be usedto have SiteScope trigger the execution of an automatic recovery script when a problem is detected.
If you would like for SiteScope to respond if an error status is returned, create an alert. An alert containsinstructions that tell SiteScope to either notify you via e-mail or pager, or execute an automatic recoveryscript when a problem is detected.
Completing the Database Monitor Form
To display the Database Monitor Form, either click the name of an existing Database Monitor in a monitortable, or click the Add a new Monitor to this Group link on a group's detail page and choose the AddDatabase Monitor link.
Complete the fields on the Database Monitor form as follows. When all the fields are complete, click theAdd Monitor button.
Database Connection URL
Enter a URL to a Database Connection. The easiest way to create a database connection is touse ODBC to create a named connection to a database. For example, first use the ODBCcontrol panel to create a connection called test. Then, enter jdbc:odbc:test in this field as theconnection URL.
Query
Enter the SQL query to test. For example, select * from sysobjects.
Update every:
Enter how frequently the monitor should check the Database server. The pull-down menu tothe right of the entry field lets you specify time increments of seconds, minutes, hours, ordays. You must specify a time increment of at least 15 seconds.
Title: (Optional)
Enter a name for this monitor. This name appears in the Name field on the monitor tablewhen you open the group's detail page. If you don't enter a name, a default name will becreated.
Advanced Options
SiteScope User Guide
Status 36
The advanced options give you the ability to customize error and warning thresholds. If you choose not to setthem, SiteScope will use preset defaults if available. If a default is not available, SiteScope will not be able toutilize the condition.
Disable
Check this box to temporarily disable this monitor and any associated alerts. To enable themonitor again, un-check the box.
Match Content:
Enter a string of text to check for in the query result. If the text is not contained in the result,the monitor will display no match on content. The search is case sensitive. This works forXML tags as well.You may also perform a Perl regular expression match by enclosing the string in forwardslashes, with an "i" after the trailing slash indicating case-insensitive matching. (for example,/href=Doc\d+\.html/ or /href=doc\d+\.html/i). If you want a particular piece of textto be saved and displayed as part of the status, use parentheses in a Perl regular expression.For example /Temperature: (\d+)/. This would return the temperature as it appears on thepage and this could be used when setting an Error if or Warning if threshold.
Database Username
Enter the username used to login to the database. If you are using Microsoft SQL server, youcan leave this blank and choose NT Authentication when you setup the ODBC connection.With NT Authentication, SiteScope will connect using the login account of the SiteScopeservice.
Database Password
Enter a password used to login to the database. If you are using Microsoft SQL server, youcan leave this blank and choose NT Authentication when you create the ODBC connection.With NT Authentication, SiteScope will connect using the login account of the SiteScopeservice.
Database Driver
Enter the java class name of the JDBC database driver. The default,sun.jdbc.odbc.JdbcOdbcDriver, uses ODBC to make Database connections. If a customdriver is used, the driver must also be installed in the SiteScope java directory.
Verify Error
Check this box if you want SiteScope to automatically run this monitor again if it detects anerror.
Update Every (on error)
This options allows you to set a new monitoring interval for monitors that have registered anerror condition. For example, you may want SiteScope to monitor this item every 10 minutes
SiteScope User Guide
Advanced Options 37

normally, but as often as every 2 minutes if an error has been detected. Note that thisincreased scheduling will also affect the number of alerts generated by this monitor.
Schedule (Optional)
By default, SiteScope's monitors are enabled every day of the week. You may, however,schedule your monitors to run only on certain days or on a fixed schedule. Choose theEdit schedule link to create or edit a monitor schedule. For information about creatingschedules, read these instructions.
Monitor Description (Optional)
Enter any additional information to describe this monitor. The description will appear on theMonitor Detail page.
Report Description (Optional)
Enter a description for the report for this monitor that will make it easier to understand whatthis monitor does. The description will appear on Management Reports and on the infopop-up for the monitor.
List Order (Optional)
By default, new monitors are listed last on the Monitor Detail page. You may use thepull-down menu to choose a different placement for this monitor.
Error if:
Set the conditions under which the Database Monitor should report an error status. Use thedrop-down menu to select a criteria based on the the content of the results or a performancevalue. Next select the logic operator(s) for the error criteria. Then enter the value to be usedas the threshold or trigger for this condition.
Warning if
Set the conditions under which the Database Monitor should report a warning status. Use thesteps outlined in the "Error if" section above.
Good if
Set the conditions under which the Database Monitor should report a status of "good". Usethe steps outlined in the "Error if" section above.
Oracle Database Monitoring
If you want to monitor an Oracle database without using ODBC, a good alternative is to use the Oracle ThinJDBC Drivers. To set up SiteScope for to use the JDDB Thin Drivers:
SiteScope User Guide
Advanced Options 38

1. Download the Oracle Thin JDBC drivers from http://technet.oracle.com/software/download.htm
2. Copy the downloaded driver package into the SiteScope\java\lib\ext subdirectory.3. Stop and restart the SiteScope service.4. Now, use your browser to add a Database Monitor within SiteScope.
The Database Connection URL format for the Oracle JDBC driver is:
jdbc:oracle:thin:@<tcp address>:<tcp port>:<database sid>
For example to connect to the ORCL database on a machine using port 1521 you would use:
jdbc:oracle:thin:@206.168.191.19:1521:ORCL
The Database Driver for the Oracle thin JDBC driver is:
oracle.jdbc.driver.OracleDriver
Enter this string into the Database Driver field under the Advanced Options section of the Add DatabaseMonitor form.
If you try to connect to the database and get an error like:
Refused:OR=(CODE=12505)(EMFI=4))))
the database SID is probably incorrect (ORCL part). This error can also occur when the tcp address, or tcpport is incorrect. If this is the case, verify the tcp port and check with the your database administrator toverify the proper SID.
If you try the connection and get an error like:
String Index out of range: -1
then part of the URL is probably missing. You need to provide the database server address, port, and thedatabase SID.
Informix Database Monitoring
Monitoring a Informix database requires the use of a JDBC driver. To enable SiteScope to monitor anInformix database:
1. Download the Informix 1.4 JDBC driver from Informix. See the Informix web site for details.2. Uncompress the distribution file3. Open a DOS window and go to the jdbc140jc2 directory4. Unpack the driver by running the following command: c:\SiteScope\java\bin\java -cp .setup.class
5. Copy ifxjdbc.jar to the SiteScope\classes\ directory.6. Use RegEdt32 to change the key for:
SiteScope User Guide
Oracle Database Monitoring 39
HKEY_LOCAL_MACHINE\SYSTEM\CurrentControlSet \Services\SiteScope\serviceParam\
from:
-noasyncgc -mx64m -cp . SiteScope x
to:
-noasyncgc -mx64m -cp . -cp ifxjdbc.jar SiteScope x
7. Stop and restart SiteScope8. Now, use your browser to add a Database Monitor within SiteScope.
The Database Connection URL format for the Informix JDBC driver is:
jdbc:informix-sqli://<database hostname>:<tcp port><databaseserver>:INFORMIXSERVER=<database>
For example to connect to the Database Server sysmaster running on the machine calledpond.freshtech.com and the Database called maindbase, you would use:
jdbc:informix-sqli://pond.freshtech.com:1526/sysmaster:INFORMIXSERVER=maindbase;
The Database Driver for the Informix JDBC driver is:
com.informix.jdbc.IfxDriver
Enter this string into the Database Driver field under the Advanced Options section of the Add DatabaseMonitor form.
MySQL Database Monitoring
Monitoring a MySQL database requires the use of a JDBC driver. To enable SiteScope to monitor a MySQLdatabase:
1. Download the JDBC driver from http://www.worldserver.com/mm.mysql/2. Uncompress the distribution file3. Among all the other files, you should find a file called mysql.jar. A .jar file is a form of .zip file with
extra information, so unzip the mysql.jar file(preserving the pathnames)4. After unzipping the file, you should end up with a directory named:
gjt/mm/mysql
inside of which should be a number of *.class files.5. Copy the contents of the gjt directory into the SiteScope/classes/org directory6. Stop and restart SiteScope7. Now, use your browser to add a Database Monitor within SiteScope.
The Database Connection URL format for the MySQL JDBC driver is:
jdbc:mysql://<database hostname>[:<tcp port>]/<database>
SiteScope User Guide
Informix Database Monitoring 40

For example to connect to the MySQL database "aBigDatabase" on a machine using the standard MySQLport number 3306 you would use:
jdbc:mysql://206.168.191.19/aBigDatabase
If you are using a different port to connect to the database then you should include that port number as part ofthe IP address.
The specification for the MySQL JDBC driver is: org.gjt.mm.mysql.Driver
Enter this string into the Database Driver field under the Advanced Options section of the Add DatabaseMonitor form.
If, after setting this up, you get an authorization error in the Database Monitor, then you may have to grantrights for the SiteScope machine to access the MySQL database. Consult the MySQL Database administratorfor setting up privileges for the SiteScope machine to access the MySQL server.
SiteScope User Guide
MySQL Database Monitoring 41
Directory Monitor
The Directory Monitor watches an entire directory and reports on the total number of files in the directory aswell as the total amount of disk space used by those files. This information is useful if you have limited diskspace, or want to monitor the number of files written to a specific directory.
Usage Guidelines
Why should I use this monitor?
The Directory Monitor is very useful for watching directories that contain log files or other files that tend togrow and multiply unpredictably. You can instruct SiteScope to notify you if either the number of files ortotal disk space used gets out of hand.
What should I monitor?
This monitor is most useful for directories that contain files that can grow large enough to cause you diskspace problems, or directories in which new files are added and deleted frequently. A good example of thelatter is an FTP directory. In the case of an FTP directory, you'll probably want to watch both the numberfiles in the directory and the files contained in the directory.
How should I schedule my monitors?
Because the uses for the Directory Monitor vary so greatly there's no one interval that works best. Keep inmind that if you're watching a directory that contains a lot of files and subd-directorys, this monitor couldtake longer to run.
Status
The reading is the current value of the monitor, such as 15 files and 15K for this monitor. SiteScope willreport a warning status if the number of files in the monitored directory exceeds 1000. If you'd like to benotified if a warning condition exists, create an alert.
Completing the Directory Monitor Form
To display the Directory Monitor Form, either click the name of an existing Directory Monitor in a monitortable, or click the "Add a new Monitor to this Group" link on a group's detail page and choose the "NewDirectory Monitor" link.
Complete the fields on the Directory Monitor Form as follows. When all the fields are complete, click theAdd Monitor button.
Directory Monitor 42
Directory:
Enter the directory that you want to monitor.
Update every:
Enter how frequently the monitor should check this directory. The pull-down menu to theright of the entry field lets you specify time increments of seconds, minutes, hours, or days.You must specify a time increment of at least 15 seconds.
Title: (Optional)
Enter a name for this monitor. This name appears in the Name field on the monitor tablewhen you open the group's detail page. If you don't enter a name, a default name will becreated.
Advanced Options
The advanced options give you the ability to customize error and warning condition thresholds. If you choosenot to set them, SiteScope uses pre-set defaults if available. If a default is not available, SiteScope cannotutilize the condition.
Disable
Check this box to temporarily disable this monitor and any associated alerts. To enable themonitor again, un-check the box.
No Subdirectories
Check this box if you do not want SiteScope to count subdirectories.
File Name Match
Optional, enter text or an expression to match against. Only filenames which match will becounted in the totals.
Verify Error
Check this box if you want SiteScope to immediately run the monitor again in the event anerror is returned. This can help to detect temporary problems and prevent false alerts frombeing sent.
Update every (on error)
Enter the amount of time that SiteScope should wait between checks when the status of themonitor is anything but ok. If you don't enter a value here, the Update value from above is
SiteScope User Guide
Completing the Directory Monitor Form 43
used. This setting allows you to have SiteScope check more or less frequently than usualwhen the monitored item is not reporting an ok status.
Schedule
You may specify when this monitor should be enabled. By default, it is enabled every day ofthe week. You may specify specific times for the settings to be either enabled or disabled bytyping a from and to time in the appropriate fields and then choosing either the enable or thedisable button. Note: All times should be entered in 24 hour notation. For example, youwould enter 13:00 instead of 1:00 PM, and 15:00 instead of 3:00 PM. You can use the scheduling feature in the following way. If you have a person who shouldonly be e-mailed during normal business hours, you can type 8:00 and 17:00 in the from andto fields for Monday through Friday. You would then also need to specify that this monitorshould be disabled for all of Saturday and Sunday.
Monitor Description
Enter an additional string of text describing this monitor. This text will appear on theMonitor Detail page, making it easier to quickly identify what's being monitored from thispage.
List Order
Choose where you want this monitor to be listed on the Monitor Detail page.
Error if:
Set the error threshold for this monitor. Choose one of the following two options from thepull-down menu and then type the new threshold in the text entry box. You must enter awhole number.
♦ Number of files >=Choose this option if you would like SiteScope to generate an error status if the number offiles in the monitored directory exceeds a given number. Enter the lowest number of files thatshould trigger an error status in the text entry box. For example, if you want SiteScope togenerate an error if there are 50 or more files in this directory, type 50 in the text entry box.
♦ total of file sizes>=Choose this option if you would like SiteScope to generate an error status if the total size ofthe directory exceeds a certain number of bytes. Enter the smallest size (in bytes) that shouldtrigger an error status in the text entry box. For example, if you want SiteScope to generatean error if the size of the directory reaches or exceeds 100,000 bytes, type 100000 in the textentry box (notice that you do not need to enter commas).
Warning if:
Set the warning threshold for this monitor. By default SiteScope reports a warning conditionif the number of files in the directory exceeds 1000. If you would like to change the warningthreshold, choose one of the following options from the pull-down menu.
SiteScope User Guide
Advanced Options 44
Number of files >=Choose this option if you would like SiteScope to generate a warning status if the number offiles in the monitored directory exceeds a given number. Enter the lowest number of files thatshould trigger a warning status in the text entry box. For example, if you want SiteScope togenerate a warning if there are 50 or more files in this directory, type 50 in the text entry box.total of file sizes>=Choose this option if you would like SiteScope to generate a warning status if the total sizeof the directory exceeds a certain number of bytes. Enter the smallest size (in bytes) thatshould trigger a warning status in the text entry box. For example, if you want SiteScope togenerate a warning if the size of the directory reaches or exceeds 100,000 bytes, type 100000in the text entry box (notice that you do not need to enter commas).
Good if:
Enter the reading that SiteScope should consider as a good reading for this monitor. Bydefault, SiteScope assumes the monitor is in a good state unless the criteria for a warning orerror status are met.
SiteScope User Guide
Advanced Options 45

Disk Space Monitor
The SiteScope Disk Space Monitor provides an easy way for you to track how much disk space is currently inuse on your server. A full disk can cause a host of problems including system crashes and corrupt files.
Each time the Disk Space Monitor runs, it returns a status message and writes it in the monitoring log file.
Usage Guidelines
Why should I use this monitor?
Running out of disk space can cause a host of problems both large and small, and it's something that canhappen slowly over time or very rapidly. Having SiteScope verify that your disk space is within acceptablelimits can save you from a crashed system and corrupted files.
How should I schedule my monitors?
The disk space monitor doesn't require many resources, so you can check it as often as you like, but every 10minutes should be sufficient. You can specify both warning and error thresholds so that SiteScope can notifyyou of a potential problem in time for you to do something about it. You may even want to have SiteScopeexecute a script that deletes all files in certain directories, such as /tmp, when space becomes constrained.
Status
The status reading is the current value of the monitor, such as 40% full for this monitor. The status is loggedas either OK, warning, or error. A warning status is returned if the disk is more than 95% full. An error statusis returned if the disk is more than 98% full.
If you would like for SiteScope to respond if a warning or error status is returned, create an alert. An alertcontains instructions that tell SiteScope to either notify you via e-mail or pager, or execute an automaticrecovery script when a problem is detected.
Completing the Disk Space Monitor Form
To display the Disk Space Monitor Form, either click the name of an existing Disk Space Monitor in amonitor table, or click the Add a new Monitor to this Group link on a group's detail page and choose theAdd Disk Space Monitor link.
Complete the fields on the Disk Space Monitor Form as follows. When all the fields are complete, click theUpdate Monitor button.
Disk Space Monitor 46

Server:
Choose the server that you want to monitor. The default is to monitor disks on the server onwhich SiteScope is installed. Click the choose server link to monitors disks on anotherserver.
Disk:
Choose the disk drive that you want to monitor from the pop-up list.
Update every:
Enter how frequently the monitor should check this drive. The pull-down menu to the rightof the entry field lets you specify time increments of seconds, minutes, hours, or days. Youmust specify a time increment of at least 15 seconds.
Title: (Optional)
Enter a name for this monitor. This name appears in the Name field on the monitor tablewhen you open the group's detail page. If you don't enter a name, a default name will becreated.
Advanced Options
The advanced options give you the ability to customize error and warning condition thresholds. If you choosenot to set them, SiteScope uses pre-set defaults if available. If a default is not available, SiteScope cannotutilize the condition.
Disable
Check this box to temporarily disable this monitor and any associated alerts. To enable themonitor again, un-check the box.
Verify Error
Check this box if you want SiteScope to automatically run this monitor again if it detects anerror.
Update Every (on error)
This options allows you to set a new monitoring interval for monitors that have registered anerror condition. For example, you may want SiteScope to monitor this item every 10 minutesnormally, but as often as every 2 minutes if an error has been detected. Note that thisincreased scheduling will also affect the number of alerts generated by this monitor.
Schedule (Optional)
SiteScope User Guide
Completing the Disk Space Monitor Form 47
By default, SiteScope's monitors are enabled every day of the week. You may, however,schedule your monitors to run only on certain days or on a fixed schedule. Choose theEdit schedule link to create or edit a monitor schedule. For information about creatingschedules, read the instructions on Schedules.
Monitor Description (Optional)
Enter additional information about this monitor. The description will appear on the MonitorDetail page.
Report Description (Optional)
Enter a description for this monitor that will make it easier to understand what this monitordoes. The description will appear on Management Reports and on the info pop-up for amonitor.
List Order (Optional)
By default, new monitors are listed last on the Monitor Detail page. You may use thispull-down menu to choose a different placement for this monitor.
Error if:
Set the Error threshold for this monitor. By default SiteScope reports an error condition ifyour disk becomes more than 98% full. If you want to change the error threshold, choosepercent full and = from the pull-down menus and then type the new threshold in the textentry box. The value you enter must be a whole number.For example, if you want SiteScope to report an error condition if your disk becomes 96%full, you need to choose percent full and = from the pull-down menus and then enter "96" inthe comparison value text entry box.
Warning if:
Set the warning threshold for this monitor. By default SiteScope reports a warning conditionif your disk becomes more than 95% full, but less than the error threshold. If you would liketo change the warning threshold, choose percent full >= from the pull-down menu and typethe new threshold in the text entry box. You must enter a whole number.For example, if you want to change the warning threshold to 90%, choose percent full>= from the pull-down menu and then enter 90 in the text entry box.
Good if:
If you'd like, you can set conditions that must be met in order for SiteScope to return an OKstatus. If you don't set this, SiteScope will assume that the monitor should return an OKstatus unless either the Error or Warning thresholds are reached. The symbols in the comparison value pop-up are the same as those for Error if.
SiteScope User Guide
Advanced Options 48
DNS Monitor
The SiteScope DNS Monitor checks a Domain Name Server via the network. It verifies that the DNS serveris accepting requests, and also verifies that the address for a specific domain name can be found.
Each time the DNS Monitor runs, it returns a status and writes it in the monitoring log file. It also writes thetotal time it takes to receive the designated document in the log file.
Usage Guidelines
Why should I use this monitor?
If your DNS server is not working properly, you won't be able to get out on the network and people trying toreach your server won't be able to find it. Therefore, it's important that you monitor your DNS server(s) toensure that they are working properly.
What should I monitor?
Most companies have both a primary and a secondary DNS server. If your company employs a firewall, theseservers may sit outside the firewall with another DNS server located inside the firewall. This internal DNSserver provides domain name service for internal machines. It's important to monitor all of these servers toensure that each is functioning properly.
How should I schedule my monitors?
If your DNS servers fail, people will start complaining that "everything's broken", so you should monitorthem often. Let's assume that you have both a primary and secondary DNS server outside your firewall andan internal DNS server inside your firewall. Your internal server is critical, so you should monitor that oneevery 2 - 5 minutes. That's also a good interval for your primary DNS server that sits outside of your firewall.You can monitor the secondary DNS server less often. Every 10 or 15 minutes should be fine.
Status
The status is logged as either good, warning, or error. A warning status or error status is returned if thecurrent value of the monitor is a condition that you have defined as other than OK. If you would like forSiteScope to send a notification if a warning or an error status is returned, create an alert. An alert containsinstructions that tell SiteScope to either notify you via e-mail, pager, or SNMP trap. An alert can also be usedto have SiteScope trigger the execution of an automatic recovery script when a problem is detected.If you would like for SiteScope to respond if an error status is returned, create an alert. An alert containsinstructions that tell SiteScope to either notify you via e-mail or pager, or execute an automatic recoveryscript when a problem is detected.
DNS Monitor 49

Completing the DNS Monitor Form
To display the DNS Monitor Form, either click the name of an existing DNS Monitor in a monitor table, orclick the "Add a new Monitor to this Group" link on a group's detail page and choose the "Add DNSMonitor" link.
Complete the fields on the DNS Monitor form as follows. When all the fields are complete, click the"Add Monitor" button.
Server Address:
Enter the IP address of the DNS server that you want to monitor (for example,206.168.191.1).
Host Name:
Enter the host name to lookup (for example, demo.freshtech.com).
Update every:
Enter how frequently the monitor should check the DNS server. The pull-down menu to theright of the entry field lets you specify time increments of seconds, minutes, hours, or days.You must specify a time increment of at least 15 seconds.
Title: (Optional)
Enter a name for this monitor. This name appears in the Name field on the monitor tablewhen you open the group's detail page. If you don't enter a name, a default name will becreated.
Advanced Options
The advanced options give you the ability to customize error and warning thresholds. If you choose not to setthem, SiteScope will use preset defaults if available. If a default is not available, SiteScope will not be able toutilize the condition.
Disable
Check this box to temporarily disable this monitor and any associated alerts. To enable themonitor again, un-check the box.
Host address: (Optional)
Optionally, the address returned by the DNS server can be verified. Enter the expected IPaddress for the domain name.
SiteScope User Guide
Completing the DNS Monitor Form 50
Verify Error
Check this box if you want SiteScope to automatically run this monitor again if it detects anerror.
Update Every (on error)
This options allows you to set a new monitoring interval for monitors that have registered anerror condition. For example, you may want SiteScope to monitor this item every 10 minutesnormally, but as often as every 2 minutes if an error has been detected. Note that thisincreased scheduling will also affect the number of alerts generated by this monitor.
Schedule (Optional)
By default, SiteScope's monitors are enabled every day of the week. You may, however,schedule your monitors to run only on certain days or on a fixed schedule. Choose theEdit schedule link to create or edit a monitor schedule. For information about creatingschedules, read these instructions.
Monitor Description (Optional)
Enter additional information about this monitor. The description will appear on the MonitorDetail page.
Report Description (Optional)
Enter a description for this monitor that will make it easier to understand what this monitordoes. The description will appear on Management Reports and on the info pop-up for amonitor.
List Order (Optional)
By default, new monitors are listed last on the Monitor Detail page. You may use thispull-down menu to choose a different placement for this monitor.
Error if:
Set the conditions under which the DNS monitor should report an error status. To set theerror threshold, choose milliseconds >= from the pull-down menu and then, in the text entrybox, enter the lowest value which should trigger a error condition . The value entered mustbe a whole number.
Warning if
Set the conditions under which the DNS monitor should report a warning status. To set thewarning threshold, choose milliseconds >= from the pull-down menu and then, in the textentry box, enter the lowest value which should trigger a warning condition . The valueentered must be a whole number.
SiteScope User Guide
Advanced Options 51

Good if
By default, this monitor returns a status of "good" if the monitor received a status code of200. You can change it to return a good value based upon round-trip time.
SiteScope User Guide
Advanced Options 52
eBusiness Transaction Chain Monitor
The SiteScope eBusiness Transaction Chain Monitor enables you to verify the multiple tasks that make up anonline transaction are completed properly, ensuring end-to-end transaction success. This may includesuccessful navigation through a series of URLs, transmission of an e-mail confirming the transaction, andlogging the information into a database file. This monitor runs a sequence of other SiteScope monitors,checking that each monitor returns a status of OK. If any monitor in the transaction sequence fails, theeBusiness Transaction Chain Monitor reports an Error status.
Each time the eBusiness Transaction Chain Monitor runs, it returns a status based upon the the number andpercentage of items in the specified monitors and/or groups currently reporting an error, warning, or OKstatus. It writes the percentages reported in the monitoring log file.
Usage Guidelines
Why should I use this monitor?
Use this monitor to verify that an end-to-end transaction and associated processes complete properly. Forexample, you could use this monitor to verify that the following steps, each of which is a step in a singletransaction, execute properly:
• Place an order on a web site (URL Transaction monitor)• Check that the order status was updated (URL Transaction monitor)• Check that a confirmation email was received (Mail monitor)• Check that the order was added to the order database (Database monitor)• Check that the order was transferred to a legacy system (Script monitor or Custom monitor)
Using this example, you would first create the URL Transaction monitor, Mail monitor, Database monitor,and applicable Script monitor needed to verify each step of the chain. Then you would create an eBusinessTransaction Chain Monitor and select each of these SiteScope monitors as a group in the order they should beexecuted. If any one monitor indicates a failure, the eBusiness Transaction Chain Monitor will report anerror.
How do I edit the order of the monitors in the chain?
By default, Add eBusiness Transaction Chain Monitor page will list monitor groups and individual monitorsin the order they are created. To have the eBusiness Transaction Chain Monitor invoke the chain of monitorsin the proper order, they will need to appear in the proper order in the selection menu on the Add eBusinessTransaction Chain Monitor page. You can do this by creating the individual monitors in the order which theyshould be executed (see Setup section below). You can also use the "Reorder the monitors in this group"option on the Monitor Group page
What should I monitor?
eBusiness Transaction Chain Monitor 53

You should monitor any multi-step transaction process that causes other updates or actions in your systems.Monitor each of the actions taken to ensure that updates were performed properly and that actions werecarried out successfully.
How should I schedule my monitors?
The general rule of thumb is to run these monitors every 10 minutes or so. If you have a very criticaltransaction process, you may want to run them more often.
Status
The status for the monitor is logged as good or error. By default, the eBusiness Transaction Chain Monitorwill be in error if any of the monitors and/or groups it is monitoring are in error.
If you would like for SiteScope to respond if an error status is returned, create an alert. An alert containsinstructions that tell SiteScope to either notify you via e-mail, pager or SNMP trap, or execute an automaticrecovery script when a problem is detected.
Setting up Monitors for the eBusiness Transaction Chain
Before you can add an eBusiness Transaction Chain Monitor, you will need to define other SiteScopemonitors that will report on the actions and results of the steps in the transaction chain. Using the examplefrom the usage guidelines above, you might create one or more URL Transaction monitors for verifying thesequence of online actions, a mail monitor to confirm that an e-mail acknowledgement is sent, and a databasemonitor to see that information entered online is logged into a database. For ease of administration, use thefollowing steps to set up a transaction chain monitor:
1. Create a new group that will contain all the individual monitors to be included in the transaction chain2. Open the new monitor group3. Add the first individual monitor type needed to for the transaction (e.g URL Transaction Monitor).
Note: Monitors should be added in the order that they should be executed in the chain. For example,create a URL Transaction Monitor which will trigger an e-mail event before you create the MailMonitor to check for the e-mail. See the note on reordering monitors above.
4. If necessary, set up the values to be passed from one monitor to another in the chain. For informationabout how this works see the section on passing variables between monitors below.
5. Add the other monitors for this transaction chain in the appropriate order of execution into the group
Note: The individual monitors executed by the eBusiness Transaction Chain Monitor shouldgenerally not be run separately by SiteScope. You should make sure that the "Update Every" settingfor each of these monitors is blank.
6. Return to the SiteScope main panel7. Create a new group or open an existing group that will contain the e-business transaction chain
monitor you are creating8. Select the "Add a new monitor to the group" option and select the eBusiness Transaction Chain
Monitor
SiteScope User Guide
Usage Guidelines 54

9. Complete the eBusiness Transaction Chain Monitor Form as described below
SiteScope User Guide
Setting up Monitors for the eBusiness Transaction Chain 55
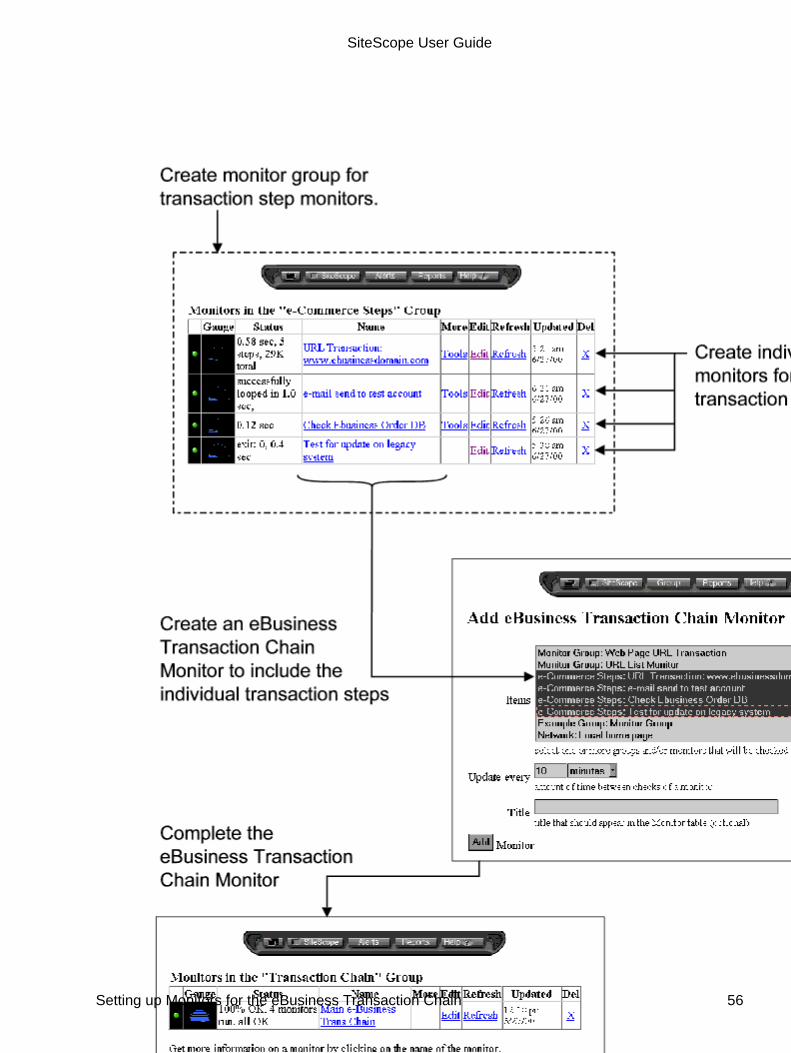
SiteScope User Guide
Setting up Monitors for the eBusiness Transaction Chain 56
Completing the eBusiness Transaction Chain Monitor Form
To display the eBusiness Transaction Chain Monitor Form, click the Add a new Monitor to this Group linkon a group's monitor detail page and choose the Add eBusiness Transaction Chain Monitor link. To editan existing eBusiness Transaction Chain Monitor click the name of monitor in a monitor detail table
Complete the fields on the eBusiness Transaction Chain Monitor form as follows. When all the fields arecomplete, click the Add Monitor button to complete the action.
Items
Using the control key or equivalent, click on the group or set of monitors that will make upthe eBusiness Transaction Chain Monitor. As noted in the set up section above, the monitorsare run in the order that they are listed in their group.
Update every:
Enter how frequently the monitor should check the status readings of the selected monitorsand/or groups. The pull-down menu to the right of the entry field lets you specify timeincrements of seconds, minutes, hours, or days. You must specify a time increment of at least15 seconds.
Title: (Optional)
Enter a name for this monitor. This name appears in the Name field on the monitor tablewhen you open the group's detail page. If you don't enter a name, a default name will becreated.
Advanced Options
The advanced options give you the ability to customize error and warning thresholds. If you choose not to setthem, SiteScope will use preset defaults if available. If a default is not available, SiteScope will not be able toutilize the condition.
Disable
Check this box to temporarily disable this monitor and any associated alerts. To enable themonitor again, un-check the box.
When Error:
Choose how you want errors during the transaction to be handled. Continue, run the remaining monitors - runs every monitor no matter what the status of agiven monitor is Stop, do not run any of the remaining monitors - stops running the list of monitors
SiteScope User Guide
Completing the eBusiness Transaction Chain Monitor Form 57

immediately, if a monitor returns an error Run the last monitor - run the last monitor in the list, which is useful if a monitor is used forclosing or logging off of a session opened in a previous monitor.
Single Session:
Check this box if you want any URL monitors to use the same network connection and thesame set of cookies. This is useful if you are using the eBusiness Transaction Chain Monitorto group several URL Transaction monitors and don't want to include the login steps as partof each transaction
Monitor Delay:
If Run Monitors is checked, this is the number of seconds to wait between running eachmonitor. This setting is useful if you need to wait for processing to occur on your systemsbefore running the next monitor.
Verify Error
Check this box if you want SiteScope to automatically run this monitor again if it detects anerror.
Update Every (on error)
This options allows you to set a new monitoring interval for monitors that have registered anerror condition. For example, you may want SiteScope to monitor this item every 10 minutesnormally, but as often as every 2 minutes if an error has been detected. Note that thisincreased scheduling will also affect the number of alerts generated by this monitor.
Schedule (Optional)
By default, SiteScope's monitors are enabled every day of the week. You may, however,schedule your monitors to run only on certain days or on a fixed schedule. Choose theEdit schedule link to create or edit a monitor schedule. For information about creatingschedules, read these instructions.
Monitor Description (Optional)
Enter additional information about this monitor. The description will appear on the MonitorDetail page.
Report Description (Optional)
Enter a description for this monitor that will make it easier to understand what this monitordoes. The description will appear on Management Reports and on the info popup for amonitor.
List Order (Optional)
By default, new monitors are listed last on the Monitor Detail page. You may use thispull-down menu to choose a different placement for this monitor.
SiteScope User Guide
Advanced Options 58

Error if:
Set the conditions under which this Monitor should report an error status. Enter a comparisonvalue and use the comparison operator pop-up to specify an error threshold such as: >=(greater than or equal to), != (not equal to), or < (less than).
Warning if
Set the conditions under which this Monitor should report a warning status. Enter acomparison value and use the comparison operator pop-up to specify an warning thresholdsuch as: >= (greater than or equal to), != (not equal to), or < (less than).
Good if
Set the conditions under which this Monitor should report a good status.
Passing Values From One Monitor to Another
You can pass values between individual monitors in an eBusiness Transaction Chain Monitor by using anextension of SiteScope's substitution syntax.
For example, to pass the matching value from a URL Monitor to the Receive Content Match field of a MailMonitor, you would enter:
Receive Content Match: s|$value-step2.matchValue$|
where the "s| |" indicates that this should be treated as a substitution, "$value-xxxx$" means to retrieve thevalue from another monitor, "step2" means that the value should be retrieved from the second step ofeBusiness Transaction Chain Monitor, and "matchValue" means get the matching value from that monitor
A complete list of terms like "matchValue" can be found in Template Properties.
SiteScope User Guide
Advanced Options 59
File Monitor
The SiteScope File Monitor reads a specified file. In addition to checking the size and age of a file, the FileMonitor can help you verify that the contents of files, either by matching the contents for a piece of text, orby checking to see if the contents of the file ever changes
Each time the File Monitor runs, it returns a reading and a status and writes them in the monitoring log file. Italso writes the file size and age into the log file.
Usage Guidelines
Why should I use this monitor?
The File Monitor is useful for watching files that can grow too large and eat up disk space, such as log files.You can set up your File Monitors to watch for file size, setting a threshold at which you should be notified.You can even write scripts for SiteScope to execute that will automatically roll log files when they reach acertain size.
What should I monitor?
You can create File Monitors for any files that you want to monitor for size, age, or content. As mentionedbefore, you can set thresholds in SiteScope, telling it when to notify you of a problem. Log files are verygood candidates for monitoring because they're prone to suddenly growing in size and crashing machines.Other files that you may want to watch are web pages that have important content that doesn't change often.SiteScope can alert you to unauthorized content changes so that you can correct them immediately.
How should I schedule my monitors?
The frequency with which you run File Monitors is strictly up to you. We suggest that you run them as oftenas every 10 minutes, but you can run them more often if you prefer.
Reading and Status
The reading is the current value of the monitor. Possible values are:
• OK• content match error• file not found• contents changed
File Monitor 60
An error status is returned if the current value of the monitor is anything other than OK. If you would like forSiteScope to respond if an error status is returned, create an alert. An alert contains instructions that tellSiteScope to either notify you via e-mail or pager, or execute an automatic recovery script when a problem isdetected.
Completing the File Monitor Form
To display the File Monitor Form, either click the name of an existing File Monitor in a monitor table, orclick the Add a new Monitor to this Group link on a group's detail page and choose the Add FileMonitor link.
Complete the fields on the File Monitor form as follows. When all the fields are complete, click theAdd Monitor button.
File:
Enter the name of the file to be monitored. For example, /pub/docs/mydoc.txt.
Update every:
Enter how frequently the monitor should check this file. The pull-down menu to the right ofthe entry field lets you specify time increments of seconds, minutes, hours, or days. Youmust specify a time increment of at least 15 seconds.
Title: (Optional)
Enter a name for this monitor. This name appears in the Name field on the monitor tablewhen you open the group's detail page. If you don't enter a name, a default name will becreated.
Advanced Options
The advanced options give you the ability to customize error and warning thresholds, or complete optionalsettings.
Disable
Check this box to temporarily disable this monitor and any associated alerts. To enable themonitor again, un-check the box.
Match Content
Enter a string of text to check for in the returned page. If the text is not contained in the page,the monitor will display "no match on content". The search is case sensitive. Remember thatHTML tags are part of a text document, so include the HTML tags if they are part of the text
SiteScope User Guide
Reading and Status 61
you are searching for (for example, "<B> Hello</B> World"). This works for XML pages aswell. You may also perform a Perl regular expression match by enclosing the string inforward slashes, with an "i" after the trailing slash indicating case-insensitive matching. (forexample, /href=Doc\d+\.html/ or /href=doc\d+\.html/i). If you want a particularpiece of text to be saved and displayed as part of the status, use parentheses in a Perl regularexpression. For example /Temperature: (\d+). This would return the temperature as itappears on the page and this could be used when setting an Error if or Warning if threshold.
Check for Content Changes
Unless this is set to "no content checking" (the default) SiteScope will record a checksum ofthe document the first time the monitor runs and then does a checksum comparison eachsubsequent time it runs. If the checksum changes, the monitor will have a status of "contentchanged error" and go into error. If you want to check for content changes, you'll usuallywant to use "compare to saved contents".
The options for this setting are: no content checking - (default) SiteScope doesn't check for content changes compare to last contents - The new checksum will be recorded as the default after the initialerror "content changed error" occurs, so the monitor will return to OK until the checksumchanges again compare to saved contents - The checksum is a snapshot of a given page (retrieved eitherduring the initial or a specific run of the monitor). If the contents change, the monitor will geta "content changed error" and will stay in error until the contents return to the originalcontents, or the snapshot is update by resetting the saved contents reset saved contents - Takes a new snapshot of the page and saves the resulting checksumon the first monitor run after this option is chosen. After taking the snapshot, the monitor willrevert to "compare to saved contents" mode.
Verify Error
Check this box if you want SiteScope to automatically run this monitor again if it detects anerror.
Update Every (on error)
This options allows you to set a new monitoring interval for monitors that have registered anerror condition. For example, you may want SiteScope to monitor this item every 10 minutesnormally, but as often as every 2 minutes if an error has been detected. Note that thisincreased scheduling will also affect the number of alerts generated by this monitor.
Schedule (Optional)
By default, SiteScope's monitors are enabled every day of the week. You may, however,schedule your monitors to run only on certain days or on a fixed schedule. Choose theEdit schedule link to create or edit a monitor schedule. For information about creatingschedules, read these instructions.
Monitor Description (Optional)
Enter additional information about this monitor that will make it easier to identify. The
SiteScope User Guide
Advanced Options 62

description will appear on the Monitor Detail page.
Report Description (Optional)
Enter a description for this monitor that will make it easier to understand what this monitordoes. The description will appear on Management Reports and on the info pop-up for amonitor.
List Order (Optional)
By default, new monitors are listed last on the Monitor Detail page. You may use thispull-down menu to choose a different placement for this monitor.
Error if
By default, SiteScope generates an error if the returned status indicates anything other than asuccessful retrieval of the file. You may choose to have SiteScope generate an error based onthe size or age of the file. Use the comparison value pop-up to specify an error threshold. The possible comparison values are: status - status values: OK (200), file not found (404), Content Changed Error (-995), ContentMatch Error (-999)file age - the age of the file in minutes.size - the size of the file in bytes.content match - When saving a match value, you can use this option to compare against thevalue saved in the regular expression. Make sure to put string values in single quotes.
Warning if
By default, SiteScope does not generate warnings for File monitors. You may choose togenerate a warning based on the size or age. Complete this section just as you would theError if section, described above.
Good if
By default this monitor returns a good reading if the status returned by the monitor is 200.You can change this default to be based upon file age or size. Choose one of these choicesfrom the pop-up menu and then set the thresholds. The symbols in the comparison valuepop-up are the same as those for Error if.
SiteScope User Guide
Advanced Options 63
FTP Monitor
The SiteScope FTP Monitor attempts to log into an FTP server and retrieve a specified file. A successful fileretrieval assures you that your FTP server is functioning properly.
In addition to retrieving specific files, the FTP Monitor can help you verify that the contents of files, either bymatching the contents for a piece of text, or by checking to see if the contents of the file ever changes
Each time the FTP Monitor runs, it returns a reading and a status writes them in the monitoring log file. Italso writes the total time it takes to receive the designated file in the log file.
Usage Guidelines
Why should I use this monitor?
If you provide FTP access to files, it's important to make sure that your FTP server is working properly.There's nothing more frustrating for a customer than to finally find the file they want, but then be unable toget it. The FTP monitor insures that you're the first to know if there's a problem.
What should I monitor?
While you may have many files available for FTP from your site, it's not necessary to monitor every one.You should get ample coverage by checking one or two files. Usually people choose to check on one smallfile and one large file.
If you have very important files available, you may also want to monitor them occasionally to verify that theircontents and size don't change. If the file does change, you can create a SiteScope alert that will run a scriptto automatically replace the changed file with a back-up file.
How should I schedule my monitors?
A common strategy is to monitor a small file every 10 minutes or so just to verify that the server isfunctioning. Then schedule a separate monitor to FTP a large file once or twice a day. This allows you testthe ability to FTP a large file without negatively impacting your machine's performance. You can scheduleadditional monitors that watch files for content and size changes to run every 15 minutes to half hour. Choosean interval that makes you comfortable.
Status
The reading is the current value of the monitor. Possible values are:
• OK• unknown host name• unable to reach server
FTP Monitor 64

• unable to connect to server• timed out reading• content match error• login failed• file not found• contents changed
The status is logged as either good or error. An error status is returned if the current value of the monitor isanything other than OK. If you would like for SiteScope to respond if an error status is returned, create analert. An alert contains instructions that tell SiteScope to either notify you via e-mail or pager, or execute anautomatic recovery script when a problem is detected.
Completing the FTP Monitor Form
To display the FTP Monitor Form, either click the name of an existing FTP Monitor in a monitor table, orclick the "Add a new Monitor to this Group" link on a group's detail page and choose the "Add FTPMonitor" link.
Complete the fields on the FTP Monitor form as follows. When all the fields are complete, click the"Add Monitor" button.
FTP Server
Enter the IP address or the name of the FTP server that you want to monitor. For example,you could enter either 206.168.191.22 or ftp.freshtech.com.
File
Enter the file name to retrieve in this field, for example /pub/docs/mydoc.txt.
User Name
Enter the name used to log into the FTP server in this field.
Password
Enter the password used to log into the FTP server in this field.
Update every
Enter how frequently the monitor should check this FTP server. The pull-down menu to theright of the entry field lets you specify time increments of seconds, minutes, hours, or days.You must specify a time increment of at least 15 seconds.
Title (Optional)
Enter a name for this monitor. This name appears in the Name field on the monitor tablewhen you open the group's detail page. If you don't enter a name, a default name will be
SiteScope User Guide
Status 65

created.
Advanced Options
The advanced options give you the ability to customize error and warning thresholds, or complete optionalsettings.
Disable
Check this box to temporarily disable this monitor and any associated alerts. To enable themonitor again, un-check the box.
Timeout
The number of seconds that the FTP monitor should wait for a file to complete downloadingbefore timing-out. Once this time period passes, the FTP monitor will log an error and reportan error status.
FTP Proxy
You may instruct SiteScope to run the FTP through a proxy server. Generally, if you use anFTP proxy you will have it set up in your browser. Enter that same information here. Forexample, proxy.freshtech.com:8080. Remember to include the port.
Passive Mode
Check this box if you want SiteScope to use FTP passive mode. This mode usually allowsFTP to work through firewalls.
Match Content
Enter a string of text to check for in the returned file. If the text is not contained in the file,the monitor will display "no match on content". The search is case sensitive. You may alsoperform a Perl regular expression match by enclosing the string in forward slashes, with an"i" after the trailing slash indicating case-insensitive matching. (for example, "/Size \d\d/" or"/size \d\d/i").
Check for Content Changes
Unless this is set to "no content checking" (the default) SiteScope will record a checksum ofthe document the first time the monitor runs and then does a checksum comparison eachsubsequent time it runs. If the checksum changes, the monitor will have a status of "contentchanged error" and go into error. If you want to check for content changes, you'll usuallywant to use "compare to saved contents".
The options for this setting are:
SiteScope User Guide
Completing the FTP Monitor Form 66
no content checking - (default) SiteScope doesn't check for content changes compare to last contents - The new checksum will be recorded as the default after the initialerror "content changed error" occurs, so the monitor will return to OK until the checksumchanges again compare to saved contents - The checksum is a snapshot of a given page (retrieved eitherduring the initial or a specific run of the monitor). If the contents change, the monitor will geta "content changed error" and will stay in error until the contents return to the originalcontents, or the snapshot is update by resetting the saved contents reset saved contents - Takes a new snapshot of the page and saves the resulting checksumon the first monitor run after this option is chosen. After taking the snapshot, the monitor willrevert to "compare to saved contents" mode.
Proxy Server User Name
If the proxy server requires a name and password to access the URL, enter the name here.Technical note: your proxy server must support Proxy-Authenticate for these options tofunction.
Proxy Server Password
If the proxy server requires a name and password to access the URL, enter the passwordhere. Technical note: your proxy server must support Proxy-Authenticate for these options tofunction.
Verify Error
Check this box if you want SiteScope to automatically run this monitor again if it detects anerror.
Update Every (on error)
This options allows you to set a new monitoring interval for monitors that have registered anerror condition. For example, you may want SiteScope to monitor this item every 10 minutesnormally, but as often as every 2 minutes if an error has been detected. Note that thisincreased scheduling will also affect the number of alerts generated by this monitor.
Schedule (Optional)
By default, SiteScope's monitors are enabled every day of the week. You may, however,schedule your monitors to run only on certain days or on a fixed schedule. Choose theEdit schedule link to create or edit a monitor schedule. For information about creatingschedules, read these instructions.
Monitor Description (Optional)
Enter additional information about this monitor. The description will appear on the MonitorDetail page.
Report Description (Optional)
Enter a description for this monitor that will make it easier to understand what this monitor
SiteScope User Guide
Advanced Options 67
does. The description will appear on Management Reports and on the info pop-up for amonitor.
List Order (Optional)
By default, new monitors are listed last on the Monitor Detail page. You may use thispull-down menu to choose a different placement for this monitor.
Error if
By default, SiteScope generates an error if the returned status indicates anything other than asuccessful retrieval of the file. You may choose to have SiteScope generate an error based onthe round trip retrieval time. Enter the shortest retrieval time (in milliseconds) that shouldgenerate an error. Enter a comparison value and use the comparison operator pop-up tospecify an error threshold such as: >= (greater than or equal to), != (not equal to), or < (lessthan).
Warning if
By default, SiteScope does not generate warnings for FTP monitors. You may choose togenerate a warning based on round trip retrieval time. Enter the shortest retrieval time (inmilliseconds) that should generate a warning. The symbols in the comparison value pop-upare the same as those for Error if.
Good if
By default this monitor returns a good reading if the monitor returns a status of 200. You canchange this to be tied to either file size or round-trip time. Choose the option you prefer fromthe pop-up menu and then set the threshold using the comparison value pop-up. The symbolsin the comparison value pop-up are the same as those for Error if.
SiteScope User Guide
Advanced Options 68

LDAP Monitor
The SiteScope LDAP Monitor verifies that a Lightweight Directory Access Protocol (LDAP) server isworking correctly by connecting to it and performing a "simple" authentication. Optionally, it can check theresult for expected content.
Each time the LDAP Monitor runs, it returns a status based upon the time it takes to perform the connection.
Usage Guidelines
Why should I use this monitor?
If your LDAP server is not working properly, the user won't be able to access and update information in thedirectory. Most importantly, the user won't be able to perform any authentication using the LDAP server. Theother reason to monitor the LDAP server is so you can find performance bottlenecks -- if your End User andLDAP times are both increasing at about the same amount, the LDAP server is probably the bottleneck. Ifnot, the bottleneck is probably somewhere else.
What should I monitor?
The most important thing to monitor is the authentication of a specific user on the LDAP server. If more thanone LDAP server is used, you'll want to monitor each of the servers.
You may also choose to monitor round trip time of the authentication process.
How should I schedule my monitors?
You may want to monitor your most critical and most common queries as frequently as every 10-15 minutes.
Status
The status is logged as either OK, warning, or error. An error status or warning status is returned if thecurrent value of the monitor is anything other than OK. Errors occur if SiteScope is unable to connect,receives an unknown hostname error, or the IP address doesn't match the hostname.
If you would like for SiteScope to respond if an error or warning status is returned, create an alert. An alertcontains instructions that tell SiteScope to either notify you via e-mail,pager, or SNMP trap, or execute anautomatic recovery script when a problem is detected.
Completing the LDAP Monitor Form
To display the LDAP Monitor Form, either click the name of an existing LDAP Monitor in a monitor table,
LDAP Monitor 69
or click the Add a new Monitor to this Group link on a group's detail page and choose the Add LDAPMonitor link.
Complete the fields on the LDAP Monitor form as follows. When all the fields are complete, click theAdd Monitor button.
LDAP Service Provider
Enter the constant that holds the name of the environment property for specifyingconfiguration information for the service provider to use. The value of the property shouldcontain a URL string (e.g. "ldap://somehost:389"). This property may be specified in theenvironment, an applet parameter, a system property, or a resource file. If it is not specifiedin any of these sources, the default configuration is determined by the service provider.
LDAP Security Principal
Enter the constant that holds the name of the environment property for specifying the identityof the principal for authenticating the caller to the service. The format of the principaldepends on the authentication scheme. If this property is unspecified, the behaviour isdetermined by the service provider. This should be of the form(uid=testuser,ou=TEST,o=freshtech.com)
LDAP Security Credential
Enter the constant that holds the name of the environment property for specifying thecredentials of the principal for authenticating the caller to the service. The value of theproperty depends on the authentication scheme. For example, it could be a hashed password,clear-text password, key, certificate, and so on. If this property is unspecified, the behavior isdetermined by the service provider.
Update every:
Enter how frequently the monitor should check the LDAP server. The pull-down menu to theright of the entry field lets you specify time increments of seconds, minutes, hours, or days.You must specify a time increment of at least 15 seconds.
Title: (Optional)
Enter a name for this monitor. This name appears in the Name field on the monitor tablewhen you open the group's detail page. If you don't enter a name, a default name will becreated.
Advanced Options
The advanced options give you the ability to customize error and warning thresholds. If you choose not to setthem, SiteScope will use preset defaults if available. If a default is not available, SiteScope will not be able toutilize the condition.
Disable
SiteScope User Guide
Completing the LDAP Monitor Form 70
Check this box to temporarily disable this monitor and any associated alerts. To enable themonitor again, un-check the box.
Match Content:
Enter a string of text to check for in the query result. If the text is not contained in the result,the monitor will display no match on content. The search is case sensitive. This works forXML tags as well. You may also perform a Perl regular expression match by enclosing thestring in forward slashes, with an i after the trailing slash indicating case-insensitivematching. (for example, /href=Doc\d+\.html/ or /href=doc\d+\.html/i). If you want aparticular piece of text to be saved and displayed as part of the status, use parentheses in aPerl regular expression. For example /Temperature: (\d+). This would return thetemperature as it appears on the page and this could be used when setting an Error if orWarning if threshold.
Verify Error
Check this box if you want SiteScope to automatically run this monitor again if it detects anerror.
Update Every (on error)
This options allows you to set a new monitoring interval for monitors that have registered anerror condition. For example, you may want SiteScope to monitor this item every 10 minutesnormally, but as often as every 2 minutes if an error has been detected. Note that thisincreased scheduling will also affect the number of alerts generated by this monitor.
Schedule (Optional)
By default, SiteScope's monitors are enabled every day of the week. You may, however,schedule your monitors to run only on certain days or on a fixed schedule. Choose theEdit schedule link to create or edit a monitor schedule. For information about creatingschedules, read these instructions.
Monitor Description (Optional)
Enter additional information about this monitor. The description will appear on the MonitorDetail page.
Report Description (Optional)
Enter a description for this monitor that will make it easier to understand what this monitordoes. The description will appear on Management Reports and on the info popup for amonitor.
List Order (Optional)
By default, new monitors are listed last on the Monitor Detail page. You may use thispull-down menu to choose a different placement for this monitor.
Error if:
SiteScope User Guide
Advanced Options 71

Set the conditions under which the LDAP monitor should report an error status. Enter acomparison value and use the comparison operator pop-up to specify an error threshold suchas: >= (greater than or equal to), != (not equal to), or < (less than).
Warning if
Set the conditions under which the LDAP monitor should report a warning status. Enter acomparison value and the comparison operator as for the Error if section above.
Good if
Set the conditions under which the LDAP monitor should report a good (OK) status. Enter acomparison value and the comparison operator as for the Error if section above.
SiteScope User Guide
Advanced Options 72
Link Check Monitor
The SiteScope Link Check Monitor checks the internal and external links on a web page to insure that theycan be reached. SiteScope begins checking links from a URL that you specify, verifies that linked graphicscan be found, and follows HREF links to the referenced URL's. The monitor can be configured to check allof the links on your site or limited to a specified number of "hops".
In addition to checking the links, a Link Report is created. This report can be viewed by choosing theSummary link in the More column. The report displays all the links checked, the status of each link, size,estimated download time via a 28.8 connection, and the page containing the link. You may reorder the entriesin this table by clicking on the column heading that you want the entries to be sorted by. For example, if youwant the entries to be sorted by retrieval time, click the Time column heading.
Each time the Link Check Monitor runs, it returns a status and writes it in the monitoring log file. It alsowrites the total number of broken links, the total number of links, the total number of graphics, and theaverage time for retrieving a page.
Usage Guidelines
Why should I use this monitor?
There's nothing more frustrating for your web site visitors than trying to follow a broken link. Ensuring thatyour site is free of broken links is something that everyone knows they should do, but it's often the thing thatgets moved to the bottom of the to-do list. This monitor can be set to check every link on your site, internaland external, every day, letting you know immediately which links have a problem.
What should I monitor?
You should monitor the web site for the availability of key content. This includes checking that image filesand linked HTML files are accessible as referenced within the web pages. Starting with your home page, theLink Check Monitor will branch out and check every link available on your entire site by default. If you onlywant it to check a portion of your site, specify the URL that links into the targetted area. You can limit thenumber of linked "hops" the monitor will follow in the Advanced Options section. Even if you're not theperson responsible for web content, you can set the monitor to run once a day and have the alerts e-maileddirectly to your web content developer.How should I schedule my monitors?
You probably only need to run the link monitor once a day to check for external links that have been movedor no longer work and internal links that have been changed. You can also run it on demand any time you doa major update of your web site.
Link Check Monitor 73
Status
The status is logged as either good, warning, or error. An error status is returned if there are any broken links.Otherwise, the status is OK. If you would like for SiteScope to respond if an error status is returned, create analert. An alert contains instructions that tell SiteScope to either notify you via e-mail or pager, or execute anautomatic recovery script when a problem is detected.
Completing the Link Check Monitor Form
To display the Link Check Monitor Form, either click the name of an existing Link Check Monitor in amonitor table, or click the "Add a new Monitor to this Group" link on a group's detail page and choose the"Add Link Check Monitor" link.
Complete the fields on the Link Check Monitor form as follows. When all the fields are complete, click the"Add Monitor" button.
URL
Enter the URL that will be the starting point for checking links (for example,http://demo.freshtech.com). The link monitor will retrieve the page for this URL. Next, itwill read the URLs for any links on the page. It will continue until it has checked all of thelinks on the site. Links to other servers will be checked but it will not continue and check allthe links of those other servers.
Update every
Enter how frequently the monitor should check this URL. The pull-down menu to the right ofthe entry field lets you specify time increments of seconds, minutes, hours, or days. Youmust specify a time increment of at least 15 seconds.
Title (Optional)
Enter a name for this monitor. This name appears in the Name field on the monitor tablewhen you open the group's detail page. If you don't enter a name, a default name will becreated.
Advanced Options
The advanced options give you the ability to customize error and warning thresholds, or complete optionalsettings.
SiteScope User Guide
Status 74
Disable
Check this box to temporarily disable this monitor and any associated alerts. To enable themonitor again, un-check the box.
Pause
The delay, in milliseconds, between each link check. Larger numbers will lengthen the totaltime to check links but will decrease the load on the server.
Maximum Links
The maximum number of links this monitors will check. When the maximum is reached themonitor will stop running. Increase this number if you have a large site and want to checkevery page on the site.
Maximum Hops
The maximum number of internal links that SiteScope should follow from the starting URL.For example, if you set the number of hops to three, SiteScope will check all internal pagesthat can be reached within 3 clicks from the starting URL. Limiting this number will reducethe number of URLs that SiteScope follows, shortening the time to complete the report.SiteScope will not follow any links on external pages.
Timeout
The number of seconds that the URL monitor should wait for a page to begin downloadingbefore timing-out. Once this time period passes, the URL monitor will log an error and reportan error status.
HTTP Proxy
Optionally, a proxy server can be used to access the URL. Enter the domain name and port ofan HTTP Proxy Server.
Authorization User Name
If the URL specified requires a user name for access, enter the name in this field.
Authorization Password
If the URL specified requires a password for access, enter the password in this field.
Proxy Server User Name
If the proxy server requires a name to access the URL, enter the name here. Technical note:your proxy server must support Proxy-Authenticate for these options to function.
Proxy Server Password
If the proxy server requires a password to access the URL, enter the password here.
SiteScope User Guide
Advanced Options 75

Technical note: your proxy server must support Proxy-Authenticate for these options tofunction.
Post Data
Enter any form values required for the first page being checked. This is useful if you need tolog in via an HTML form to reach the rest of the site that you're checking.
Verify Error
Check this box if you want SiteScope to automatically run this monitor again if it detects anerror.
Update Every (on error)
This options allows you to set a new monitoring interval for monitors that have registered anerror condition. For example, you may want SiteScope to monitor this item every 10 minutesnormally, but as often as every 2 minutes if an error has been detected. Note that thisincreased scheduling will also affect the number of alerts generated by this monitor.
Schedule (Optional)
By default, SiteScope's monitors are enabled every day of the week. You may, however,schedule your monitors to run only on certain days or on a fixed schedule. Choose theEdit schedule link to create or edit a monitor schedule. For information about creatingschedules, read these instructions on Schedules.
Monitor Description (Optional)
Enter additional information about this monitor. The description will appear on the MonitorDetail page.
Report Description (Optional)
Enter a description for this monitor that will make it easier to understand what this monitordoes. The description will appear on Management Reports and on the info pop-up for amonitor.
List Order (Optional)
By default, new monitors are listed last on the Monitor Detail page. You may use thispull-down menu to choose a different placement for this monitor.
Error if
By default, SiteScope generates an error if there are any broken links. You may choose togenerate an error based on broken links, total pages, total graphics, or average retrieval time.Enter a comparison value and use the comparison operator pop-up to specify an errorthreshold such as: >= (greater than or equal to), != (not equal to), or < (less than).
Warning if
SiteScope User Guide
Advanced Options 76

By default, SiteScope does not generate warnings for Link Check monitors. You may chooseto generate a warning based on broken links, total pages, total graphics, or average retrievaltime. The symbols in the comparison value pop-up are the same as for the Error if condition.
Good if
By default, this monitor returns a good reading if all links can be retrieved. You can changethis to be dependent upon total pages, total graphics, or average retrieval time. Choose theoption you want from the pop-up menu and then set the desired threshold. The symbols in thecomparison value pop-up are the same as for the Error if condition.
SiteScope User Guide
Advanced Options 77

Link Check Summary Report
The Link Check Summary Report page provides details of the links reported by a particular instance of theLink Check Monitor. By default, only links that are broken are displayed in the report table.
The following is an example of a Link Check Summary Report table for a Link Check Monitor set to monitorpart of the Freshwater Software web site. A summary of the results returned by the monitor appears inparentheses under the page title. This summary lists the total number of links followed, the total number oflinks that are broken, when the monitor was last run, and the current display state of the report table. Clickingon the link "show all links" will refresh the report table to show all of the links that were checked by themonitor.
Link Check Summary Report
(292 links, 1 errors, checked at 1:50 pm 3/16/00, showing error links, show all links)
Status Size(Kbytes)
Time(secs)
Est.28.8time(secs)
Type URL SourcePage
External Count
notfound
0.94 0.34 0.31 text/html http://www.freshwater.com/missing.htm http://www.freshwater.com/press/FWNews.htmyes 1
This example shows that a total of 292 links were followed and the target referenced by one link was notfound. In this case the link was to a URL at a different web site which was either moved or deleted.
The report table contains the following information. The underlined links in the report table in SiteScopeprovide sorting functions or links to the referenced URL's.
Status
This is the status returned by the monitor for the referenced links found in the chain ofURL's being checked. This includes: unknown host name unable to reach server unable to connect to server timed out reading not found
Size (K bytes)
This is size of the response given by the server to the Monitor's request for the referenced
Link Check Summary Report 78
URL.
Time (secs)
This is the time it took to retrieve the referenced URL or the error message from theapplicable server.
Est. 28.8 time (secs)
This is an estimated retrieval time for a connection through a 28.8 kps modem.
Type
This represents the MIME type of the response from the server.
URL
This is the complete URL that the monitor attempted to retrieve. Clicking on this link willdisplay the content of the URL or the applicable response from the server.
Source Page
This is the complete URL of the page which contains the link listed in the URL column.Clicking on this link will display the content of the URL.
External
This column indicates whether the link in the URL column of the row is a URL found on adifferent server than the server where the Source Page is found.
Count
This column indicates how many times the link to the target listed in the URL columnappears within the scope of the currently defined link check.
The links in the header row of the table allow you to sort the data in the table according to the criteria shownabove. Selecting a sort criteria will refresh the table and display the links that are in error in the sort order thatwas selected (e.g. sorted by count or by links that are external).
SiteScope User Guide
Link Check Summary Report 79

Log File Monitor
The Log File Monitor watches for specific entries added to a log file by looking for entries containing a textphrase or a regular expression.
The "Run Alerts" setting control how alerts are triggered by this monitor. If "for each log entry matched" ischosen, then the monitor triggers alerts for every matching log entry found. In this way, the monitor actsmuch like an event forwarder. If "once, after all log entries have been checked" is chosen, then the monitorcounts up the number of matches and triggers alerts based on the "Error If" and "Warning If" thresholdsdefined for the monitor.
Each time the Log File Monitor runs, it examines only those log entries added since the last time it ran.
Usage Guidelines
Why should I use this monitor?
The Log File Monitor is useful for automatically scanning log files for error information that you'd want toknow about. With SiteScope doing this for you at set intervals, you can eliminate the need to scan the logsmanually. In addition, you can be notified of warning conditions that you might have otherwise been unawareof until something more serious happened. Each time that it runs this monitor, SiteScope starts from the pointin the file where it stopped reading last time it ran. This insures that you're only notified of new entries andspeeds the rate at which the monitor runs.
What should I monitor?
You can have SiteScope read any log file you want. The log files don't have to be in any particular format --SiteScope just reads them a line at a time.
How should I schedule my monitors?
You can schedule your Log File Monitors to run as often as you like, but every 10 minutes is reasonable inmost cases.
Completing the Log File Monitor Form
To display the Log File Monitor Form, either click the name of an existing Log File Monitor in a monitortable, or click the "Add a new Monitor to this Group" link on a group's detail page and choose the "Add LogFile Monitor" link.
Complete the fields on the Log File Monitor Form as follows. When all the fields are complete, click theAdd Monitor button.
Log File Pathname:
Log File Monitor 80
Enter the pathname to log file being monitored.
Run Alert:
Choose the method for running alerts. If "for each event matched" is chosen, then themonitor triggers alerts for every matching entry found.NOTE: When the Log File Monitor isrun in the "for each event matched" alert method, the monitor will never report a status oferror or warning, regardless of the results of the content match or even if the target log file isnot found. If the "once, after all events have been checked" method is chosen, then the monitor countsup the number of matches and triggers alerts based on the "Error If" and "Warning If"thresholds defined for the monitor in the Advanced Options section.
Content Match
Enter the text to look for in log entries. Regular expressions may also be used in this field.
Update every:
Enter how frequently the monitor should read the application log file. The pull-down menu tothe right of the entry field lets you specify time increments of seconds, minutes, hours, ordays. You must specify a time increment of at least 15 seconds.
Title: (Optional)
Enter a name for this monitor. This name appears in the Name field on the monitor tablewhen you open the group's detail page. If you don't enter a name, a default name will becreated.
Advanced Options
The advanced options give you the ability to customize error and warning thresholds. If you choose not to setthem, SiteScope will use pre-set defaults if available. If a default is not available, SiteScope will not be ableto utilize the condition.
Rules File Pathname:
Optional: In rare cases, it may be necessary to create a custom rules file to specify the logentries to match and the alerts to send. An example rules file is located in~SiteScope/Classes/CustomMonitor/test.rules. Make a copy of this file and name it whateveryou like. There is no required naming convention. Open the file with the editor of yourchoice, and using the comments as a guideline, edit the file to meet your needs. When you'refinished, type the full path name to your rules file in this field.
Disable
SiteScope User Guide
Completing the Log File Monitor Form 81
Check this box to temporarily disable this monitor and any associated alerts. To enable themonitor again, un-check the box.
Verify Error
Check this box if you want SiteScope to automatically run this monitor again if it detects anerror.
Update Every (on error)
This options allows you to set a new monitoring interval for monitors that have registered anerror condition. For example, you may want SiteScope to monitor this item every 10 minutesnormally, but as often as every 2 minutes if an error has been detected. Note that thisincreased scheduling will also affect the number of alerts generated by this monitor.
Schedule (Optional)
By default, SiteScope's monitors are enabled every day of the week. You may, however,schedule your monitors to run only on certain days or on a fixed schedule. Choose theEdit schedule link to create or edit a monitor schedule. For information about creatingschedules, read these instructions.
Monitor Description (Optional)
Enter additional information about this monitor. The description will appear on the MonitorDetail page.
Report Description (Optional)
Enter a description for this monitor that will make it easier to understand what this monitordoes. The description will appear on Management Reports and on the info pop-up for amonitor.
List Order (Optional)
By default, new monitors are listed last on the Monitor Detail page. You may use thispull-down menu to choose a different placement for this monitor.
Error if:
Set an error threshold for this monitor. The thresholds are used when the "Run Alerts: once,..." option is chosen. By default, an error is signalled whenever there is one or more matchingevents. Select a comparison value from the list, and use the comparison operator pop-up tospecify an error threshold such as: >= (greater than or equal to), != (not equal to), or < (lessthan). The possible comparison values are: matches - the number of matches found.lines - the number of lines processed.lines/min - the number of lines per minute processed during this monitoring period.matches/min - the number of matches per minute that occurred during this monitoring period.
SiteScope User Guide
Advanced Options 82

Warning if
Set the Warning threshold for this monitor. The default is to generate a warning if SiteScopeis unable to read the log file. The symbols in the comparison value pop-up menu are the sameas those for Error if.
Good if
The default is to mark the monitor as good if the log file can be read and there are nomatches.
SiteScope User Guide
Advanced Options 83
Mail Monitor
The SiteScope Mail Monitor checks a Mail Server via the network. It verifies that the mail server is acceptingrequests, and also verifies that a message can be sent and retrieved. It does this by sending a standard mailmessage using SMTP and then retrieving that same message via a POP user account. Each message thatSiteScope sends includes a unique key which it checks to insure that it doesn't retrieve the wrong messageand return a false OK reading. If SiteScope is unable to complete the entire loop it generates an errormessage.
Each time the Mail Monitor runs, it returns a status and writes it in the ~SiteScope/logs/SiteScope.log file. Italso writes the total time it takes to send and receive the mail message in the log file.
Usage Guidelines
Why should I use this monitor?
Most companies are heavily dependent on e-mail today, and a missed or late e-mail message can spelldisaster. The problem with e-mail is that unless you're expecting a message, you won't know it's missing.The mail monitor ensures that the mail server is both accepting and delivering messages properly.
What should I monitor?
Most companies have both a primary and a secondary mail server. At companies that employ a firewall, theremay even be a third, internal, mail server. Each of these servers should be monitored regularly.
How should I schedule my monitors?
It's a good idea to monitor your primary mail server at least every five minutes. The other mail servers can bemonitored less often. You may find it useful to set up a special mail account to receive the test e-mailmessages send by SiteScope.
Status
The status is logged as either good or error. An error status is returned if the current value of the monitor isanything other than OK.
If you would like for SiteScope to respond if an error status is returned, create an alert. An alert containsinstructions that tell SiteScope to either notify you via e-mail or pager, or execute an automatic recoveryscript when a problem is detected.
Completing the Mail Monitor Form
To display the Mail Monitor Form, either click the name of an existing Mail Monitor in a monitor table, or
Mail Monitor 84
click the "Add a new Monitor to this Group" link on a group's detail page and choose the "Add MailMonitor" link.
Complete the fields on the Mail Monitor form as follows. When all the fields are complete, click the"Add Monitor" button.
Send & Receive
Send & receive option will allow you to send a test message to an smtp server and thenreceive it back from the POP3 or IMAP4 server to make sure the mail server is up andrunning. The receive only option allows you to check the incoming POP3 or IMAP4 mailservers for a message that was sent previously. This check is done by matching the content ofthe previously sent message. If the receive only option is used the match content field musthave a value to match against.
Outgoing Mail Server (SMTP)
Enter the hostname of the SMTP mail server to which the test mail message should be sent.(for example, mail.freshtech.com).
POP3 or IMAP4
The POP3 option allows you to check the POP3 mail server for a sent message. The IMAP4option allows you to check the IMAP mail server for a sent message.
Incoming Mail Server
Enter the hostname of the POP3/IMAP4 mail server that should receive the test message.This can be the same mail server to which the test message was sent (for example,mail.freshtech.com).
Mail Server User Name
Enter a POP user account name (for example, support). A test email message will be sent tothis account and the Mail monitor will login to the account and verify that the message wasreceived. No other mail in the account will be touched; therefore you can use your ownpersonal mail account or another existing account for this purpose.Note: If you use a mailreader that automatically retrieves and deletes messages from the server, there's a chance thatthe Mail Monitor will never see the mail message and will therefore report an error.
Mail Server Password (Optional)
Enter a password, if necessary, for the test mail account.
To Address
Enter the mail address to which the test message should be sent. This should be the addressfor the POP account that you specified in the Mail Server User Name field. For example, ifyou specified "support" as the Mail Server User Name, the To Address might be"[email protected]."
SiteScope User Guide
Completing the Mail Monitor Form 85

Update every
Enter how frequently the monitor should check the Mail server. The pull-down menu to theright of the entry field lets you specify time increments of seconds, minutes, hours, or days.You must specify a time increment of at least 15 seconds.
Title (Optional)
Enter a name for this monitor. This name appears in the Name field on the monitor tablewhen you open the group's detail page. If you don't enter a name, "Untitled Mail Monitor"appears in the Name field.
Advanced Options
The advanced options give you the ability to customize error and warning thresholds. If you choose not to setthem, SiteScope will use preset defaults if available. If a default is not available, SiteScope will not be able toutilize the condition.
Match Content
Enter a string of text to to match against the contents of the incoming message. If the text isnot contained in the incoming message, the monitor will be in error. This is for the receivingonly option.(Example: Subject:MySubject). The search is case sensitive. Remember thatHTML tags are part of a text document, so include the HTML tags if they are part of the textyou are searching for (for example, "< B> Hello< /B> World"). This works for XML pagesas well. You may also perform a Perl regular expression match by enclosing the string inforward slashes, with an "i" after the trailing slash indicating case-insensitive matching. (forexample, "/href=Doc\d+\.html/" or "/href=doc\d+\.html/i"). If you want a particular piece oftext to be saved and displayed as part of the status, use parentheses in a Perl regularexpression. For example /Temperature: (\d+). This would return the temperature as it appearson the page and this could be used when setting an Error if or Warning if threshold.
Disable
Check this box to temporarily disable this monitor and any associated alerts. To enable themonitor again, un-check the box.
Timeout
The number of seconds that the Mail monitor should wait for a mail message to be receivedbefore timing-out. Once this time period passes, the Mail monitor will log an error and reportan error status.
POP Check Delay (Optional)
After SiteScope sends the test message, it immediately logs into the mail account to verifythat the message has been received. If the message hasn't been received, SiteScope will
SiteScope User Guide
Completing the Mail Monitor Form 86
automatically wait 10 seconds before it checks again. You can adjust this wait time byindicating an alternate number of seconds to wait in this field.
Schedule (Optional)
By default, SiteScope's monitors are enabled every day of the week. You may, however,schedule your monitors to run only on certain days or on a fixed schedule. Choose theEdit schedule link to create or edit a monitor schedule. For information about creatingschedules, read these instructions.
Monitor Description (Optional)
Enter additional information about this monitor. The description will appear on the MonitorDetail page.
Report Description (Optional)
Enter a description for this monitor that will make it easier to understand what this monitordoes. The description will appear on Management Reports and on the info pop-up for amonitor.
List Order (Optional)
By default, new monitors are listed last on the Monitor Detail page. You may use thispull-down menu to choose a different placement for this monitor.
Error if
Set the conditions under which the Mail monitor should report an error status.To set the error threshold, choose round trip time from the pull-down menu, choose acomparison operator from the next pull-down menu and then, in the text entry box, enter thelowest value which should trigger a error condition . The value entered must be a wholenumber.
Warning if
Set the conditions under which the Mail monitor should report a warning status.To set the warning threshold, choose round-trip time from the pull-down menu, choose acomparison operator from the next pull-down menu and then, in the text entry box, enter thelowest value which should trigger a warning condition . The value entered must be a wholenumber. The symbols for the comparison operator pop-up are the same as those for Error if.
Good if
SiteScope assumes a good reading unless the returned reading falls into the warning or errorthresholds. You can change this to be based upon round-trip time. Choose round-trip timefrom the pop-up menu and enter the desired threshold. The symbols in the comparisonoperator pop-up are the same as those for Error if.
SiteScope User Guide
Advanced Options 87

Memory Monitor
The SiteScope Memory Monitor provides an easy way for you to track how much virtual memory is currentlyin use on your server. Running out of memory can cause server applications to fail and excessive paging canhave a drastic effect on performance.
Each time the Memory Monitor runs, it returns a status message and writes it in the monitoring log file.
Usage Guidelines
Why should I use this monitor?
One of the primary factors that can affect your Web server's performance is memory. The two mostimportant measurements to detect problems in this area are Pages per Second and Percentage of VirtualMemory Used, both monitored by the SiteScope Memory Monitor.
How often should I schedule this monitor to run?
In most environments, scheduling the memory monitor to run every 10 minutes should be sufficient.SiteScope will be able to notify you if memory starts to get low, and you'll have enough data points to createmeaningful reports for comparison and trend analysis.
What are common problems and how do I fix them?
Pages per second measures the number of virtual memory pages that are moved between main memory anddisk storage. If this number is consistently high (>10 pages/sec), system performance is being affected. Onesolution is to add more memory. Another solution is to turn off non-critical services that are using memory,or move these services to a different machine. The SiteScope Service Monitor measures the memory usagefor each service.
Percentage of Virtual Memory Used measures the percentage of memory and paging file space used. If thisnumber reaches 100%, services that are running may fail and new ones will not be able to start. Increasing thesize of the paging file may solve the immediate problem but may decrease performance by increasing paging.A slow increase in Virtual Memory Used is often caused by a memory leak in a service. The SiteScopeProcess Detail tool (available when you choose the tools link listed in the Monitor Detail Table) can be usedto view the memory used by each service. The ideal solution is to install an upgraded version of the servicewithout the leak. An interim solution is to use the SiteScope Service Monitor to measure the service size andinvoke a SiteScope Script alert to restart the service when it becomes too large. If restarting the service doesnot fix the leak, it may be necessary to add a SiteScope Script alert to restart the server when memory usageis too high.
Status
Memory Monitor 88

The status reading is the current value of the monitor, such as 40% used. The status is logged as either OK,warning, or error. A warning status is returned if the memory use is more than 80% full. An error status isreturned if memory use is more than 90% full.
If you would like for SiteScope to respond if a warning or error status is returned, create an alert. An alertcontains instructions that tell SiteScope to either notify you via e-mail or pager, or execute an automaticrecovery script when a problem is detected.
Completing the Memory Monitor Form
To display the Memory Monitor Form, either click the name of an existing Memory Monitor in a monitortable, or click the Add a new Monitor to this Group link on a group's detail page and choose the AddMemory Monitor link.
Complete the fields on the Memory Monitor Form as follows. When all the fields are complete, click theUpdate Monitor button.
Server
Choose the server that you want to monitor. The default is to monitor memory on the serveron which SiteScope is installed. Click the choose server link to monitors memory on anotherserver.
Update every
Enter how frequently the monitor should check this drive. The pull-down menu to the rightof the entry field lets you specify time increments of seconds, minutes, hours, or days. Youmust specify a time increment of at least 15 seconds.
Title (Optional)
Enter a name for this monitor. This name appears in the Name field on the monitor tablewhen you open the group's detail page. If you don't enter a name, a default name will becreated.
Advanced Options
The advanced options give you the ability to customize error and warning condition thresholds. If you choosenot to set them, SiteScope uses pre-set defaults if available. If a default is not available, SiteScope cannotutilize the condition.
Disable
SiteScope User Guide
Status 89

Check this box to temporarily disable this monitor and any associated alerts. To enable themonitor again, un-check the box.
Verify Error
Check this box if you want SiteScope to automatically run this monitor again when it detectsan error.
Update Every (on error)
This options allows you to set a new monitoring interval for monitors that have registered anerror condition. For example, you may want SiteScope to monitor this item every 10 minutesnormally, but as often as every 2 minutes if an error has been detected. Note that thisincreased scheduling will also affect the number of alerts generated by this monitor.
Schedule (Optional)
By default, SiteScope's monitors are enabled every day of the week. You may, however,schedule your monitors to run only on certain days or on a fixed schedule. Choose theEdit schedule link to create or edit a monitor schedule. For information about creatingschedules, read these instructions.
Monitor Description (Optional)
Enter additional information about this monitor. The description will appear on the MonitorDetail page.
Report Description (Optional)
Enter a description for this monitor that will make it easier to understand what this monitordoes. The description will appear on Management Reports and on the info pop-up for amonitor.
List Order (Optional)
By default, new monitors are listed last on the Monitor Detail page. You may use thispull-down menu to choose a different placement for this monitor.
Error if
Set the Error threshold for this monitor. By default SiteScope reports an error condition ifmemory use is more than 90%. You can change this to report errors based uponpages/second, Megabytes free, and percentage of memory in use. Choose the option youwant from the pop-up menu, select a comparison value symbol, and enter a threshold value. For example, if you want SiteScope to report an error condition if your memory use is morethan 96%, you need to choose percent used from the pop-up menu, select >= from thecomparison value pop-up, and then enter 96 in the text entry box.
Warning if
Set the warning threshold for this monitor. By default SiteScope reports a warning condition
SiteScope User Guide
Advanced Options 90
if your memory use is more than 90% full, but less than the error threshold. You can changethis threshold or set it to generate a warning based upon pages per second, Megabytes free, orpercentage of memory in use. You must enter a whole number.For example, if you want to change the warning threshold to 50%, choose percent used fromthe pop-up menu, select >= from the comparison value pop-up, and enter 50 in the test entrybox.
Good if
You may also specify a threshold for a good reading. You may base it on pages per second,Megabytes free, or percentage of memory in use.
SiteScope User Guide
Advanced Options 91

Network Monitor
The SiteScope Network Monitor provides an easy way for you to track network statistics for your server. Information provided by the network monitor can help you track down performance problems related tonetwork interfaces on your servers.
Each time the Network Monitor runs, it returns a reading and a status message and writes them in the~SiteScope/logs/SiteScope.log file.
Usage Guidelines
Why should I use this monitor?
Web server performance is dictated largely by the network interface. The actual number of bytes beingpassed in and out of your server as well as the number of packets in error are all critical measures of aserver's performance and are tracked by the Network Monitor. In addition, active connections are tracked.
How often should I schedule this monitor to run?
In most environments, scheduling the Network Monitor to run every 10 minutes should be sufficient. SiteScope can notify you if network performance begins to slow, and you'll have enough data points to createmeaningful reports for comparison and trend analysis.
What are common problems and how do I fix them?
Packet Errors measure the number of packets that failed to reach the destination IP address. This can indicatea faulty network interface or media. If the problem shows up on several servers that are topologically close,it is likely the media. If this condition occurs on only one isolated server, you can suspect the interface.
Throughput indicators let you know how fully utilized your network interface is. For instance, if you arerunning on a conventional ethernet interface and you see numbers approaching 10 megabits / sec., theinterface is nearly saturated.
Connections is the count of open ports on your network interface. This measure should settle at some somepredictable level. Continuous climbing of the connection count indicates an error condition or run-awaycondition that will eventually slow the server due to resource constraints.
Status
The reading is the current value of the monitor, such as 40% saturated. The status is logged as either OK,warning, or error. A warning status is returned if the bytes out per second is more than 80% full. Full isdefined as a fully saturated standard ethernet bandwidth or 10 megabits / sec. An error status is returned ifbytes out per second is more than 90% saturation.
Network Monitor 92
If you would like for SiteScope to respond if a warning or error status is returned, create an alert. An alertcontains instructions that tell SiteScope to either notify you via sound, e-mail or pager, or execute anautomatic recovery script when a problem is detected.
Completing the Network Monitor Form
To display the Network Monitor Form, either click the name of an existing Network Monitor in a monitortable, or click the Add a new Monitor to this Group link on a group's detail page and choose the AddNetwork Monitor link.
Complete the fields on the Network Monitor Form as follows. When all the fields are complete, click theUpdate Monitor button.
Update every
Enter how frequently the monitor should check this drive. The pull-down menu to the rightof the entry field lets you specify time increments of seconds, minutes, hours, or days. Youmust specify a time increment of at least 15 seconds.
Title (Optional)
Enter a name for this monitor. This name appears in the Name field on the monitor tablewhen you open the group's detail page. If you don't enter a name, a default name will becreated.
Advanced Options
The advanced options give you the ability to customize error and warning condition thresholds. If youchoose not to set them, SiteScope uses pre-set defaults if available. If a default is not available, SiteScopecannot utilize the condition.
Disable
Check this box to temporarily disable this monitor and any associated alerts. To enable themonitor again, un-check the box.
Verify Error
Check this box if you want SiteScope to automatically run this monitor again when it detectsan error.
Update Every (on error)
This options allows you to set a new monitoring interval for monitors that have registered an
SiteScope User Guide
Status 93
error condition. For example, you may want SiteScope to monitor this item every 10 minutesnormally, but as often as every 2 minutes if an error has been detected. Note that thisincreased scheduling will also affect the number of alerts generated by this monitor.
Schedule (Optional)
By default, SiteScope's monitors are enabled every day of the week. You may, however,schedule your monitors to run only on certain days or on a fixed schedule. Choose theEdit schedule link to create or edit a monitor schedule. For information about creatingschedules, read these instructions.
Monitor Description (Optional)
Enter additional information about this monitor. The description will appear on the MonitorDetail page.
Report Description (Optional)
Enter a description for this monitor that will make it easier to understand what this monitordoes. The description will appear on Management Reports and on the info pop-up for amonitor.
List Order (Optional)
By default, new monitors are listed last on the Monitor Detail page. You may use thispull-down menu to choose a different placement for this monitor.
Error if
Set the Error threshold for this monitor. By default SiteScope reports an error condition ifany packet errors occur. You can change this to be dependent upon packet errors per second,the number of active connections, bytes per second received, or bytes per second sent.Choose the option you want from the pull-down menu, select a comparison value symbol,and enter the threshold number in the text entry box. You must enter a whole number.For example, if you want SiteScope to report an error condition if your packed error countexceeds 5 errors per second, you need to choose errorsPerSecond >= from the pull-downmenus and then enter 5 in the text entry box.
Warning if
Set the warning threshold for this monitor. By default SiteScope reports a warning conditionif your bytes out per second is more than 50000. You can change this to be dependent uponpacket errors per second, the number of active connections, bytes per second received, orbytes per second sent.For example, if you want to change the warning threshold to 10000, chooseoutBytesPerSecond > from the pull-down menus and then enter 10000 in the text entry box.
Good if
By default SiteScope assumes a good status. You can change this to be dependent uponpacket errors per second, the number of active connections, bytes per second received, or
SiteScope User Guide
Advanced Options 94

bytes per second sent.
SiteScope User Guide
Advanced Options 95

News Monitor
The SiteScope News Monitor verifies that a news server can be connected to, and is responding. It alsomeasures how long it takes to make a connection, and how many articles are currently in the specified newsgroups.
Each time the News Monitor runs, it returns a status message and writes it in the monitoring log file. It alsowrites the total time it takes to receive a response from the news server, and the number of articles availablefor each of the specified news groups.
Usage Guidelines
Why should I use this monitor?
Running the News Monitor on a regular basis can save you the headaches associated with the entire officecoming in to tell you they can't read their news groups. With regular monitoring, you should be able toaddress any problems before the hordes notice anything's amiss.
In addition, you can manage the number of articles that are allowed to queue up, deleting them before theycause disk space problems.
What should I monitor?
You should monitor any news servers that you have running.
How should I schedule my monitors?
It's usually sufficient to monitor your news server every 10 minutes or so. If you notice that you're havingproblems, you can schedule the monitor(s) to run more frequently.
Status
The reading is the current value of the monitor. The possible values for the News Monitor are:
• OK• unknown host name• unable to reach server• unable to connect to server• timed out reading• <news group> not found - the given news group was not found on the news server• permission denied for connection - the connection could not be made, probably because the news
server was configured to allow connections from a limited range of addresses.• login expected - the news server expected a user name and password, but none were provided. In this
case, enter a user name and password under the Advanced Options section of the monitor.
News Monitor 96

• login failed, unauthorized - the user name and password were not accepted by the news server
The status is logged as either good or error. An error status is returned if the current value of the monitor isanything other than OK. If you would like for SiteScope to respond if an error status is returned, create analert. An alert contains instructions that tell SiteScope to either notify you via e-mail or pager, or execute anautomatic recovery script when a problem is detected.
Completing the News Monitor Form
To display the News Monitor Form, either click the name of an existing News Monitor listed in a monitortable, or click the Add a new Monitor to this Group link on a group's detail page and choose the New NewsMonitor link.
Complete the fields on the News Monitor form as follows. When all the fields are complete, click theAdd Monitor button.
News Server
Enter the IP address or the name of the news server that you want to monitor. For example,you could enter either 206.168.191.21 or news.freshtech.com. If the port is not the standardnews port, add the port after the server with a colon - for example, news.freshtech.com:7777.
News Groups
Optionally enter a one or more news groups that will be checked, separated by commas. Eachof these news groups will be checked for the current number of articles available in that newsgroup - the reading of the monitor is the sum of articles available for each of the specifiednews groups.
Update every
Enter how frequently the monitor should try to reach the host. The pull-down menu to theright of the text entry field lets you specify time increments of seconds, minutes, hours, ordays. You must specify a time increment of at least 15 seconds.
Title (Optional)
Enter a name for this monitor. This name appears in the Name field on the monitor tablewhen you open the group's detail page. If you don't enter a name, a default name will becreated.
Advanced Options
The advanced options give you the ability to customize error and warning thresholds, or complete optionalsettings.
Disable
SiteScope User Guide
Status 97

Check this box to temporarily disable this monitor and any associated alerts. To enable themonitor again, un-check the box.
Timeout
The number of seconds that the News monitor should wait for all of news transactions tocomplete before timing-out. Once this time period passes, the News monitor will log an errorand report an error status.
User Name (Optional)
If your News server requires authorization, enter a valid user name here.
Password (Optional)
If your News server requires authorization, enter a valid password here.
Verify Error
Check this box if you want SiteScope to automatically run this monitor again if it detects anerror.
Schedule (Optional)
By default, SiteScope's monitors are enabled every day of the week. You may, however,schedule your monitors to run only on certain days or on a fixed schedule. Choose theEdit schedule link to create or edit a monitor schedule. For information about creatingschedules, read these instructions.
Monitor Description (Optional)
Enter additional information about this monitor. The description will appear on the MonitorDetail page.
Report Description (Optional)
Enter a description for this monitor that will make it easier to understand what this monitordoes. The description will appear on Management Reports and on the info pop-up for amonitor.
List Order (Optional)
By default, new monitors are listed last on the Monitor Detail page. You may use thispull-down menu to choose a different placement for this monitor.
Error if
This advanced option allows you to customize the conditions under which the News Monitorgenerates an error status message. By default SiteScope generates an error if the returnedstatus is anything other than 200. You can change this to generate an error based on theaverage length of the round trip times or the number of articles present. To change the default
SiteScope User Guide
Advanced Options 98

choose an option from the pull-down menu, select a comparison value symbol, and enter thelowest value that should trigger an error in the text entry box.
Warning if:
This advanced option allows you to customize the conditions under which the News Monitorgenerates a warning status message. By default, the News monitor does not have a warningthreshold, but you can set this option to define one based upon round-trip time or number ofarticles present.
Good if
SiteScope reports a good state if the status returned is 200. You can change this to be basedupon round-trip time or number of articles present.
SiteScope User Guide
Advanced Options 99
Ping Monitor
The SiteScope Ping Monitor checks the availability of a host via the network. Use this monitor to ensure thatyour connection to the Internet is alive and well.
Each time the Ping Monitor runs, it returns a reading and a status message and writes them in the monitoringlog file. It also writes the total time it takes to receive a response from the designated host in the log file.
Usage Guidelines
Why should I use this monitor?
The network can often be a web-traffic bottleneck, especially on relatively slow wide area networkconnections. The Ping Monitor obtains two of the most common measurements used to determine if yournetwork connection is congested: Round Trip Time and Loss Percentage. An increase of either of thesesuggests that you're experiencing problems. In the case of Loss Percentage, you want to see a 0% reading. A100% reading indicates your link is completely down. Some loss may happen very occasionally, but if itbecomes common, the network is either flaky (some packets are being lost), or very busy and the router maybe dropping the Ping packets.
What should I be monitoring?
We suggest that you set up monitors that test your connection to the Internet at several different points. Forexample, if you have a T1 connection to a network provider who in turn has a connection to the backbone,you would want to set up a Ping Monitor to test each of those connections. The first monitor would ping therouter on your side of the T1. The second would ping the router on your provider's side of the T1. The thirdmonitor would ping your provider's connection to the backbone.
In addition to these monitors, it's also a good idea to have a couple of other monitors ping other majornetwork providers. These monitors won't really tell you whether the other provider is having a problem, but itwill tell you if your network provider is having trouble reaching them.
How often should I schedule Ping Monitors to run?
Because it won't cost you much performance wise, you can monitor your own router as often as every twominutes or so. That way you'll know about any problems on your end as quickly as possible. The monitorsthat watch your provider's connection to your line and to the backbone should only be run every ten minutesor so. This will minimize traffic while still providing you with sufficient coverage.
Status
The reading is the current value of the monitor. The possible values for the Ping Monitor are:
Ping Monitor 100
• OK• fail• N out of M missing (indicating that some pings failed)
The status message is either OK, error, or N out of M missing. An error status is generated if SiteScopecannot reach the host. If you would like for SiteScope to respond if an error status is returned, create an alert.An alert contains instructions that tell SiteScope to either notify you via e-mail or pager, or execute anautomatic recovery script when a problem is detected.
Completing the Ping Monitor Form
To display the Ping Monitor Form, either click the name of an existing Ping Monitor listed in a monitor table,or click the "Add a new Monitor to this Group" link on a group's detail page and choose the "New PingMonitor" link.
Complete the fields on the Ping Monitor form as follows. When all the fields are complete, click theAdd Monitor button.
Host Name
Enter the IP address or the name of the host that you want to monitor. For example, youcould enter either 206.168.191.21 or demo.freshtech.com.
Update every
Enter how frequently the monitor should try to reach the host. The pull-down menu to theright of the text entry field lets you specify time increments of seconds, minutes, hours, ordays. You must specify a time increment of at least 15 seconds.
Title (Optional)
Enter a name for this monitor. This name appears in the Name field on the monitor tablewhen you open the group's detail page. If you don't enter a name, a default name will becreated.
Advanced Options
The advanced options give you the ability to customize error and warning thresholds. If you choose not to setthem, SiteScope will use pre-set defaults if available. If a default is not available, SiteScope will not be ableto utilize the condition.
SiteScope User Guide
Status 101
Disable
Check this box to temporarily disable this monitor and any associated alerts. To enable themonitor again, un-check the box.
Time Out
This advanced option gives you the ability to customize the Ping Monitor's time outthreshold -- the time that should pass before the ping times out. If you choose not to set it,SiteScope uses a pre-set default of 5000 milliseconds. To change the threshold, type the newvalue in the text entry box. The value must be in milliseconds.
Size
This advanced option gives you the ability to customize the size of the ping packets sent. Ifyou choose not to set it, SiteScope uses a pre-set default of 64 bytes. To change thethreshold, type the new value in the text entry box. The value is in bytes.
Verify Error
Check this box if you want SiteScope to automatically run this monitor again if it detects anerror.
Update Every (on error)
This options allows you to set a new monitoring interval for monitors that have registered anerror condition. For example, you may want SiteScope to monitor this item every 10 minutesnormally, but as often as every 2 minutes if an error has been detected. Note that thisincreased scheduling will also affect the number of alerts generated by this monitor.
Schedule (Optional)
By default, SiteScope's monitors are enabled every day of the week. You may, however,schedule your monitors to run only on certain days or on a fixed schedule. Choose theEdit schedule link to create or edit a monitor schedule. For information about creatingschedules, read these instructions.
Monitor Description (Optional)
Enter additional information about this monitor. The description will appear on the MonitorDetail page.
Report Description (Optional)
Enter a description for this monitor that will make it easier to understand what this monitordoes. The description will appear on Management Reports and on the info popup for amonitor.
List Order (Optional)
By default, new monitors are listed last on the Monitor Detail page. You may use this
SiteScope User Guide
Advanced Options 102
pull-down menu to choose a different placement for this monitor.
Error if
This option allows you to customize the conditions under which the Ping Monitor generatesan error status message. Each time the Ping Monitor runs, it pings the specified host fivetimes and then returns a value based on the average of all five pings. This helps to ensureagainst false readings. By default the Ping Monitor reports an error status any time it fails toreach a host after five pings. You can change this to generate an error based on the average length of the round trip times.To change the default choose either % packets good or round trip time from the drop downmenu. Next choose a comparison symbol from the pop-up. Use the comparison value pop-upto specify an error threshold.Finally, enter the comparison value in the last text entry box to create a complete equation,such as % packets good <= 90. SiteScope's reported round trip time is actually the average of the round trip times from allfive pings executed each time the monitor runs. Enter the lowest average round trip timewhich should trigger an error status.
Warning if
This option allows you to customize the conditions under which the Ping Monitor generates awarning status message. Each time the Ping Monitor runs, it pings the specified host fivetimes and then returns a value based on the average of all five pings. By default the PingMonitor reports a warning status if it fails to reach a host on all five pings. To set the warning threshold, choose either % packets good or round trip time from the dropdown menu. Use the comparison operator pop-up to specify >= (greater than or equal to), !=(not equal to), or < (less than). Finally, enter the comparison value in the last text entry boxto create a complete equation, such as % packets good <= 99. SiteScope's reported round trip time is actually the average of the round trip times from allfive pings executed each time the monitor runs. Enter the lowest average round trip timewhich should trigger a warning status.
Good if
This option allows you to customize the conditions under which the Ping Monitor generates agood status message. Each time the Ping Monitor runs, it pings the specified host five timesand then returns a value based on the average of all five pings. This helps to ensure againstfalse readings. By default, the Ping Monitor returns a good status if all five pings aresuccessful. You may change this default if you like. To set the Good if threshold, choose either % packets good or round trip time from the dropdown menu. Next choose a comparison symbol from the pop-up. Use the comparison valuepop-up to specify an good threshold. Finally, enter the comparison value in the last text entry box to create a complete equation,such as % packets good >= 90.
SiteScope User Guide
Advanced Options 103
Port Monitor
The SiteScope Port Monitor verifies that a connection can be made to a network port and measures the lengthof time it takes to make the connection. Optionally, it can look for a string of text to be returned or send astring of text once the connection is made.
Each time the Port Monitor runs, it returns a status message and writes them in the monitoring log file. It alsowrites the total time it takes to receive a response from the remote service.
Usage Guidelines
Why should I use this monitor?
The Port Monitor is useful for monitoring network applications that none of the other SiteScope monitorswatch. You'll be notified immediately if SiteScope is unable to connect to the monitored port.
What should I monitor?
Most people use the Port Monitor to watch those network applications that SiteScope doesn't specificallywatch, such as Gopher and IRC services, or custom network applications. It's an easy way to keep an eye onthose applications and restart them if necessary.
How should I schedule my monitors?
Scheduling Port Monitors is pretty much up to you. This is a very lightweight monitor, so it won't hurt toschedule it frequently, but every 10 minutes is probably a good baseline to use.
Status
The reading is the current value of the monitor. The possible values for the Port Monitor are:
• OK• unknown host name• unable to reach server• unable to connect to server• timed out reading• match error
The status is logged as either good or error. An error status is returned if the current value of the monitor isanything other than OK. If you would like for SiteScope to respond if an error status is returned, create analert. An alert contains instructions that tell SiteScope to either notify you via e-mail or pager, or execute anautomatic recovery script when a problem is detected.
Port Monitor 104
Completing the Port Monitor Form
To display the Port Monitor Form, either click the name of an existing Port Monitor listed in a monitor table,or click the "Add a new Monitor to this Group" link on a group's detail page and choose the "New PortMonitor" link.
Complete the fields on the Port Monitor form as follows. When all the fields are complete, click theAdd Monitor button.
Host Name
Enter the IP address or the name of the host that you want to monitor. For example, youcould enter either 206.168.191.21 or demo.freshtech.com.
Port Number
Choose the port number to connect to from the list of services, or enter a port number in thetext field. Additional entries can be added to list by editing the master.config file in thegroups directory).
Update every
Enter how frequently the monitor should try to reach the host. The pull-down menu to theright of the text entry field lets you specify time increments of seconds, minutes, hours, ordays. You must specify a time increment of at least 15 seconds.
Title (Optional)
Enter a name for this monitor. This name appears in the Name field on the monitor tablewhen you open the group's detail page. If you don't enter a name, a default name will becreated.
Advanced Options
The advanced options give you the ability to customize error and warning thresholds, or complete optionalsettings.
Disable
Check this box to temporarily disable this monitor and any associated alerts. To enable themonitor again, un-check the box.
Send String
This advanced option gives you the ability to customize the string sent after a connection ismade.
SiteScope User Guide
Completing the Port Monitor Form 105
Match String
This advanced option gives you the ability to check for a string of text after a connection ismade. If the text is not received, the monitor will display "no match on content". The searchis case sensitive.
Timeout
The number of seconds that the Port monitor should wait for the connection to the port, andfor any sending and receiving to complete. Once this time period passes, the Port monitorwill log an error and report an error status.
Verify Error
Check this box if you want SiteScope to automatically run this monitor again if it detects anerror.
Update Every (on error)
This options allows you to set a new monitoring interval for monitors that have registered anerror condition. For example, you may want SiteScope to monitor this item every 10 minutesnormally, but as often as every 2 minutes if an error has been detected. Note that thisincreased scheduling will also affect the number of alerts generated by this monitor.
Schedule (Optional)
By default, SiteScope's monitors are enabled every day of the week. You may, however,schedule your monitors to run only on certain days or on a fixed schedule. Choose theEdit schedule link to create or edit a monitor schedule. For information about creatingschedules, read these instructions.
Monitor Description (Optional)
Enter additional information about this monitor. The description will appear on the MonitorDetail page.
Report Description (Optional)
Enter a description for this monitor that will make it easier to understand what this monitordoes. The description will appear on Management Reports and on the info pop-up for amonitor.
List Order (Optional)
By default, new monitors are listed last on the Monitor Detail page. You may use thispull-down menu to choose a different placement for this monitor.
Error if
This advanced option allows you to customize the conditions under which the Port Monitorgenerates an error status message.
SiteScope User Guide
Advanced Options 106

You can change this to generate an error based on the length of the round trip times. Enter acomparison value and use the comparison operator pop-up to specify an error threshold suchas: >= (greater than or equal to), != (not equal to), or < (less than).
Warning if
This advanced option allows you to customize the conditions under which the Port Monitorgenerates a warning status message. By default, the Port monitor does not have a warningthreshold, but you can set this option to define one.Enter a comparison value and use the comparison operator pop-up to specify an errorthreshold such as: >= (greater than or equal to), != (not equal to), or < (less than).
Good if
SiteScope maintains a good status if the reading returned is 200, but you can change this tobe based upon round-trip time.
SiteScope User Guide
Advanced Options 107
Radius Monitor
The SiteScope Radius Monitor checks that a RADIUS server is working correctly by sending anauthentication request and checking the result. The word RADIUS is an acronym for Remote AuthenticationDial In User Service and a RADIUS server is used to authenticate users, often connecting through a remoteconnection such as a dialup modem or a DSL line.
Each time the Radius Monitor runs, it returns a status message and writes it in the monitoring log file. It alsowrites the total time it takes to receive a authentication response.
Usage Guidelines
Why should I use this monitor?
The Radius Monitor is useful for testing that the RADIUS server is correctly handling authenticationrequests. If the RADIUS server fails, any users that try to use it will be unable to login and access anyservices.
What should I monitor?
Most people would setup a Radius monitor for each of their RADIUS servers. You may want to setupmultiple monitors per server if you want to test different kinds of login accounts.
How should I schedule my monitors?
This is a very lightweight monitor, so it won't hurt to schedule it frequently, maybe as often as every 5minutes.
Status
The reading is the current value of the monitor. The possible values for the Radius Monitor are:
• OK• unknown host name• timed out reading• match error
The status is logged as either good or error. An error status is returned if the current value of the monitor isanything other than OK. If you would like for SiteScope to respond if an error status is returned, create analert. An alert contains instructions that tell SiteScope to either notify you via e-mail or pager, or execute anautomatic recovery script when a problem is detected.
Radius Monitor 108

Completing the Radius Monitor Form
To display the Radius Monitor Form, either click the name of an existing Radius Monitor listed in a monitortable, or click the "Add a new Monitor to this Group" link on a group's detail page and choose the "NewRadius Monitor" link.
Complete the fields on the Radius Monitor form as follows. When all the fields are complete, click theAdd Monitor button.
RADIUS Server
Enter the IP address or the name of the RADIUS server that you want to monitor. Forexample, you could enter either 206.168.191.21 or radius.freshtech.com.
Secret
Enter the secret used to encrypt all requests to this RADIUS server
Username
Enter the username to authenticate
Password
Enter the password to authenticate
Update every
Enter how frequently the monitor should try to reach the host. The pull-down menu to theright of the text entry field lets you specify time increments of seconds, minutes, hours, ordays. You must specify a time increment of at least 15 seconds.
Title (Optional)
Enter a name for this monitor. This name appears in the Name field on the monitor tablewhen you open the group's detail page. If you don't enter a name, a default name will becreated.
Advanced Options
The advanced options give you the ability to customize error and warning thresholds, or complete optionalsettings.
Disable
Check this box to temporarily disable this monitor and any associated alerts. To enable themonitor again, un-check the box.
SiteScope User Guide
Completing the Radius Monitor Form 109

Timeout
The number of seconds that the Radius monitor should wait for the connection to the port,and for any sending and receiving to complete. Once this time period passes, the Radiusmonitor will log an error and report an error status.
Port Number
Choose the TCP port used by the RADIUS server. The default port used by RADIUS serversis 1645 and does not usually need to be changed
Match Content
Enter a string of text to check for in the response. If the text is not contained in the response,the monitor will display "no match on content". The search is case sensitive. You may alsoperform a Perl regular expression match by enclosing the string in forward slashes, with an"i" after the trailing slash indicating case-insensitive matching. (for example, "/ \d\d/" or"/size \d\d/i").
Verify Error
Check this box if you want SiteScope to automatically run this monitor again if it detects anerror.
Update Every (on error)
This options allows you to set a new monitoring interval for monitors that have registered anerror condition. For example, you may want SiteScope to monitor this item every 10 minutesnormally, but as often as every 2 minutes if an error has been detected. Note that thisincreased scheduling will also affect the number of alerts generated by this monitor.
Schedule (Optional)
By default, SiteScope's monitors are enabled every day of the week. You may, however,schedule your monitors to run only on certain days or on a fixed schedule. Choose theEdit schedule link to create or edit a monitor schedule. For information about creatingschedules, read these instructions.
Monitor Description (Optional)
Enter additional information about this monitor. The description will appear on the MonitorDetail page.
Report Description (Optional)
Enter a description for this monitor that will make it easier to understand what this monitordoes. The description will appear on Management Reports and on the info pop-up for amonitor.
SiteScope User Guide
Advanced Options 110

List Order (Optional)
By default, new monitors are listed last on the Monitor Detail page. You may use thispull-down menu to choose a different placement for this monitor.
Error if
This advanced option allows you to customize the conditions under which the RadiusMonitor generates an error status message. You can change this to generate an error based on the length of the round trip times. Enter acomparison value and use the comparison operator pop-up to specify an error threshold suchas: >= (greater than or equal to), != (not equal to), or < (less than).
Warning if
This advanced option allows you to customize the conditions under which the RadiusMonitor generates a warning status message. By default, the Radius monitor does not have awarning threshold, but you can set this option to define one.Enter a comparison value and use the comparison operator pop-up to specify an errorthreshold such as: >= (greater than or equal to), != (not equal to), or < (less than).
Good if
SiteScope maintains a good status if the reading returned is 200, but you can change this tobe based upon round-trip time.
SiteScope User Guide
Advanced Options 111
Script Monitor
The SiteScope Script Monitor runs an external command and reports the result. It is an easy way to integrateexisting scripts into the SiteScope environment. In addition to reporting the command result, the ScriptMonitor can also parse and report a specific value from the command output.
Each time the Script Monitor runs, it returns a status and writes it into the monitoring log file. It also reportsa command result, a value, and the time it took to run the command.
Usage Guidelines
One of the primary reasons for using the Script Monitor is to integrate an existing script that you use to do aparticular function into SiteScope. For example, if you have a script that runs a diagnostic on an applicationand returns a 0 reading if everything's OK, you could create a script monitor that runs this script andrecognizes any exit value other than 0 as an error. Then you could create an alert which would e-mail or pageyou in the event that this monitor was in error.
Scheduling Script monitors is dependent upon the script that you want SiteScope to run. You can use thescheduling option to have SiteScope run scripts at different intervals throughout the week.
Status
The command result is the exit value returned by running the command.
The status is logged as either good or error. An error status is returned if the script did not completesuccessfully. Any non-zero exit code from the script is also considered an error status. If you would like forSiteScope to respond if an error status is returned, create an alert. An alert contains instructions that tellSiteScope to either notify you via e-mail or pager, or execute an automatic recovery script when a problem isdetected.
Note: Win NT batch file (*.bat) exit codes are not passed out of the command interpreter.This means that if your script exits with a non-zero value to signal an error, the status willstill be OK for a batch file in NT.
Completing the Script Monitor Form
To display the Script Monitor Form, either click the name of an existing Script Monitor in a monitor table, orclick the "Add a new Monitor to this Group" link on a group's detail page and choose the "Add ScriptMonitor" link.
Script Monitor 112
Complete the fields on the Script Monitor form as follows. When all the fields are complete, click the"Add Monitor" button.
Script:
Enter the name of the script to run. For security reasons, only scripts placed into theSiteScope/scripts directory may be used. In that directory, there are several examples scriptswith comments describing each one.
Update every:
Enter how frequently the monitor should run this Script. The pull-down menu to the right ofthe entry field lets you specify time increments of seconds, minutes, hours, or days. Youmust specify a time increment of at least 15 seconds.
Title: (Optional)
Enter a name for this monitor. This name appears in the Name field on the monitor tablewhen you open the group's detail page. If you don't enter a name, a default name will becreated.
Advanced Options
The advanced options give you the ability to customize error and warning thresholds, or complete optionalsettings.
Disable
Check this box to temporarily disable this monitor and any associated alerts. To enable themonitor again, un-check the box.
Match Expression (Optional)
To retrieve a value from the script output, enter a Perl regular expression in this field. Forexample, the expression: /(\d+)/ will match one or more digits returned by the script. Theretrieved value can be used to set the error or warning status of the monitor and to triggeralerts. SiteScope will check up to four values returned. If this field is left blank, no value willbe retrieved from the script.
Verify Error
Check this box if you want SiteScope to automatically run this monitor again if it detects anerror.
Update Every (on error)
SiteScope User Guide
Completing the Script Monitor Form 113
This options allows you to set a new monitoring interval for monitors that have registered anerror condition. For example, you may want SiteScope to monitor this item every 10 minutesnormally, but as often as every 2 minutes if an error has been detected. Note that thisincreased scheduling will also affect the number of alerts generated by this monitor.
Schedule (Optional)
By default, SiteScope's monitors are enabled every day of the week. You may, however,schedule your monitors to run only on certain days or on a fixed schedule. Choose theEdit schedule link to create or edit a monitor schedule. For information about creatingschedules, read these instructions.
Monitor Description (Optional)
Enter additional information about this monitor. The description will appear on the MonitorDetail page.
Report Description (Optional)
Enter a description for this monitor that will make it easier to understand what this monitordoes. The description will appear on Management Reports and on the info popup for amonitor.
List Order (Optional)
By default, new monitors are listed last on the Monitor Detail page. You may use thispull-down menu to choose a different placement for this monitor.
Error if
By default, SiteScope generates an error if the script returns an error as the exit status. Youmay choose to generate an error based on the exit status, any one of four matched scriptvalues, or the time it takes to run the script. Select a comparison value (must be numeric) anduse the comparison operator pop-up to specify an error threshold such as: >= (greater than orequal to), != (not equal to), or < (less than).
Warning if
By default, SiteScope does not generate warnings for Script monitors. You may choose togenerate a warning based on the exit status, the script value, or the time it takes to run thescript.
Good if
SiteScope reports a good status if the exit status of the script equals 0, but you can changethis to be based upon another value or round-trip time.
SiteScope User Guide
Advanced Options 114
Service Monitor
The SiteScope Service Monitor checks to see if a service (NT environment) or a sepcific process is running.There are many services or processes that play an important role in the proper functioning of your server,including Web server, Mail, FTP, News, Gopher, and Telnet. Web environements which support e-commercetransactions may have other important processes that support data exchange.
Each time the Service Monitor runs, it returns a reading and a status message and writes them in themonitoring log file.
Usage Guidelines
Why should I use this monitor?
The Service Monitor verifies that specific processes are listed as running, and if you like, it can also check tosee how much CPU a process is using. If a process that should be running doesn't show up or if it is using toomuch memory, SiteScope can either alert you to the problem so that you can address it yourself, or it can runa script to automatically restart the process to help minimize downtime.
What should I monitor?
You should create a service monitor for any service or process that should be running on a consistent basis.You can also create a script alert that will restart the service automatically if the service monitor in SiteScopecan't find it. The restartService.bat script, located in the SiteScope/scripts directory, is an easily modifiabletemplate which you can use to create a script for SiteScope to execute in the event your monitor fails.
How should I schedule my monitors?
The Service Monitor doesn't put a heavy load on your server so you can run it as often as you like. You'llprobably want to monitor critical services and services that are prone to failure every five minutes or so. Lesscritical services and processes should be monitored less frequently.
Status
The reading is the current value of the monitor. For this monitor, the possible readings are:
• Running• Not found
The status is logged as either OK or error. An error status is returned if the service is not found. If you wouldlike for SiteScope to respond if an error status is returned, create an alert. An alert contains instructions thattell SiteScope to either notify you via e-mail or pager, or execute an automatic recovery script when a
Service Monitor 115

problem is detected.
Completing the Service Monitor Form
To display the Service Monitor Form, either click the name of an existing Service Monitor in a monitor table,or click the "Add a new Monitor to this Group" link on a group's detail page and choose the "Add ServiceMonitor" link.
Complete the fields on the Service Monitor Form as follows. When all the fields are complete, click theAdd Service Monitor button.
Server
Choose the server that you want to monitor. The default is to monitor services on the serveron which SiteScope is installed. Click the choose server link to monitor services on anotherNT server.
Service
Choose the service (or process in Unix) that you want to monitor from the drop down list. Tomonitor a service other than those listed then select "Other" in the drop down list and enterthe name of the service in the text field to the right. To monitor an NT process, select "(UsingProcess Name)" in the drop down list and enter the name of the Process Name text fieldunder the Advanced Options section.
Update every
Enter how frequently the monitor should check for this service. The pull-down menu to theright of the entry field lets you specify time increments of seconds, minutes, hours, or days.You must specify a time increment of at least 15 seconds.
Title (Optional)
Enter a name for this monitor. This name appears in the Name field on the monitor tablewhen you open the group's detail page. If you don't enter a name, a default name will becreated.
Advanced Options
The advanced options give you the ability to customize error and warning thresholds. If you choose not to setthem, SiteScope will use pre-set defaults if available. If a default is not available, SiteScope will not be ableto utilize the condition.
Disable
SiteScope User Guide
Status 116

Check this box to temporarily disable this monitor and any associated alerts. To enable themonitor again, un-check the box.
Process Name (NT Only)
If you would like to get information about the percentage of CPU being used by a specificprocess and/or the number of a specific type of process running, enter the name of theprocess here. SiteScope is looking for the name of the process as it appears in NT TaskManager (example: explorer.exe).
Measure Process Memory Use (Unix Only)
If you would like SiteScope to report the amount of virtual memory being used by a specificprocess, enter the process name here.
Verify Error
Check this box if you want SiteScope to automatically run this monitor again if it detects anerror.
Update Every (on error)
This options allows you to set a new monitoring interval for monitors that have registered anerror condition. For example, you may want SiteScope to monitor this item every 10 minutesnormally, but as often as every 2 minutes if an error has been detected. Note that thisincreased scheduling will also affect the number of alerts generated by this monitor.
Schedule (Optional)
By default, SiteScope's monitors are enabled every day of the week. You may, however,schedule your monitors to run only on certain days or on a fixed schedule. Choose theEdit schedule link to create or edit a monitor schedule. For information about creatingschedules, read these instructions.
Monitor Description (Optional)
Enter additional information about this monitor. The description will appear on the MonitorDetail page.
Report Description (Optional)
Enter a description for this monitor that will make it easier to understand what this monitordoes. The description will appear on Management Reports and on the info pop-up for amonitor.
List Order (Optional)
By default, new monitors are listed last on the Monitor Detail page. You may use thispull-down menu to choose a different placement for this monitor.
Error if
SiteScope User Guide
Advanced Options 117

Set the Error threshold for this monitor. By default SiteScope reports an error condition if itdoes not find at least one of the named processes running. If you would like to change this toreport an error if multiple processes aren't found, or if the percentage of CPU used by theprocess exceeds a certain number of bytes, you can do so here. For example, if you want SiteScope to report an error if it doesn't find 3 HTTP processesrunning, choose the Processes in Processes option and type 3 in the text entry area. Enter acomparison value and use the comparison operator pop-up to specify an error threshold suchas: >= (greater than or equal to), != (not equal to), or < (less than).
Warning if
Set the Warning threshold for this monitor. SiteScope does not have a default warningthreshold for this monitor. If you would like to define a warning threshold, you may do sohere.For example, if you want SiteScope to report a warning if the specified process starts usingexcessive CPU, enter the warning threshold for CPU usage in bytes in the text entry field andselect the memory in bytes and >= options from the pull-down menus.
Good if
SiteScope reports a good status if it detects the named process running. You can change thisto be dependent upon multiple processes running, the percentage of CPU used by theprocess, or the status returned by the process.
SiteScope User Guide
Advanced Options 118

SNMP Monitor
The SiteScope SNMP Monitor reads a value from an SNMP device. Many network devices support theSNMP protocol as a way of monitoring the devices.
Each time the SNMP Monitor runs, it returns a value and a status and writes them in the monitoring log file.
If you would like for SiteScope to respond if an error status is returned, create an alert. An alert containsinstructions that tell SiteScope to either notify you via e-mail or pager, or execute an automatic recoveryscript when a problem is detected.
Usage Guidelines
Why should I use this monitor?
The SNMP monitor allows you to monitor devices that SiteScope doesn't otherwise watch. In addition, theSNMP monitor allows you to keep an eye on whatever values are available via SNMP for that device.
What should I monitor?
You can monitor anything you'd like with this monitor as long as it supports the SNMP protocol, from UPSsto routers. If your router supports SNMP, for example, you could have SiteScope watch for packet errors.
How should I schedule my monitors?
The standard 10 minute interval should suffice in most cases, but you can set the interval to whatever you'recomfortable with.
Completing the SNMP Monitor Form
To display the SNMP Monitor Form, either click the name of an existing SNMP Monitor in a monitor table,or click the "Add a new Monitor to this Group" link on a group's detail page and choose the "Add SNMPMonitor" link.
Complete the fields on the SNMP Monitor form as follows. When all the fields are complete, click the"Add Monitor" button.
Host Name
Enter the host name or IP address of the SNMP device that you want to monitor (forexample, "demo.freshtech.com").
Object ID
SNMP Monitor 119

Enter the Object Identifier (OID) for the SNMP value you want to retrieve. The OIDspecifies which value should be retrieved from the device. (for example, .1.3.6.1.2.1.4.3)
Index
The index of the SNMP object. For non-table object IDs, this is 0.
Community
Enter the Community string for the SNMP device. This string can be used to limit SNMPaccess to a device. Most devices use "public" as a community string.
Update every
Enter how frequently the monitor should check this SNMP value. The pull-down menu to theright of the entry field lets you specify time increments of seconds, minutes, hours, or days.You must specify a time increment of at least 15 seconds.
Title (Optional)
Enter a name for this monitor. This name appears in the Name field on the monitor tablewhen you open the group's detail page. If you don't enter a name, a default name will becreated.
Advanced Options
The advanced options give you the ability to customize error and warning thresholds, or complete optionalsettings.
Disable
Check this box to temporarily disable this monitor and any associated alerts. To enable themonitor again, un-check the box.
Retry Delay
Enter the number of seconds SiteScope should wait before retrying the request. By defaultSiteScope will wait one second. It will continue to retry at the interval specified here until theTimeout threshold is met.
Timeout
Enter the total number of seconds SiteScope should wait for a successful reply.
Scaling
SiteScope User Guide
Completing the SNMP Monitor Form 120

If you choose a scaling option from the scaling pop-up menu, SiteScope will divide thereturned value by this factor before displaying it. Alternatively, you may specify a factor bywhich the value should be divided in the text entry field to the right of the pop-up menu.
Match Content
Use this field to match against an SNMP value, using a string or a regular expression orXML names.
Units
Enter an optional units string to append when displaying the value of this counter.
Measure as Delta
Click this box to have SiteScope report the measurement as the difference between thecurrent value and the previous value.
Measure as Rate per Second
Click this box to have SiteScope divide the measurement by the number of seconds since thelast measurement.
Percentage Base
Enter a number or SNMP object ID in this field. If entered, the measurement will be dividedby this value to calculate a percentage. If an object ID if entered the Index from above will beused
Measure Base as Delta
Check this box to have SiteScope calculate the Percentage Base as the difference between thecurrent base and the previous base. Use this option when an SNMP object ID is used forPercentage Base and the object is not a fixed value.
Gauge Maximum
Enter a maximum value that should be used to create the SiteScope gauge display for thisobject ID.
Verify Error
Check this box if you want SiteScope to automatically run this monitor again if it detects anerror.
Update Every (on error)
This options allows you to set a new monitoring interval for monitors that have registered anerror condition. For example, you may want SiteScope to monitor this item every 10 minutesnormally, but as often as every 2 minutes if an error has been detected. Note that thisincreased scheduling will also affect the number of alerts generated by this monitor.
SiteScope User Guide
Advanced Options 121
Schedule (Optional)
By default, SiteScope's monitors are enabled every day of the week. You may, however,schedule your monitors to run only on certain days or on a fixed schedule. Choose theEdit schedule link to create or edit a monitor schedule. For information about creatingschedules, read these instructions.
Monitor Description (Optional)
Enter additional information about this monitor. The description will appear on the MonitorDetail page.
Report Description (Optional)
Enter a description for this monitor that will make it easier to understand what this monitordoes. The description will appear on Management Reports and on the info pop-up for amonitor.
List Order (Optional)
By default, new monitors are listed last on the Monitor Detail page. You may use thispull-down menu to choose a different placement for this monitor.
Error if
By default, SiteScope generates an error if the returned status is anything other than 'ok'.You may choose to have SiteScope generate an error based on the SNMP value returned.Enter a comparison value and use the comparison operator pop-up to specify an errorthreshold such as: >= (greater than or equal to), != (not equal to), or < (less than).
Warning if
By default, SiteScope does not generate warnings for SNMP monitors. You may choose tohave SiteScope generate an error based on the SNMP value returned.
Good if
SiteScope reports a good status if the reading returned is "OK". You can change this to bebased upon a specific value or a content match.
SiteScope User Guide
Advanced Options 122
URL Monitor
The SiteScope URL Monitor is one of the most versatile and powerful Web monitoring tools available toWebmasters. Its core function is to attempt to reach a specified Web page to verify that it can be retrieved,but it can also be used to do the following:
• Check secure pages using SSL, 128 bit SSL, and client certificates• Check for specific content on the retrieved Web page• Check the Web page for change• Check for specific error messages• Check the Web page for a value• Retrieve detailed download information• Check XML
When the URL Monitor retrieves a Web page, it retrieves the page's contents. A successful page retrievalassures you that your Web server is functioning properly. The URL Monitor doesn't automatically retrieveany objects linked from the page, such as images or frames. You can, however, instruct SiteScope to retrievethe images on the page by selecting the Retrieve Images or Retrieve Frames box located in the AdvancedOptions section of the Add Url Monitor Form.
In addition to retrieving specific Web pages, the URL Monitor can help you verify that CGI scripts andback-end databases are functioning properly. Just input the complete URL used to retrieve data from yourdatabase or trigger one of your CGI scripts, and the URL monitor will verify that the script generates a pageand returns it to the user. For example, you can verify that your visitors are receiving a thank you page whenthey purchase something off of your site. The URL monitor's string matching capability even allows you toverify that the contents of the page are correct.
Each time the URL Monitor runs, it returns a reading or status and writes it in the monitoring log file. It alsowrites in the log file the total time it takes to receive the designated document. This status value is alsodisplayed in the SiteScope Monitor tables and is included as part of alert messages sent via e-mail.
Usage Guidelines
Why should I use this monitor?
The SiteScope URL Monitors provide you with end-to-end verification that your web server is running,serving pages correctly, and doing so in a timely manner. Because it tests end-to-end, it is also able todetermine whether back-end databases are available, verify the content of dynamically generated pages,check for changed content, and look for specific values from a page.
What should I monitor?
We suggest that you create URL monitors to watch pages that are critical to your web site (such as your home
URL Monitor 123
page), pages that are generated dynamically, and pages that depend upon other applications to work correctly(such as pages that utilize a back-end database). Your goal is to monitor a sampling of every type of page youserve to ensure that everything is working properly. There's no need to verify that every page of a particulartype is working correctly -- one or two will do.
When you're choosing which pages to monitor, try to pick pages with the lowest overhead. For example, ifyou have several page that are generated by another application, monitor the shortest one with the fewestgraphics. This will put less load on your server while still providing you with the information you need.
How should I schedule my monitors?
Each URL Monitor puts no more load on your server than someone accessing your site and retrieving a page,so in most cases you can schedule them as closely together as you like. Keep in mind that the length of timebetween each run of a monitor is equal to the amount of time that can elapse before you're notified of apossible problem.
A common strategy is to schedule monitors for very critical pages to run every 1 to 2 minutes, and thenschedule monitors for less critical pages to run only every 10 minutes or so. Using this strategy, you'll benotified immediately if a critical page goes down or if the entire web site goes down, but you won't have anexcessive number of monitors running all the time.
Status
The status reading shows the the most recent result for the monitor. This status value is displayed in the URLGroup table within SiteScope. It is also recorded in the SiteScope log files, e-mail alert messages, and can betransmitted as a pager alert. The possible status values are:
• OK• unknown host name• unable to reach server• unable to connect to server• timed out reading• content match error• document moved• unauthorized• forbidden• not found• proxy authentication required• server error• not implemented• server busy
The status is logged as either good, warning, or error. A warning status or error status is returned if thecurrent value of the monitor is a condition that you have defined as other than OK. If you would like forSiteScope to send a notification if a warning or an error status is returned, create an alert. An alert containsinstructions that tell SiteScope to either notify you via e-mail, pager, or SNMP trap. An alert can also be usedto have SiteScope trigger the execution of an automatic recovery script when a problem is detected.
SiteScope User Guide
Usage Guidelines 124
Completing the URL Monitor Form
To display the URL Monitor Form, either click the name of an existing URL Monitor in a monitor table, orclick the "Add a new Monitor to this Group" link on a group's detail page and choose the "Add URLMonitor" link.
Complete the fields on the URL Monitor form as follows. When all the fields are complete, click the"Add Monitor" button.
URL
Enter the URL that you want to monitor (for example, http://demo.freshtech.com).
for NT Installations only:
If the URL starts with HTTPS, then a secure connection will be made using SSL (forexample, https://www.freshtech.com). SiteScope for NT uses the SSL library fromInternet Explorer. To monitor using SSL, installing Internet Explorer 4.0 or later is recommended. To monitor sites that require 128-bit SSL, the 128-bit patch to Internet Explorer mustbe installed. To monitor sites that require client certificates, the client certificate must be installedinto Internet Explorer.
Match Content
Enter a string of text to check for in the returned page or frameset. If the text is not containedin the page, the monitor will display "no match on content". The search is case sensitive.Remember that HTML tags are part of a text document, so include the HTML tags if they arepart of the text you are searching for (for example, "< B> Hello< /B> World"). This worksfor XML pages as well. You may also perform a Perl regular expression match by enclosingthe string in forward slashes, with an "i" after the trailing slash indicating case-insensitivematching. (for example, "/href=Doc\d+\.html/" or "/href=doc\d+\.html/i"). If you want aparticular piece of text to be saved and displayed as part of the status, use parentheses in aPerl regular expression. For example /Temperature: (\d+). This would return the temperatureas it appears on the page and this could be used when setting an Error if or Warning ifthreshold.
Update every
Enter how frequently the monitor should check this URL. The pull-down menu to the right ofthe entry field lets you specify time increments of seconds, minutes, hours, or days. Youmust specify a time increment of at least 15 seconds.
Title (Optional)
SiteScope User Guide
Completing the URL Monitor Form 125
Enter a name for this monitor. This name appears in the Name field on the monitor tablewhen you open the group's detail page. If you don't enter a name, a default name will becreated.
Advanced Options
The advanced options give you the ability to customize error and warning thresholds, or define other optionalsettings. These includes:
Disable
Check this box to temporarily disable this monitor and any associated alerts. To enable themonitor again, un-check the box.
Timeout
The number of seconds that the URL monitor should wait for a page to completedownloading before timing-out. Once this time period passes, the URL monitor will log anerror and report an error status. If you have checked the Retrieve Frames or Retrieve Imagesoption, SiteScope will wait for these items to be retrieved before considering the page to befully downloaded.
HTTP Proxy
Optionally, a proxy server can be used to access the URL. Enter the domain name and port ofan HTTP Proxy Server.
Retrieve Images
Check this box if you want the status and response time statistics to include the retrievaltimes for all of the embedded images in the page. Embedded images include those referencedby "IMG" and "INPUT TYPE=IMAGE" HTML tags. Images that appear more than once in apage are only retrieved once.
Retrieve Frames
Check this box if you want SiteScope to retrieve the all frames references in a frameset andcount their retrieval time in the total time to download this page. If Retrieve Images is alsochecked, SiteScope will attempt to retrieve all images in all frames.
Error If Match
Enter a string of text to check for in the returned page or frameset. If the text is contained inthe page, the monitor will display "no match on content". The search is case sensitive.Remember that HTML tags are part of a text document, so include the HTML tags if they are
SiteScope User Guide
Completing the URL Monitor Form 126

part of the text you are searching for (for example, "< B> Error < /B> Message"). You mayalso perform a Perl regular expression match by enclosing the string in forward slashes, withan "i" after the trailing slash indicating case-insensitive matching. (for example,"/href=Doc\d+\.html/" or "/href=doc\d+\.html/i").
Check for Content Changes
Unless this is set to "no content checking" (the default) SiteScope will record a checksum ofthe document the first time the monitor runs and then does a checksum comparison eachsubsequent time it runs. If the checksum changes, the monitor will have a status of "contentchanged error" and go into error. If you want to check for content changes, you'll usuallywant to use "compare to saved contents".
The options for this setting are: no content checking - (default) SiteScope doesn't check for content changes compare to last contents - The new checksum will be recorded as the default after the initialerror "content changed error" occurs, so the monitor will return to OK until the checksumchanges again compare to saved contents - The checksum is a snapshot of a given page (retrieved eitherduring the initial or a specific run of the monitor). If the contents change, the monitor will geta "content changed error" and will stay in error until the contents return to the originalcontents, or the snapshot is update by resetting the saved contents reset saved contents - Takes a new snapshot of the page and saves the resulting checksumon the first monitor run after this option is chosen. After taking the snapshot, the monitor willrevert to "compare to saved contents" mode.
Authorization User Name
If the URL specified requires a name and password for access, enter the name in this field.
Authorization Password
If the URL specified requires a name and password for access, enter the password in thisfield.
NT Challenge Response
Check this box if you want SiteScope to use Window's NT Challenge Responseauthorization when retrieving this Web page.
Proxy Server User Name
If the proxy server requires a name and password to access the URL, enter the name here.Technical note: your proxy server must support Proxy-Authenticate for these options tofunction.
Proxy Server Password
SiteScope User Guide
Advanced Options 127
If the proxy server requires a name and password to access the URL, enter the passwordhere. Technical note: your proxy server must support Proxy-Authenticate for these options tofunction.
POST Data
If the URL is for a POST request, enter the post variables, one per line as name=value pairs.This option is used to verify that a form is working correctly by performing the same requestthat occurs when a user submits a form. See also the Match Content field for a way to verifythat the correct form response was received. If this field is blank, a GET request is performed.
Advanced Option: The POST Data can be used to send cookie data. To send cookies with therequest use the format "Set-cookie: cookieName=cookieValue". To change the content type of a post, use the format "Content-Type: application/my-format".
Error If Redirected
Check this box if you want SiteScope to notify you if a URL is redirected. Normally,SiteScope follows redirects.
Show Detailed Measurement
Check this box if you want SiteScope to record a detailed break down of the process timesinvolved in retrieving the requested URL. This includes DNS lookup, connect time, HTTPserver reponse time, etc.
Verify Error
Check this box to have SiteScope verify an error by immediately performing the check again.
Show Detailed Measurements
Check this box if you would like for SiteScope to report detailed measurement times forDNS lookup, connecting, server response, and downloading. These measurements areavailable in both the log file and reports.
Verify Error
Check this box if you want SiteScope to automatically run this monitor again if it detects anerror.
Update Every (on error)
This option allows you to set a new monitoring interval for monitors that have registered an
SiteScope User Guide
Advanced Options 128
error condition. For example, you may want SiteScope to monitor this item every 10 minutesnormally, but as often as every 2 minutes if an error has been detected. Note that thisincreased scheduling will also affect the number of alerts generated by this monitor.
Schedule (Optional)
By default, SiteScope's monitors are enabled every day of the week. You may, however,schedule your monitors to run only on certain days or on a fixed schedule. Choose theEdit schedule link to create or edit a monitor schedule. For information about creatingschedules, read these instructions.
Monitor Description (Optional)
Enter additional information about this monitor. The description will appear on the MonitorDetail page.
Report Description (Optional)
Enter a description for this monitor that will make it easier to understand what this monitordoes. The description will appear on Management Reports and on the info pop-up for amonitor.
List Order (Optional)
By default, new monitors are listed last on the Monitor Detail page. You may use thispull-down menu to choose a different placement for this monitor.
Error if
By default, SiteScope generates an error if the returned HTTP status is anything other than200 ("OK"), which indicates a successful retrieval. You can choose to have SiteScope reportan error status based on any of the following measurements: round trip time - the total time for the entire request, in milliseconds DNS time - the amount of time to translate the host name to an IP adress, in milliseconds connect time - the amount of time to make the connection, in milliseconds response time - the amount of time before the first response was received, in milliseconds download time - the amount of time to receive the page contents, in milliseconds age -- the amount of time between the current time and the last-modified time for the page, inseconds content match total errors overall status Choose a comparison operator from the pop-up menu, and enter a value for the comparisonin the text field.The URL Monitor follows HTTP redirect codes (301 and 302) to retrieve the actual pagebefore returning the status of the URL retrieval. SiteScope will show a redirect error only ifthe redirects are more than 10 levels deep - this prevents infinite redirects from beingfollowed, or if the Error On Redirect checkbox is selected.
SiteScope User Guide
Advanced Options 129
Warning if
By default, SiteScope generates a warning if Check Images or Check Frames is chosen andthere was a problem retrieving one of the images or frames. You may choose to have themonitor report a warning status based on any of the measurement options listed under Errorif. Choose a comparision operator, and enter a value for the comparison to generate awarning.
Good if:
By default, SiteScope reports an OK status if the URL returns an HTTP status of 200("OK"). You may also choose to have SiteScope base an OK status on any of themeasurement options listed under Error if. Enter the value that should generate an OK status.
SiteScope User Guide
Advanced Options 130
URL Content Monitor
The SiteScope URL Content Monitor is a specialized variation of the URL Monitor that can match up to tendifferent values from the content of a specified URL. The matched values are displayed with the status of themonitor in the monitor group table and written to the monitor log.
The content values are matched using regular expressions.
Each time the URL Content Monitor runs, it returns a a status and several match values and writes them inthe monitoring log file. It also writes the total time it takes to receive the designated document in the log file.
Usage Guidelines
Why should I use this monitor?
You should use the URL Content Monitor if you need to verify multiple values (up to 10 variables) from thecontent of a single URL. Otherwise, the standard URL Monitor is normally used. One use of this monitor isto integrate SiteScope with other applications that export numeric data through a web page. The monitorincludes the matched values as part of the monitor status which are written to the log. If the matched valuesare numeric data, the results can be plotted in a management report.
What should I monitor?
The URL Content Monitor is primarily used to monitor web pages that are generated dynamically and displaystatistics about custom applications. By monitoring these pages, these statistics can be retrieved andintegrated into the rest of your SiteScope system.
How should I schedule my monitors?
The frequency will depend on the statistics being monitored. For more statistics, every several minutes isoften enough.
Status
The reading is the current value of the monitor. Possible values are:
• OK• unknown host name• unable to reach server• unable to connect to server• timed out reading• content match error
URL Content Monitor 131

• document moved• unauthorized• forbidden• not found• proxy authentication required• server error• not implemented• server busy
The status is returned as good, warning, or error dependent on the results of the retrieval, content match, andthe error or warning status criteria that you select.
Completing the URL Content Monitor Form
To display the URL Monitor Form, either click the name of an existing URL Content Monitor in a monitortable, or click the "Add a new Monitor to this Group" link on a group's detail page and choose the "AddURL Content Monitor" link.
Complete the fields on the URL Content Monitor form as follows. When all the fields are complete, click the"Add Monitor" button.
URL
Enter the URL that you want to monitor (for example, http://demo.freshtech.com). If you aremonitoring a secure URL, be sure the URL reflects the correct transfer protocol (for examplehttps://demo.freshtech.com).
Match Content
Enter an expression describing the values to match in the returned page. If the expression isnot contained in the page, the monitor will display "no match on content". A regularexpression is used to define the values to match. For example, the expression /Copyright(\d*)-(\d*)/ would match two values, 1996 and 1998, from a page that contained the stringCopyright 1996-1998
Update every
Enter how frequently the monitor should check this URL. The pull-down menu to the right ofthe entry field lets you specify time increments of seconds, minutes, hours, or days. Youmust specify a time increment of at least 15 seconds.
Title (Optional)
Enter a name for this monitor. This name appears in the Name field on the monitor tablewhen you open the group's detail page. If you don't enter a name, a default name will becreated.
SiteScope User Guide
Status 132
Advanced Options
The advanced options give you the ability to customize error and warning thresholds, or complete optionalsettings.
Disable
Check this box to temporarily disable this monitor and any associated alerts. To enable themonitor again, un-check the box.
Timeout
The number of seconds that the URL monitor should wait for a page to begin downloadingbefore timing-out. Once this time period passes, the URL monitor will log an error and reportan error status.
HTTP Proxy
Optionally, a proxy server can be used to access the URL. Enter the domain name and port ofan HTTP Proxy Server.
Retrieve Images
Check this box if you want the status and response time statistics to include the retrievaltimes for all of the embedded images in the page. Embedded images include those referencedby "IMG" and "INPUT TYPE=IMAGE" HTML tags.
Retrieve Frames
Check this box if you want SiteScope to retrieve the frames in a frameset and count theirretrieval time in the total time to download this page.
Error If Match
Enter a string of text to check for in the returned page. If the text is contained in the page, themonitor will display "no match on content". The search is case sensitive. Remember thatHTML tags are part of a text document, so include the HTML tags if they are part of the textyou are searching for (for example, "< B> Error < /B> Message"). You may also perform aPerl regular expression match by enclosing the string in forward slashes, with an "i" after thetrailing slash indicating case-insensitive matching. (for example, "/href=Doc\d+\.html/" or"/href=doc\d+\.html/i").
Check for Content Changes
Check this box if you want SiteScope to notify you if the contents of this document arechanged. SiteScope records a checksum of the document the first time the monitor runs andthen does a checksum each subsequent time it runs. If the checksum changes, you will benotified. The new checksum will be recorded as the default after the initial error has been
SiteScope User Guide
Advanced Options 133

issued.
Authorization User Name
If the URL specified requires a name and password for access, enter the name in this field.
Authorization Password
If the URL specified requires a name and password for access, enter the password in thisfield.
NT Challenge Response
Check this box if you want SiteScope to use Window's NT Challenge Responseauthorization when retrieving this Web page.
Proxy Server User Name
If the proxy server requires a name and password to access the URL, enter the name here.Technical note: your proxy server must support Proxy-Authenticate for these options tofunction.
Proxy Server Password
If the proxy server requires a name and password to access the URL, enter the passwordhere. Technical note: your proxy server must support Proxy-Authenticate for these options tofunction.
Error On Redirect
Check this box if you want SiteScope to notify you if a URL is redirected. Normally,SiteScope follows redirects.
POST Data
If the URL is for a POST request, enter the post variables, one per line as name=value pairs.This option is used to verify that a form is working correctly by performing the same requestthat occurs when a user submits a form. See also the Match Content field for a way to verifythat the correct form response was received. If this field is blank, a GET request isperformed. Advanced: This field can also be used to pass cookies with the request. For example,"Set-cookie: cookieName=cookieValue".
Verify Error
Check this box if you want SiteScope to automatically run this monitor again if it detects anerror.
Update Every (on error)
This options allows you to set a new monitoring interval for monitors that have registered an
SiteScope User Guide
Advanced Options 134
error condition. For example, you may want SiteScope to monitor this item every 10 minutesnormally, but as often as every 2 minutes if an error has been detected. Note that thisincreased scheduling will also affect the number of alerts generated by this monitor.
Schedule (Optional)
By default, SiteScope's monitors are enabled every day of the week. You may, however,schedule your monitors to run only on certain days or on a fixed schedule. Choose theEdit schedule link to create or edit a monitor schedule. For information about creatingschedules, read these instructions.
Monitor Description (Optional)
Enter additional information about this monitor. The description will appear on the MonitorDetail page.
Report Description (Optional)
Enter a description for this monitor that will make it easier to understand what this monitordoes. The description will appear on Management Reports and on the info pop-up for amonitor.
List Order (Optional)
By default, new monitors are listed last on the Monitor Detail page. You may use thispull-down menu to choose a different placement for this monitor.
Error if
By default, SiteScope generates an error if the returned status is anything other than 200,which indicates a successful retrieval. You may choose to have SiteScope generate an errorbased on any of the following:tenth content match content match age second content match third content match fourth content match fifth content match sixth content match seventh content match eighth content match ninth content match download time connect time response time size dns time round trip time At present, content match values used for error or warning generation must be numeric. The URL Content Monitor follows redirect codes (301 and 302) to retrieve the actual page
SiteScope User Guide
Advanced Options 135

before returning the status of the URL retrieval. SiteScope will show a redirect error only ifthe redirects are more than 10 levels deep - this prevents infinite redirects from beingfollowed, or if the Error On Redirect checkbox is selected..
Warning if
By default, SiteScope does not generate warnings for URL Content monitors. You maychoose to generate a warning based any of the options listed under Error if. Enter the lowestvalue that should generate a warning.
Good if
By default, SiteScope returns an OK status if a 200 status is returned, but you may choose tobase an ok status on any of the options listed under Error if. Enter the value that SiteScopeshould consider to be a good response.
SiteScope User Guide
Advanced Options 136

URL List Monitor
The SiteScope URL List Monitor is used to check a large list of URLs. This monitor is commonly used byweb hosting providers to measure the availability and performance of their customer's web sites.
A URL List is specified by giving a filename containing the list of URLs to check. The URLs that you wantto monitor are saved in a plain text file. There is virtually no limit to the number that you can list though therun interval selected for the monitor may require that the number of URL's be limited. For each URLincluded in the URL list file, the monitor retrieves the contents of the URL or the server response to therequest.
Each time the URL List Monitor runs, it returns the number of errors, if any, and writes it into the monitoringlog file. It also writes the total number of URLs checked and the average time, in milliseconds, to retrieveeach URL.
Usage Guidelines
Why should I use this monitor?
The URL List Monitor is designed to allow you to check large lists of URLs without having to create aseparate URL monitor for each one. For example, this is useful if you host several web sites and simply wantto ensure that they are each serving pages properly. The URL List Monitor is not used to confirm linksbetween pages (Link Check Monitor) or other web transaction processes (URL Transaction Monitor).
What should I monitor?
The URL List Monitor is useful for monitoring any set of URL's that you simply want to make sure areavailable over the network.
How should I schedule my monitors?
This is strictly dependent upon how often to want to check to see if the URLs are working. Once an hour iscommon, but you can schedule it to run more often.
There are a few factors that affect how long it takes the URL List Monitor to complete a run: 1) number ofURLs in the list, 2) URL retrieval time, and 3) the number of threads used. In some cases this may lead to themonitor not running as expected. As an example, let's say you have a list of 200 URLs that you want tomonitor every 10 minutes, but, due to Internet traffic, SiteScope isn't able to complete checking all of the 200URLs in that amount of time. The next time the monitor was scheduled to run, SiteScope would see that ithadn't completed the previous run and would wait for another 10 minutes before trying again.
If this happens once in awhile, it's probably not a problem, but if it happens more often there are three thingsyou can do to resolve the issue.
URL List Monitor 137

1. The most obvious option is to schedule the monitor to run less frequently, but if that conflicts withsome other objective, go to options 2 and 3.
2. The second thing you can do is reduce the pause interval set under the Advanced Options. This willminimize the time it takes for the monitor to retrieve all of the URLs.
3. The third option (which you can use in conjunction with number 2) is to increase the number ofthreads that SiteScope can use when checking the URLs. The more threads, the quicker SiteScopecan check them. Of course, this will put a heavier load on your system, so you have to find a happymedium.
Ideally, you want SiteScope to have just completed checking the URLs in the list when it's time to startchecking again. This would indicate that the load was evenly balanced. It may take some tweaking to get itjust right.
Completing the URL List Monitor Form
To display the URL List Monitor Form, either click the name of an existing URL List Monitor in a monitortable, or click the "Add a new Monitor to this Group" link on a group's detail page and choose the "AddURL List Monitor" link.
Complete the fields on the URL List Monitor form as follows. When all the fields are complete, click the"Add Monitor" button.
URL List Name
Enter the path name for the file containing the list of URLs to be monitored. This file shouldbe a plain text file and contain only one URL per line of text as shown here: http://www.website.com/index.htmlhttp://www.website.com/main/customer/order.htmlhttp://www.website.net/default.htmhttp://www.webpages.com/tech/support/ws/intro.html
Update every
Enter how frequently the monitor should check this URL. The pull-down menu to the right ofthe entry field lets you specify time increments of seconds, minutes, hours, or days. Youmust specify a time increment of at least 15 seconds.
Title (Optional)
Enter a name for this monitor. This name appears in the Name field on the monitor tablewhen you open the group's detail page. If you don't enter a name, a default name will becreated.
SiteScope User Guide
Usage Guidelines 138

Advanced Options
The advanced options give you the ability to customize error and warning thresholds, or complete optionalsettings.
Disable
Check this box to temporarily disable this monitor and any associated alerts. To enable themonitor again, un-check the box.
Server
Enter the optional Server name to specify which URLs to check in the URL list. If the URLsare stored in a "map" format, this field is used to check a subset of the URLs from the list. Bydefault, all the URLs in the list are checked.
Log
Enter the path name for the log file for this monitor. For each URL checked, an entry will beadded to this log file. If this field is blank, a log is not created.
Error Log
Enter the path name for the error log file for this monitor. For each error retrieving a URL, anentry will be added to this log file. If this field is blank, a log is not created.
Threads
Enter the number of threads to retrieve URLs. This is the number of simultaneous checks toperform. Increasing this number will shorten the time for all of the URLs to be checked butalso increase the load on the server.
Pause
Enter the pause, in milliseconds, between each URL check. Decreasing this number willshorten the total time required to check all of the URLs but will also increase the load on theserver.
Retries Enter the number of times you want SiteScope to try to reach URLs that are returning anerror.
HTTP Proxy
Optionally, a proxy server can be used to access the URLs in the list. Enter the domain nameand port of an HTTP Proxy Server.
Authorization User Name
SiteScope User Guide
Advanced Options 139

If the URLs in the list require a name and password for access, enter the name in this field.
Authorization Password
If the URLs in the list require a name and password for access, enter the password in thisfield.
Verify Error
Check this box if you want SiteScope to automatically run this monitor again if it detects anerror.
Update Every (on error)
This options allows you to set a new monitoring interval for monitors that have registered anerror condition. For example, you may want SiteScope to monitor this item every 10 minutesnormally, but as often as every 2 minutes if an error has been detected. Note that thisincreased scheduling will also affect the number of alerts generated by this monitor.
Schedule (Optional)
By default, SiteScope's monitors are enabled every day of the week. You may, however,schedule your monitors to run only on certain days or on a fixed schedule. Choose theEdit schedule link to create or edit a monitor schedule. For information about creatingschedules, read these instructions.
Monitor Description (Optional)
Enter additional information about this monitor. The description will appear on the MonitorDetail page.
Report Description (Optional)
Enter a description for this monitor that will make it easier to understand what this monitordoes. The description will appear on Management Reports and on the info pop-up for amonitor.
List Order (Optional)
By default, new monitors are listed last on the Monitor Detail page. You may use thispull-down menu to choose a different placement for this monitor.
Error if
By default, SiteScope generates an error if any of the URLs cannot be successfully retrieved.You may choose to have SiteScope generate an error based on the number of URL errors, thenumber of URLs checked, or the average retrieval time. Enter a comparison value and usethe comparison operator pop-up to specify an error threshold such as: >= (greater than orequal to), != (not equal to), or < (less than).
Warning if
SiteScope User Guide
Advanced Options 140

By default, SiteScope does not generate warnings for URL List Monitors. You may chooseto have SiteScope generate an error based on the number of URL errors, the number of URLschecked, or the average retrieval time.
Good if
You can use this option to change how SiteScope generates a good status. You can choose tohave this based upon duration, number of URLs left to check, or errors.
SiteScope User Guide
Advanced Options 141

URL Transaction Monitor
The SiteScope URL Transaction Monitor simulates a user's visit session across several pages. This isparticularly useful for monitoring and testing multi-page e-commerce transactions and other interactiveonline applications. For example, you can instruct SiteScope retrieve a log-in page, enter an account name viaa secure web form, check an account status for the page that is returned, and then follow a sequence of linksthrough several more pages. URL Transaction Monitors are also very useful for checking pages that includedynamically generated information, such as session IDs, that are embedded in the web pages via dynamiclinks or hidden input fields.
A URL transaction begins with a specific URL acting as the starting point for the transaction. This can thenbe followed by additional URLs, or more commonly, links or form buttons that a user would be required toselect in order to complete a specific transaction. By default, SiteScope allows you to define up to twentytransaction steps. For each step you may specify a content match or error string to search for, enter a username and password if required, define custom POST data, as well as other optional criteria for that step.
Each time the URL Transaction Monitor runs it returns a reading and a status and writes them in themonitoring log file. SiteScope also writes the total round-trip time time for the transaction sequence as wellas a break down of individual times for each step into the log file.
Usage Guidelines
Why should I use this monitor?
URL Transaction Monitors provide you with end-to-end verification that multiple-page transactions areworking properly. This is especially important for e-commerce sites and sites that give users the ability tocomplete forms, etc. on-line. The URL Transaction Monitor Tool allows you to see what is returned at everystep of a transaction, making trouble-shooting easier to complete.
What should I monitor?
You should monitor any multi-step transaction system that you have made available to general users becauseyou are much less likely to hear about problems with these applications. Web site visitors often assume thatany problems they encounter are due to user error rather than system error, especially if they're not familiarwith your application. By using this monitor to perform transaction testing, you'll be certain that users areable to successfully complete transactions on your site.
How should I schedule my monitors?
The general rule of thumb is to run these monitors every 10 minutes or so. If you have a very criticaltransaction process, you may want to run them more often.
URL Transaction Monitor 142
Status
The reading is the current value of the monitor. Possible status values include:
• OK• unknown host name• unable to reach server• unable to connect to server• timed out reading• content match error• document moved• unauthorized• forbidden• not found• proxy authentication required• server error• not implemented• server busy
If the status returned is good or OK, the total time for the transaction, the number of steps completed, and anindication of the data transfered will be displayed. If an error is returned during the transaction, the URL inthe sequence where the problem occurred is listed as part of the reading.
The status is logged as either good or error. An error status is returned if the current value of the monitor isanything other than OK. If you would like for SiteScope to respond if an error status is returned, create analert. An alert contains instructions that tell SiteScope to either notify you via e-mail, pager, or SNMP trap, orexecute an automatic recovery script when a problem is detected.
Using the Add URL Transaction Wizard
The Add URL Transaction Wizard enables you to quickly and easily create a URL Transaction Monitor. Thewizard automatically opens when you choose the Add URL Transaction Monitor link on the SiteScopeAdd Monitor page. It guides you through creating and testing a URL Transaction Monitor. When you arefinished, click the Add Monitor button to exit the wizard and add the new monitor to SiteScope.
Beginning a new transaction monitor
1. Enter the starting URL for the transaction in the Other text box under the Enter the initial URLaddress selection button box for Step 1.
2. Use the Update Every options to specify how often you want SiteScope to run this monitor.3. Type a descriptive title in the Title text entry box.4. Click the Add Step button.
The URL Transaction Wizard form will refresh, showing whether or not SiteScope was able to complete the
SiteScope User Guide
Status 143

first step of the transaction. The Step and its related action or URL is displayed in a list form at the top of theform. The HTTP response header and the content of the URL are appended to the bottom of the page. IfSiteScope was unable to complete the step, an error screen will be displayed with information about the error.Click the Back button in the browser window to return to the first step form. Check the form for errors, makecorrections as needed, and then click the Add Step button to continue.
Note: Using the Back 1 step button causes SiteScope to reset all information for the current steps, allowingyou to start over from the last successful step. Do not use this button as a method to view previouslysuccessful steps.
If the first page of this transaction requires that a User ID and Password be entered, or if you would like tocheck for specific content on this page, scroll down to the Advanced Options section of the wizard form andenter that data in the appropriate fields. Read more about how to complete these fields in the next section,titled Completing the URL Transaction Monitor Form.
When you have filled in the necessary information to complete the first step of the transaction, click on theAdd Step button in the upper portion of the form. SiteScope will run the monitor to check the step definedand then display the the form for adding the next step to the transaction.
Defining the next steps of the transaction
When you've completed the first step successfully, you're ready to move on to the subsequent steps. The AddURL Transaction Wizard makes this easy by automatically showing you the available links, form elements,frames, and other references on the current page of the transaction. You will use the Wizard to create eachsubsequent transaction step separately, telling SiteScope whether the next step is to choose a link on thecurrent page, select a form button, or retrieve a new URL. The following sections tell you how to use thewizard to instruct SiteScope to do any one of these actions.
The figure below is an interactive example of the upper portion of the URL Transaction Wizard page. This isa hypothetical example created to illustrate how the all of the different transaction elements are presented bythe URL Transaction Wizard. The HTML FORM elements on this help page simulate the interaction of theactual Transaction Wizard page within SiteScope.
Add URL Transaction Monitor (example)
Step 1 url http://www.freshwater.com/
ok, 0.14 sec
Step 2 Select which option to use for the next step in the transaction
Link: Freshwater's Internet Remote Managed Servicesover 1800 othersInside Info:Monitoring Inside the FirewallDeep Monitoring Prevents False PositivesUnderstandYour Site From the OutsideDowntime = LostRevenueHOMEORDERPRODUCTSSUPPORTABOUT
SiteScope User Guide
Beginning a new transaction monitor 144

USindex.htmaboutus.htmOrderOptions.htmdownload.htmSiteSeerForm.htmSiteSeerForm.htmSiteScope.htmSiteSeer.htmSiteReliance.htmsupport.htm
This is a list of available links on this page
Form: {[1]/index-cgi/ice-form.pl}Search {[2]/index-cgi/login-form.pl}Member Login
This is a list of available Submit buttons on this page, the format is {FormName}ButtonName
{[1]/index-cgi/ice-form.pl}KEYWORDS= {[1]/index-cgi/ice-form.pl}DAYS={[1]/index-cgi/ice-form.pl}THESAURUS={[1]/index-cgi/ice-form.pl}SUBSTRING=substring{[1]/index-cgi/ice-form.pl}CONTEXT=Search in all documents{[2]/index-cgi/login-form.pl}USERNAME={[2]/index-cgi/login-form.pl}PASSWORD=
This is a list of available input items on this page, the format is {FormName}InputName
Frame: leftframetopframemainframe
This is a list of available frames on this page
Refresh: 5; url=Progress.html
This is a list of available meta refresh items on this page
URL: Enter URL in "Other" Field below.
Example: http://demo.freshtech.com
Other:
Select desired radio button and enter field here
Next step: Select a link
SiteScope parses the content of the URL in the current step and creates a list of hyperlinks that are found.This includes links that are part of an image map. Any links found on this page of the transaction can bedisplayed in the drop-down menu box to the right of the "Link" radio selection button. Use the followingsteps to add a link step to the transaction:
1. Click the round selection button to the left of the list of links.2. Click the arrow on the right of the box to display all available links and then click the link that you
want SiteScope to follow. If you know a link is available on the subject page but it doesn't appear inthe drop-down menu, see the note below on client-side programs.
3. (Optional) See the Advanced Options for the step you're currently defining and enter any stringmatch or user name and password information you'd like SiteScope to use.
4. Click the Add Step button to move to the next step.
Next step: Select a form button
SiteScope User Guide
Add URL Transaction Monitor (example) 145
SiteScope parses the content of the URL in the current step and creates a list of form elements of the type"Submit". If SiteScope finds any HTML forms on the current page of the transaction, they will be displayedin a drop-down menu.
The listings are in the following format:{[formNumber]FormName}ButtonName
For example, the Search button on a company's search page might be listed as:{[1]http://www.CompanyName.com/bin/search}search
1. Click the round selection button to the left of the list of submit buttons.2. Click the arrow on the right of the box to display all of the available form buttons and then click the
one that you want SiteScope to select. If you know a form is available on the subject page but itdoesn't appear in the drop-down menu, see the note below on client-side programs.
3. Directly below the list of submit buttons is a box that contains a listing of all of the input itemsavailable for this page. Locate the one(s) that pertain to the submit button you selected and type theappropriate post data after the = sign. You may need to run through the transaction in a separatebrowser window to determine the format and expected values for the post data.
4. (Optional) See the Advanced Options for the step you're currently defining and enter any stringmatch or user name and password information you'd like SiteScope to use.
5. Click the Add Step button to move to the next step.
Next step: Select a Frame
Complete the following steps if the intial URL for this transaction contains a FRAMESET and you need toaccess a page displayed in one of the frames to proceed with the transaction.
1. Click the round selection button to the left of the Frame text entry box.2. Click the arrow on the right of the box to display all available filenames displayed in the current
FRAMESET and then click the file that you want SiteScope to retrieve.
Next step: META Refresh
If the page for this step of the transaction is controlled by a <META HTTP-EQUIV="Refresh"CONTENT="timedelay; URL=filename.htm"> tag, you can instruct SiteScope to retrieve the specified file asthe next step.
1. Click the round selection button to the left of the Refresh text entry box.2. Click the arrow on the right of the box to display all available Refresh filenames and then click the
file that you want SiteScope to retrieve.
Next step: Go to another URL
Complete the following steps if you want SiteScope to go to another URL.
SiteScope User Guide
Add URL Transaction Monitor (example) 146
1. Click the round selection button to the left of the URL text entry box.2. Type the URL you'd like SiteScope to go to in the text entry box which contains http://.3. See the Advanced Options for the step you're currently defining and enter any string match or user
name and password information you'd like SiteScope to use.4. Click the Add Step button to move to the next step.
Note:
SiteScope does not parse or interpret embedded scripts or other client-side program code.Web page content that is generated or controlled by client-side code will usually not appearin the URL Transaction Wizard. See the URL Transactions and Client-side Programs helppage for more information on dealing with web page scripts. The following entry fields are also included on the form:
Update every:
Within the Add URL Transaction Wizard, only the value entered for the final step of thetransaction is remembered. The value is applied to the entire monitor.
Title
Enter the text for the title of this monitor that will be displayed in the SiteScope MonitorDetail Table. Within the Add URL Transaction Wizard, only the value entered for the finalstep of the transaction is remembered. You can change the title after adding the monitor viathe Edit URL Transaction feature.
Advanced Options
The advanced options give you the ability to customize error and warning thresholds, or complete optionalsettings. These settings are displayed for each step that is defined in the transaction. This allows you to makechanges to match content expressions or POST data on previous steps if the request did not return the resultthat you wanted.
Disable
Check this box to temporarily disable this monitor and any associated alerts. To enable themonitor again, un-check the box.
Like the transaction step type-reference pairs displayed in the upper portion of the form, the AdvancedOptions section displays the list of options for each step. Each step includes:
1. Step n POST Data2. Step n Match Content3. Step n Error If Match4. Step n User Name
SiteScope User Guide
Add URL Transaction Monitor (example) 147
5. Step n Password6. Step n Delay7. Step n Title
The following describes these options:
Step n POST Data:
If the URL at this step is for a POST request, enter the post variables, one per line asname=value pairs. This option is used to verify that a form is working correctly byperforming the same request that occurs when a user submits a form. This field is mostcommonly used with the Form Reference Type. When the form is submitted, SiteScope fillsin any fields that aren't specified with data here with the same defaults as a browser wouldhave chosen.
Step n Match Content:
Enter a string of text to check for in the returned page for this step. If the text is not containedin the page, the monitor will display no match on content for this step's URL. The search iscase sensitive. Remember that HTML tags are part of a text document, so include the HTMLtags if they are part of the text you are searching for (for example, "<B> Hello</B> World").You may also perform a Perl regular expression match by enclosing the string in forwardslashes, with an i after the trailing slash indicating case-insensitive matching. (for example,/href=Doc\d+\.html/ or /href=doc\d+\.html/i).
Step n Error If Match:
Enter a string of text to check for in the returned page for this step. If the text is contained inthe page, the monitor will display no match on content for this step's URL. The search iscase sensitive. Remember that HTML tags are part of a text document, so include the HTMLtags if they are part of the text you are searching for (for example, "<B> Error </B>Message"). You may also perform a Perl regular expression match by enclosing the string inforward slashes, with an i after the trailing slash indicating case-insensitive matching. (forexample, /href=Doc\d+\.html/ or /href=doc\d+\.html/i).
Step n User Name:
If the URL specified at this step requires a name and password for access, enter the name inthis field.
Step n Password:
If the URL specified at this step requires a name and password for access, enter the passwordin this field.
Step n Delay:
(Optional) Enter how long SiteScope should wait before executing the next step of thetransaction.
SiteScope User Guide
Advanced Options 148

Step n Title
(Optional) Enter the text for the title of this step within the transaction monitor. The title willonly be displayed in the Edit URL Transaction form.
The advanced options for each step of a transaction are listed in sequential groups. The following advancedoptions apply to the entire transaction.
Verify Error
Check this box if you want SiteScope to automatically run this monitor again if it detects anerror.
Update Every (on error)
This options allows you to set a new monitoring interval for monitors that have registered anerror condition. For example, you may want SiteScope to monitor this item every 10 minutesnormally, but as often as every 2 minutes if an error has been detected. Note that thisincreased scheduling will also affect the number of alerts generated by this monitor.
Schedule (Optional)
By default, SiteScope's monitors are enabled every day of the week. You may, however,schedule your monitors to run only on certain days or on a fixed schedule. Choose theEdit schedule link to create or edit a monitor schedule. For information about creatingschedules, read these instructions.
Monitor Description (Optional)
Enter additional information about this monitor. The description will appear on the MonitorDetail page.
Report Description (Optional)
Enter a description for this monitor that will make it easier to understand what this monitordoes. The description will appear on Management Reports and on the info pop-up for amonitor.
Timeout
The number of seconds that the URL Transaction Monitor should wait for the entiretransaction to complete before timing-out. Once this time period passes, the URLTransaction Monitor will log an error and report an error status.
Timeout is per Step
Check this box if you want to use the value entered for the Timeout above as the Timeout foreach step of the transaction rather than for the entire transaction. If the step takes more thanthis time to complete, the URL Transaction Monitor will log an error and report an error
SiteScope User Guide
Advanced Options 149

status.
HTTP Proxy:
Optionally, a proxy server can be used to access the URLs in the transaction. Enter thedomain name and port of an HTTP Proxy Server.
Retrieve Images:
Check this box if you want the monitor to retrieve all of the graphics embedded in the pagesof the transaction. The image retrieval time will be added to the total response time.
Retrieve Frames:
Check this box if you want the monitor to retrieve the content of all frames related to thepages of the transaction. The frame retrieval time will be added to the total response time..
Proxy Server User Name:
If the proxy server requires a name and password to access the URLs in the transaction, enterthe name here. Technical note: your proxy server must support Proxy-Authenticate for theseoptions to function.
Proxy Server Password:
If the proxy server requires a name and password to access the URLs in the transaction, enterthe password here. Technical note: your proxy server must support Proxy-Authenticate forthese options to function.
NT Challenge Response
Check this box if you want SiteScope to use Window's NT Challenge Response whenretrieving the URL in this step.
List Order (Optional)
By default, new monitors are listed last on the Monitor Detail page. You may use thispull-down menu to choose a different placement for this monitor.
Error if
By default, SiteScope generates an error if the returned status for any step is anything otherthan 200 which indicates a successful retrieval. You may choose to have SiteScope generatean error based on the round trip retrieval time. Enter the shortest retrieval time (inmilliseconds) that should generate an error. Enter a comparison value and use the comparisonoperator pop-up to specify an error threshold such as: >= (greater than or equal to), != (notequal to), or < (less than).
Warning if
By default, SiteScope does not generate warnings for URL Transaction Monitors. You may
SiteScope User Guide
Advanced Options 150

choose to generate a warning based on round trip retrieval time. Enter the shortest retrievaltime (in milliseconds) that should generate a warning.
Good if
You can base a good status on the round-trip time for any one step if you would like. Choosethe step from the drop-down menu and set the threshold.
Each time that you define a transaction step and press the Add Step button, SiteScope reruns all of thedefined steps in the transaction as well as the step you have just added.
When you have successfully defined each step in the transaction that you want SiteScope to monitor, clickthe Add Monitor button. The URL Transaction Wizard will close and the new monitor will appear on theGroup Detail page. Click the Edit button on this page to make changes to the URL Transaction Monitor.
SiteScope User Guide
Advanced Options 151

URL Transactionsand Dynamic Content
Web pages which include client-side programming or dynamically generated content can present problems inconstructing SiteScope URL Transaction monitors. Client-side programs might include Java applets, ActiveXcontrols, Javascript, or VBScript. Web pages which are generated by server-side programming (Perl/CGI,ASP, CFM, SSI, etc.) can also present a problem if link references or form attributes are changed frequently.
SiteScope does not interpret Javascript, VBScript, Java applets, or Active X Controls embedded in HTMLfiles. This may not be a problem when the functionality of the client-side program is isolated to visual effectson the page where it is embedded. Problems can arise when the client-side program code controls links toother URL's or modifies data submitted to a server-side program. Because SiteScope does not interpretclient-side programs, actions or event handlers made available by scripts or applets will be invisible to theURL Transaction Wizard.
Some websites use dynamically generated link references on pages generated by server-side programming.While these web pages do not contain client-side programs, frequently changing link references or "cookie"data can make it difficult to set up and maintain a URL Transaction Monitor.
Dynamic Content Workarounds
There are several ways to make a SiteScope URL transaction monitor perform actions controlled byclient-side programs and other dynamic content. Several of these workarounds are presented below. Theworkarounds generally require knowledge of the principles of web page construction, CGI programming,Perl-style regular expressions, and the programming used to support the web site being monitored.
Dynamic Content SiteScope Work Around
A web page contains a script which controls alink to another URL (example: onClick ="document.location='http://...)
Use a Match Content regular expression in thetransaction step for the subject page to retainthe filename.ext value from the.location="filename.ext" match pattern.The retained value can then be passed as a URLin the Other field of the next step of thetransaction.
A client-side program reformats, edits, or addsdata to a POST or GET data set collected byHTML form inputs.
Manually edit the script changes into theNAME=VALUE pairs displayed for the subjecttransaction step. This can be done in the textbox under the Form option in the URLTransaction Wizard or in the POST data box
URL Transactions and Dynamic Content 152

for the applicable step in the Edit URLTransaction form. Requires familiarity with thescript function and CGI request headers.
A client-side program generates HTML contentwhich, after interpretation by a web browser,includes HTML <A HREF=...> links.
Use a Match Content regular expression toreturn the filename.ext value from theHREF="filename.ext" pattern and pass it tothe URL field of the next transaction step.
A client-side program generates HTML contentwhich, after interpretation by a web browser,includes forms submitted to a CGI program.
Manually enter the NAME=VALUE pairs for thesubject transaction step. This can be done in thetext box under the Form option in the URLTransaction Wizard or in the POST data boxfor the applicable step in the Edit URLTransaction form. Requires familiarity with thescript, the form structure, and CGI requestheaders.
A script dynamically sets the ACTION attributeof an HTML <FORM> tag.
Manually enter the ACTION URL for the nexttransaction step. This can be done in the textbox under the URL option in the URLTransaction Wizard or in the Stepn Reference box for the applicable step in theEdit URL Transaction form. Requiresfamiliarity with the script.
The figure below illustrates several of the principles of constructing a URL Transaction Monitor usingregular expressions. The regular expressions shown in the figure can be used to extract URLs from Javascriptor other web page content. As indicated, content matches for a given step are performed on the contentreturned for that step. The parentheses used in the regular expressions cause the value matched by theexpression inside the parentheses to be remembered or retained. This retained value can be passed on to thenext step of the transaction by using the {$n} variable. Because the regular expression can contain more thanone set of parentheses, the $n represents the match value from the $nth set of parentheses. The example in thefigure only uses one set of parentheses and thus references the retained value as {$1}
SiteScope User Guide
Dynamic Content Workarounds 153

Web pages containing code that perform the following present additional challenges:
• A script parses a cookie or other dynamic content to be added to a CGI GET request.?A script is selected from a list of links based on customer action
• Link information is contained in an external script file accessed via a HTML <SCRIPTHREF="http://... > tag
Web pages with dynamically generated link and form content will probably not be parsed correctly bySiteScope URL Transaction Monitor Wizard.
SiteScope User Guide
Dynamic Content Workarounds 154

Web Server Monitor
The Web Server Monitor reports statistics about the throughput of your web server. Each time the WebServer Monitor runs, it writes the current hits per minute and bytes per minute in the~SiteScope/logs/SiteScope.log file. See the Advanced Topics section for notes on Reading Log File Data.
Usage Guidelines
Why should I use this monitor?
The information gathered by the Web Server Monitor gives you the ability to see how busy your web site is.This information allows you to plan hardware upgrades and configuration changes that will improve yourvisitors' experience.
What should I monitor?
It's most effective if you create a separate Web Server Monitor for each web server you're running. If you'rerunning multiple web servers, each one should have its own log file so that SiteScope can report on themseparately. See the notes on reading log file data for a review of what data is recorded.
How should I schedule my monitors?
The default spacing that we recommend for the Web Server Monitor is every 10 minutes, but you can run itmore or less often if you prefer.
Completing the Web Server Monitor Form
To display the Web Server Monitor Form, either click the name of an existing Web Server Monitor in amonitor table, or click the "Add a new Monitor to this Group" link on a group's detail page and choose the"Add Web Server" link.
Complete the fields on the Web Server Monitor Form as follows. When all the fields are complete, click theAdd Monitor button.
Server
Choose the server that you want to monitor. The default is to monitor web servers on theserver on which SiteScope is running. Click the choose server link to monitor web serverson another NT server.
Web Server
Choose the web server to monitor from the popup list. On Unix servers, enter the fullpathname of the web server log file.
Web Server Monitor 155
Update every
Enter how frequently the monitor should read the Web server log file. The pull-down menuto the right of the entry field lets you specify time increments of seconds, minutes, hours, ordays. You must specify a time increment of at least 15 seconds.
Title (Optional)
Enter a name for this monitor. This name appears in the Name field on the monitor tablewhen you open the group's detail page. If you don't enter a name, a default name will becreated.
Advanced Options
The advanced options give you the ability to customize error and warning thresholds. If you choose not to setthem, SiteScope will use pre-set defaults if available. If a default is not available, SiteScope will not be ableto utilize the condition.
Disable
Check this box to temporarily disable this monitor and any associated alerts. To enable themonitor again, un-check the box.
Log File Path
If your web server does not appear in the Web Server list, you may still monitor it byentering the full path name to the web server log file.An example of a server log file path is:c:/ns-home/httpd-test/logs/accessFor servers that dynamically generate the filename for log files, you can include regularexpressions as part of the log file path definition. The SiteScope can then retrieve data from arange of filenames based on evaluation of the regular expressions.
Request Size Column
If your web server saves information in a custom format. Enter the column number whichcontains the Request Size. If this field is blank, the common log file format is assumed.
Verify Error
Check this box if you want SiteScope to automatically run this monitor again if it detects anerror.
Update Every (on error)
This options allows you to set a new monitoring interval for monitors that have registered an
SiteScope User Guide
Completing the Web Server Monitor Form 156

error condition. For example, you may want SiteScope to monitor this item every 10 minutesnormally, but as often as every 2 minutes if an error has been detected. Note that thisincreased scheduling will also affect the number of alerts generated by this monitor.
Schedule (Optional)
By default, SiteScope's monitors are enabled every day of the week. You may, however,schedule your monitors to run only on certain days or on a fixed schedule. Choose theEdit schedule link to create or edit a monitor schedule. For information about creatingschedules, read these instructions.
Monitor Description (Optional)
Enter additional information about this monitor. The description will appear on the MonitorDetail page.
Report Description (Optional)
Enter a description for this monitor that will make it easier to understand what this monitordoes. The description will appear on Management Reports and on the info popup for amonitor.
List Order (Optional)
By default, new monitors are listed last on the Monitor Detail page. You may use thispull-down menu to choose a different placement for this monitor.
Error if
Use this field to change the default Error threshold for this monitor. You may choose to haveSiteScope generate an Error condition based upon hits per minute or bytes per minute. Entera comparison value and use the comparison operator pop-up to specify an error thresholdsuch as: >= (greater than or equal to), != (not equal to), or < (less than). The value enteredmust be a whole number.For example, if you want SiteScope to report an error if your hits per minute reach 10,000 orhigher, you would choose hits/min from the pop-up menu, select >= from the comparisonvalue pop-up menu, and then type 10000 in the text entry box. Note: Do not enter commas in the text entry field.
Warning if
Use this field to set a warning threshold for this monitor. The warning threshold can be basedupon hits per minute or bytes per minute. Set this value exactly as you would the Errorthreshold in the Error if field.For example, If you want SiteScope to report a warning condition if your bytes per minutereach 500,000 or higher, you would choose bytes/min from the pop-up menu, select >= fromthe comparison value pop-up, and then type 500000 in the text entry box. Note: Do not entercommas in the text entry field.
Good if
SiteScope User Guide
Advanced Options 157

You may instruct SiteScope to return a good status only if certain conditions are met. Youmay define those conditions here. You may base a good reading on either hits per minute orbytes per minute. Complete this field exactly as you would the Error if and Warningif fields.
SiteScope User Guide
Advanced Options 158

SiteScope Alerts
You can instruct SiteScope to alert you when it detects a problem in your web environment. SiteScope offersseveral types of alerts including e-mail, electronic pager, and SNMP Trap. An alert definition containsinstructions that tell SiteScope how to respond when there is a change in state for a monitor, for example achange from normal-to-error or normal-to-warning condition. You can create an alert that includesinstructions for SiteScope to notify you via your pager or send you e-mail when a specific condition isdetected.
In this document we discuss:
• Using Alerts• The Alert Detail page• Additional links• How to create an alert• How to edit an alert• How to delete an alert• How to disable an alert• How to view alerts logs and other logs
Using Alerts
SiteScope alerts can be used in several ways to notify you of conditions in your web environment. Alerts canbe associated with individual monitors, groups of monitors, or globally for all monitors on a particularinstallation of SiteScope. The table below shows the different ways alerts can be associated with monitors.
Alert Class Description
Global Alerts Alerts that are triggered when any monitor on a given SiteScopeinstallation changes status.
Group Alerts Alerts are triggered by any monitor within the specified group orwithin a selection of individual monitors.
Individual Monitor Alerts Alerts are triggered when the specified monitor status changes.
By default, SiteScope sends one alert as soon as any monitor it is associated with detects an error condition.The options presented in the When section of the alert definition page allow you to control when alerts areactually sent in relation to when a given condition is detected. For example, you can choose to haveSiteScope generate an alert only after an error condition persists for a specific interval corresponding to agiven number of monitor runs. This is useful for monitors that run frequently that monitor dynamic,
SiteScope Alerts 159

frequently changing environment parameters. In some cases, a single error condition may not warrant anyintervention. The options in the When section are as follows:
When
Always, after the condition has occurred at least times
Only cause an Alert after the condition occurs at least this many times, consecutively.
Once, after condition occurs exactly times
only cause an Alert after the condition occurs exactly this many times, consecutively.
Every times, after condition occurs at least times
cause an Alert every X times the condition occurs, starting after the condition occurs atleast the specified number of times, consecutively.
Once, after group errors
cause an alert the first time that any monitor in this group gets this many consecutive errorreadings
Once, when all monitors of this group are in error
cause an alert when all of the monitors in the group are in error
The following diagrams show examples of different alert configurations that send alerts after the errorcondition has persisted for more than one monitor run. It is important to note that the sample intervalcorresponds to how often the monitor is run. If a monitor runs every fifteen seconds and the alert is set to besent after the third error reading, the alert will be sent 30 seconds after the error was detected. If the monitorrun interval is once every hour with the same alert setup the alert would not be sent until 2 hours later.
Example 1a. Alert sent for each error reading after condition persists for at least three monitor runs.Compare with Example 1b below.
Alert setup Always, after the condition has occurred at least times
sample interval 0 1 2 3 4 5 6 7 8 9 10
status
count c=0 c=1 c=2 c=3alert!
c=4alert!
c=5alert!
c=6alert!
c=7alert!
c=0 c=1 c=0
Example 1b. Alert sent for each error reading after condition persists for at least three monitor runs. Showshow the count is reset when the monitor returns one non-error reading between consecutive error readings.Compare with Example 1a above.
SiteScope User Guide
Using Alerts 160
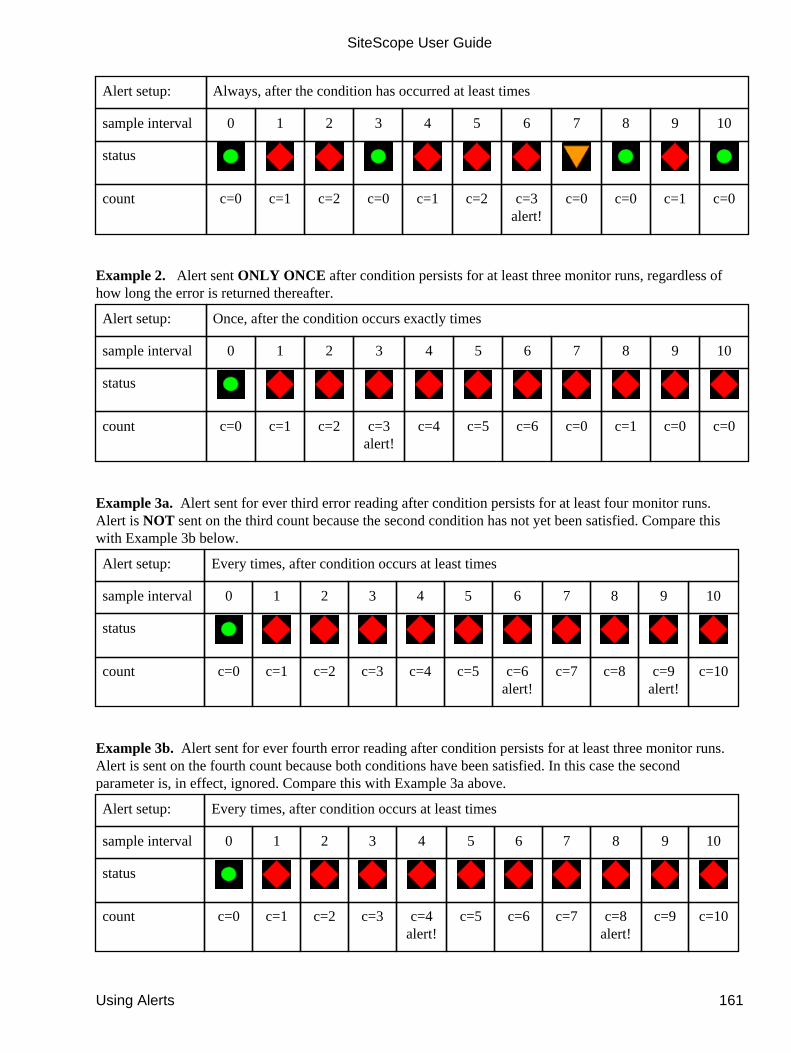
Alert setup: Always, after the condition has occurred at least times
sample interval 0 1 2 3 4 5 6 7 8 9 10
status
count c=0 c=1 c=2 c=0 c=1 c=2 c=3alert!
c=0 c=0 c=1 c=0
Example 2. Alert sent ONLY ONCE after condition persists for at least three monitor runs, regardless ofhow long the error is returned thereafter.
Alert setup: Once, after the condition occurs exactly times
sample interval 0 1 2 3 4 5 6 7 8 9 10
status
count c=0 c=1 c=2 c=3alert!
c=4 c=5 c=6 c=0 c=1 c=0 c=0
Example 3a. Alert sent for ever third error reading after condition persists for at least four monitor runs.Alert is NOT sent on the third count because the second condition has not yet been satisfied. Compare thiswith Example 3b below.
Alert setup: Every times, after condition occurs at least times
sample interval 0 1 2 3 4 5 6 7 8 9 10
status
count c=0 c=1 c=2 c=3 c=4 c=5 c=6alert!
c=7 c=8 c=9alert!
c=10
Example 3b. Alert sent for ever fourth error reading after condition persists for at least three monitor runs.Alert is sent on the fourth count because both conditions have been satisfied. In this case the secondparameter is, in effect, ignored. Compare this with Example 3a above.
Alert setup: Every times, after condition occurs at least times
sample interval 0 1 2 3 4 5 6 7 8 9 10
status
count c=0 c=1 c=2 c=3 c=4alert!
c=5 c=6 c=7 c=8alert!
c=9 c=10
SiteScope User Guide
Using Alerts 161
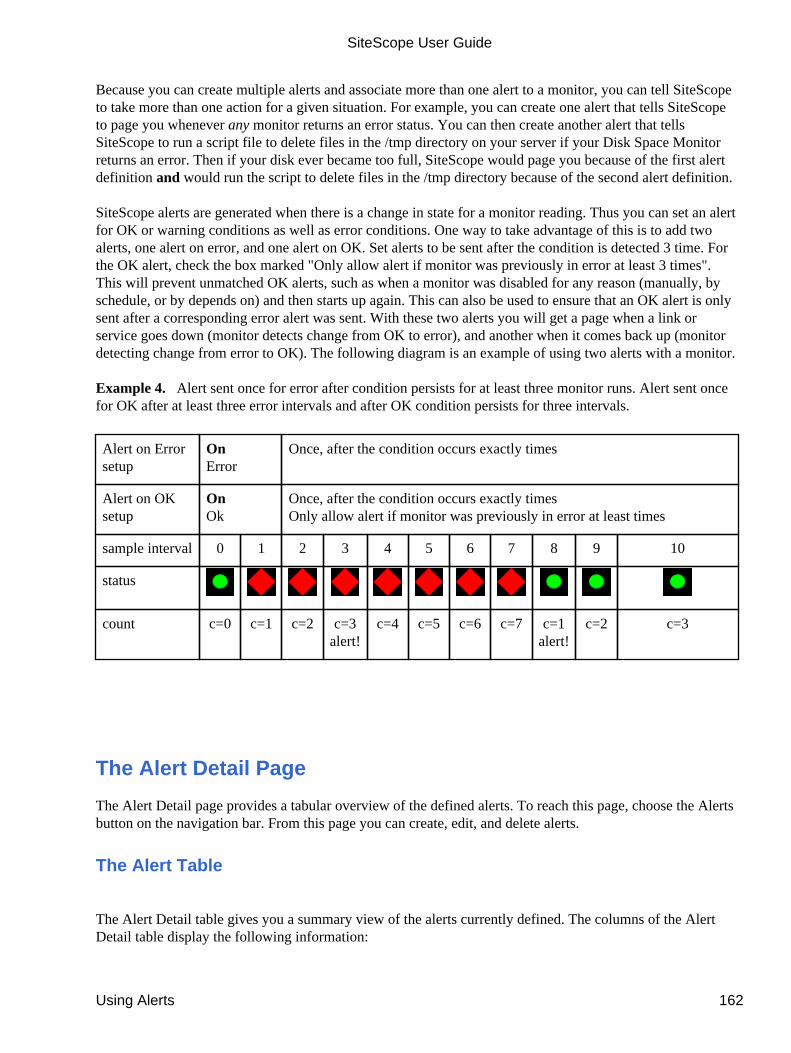
Because you can create multiple alerts and associate more than one alert to a monitor, you can tell SiteScopeto take more than one action for a given situation. For example, you can create one alert that tells SiteScopeto page you whenever any monitor returns an error status. You can then create another alert that tellsSiteScope to run a script file to delete files in the /tmp directory on your server if your Disk Space Monitorreturns an error. Then if your disk ever became too full, SiteScope would page you because of the first alertdefinition and would run the script to delete files in the /tmp directory because of the second alert definition.
SiteScope alerts are generated when there is a change in state for a monitor reading. Thus you can set an alertfor OK or warning conditions as well as error conditions. One way to take advantage of this is to add twoalerts, one alert on error, and one alert on OK. Set alerts to be sent after the condition is detected 3 time. Forthe OK alert, check the box marked "Only allow alert if monitor was previously in error at least 3 times".This will prevent unmatched OK alerts, such as when a monitor was disabled for any reason (manually, byschedule, or by depends on) and then starts up again. This can also be used to ensure that an OK alert is onlysent after a corresponding error alert was sent. With these two alerts you will get a page when a link orservice goes down (monitor detects change from OK to error), and another when it comes back up (monitordetecting change from error to OK). The following diagram is an example of using two alerts with a monitor.
Example 4. Alert sent once for error after condition persists for at least three monitor runs. Alert sent oncefor OK after at least three error intervals and after OK condition persists for three intervals.
Alert on Errorsetup
OnError
Once, after the condition occurs exactly times
Alert on OKsetup
OnOk
Once, after the condition occurs exactly timesOnly allow alert if monitor was previously in error at least times
sample interval 0 1 2 3 4 5 6 7 8 9 10
status
count c=0 c=1 c=2 c=3alert!
c=4 c=5 c=6 c=7 c=1alert!
c=2 c=3
The Alert Detail Page
The Alert Detail page provides a tabular overview of the defined alerts. To reach this page, choose the Alertsbutton on the navigation bar. From this page you can create, edit, and delete alerts.
The Alert Table
The Alert Detail table gives you a summary view of the alerts currently defined. The columns of the AlertDetail table display the following information:
SiteScope User Guide
Using Alerts 162

On
The status condition under which SiteScope should respond. For example, if this columncontains error x 1, SiteScope will respond the first time a selected monitor returns a readingin the error range. It the column contains error x 5, SiteScope will only respond after themonitor returns a reading that indicates an error 5 times. If you've created an alert for severalmonitors, such as all monitors in a particular group, SiteScope will respond whenany monitor in the group meets the indicated status condition.
Group
The name of the monitor or group of monitors this alert has been associated with. Globalalerts are indicated by "all groups".
For
The monitor or monitors for which the alert status condition must be true. For global alertsthis will be any monitor defined on this installation of SiteScope. Group alerts will be for anymonitor in the group. Individual alerts will list the name of the specific monitor.
Do
The action that SiteScope should take when the condition is met for the specified monitor(s).For example, this column may contain something like Send Mail to"[email protected]" which indicates that e-mail should be sent to this address ifthe appropriate status condition exists.
History
Click on this link to display a table showing the alerts that were sent during the last day or24-hour period.
Edit
Selecting this link will take you to the Edit Alert page. This will allow you to make changesin the alert criteria.
Test
Use this link to test an alert with a selected monitor. The Alert Test page is displayed whichallows you to select an alert from a drop-down menu. Selecting the "Test Alert" buttoncompletes the action
Del
Click the X to delete this alert. A confirmation screen is displayed. Selecting the "DeleteAlert" button completes the action
SiteScope User Guide
The Alert Table 163

Additional Links
In addition to the alert table, the following links are also available on the alert detail page.
Add a new alert
Choose this link to create a new alert.
Disable all Alerts
Choose this link to disable all defined alerts. This is useful in the event of a major failure thatyou are already aware of.
Enable all Alerts
Choose this link to enable all currently defined alerts.
Edit E-mail Preferences
Choose this link to edit mail preferences. This is where you tell SiteScope how to reach youvia e-mail.
Test E-mail
Choose this link to send a test message using e-mail. This allows you to verify that SiteScopewill be able to reach you via e-mail in the event of an error or warning.
Edit Pager Preferences
Choose this link to edit pager preferences. Choose the Edit link to tell SiteScope how toreach you via pager.
Test Pager
Choose this link to send a test message to your pager. This allows you to verify thatSiteScope will be able to reach you via pager in the event of an error or warning.
Edit SNMP Trap Preferences
Choose this link to edit SNMP preferences. This is where you tell SiteScope how to sendmessages to SNMP consoles.
Test SNMP Trap
Choose this link to send a test message using SNMP. This allows you to verify thatSiteScope will be able to contact the SNMP console in the event of an error or warning.
Quick Report of alerts sent
SiteScope User Guide
Additional Links 164
Choose this link to specify a report of alerts that were sent.
View the Log of alerts sent
Choose this link to view Logs page. The Logs page includes links that allow you to view thetab delimited log files for the alerts that have been sent, the log of any errors encountered insending the alerts, and date coded log files of SiteScope monitor readings.
Creating Alerts
SiteScope allows you to create as many alerts as you like.
To create a new alert:
1. On the SiteScope Panel, click the Alerts button on the navigation bar. The alert detail page appears.2. Click the "Add a new alert" link. The Add Alert form appears.3. Choose the category of monitor status that activates this alert - error, warning, or OK.4. Click the radio button for the kind of alert you would like to add - e-mail, pager, script, etc..5. Click that "Define Alert" button. The Define Alert form for the kind of alert that you selected will
appear.6. Complete the form for the specific alert you are creating. Each Define Alert page asks you to select
the monitor or monitors that will trigger the alert, details of how and where the alert will be sent, andcriteria defining when or how often the alert should be sent. Use the Help button on the navigationbar to see help specific to that kind of alert.
7. Click the "Add this alert" link. The new alert is created and the alert detail page is updated.
Editing Alerts
You may edit an alert at any time. Changes go into effect immediately.
To edit an alert:
1. On the SiteScope Panel, click the Alerts button on the navigation bar. The alert detail page appears.2. Click the Edit link in the Alert Detail Table for the alert that you want to edit. The Edit Alert form
appears.3. Make the desired changes to the form.4. Click the "Update this alert" link. The alert is updated and the alert detail page appears again.
Deleting Alerts
You may delete an alert at any time.
SiteScope User Guide
Additional Links 165

To delete an alert:
1. On the SiteScope Panel, click the Alerts button on the navigation bar. The alert detail page appears.2. Click the X in the Del column of the Alert Detail Table.3. A confirmation screen is displayed. Click on the Delete Alert button to confirm the action4. The alert detail page is updated.
Disabling Alerts
You may disable alerts whenever you don't want SiteScope to notify you of an error.
To disable an alert:
1. On the SiteScope Panel, click the Alerts button on the navigation bar. The alert detail page appears.2. Click the Edit link in the Alert Detail Table for the alert that you want to disable. The Edit Alert form
appears.3. Check the disable box located under Advanced Options.4. Click the "Update this alert" link. The alert detail page appears again.
Viewing Sent Alerts and Logs
You may view a log of all the alerts that have been sent for the last day, a log of failed alert attempts, anddate coded monitor logs.
To view the alert logs:
1. On the SiteScope Panel, click the Alerts button on the navigation bar. The alert detail page appears.2. Click the View the log of alerts sent link near the bottom of the Alert Detail page. The Alert Log
page appears.3. Click the Alert log link to view the details of alerts that were sent. Click the Failed alerts link to
view the details of alerts for which an error was encountered. An example may be that SiteScope wasunable to reach a paging service. To view previous alert logs, choose a from the list of date codedlinks displayed below the Failed Alerts link on the page.
SiteScope User Guide
Deleting Alerts 166
Database Alerts
The Database Alert allows you to export an alert with a description of the problem as a record to a SQLdatabase. You can then use database tools to provide more advanced searching, sorting and reporting on yourmonitoring data.
Completing the Database Alert Form
Complete each section of the form as described below and then click the Add or Update button to record thechanges.
On
The category of monitor status that activates this alert. You may choose either Error,Warning, or Ok.
Alert Subjects
Select the groups or monitors that will trigger this alert. You can select multiple groups andmonitors by holding down the control key while making your selection. The choices include:All Groups - Select All Groups if you want SiteScope to perform an action wheneverany monitor on this installation returns the indicated status condition. For example, youwould choose this option if you want SiteScope to page you whenever any monitor returns anerror status.[group name] - Select a specific group if you want SiteScope to perform an action wheneverany monitor in the selected group returns the indicated status condition. For example, youwould select the Network group if you wanted SiteScope to page you if any monitor in theNetwork group returned an error status.[group name]: [monitor name] - Select a specific monitor if you want SiteScope to performan action only if the selected monitor returns the indicated status condition. For example, youwould choose this option if you wanted SiteScope to send you e-mail if one specific monitorreturned a warning status.
Database Connection URL
Enter a URL to a Database Connection. The easiest way to create a database connection is touse an ODBC driver manager to create a named connection to a database. For example inWindows NT, first use the ODBC Data Sources manager in the Settings control panel tocreate a connection called test. Then, enter jdbc:odbc:test in this field as the connectionURL.
SQL Statement
Enter the SQL statement used to add the alert to the database. Items enclosed in < and > arereplaced with fields from the monitor which caused the alert. For example, entering
Database Alerts 167

INSERT INTO SiteScopeAlert VALUES('<name>') will add a record with the name of themonitor which caused the alert.
When
The number of times the alert conditions should be met before SiteScope executes the actionyou specified.
♦ Always, after the condition has occurred at least N times - After the condition occurs atleast N times, SiteScope executes the action every time the alert conditions are met. Type theminimum number of times the alert conditions must be met in the text input field.
♦ Once, after condition occurs exactly N times - SiteScope executes the action once, after theconditions are met for the Nth time. Type the number of times the alert conditions must bemet in the text input field.
♦ Every E times, after condition occurs at least N times - Executes the alert action everymultiple of E, beginning after the condition has occured at least N times. For example,if Ewas set to 3, and N was set to 4, then the action would be triggered on the 6th, 9th, 12th, etc.occurrences of the condition. The alert is suppressed when the 3rd occurrence is detectedbecause N is greater than 3. After the condition occurs 4 times, the alert is sent after the nexttriggering condition that is a multiple of 3, in this example, the 6th occurrence. Choose thisoption by selecting the applicable radio button, entering the multiple (E) and the minimumnumber of times (N) the alert conditions must be met in the text input fields provided.
♦ Once, after N errors in this group - SiteScope executes the action only after any monitor inthe group has been in error exactly N consecutive times. Type the number of errors in thetext input field.
♦ Once, when all monitors of group are in error - SiteScope executes the action the firsttime all monitors in the group are in error.
Advanced Options
Using the Advanced Options, you can further filter which conditions should trigger an alert.
Disabled
This check box prevents the alert from executing the action, even if the conditions are met.This is useful for temporarily turning off alerts.
Name Match
This field allows you to make use of naming conventions for your monitors. You may enter aword or string that appears in the names of monitors in this field, and SiteScope will onlygenerate an alert if the name of the monitor in error contains this word or string. Forexample, entering Ping: triggers this alert only for monitors that have a name that contains "Ping:" . The match is case sensitive.
SiteScope User Guide
Completing the Database Alert Form 168

Status Match
This field allows you to match on specific status readings returned by a monitor. Forexample, if you type timeout in this field, an alert will only be triggered by a monitor whichhas a status of " timeout." This match is case sensitive.
SiteScope User Guide
Advanced Options 169
E-mail Alerts
The E-Mail Alert form allows you to add or edit an Alert which sends an e-mail message to one or morepeople with a description of the error or warning. You can access the E-Mail Alert form by clicking theAlerts button on the SiteScope navigation bar and then selecting the Edit link in the Alert Detail table or the"Add an alert" link below the Alert Detail table.
Completing the E-mail Alert Form
Complete each section of the form as described below and then click the Add E-mail Alert button.
Alert Subjects
Select the groups and monitors handled by this alert. Select multiple groups and monitors byholding down the control key while making your selection. The choices are:All Groups - Select All Groups if you want SiteScope to perform an action wheneverany monitor returns the indicated status condition. For example, you would choose thisoption if you want SiteScope to page you whenever any monitor returns an error status.[group name] - Select a specific group if you want SiteScope to perform an action wheneverany monitor in the selected group returns the indicated status condition. For example, youwould select the Network group if you wanted SiteScope to page you if any monitor in theNetwork group returned an error status.[group name]: [monitor name] - Select a specific monitor if you want SiteScope to performan action only if the selected monitor returns the indicated status condition. For example, youwould choose this option if you wanted SiteScope to send you e-mail if one specific monitorreturned a warning status.
Send Mail
Send a standard SiteScope e-mail message to one or more predefined e-mail settings oraddresses. To- You may type one or more e-mail addresses in the text input field. Separate multipleaddresses with commas. Click the "Edit Mail Preferences" link to change your MailPreferences.Template- Choose which message template SiteScope should use when sending the e-mailmessage. By default, SiteScope sends a detailed message about the error or warning statusreturned by a monitor. If you would prefer a shorter message you may choose the ShortMailoption from the Template pulldown menu. This option is useful if your pager messages canbe generated via e-mail. Other options allow you to choose what level of detail to include inthe e-mail alerts. You may add additional templates into the ~/SiteScope/templates.maildirectory.Special Case Templates:For NT Event Log alerts, choose the NTEventLog template.
E-mail Alerts 170

For alerts that are generated when all monitors in a group are in error, choose the AllErrorstemplate.
When
Select the number of times the alert conditions should be met before SiteScope executes thee-mail action you specified.Always, after the condition has occured at least N times - After the condition occurs atleast N times, SiteScope executes the action every time the alert conditions are met. Type theminimum number of times the alert conditions must be met in the text input field. Once, after condition occurs exactly N times - SiteScope executes the action once, after theconditions are met for the Nth time. Type the number of times the alert conditions must bemet in the text input field.Every E times, after condition occurs at least N times - Executes the alert action everymultiple of E, beginning after the condition has occured at least N times. For example,if Ewas set to 3, and N was set to 4, then the action would be triggered on the 6th, 9th, 12th, etc.occurrences of the condition. The alert is suppressed when the 3rd occurrence is detectedbecause N is greater than 3. After the condition occurs 4 times, the alert is sent after the nexttriggering condition that is a multiple of 3, in this example, the 6th occurrence. Choose thisoption by selecting the applicable radio button, entering the multiple (E) and the minimumnumber of times (N) the alert conditions must be met in the text input fields provided.Once, after N errors in this group - SiteScope executes the action only after any monitor inthe group has been in error exactly N consecutive times. Type the number of errors in thetext input field.Once, when all monitors of group are in error - SiteScope executes the action the firsttime all monitors in the group are in error.
Advanced Options
Using the Advanced Options, you can further filter which conditions should trigger an alert.
Disabled
This check box prevents the e-mail alert from being executed, even if the alert conditions aremet. This is useful for temporarily turning off alerts.
Name Match
This field allows you to make use of naming conventions for your monitors. You may enter aword or string that appears in the names of monitors in this field, and SiteScope will onlygenerate an alert if the name of the monitor in error contains this word or string. Forexample, entering Ping: triggers this alert only for monitors that have a name that contains "Ping:" . The name match is case sensitive.
Status Match
This field allows you to match on specific status readings returned by a monitor. Forexample, if you type timeout in this field, an alert will only be triggered by a monitor whichhas a status of " timeout." This match is case sensitive.
SiteScope User Guide
Completing the E-mail Alert Form 171

SiteScope User Guide
Advanced Options 172

Understanding SiteScope E-mail Alerts
SiteScope E-mail Alerts are one of the methods that SiteScope can use to notify you about problems withapplications and servers being monitored by SiteScope. The E-mail Alert contains a description of theproblem that occurred. It may also contain diagnostic information and descriptions of the most commoncauses of the problem. This document will help you better understand the information in the alert message.
If you followed a link embedded inside an e-mail message to get to this page and you are not familiar withFreshwater Software's SiteScope, perhaps some explanation is in order. SiteScope is software, installed on aserver, that is used to monitor applications and servers and report if they are performing correctly. A systemadministrator configured the SiteScope software to send you this alert when SiteScope noticed a problem inthe web environment.
In this section we will discuss:
• The SiteScope E-mail Alert Format
♦ Alert E-mail Subject Field♦ Alert Message Header♦ More Information / Diagnostics♦ Monitor Details
• Questions About Alerts
SiteScope E-mail Alert Format
SiteScope e-mail alerts can provide you with important data about conditions in your web environment.Depending on which mail template has been chosen for the alert, the e-amil alert message contains detailsthat allow you to quickly identify real and potential problems. These sections are described below:
Alert E-mail Subject Field
SiteScope e-mail alerts are sent with a summary of alert information written into the subject field of thee-mail message. This includes the following information:
• the subject of the message -- "SiteScope Alert"• the category of the monitor alert -- error, warning, ok, or no data• the name of the monitor or title of the monitor• the status returned by the monitor• the address, in parentheses, of the SiteScope installation that sent the alert
Example of a SiteScope generated e-mail alert header:From: <sitescope admin e-mail>To: <[email protected]>Subject: SiteScope Alert, error, URL: http://missing.freshtech.com, unknown host name (demo.freshtech.com)
Understanding SiteScope E-mail Alerts 173
Alert Message Header
The message text of the e-mail alert is divided into sections. The first section is the alert header. The first linein the alert header includes a link to the SiteScope installation which sent the alert. This provides you withquick access to the SiteScope installation reporting the problem.
Below the link to SiteScope is a block of text that further summarizes what caused the alert. This includes:
• the name of the monitor that triggered the alert• the group to which the monitor belongs• the alert status reported by the monitor• the sample id number indicating how many times the monitor ran before the condition was reported• the time of day when the error occurred
After this text block is a link to this help page of the SiteScope help documentation.
Example header section:This alert is from SiteScope at http://demo.freshtech.com:8888/SiteScope
Monitor: URL: http://missing.freshtech.comGroup: emptyStatus: unknown host nameSample #: 1034
Time: 9:57 am 9/8/98
For documentation about alerts, go to: http://demo.freshtech.com:8888/SiteScope/docs/AlertHelp.htm
More Information / Diagnostics
This section includes more diagnostic information about the error that occurred. Depending on the type ofmonitor this may include:
• a description of the error or alert condition• descriptions of the most common causes for this condition• if the monitor is the type that tests a network application, a ping test will be performed• if the ping test fails some description of the most common causes for this failure• if the ping test failed, a traceroute test will also be performed• a description and listing of the traceroute results
Note: if you don't want diagnostics to run, such as when traceroutes are taking too long, choose the "NoDiagnostics " e-mail template from the Additional E-mail preferences page. This is accessible the EditE-Mail Preferences link on the edit alert page for the subject alert.
Example:More information:
SiteScope User Guide
Alert E-mail Subject Field 174
This message is returned when DNS cannot find an IP address for a name.Check the network connection to the DNS server.Check that the DNS server for that domain is running.Check that DNS is properly configured on the SiteScope machine.Check that the name exists in the configuration for that domain.
A test of the internet connection to missing.freshtech.com failed.
This suggests that the problem may be a failure of some piece of the network or the server.
Trace Route results for missing.freshtech.com
This trace shows you the path to missing.freshtech.com.Each line shows how long it took to get to the next step along the path.If the trace does not end at missing.freshtech.com, then the last line shows the last good step along the path. The times are in milliseconds -- a large change shows which step is the slowest part of the connection.
Unable to resolve target system name missing.freshtech.com.
Monitor Details
This section lists the settings for the monitor which caused the alert. These settings can be changed by usingthe Edit Monitor form.
Example:---------------------- Detail ----------------------URL: http://missing.freshtech.comTimeout: 60 secUpdate every: 864000Title: URL: http://missing.freshtech.comUpdate every (on errors): n/around trip time: n/a
Questions About Alerts
The following are some common questions about SiteScope e-mail alerts. You can find additionalinformation on SiteScope alerts in the Freshwater Software Support Database.
Q: Why do I get a lot of email messages about the same error?
A: If an alert is configured to be sent "Always," , you'll get an alert every time SiteScope monitor runs thetest and finds an error. This can generate a lot of e-mail alerts for monitors which run frequently. If you onlywant an alert when the problem first starts, change the setting to "Once" under the When section on theDefine E-Mail Alert form. This will instruct SiteScope to send an alert only once when the monitor finds anerror. The monitor may continue to report an error but the alert will only be sent once.
Q: How do I configure SiteScope so it only sends an alert after the problem happens more than once?
SiteScope User Guide
More Information / Diagnostics 175
A: You can suppress transitory or intermittent alerts by making changes on the Define E-Mail Alert form.Most of the options under the When section on the form include text boxes for selecting a number. Bydefault these are set to 1 (one). This means that an alert will be sent after the first time an error condition isreported. Changing this number for the option that you have selected will suppress the alerts until the errorhas been detected the number of time you have indicated. For example, changing the number of the option:"Always, after the condition has occured at least N times" from 1 to 5 will have SiteScope send you one alertthe first time there are five consecutive errors reported.
Another choice for suppressing intermittent alerts is to check the "Verify Error" box on the Add / EditMonitor form. When this box is checked, SiteScope will verify the test result by immediately re-running thetest when there is an error. Go to the Monitor detail page and click on the Edit link in the Monitor detail tableto bring up the Edit Monitor form for the selected monitor.
Q: Why do I receive e-mail messages saying SiteScope has started when I haven't shut it down?
A: SiteScope normally re-intializes itself once each day. The E-Mail Preferences page allows you to chooseto have SiteScope send a message whenever SiteScope restarts. If this checkbox is selected, SiteScope willsend a brief status message to the administrator's e-mail address whenever SiteScope starts running orre-initializes. This means that you would normally receive a message once per day. This message will also begenerated if someone manually stops and restarts the SiteScope process. Other incidences of this messagemay indicate that a monitor or process has taken too long to run. An example might be if a script being run bya script monitor hangs up during execution.
SiteScope User Guide
Questions About Alerts 176
Log Event Alerts
The Log Event Alert form allows you to add or edit an Alert which will log an error to the Windows NTApplication Event Log. Entries in the event log can then be viewed with the Event Viewer and/or used byother software utilities that perform centralized alerting from the event log.
Note:If you are also using SiteScope's Event Log Monitor, use of the Log Event alert requires caution as it ispossible for a loop to get started that will quickly fill your log file; the Event Log Monitor detects an event,triggers a Log Event alert, which puts an event into the event log, which the Event Log Monitor then detects,and then triggers a Log Event alert, etc.
Completing the Log Event Alert Form
Complete each section of the form as described below and then click the Add or Update button.
On
The monitor status that must be in effect in order to activate this alert. You may choose eitherError, Warning, or Ok.
Alert Subjects
Select the groups and monitors handled by this alert. Select multiple groups and monitors byholding down the control key while making your selection. The choices are:All Groups - Select All Groups if you want SiteScope to perform an action wheneverany monitor returns the indicated status condition. For example, you would choose thisoption if you want SiteScope to page you whenever any monitor returns an error status.[group name] - Select a specific group if you want SiteScope to perform an action wheneverany monitor in the selected group returns the indicated status condition. For example, youwould select the Network group if you wanted SiteScope to page you if any monitor in theNetwork group returned an error status.[group name]: [monitor name] - Select a specific monitor if you want SiteScope to performan action only if the selected monitor returns the indicated status condition. For example, youwould choose this option if you wanted SiteScope to send you e-mail if one specific monitorreturned a warning status.
Log Event
Log a message to the Window NT Event Log.
Template
By default, SiteScope sends a message about the error or warning status returned by amonitor. If you would prefer a specific format for this message, choose the desired optionfrom the Template drop-down menu. You may add additional templates into thetemplates.eventlog directory.
Log Event Alerts 177

When
The number of times the alert conditions should be met before SiteScope executes the actionyou specified.Always, after the condition has occurred at least N times - After the condition occurs atleast N times, SiteScope executes the action every time the alert conditions are met. Type theminimum number of times the alert conditions must be met in the text input field. Once, after condition occurs exactly N times - SiteScope executes the action once, after theconditions are met for the Nth time. Type the number of times the alert conditions must bemet in the text input field.Every E times, after condition occurs at least N times - Executes the alert action everymultiple of E, beginning after the condition has occured at least N times. For example,if Ewas set to 3, and N was set to 4, then the action would be triggered on the 6th, 9th, 12th, etc.occurrences of the condition. The alert is suppressed when the 3rd occurrence is detectedbecause N is greater than 3. After the condition occurs 4 times, the alert is sent after the nexttriggering condition that is a multiple of 3, in this example, the 6th occurrence. Choose thisoption by selecting the applicable radio button, entering the multiple (E) and the minimumnumber of times (N) the alert conditions must be met in the text input fields provided.Once, after N errors in this group - SiteScope executes the action only after any monitor inthe group has been in error exactly N consecutive times. Type the number of errors in thetext input field.Once, when all monitors of group are in error - SiteScope executes the action the firsttime all monitors in the group are in error.
Advanced Options
Using the Advanced Options, you can further filter which conditions should trigger an alert.
Event Source
Sets the Source field of the event that is logged.
Event ID
Sets the ID field of the event that is logged.
Event Type
Sets the type of the event: error, warning, or informational.
Disabled
This check box prevents the alert from executing the action, even if the conditions are met.This is useful for temporarily turning off alerts.
Name Match
This field allows you to make use of naming conventions for your monitors. You may enter aword or string that appears in the names of monitors in this field, and SiteScope will only
SiteScope User Guide
Completing the Log Event Alert Form 178

generate an alert if the name of the monitor in error contains this word or string. Forexample, entering Ping: triggers this alert only for monitors that have a name that contains "Ping:" . The match is case sensitive.
Status Match
This field allows you to match on specific status readings returned by a monitor. Forexample, if you type timeout in this field, an alert will only be triggered by a monitor whichhas a status of " timeout." This match is case sensitive.
SiteScope User Guide
Advanced Options 179

Pager Alerts
The Pager Alert form allows you to add or edit an alert which sends a message to a pager. Depending on thetype of pager you use and the capabilities of the pager service, you can configure the alert to send an alertwith an abbreviated description of the problem.
Completing the Pager Alert Form
Complete each section of the form as described below and then click the Add or Update button.
On
The category of monitor that activates this alert. You may choose either Error, Warning, orOk.
Alert Subjects
Select the groups and monitors handled by this alert. Select multiple groups and monitors byholding down the control key while making your selection. The choices are:
♦ All Groups - Select All Groups if you want SiteScope to perform an action wheneverany monitor returns the indicated status condition. For example, you would choose thisoption if you want SiteScope to page you whenever any monitor returns an error status.
♦ [group name] - Select a specific group if you want SiteScope to perform an action wheneverany monitor in the selected group returns the indicated status condition. For example, youwould select the Network group if you wanted SiteScope to page you if any monitor in theNetwork group returned an error status.
♦ [group name]: [monitor name] - Select a specific monitor if you want SiteScope to performan action only if the selected monitor returns the indicated status condition. For example, youwould choose this option if you wanted SiteScope to send you e-mail if one specific monitorreturned a warning status.
Send Page
Send a page to the one or more pagers defined in the SiteScope Pager Settings. You candefine additional pager settings by clicking the Edit Pager Preferences link. MessageType an optional prefix to the message will be sent to the pager. Please note that themaximum length for the entire message is 32 characters. TemplateChoose the pager template you want SiteScope to use when sending this page.SiteScope will automatically use the Default template if you don't choose another. NOTE:If
Pager Alerts 180

this alert is for an NT Event Log monitor, choose the NTEventLog template. It this alert isonly generated if all monitors in a group are in error, choose the AllErrors template.
When
The number of times the alert conditions should be met before SiteScope executes the actionyou specified.Always, after the condition has occurred at least N times - After the condition occurs atleast N times, SiteScope executes the action every time the alert conditions are met. Type theminimum number of times the alert conditions must be met in the text input field. Once, after condition occurs exactly N times - SiteScope executes the action once, after theconditions are met for the Nth time. Type the number of times the alert conditions must bemet in the text input field.Every E times, after condition occurs at least N times - Executes the alert action everymultiple of E, beginning after the condition has occured at least N times. For example,if Ewas set to 3, and N was set to 4, then the action would be triggered on the 6th, 9th, 12th, etc.occurrences of the condition. The alert is suppressed when the 3rd occurrence is detectedbecause N is greater than 3. After the condition occurs 4 times, the alert is sent after the nexttriggering condition that is a multiple of 3, in this example, the 6th occurrence. Choose thisoption by selecting the applicable radio button, entering the multiple (E) and the minimumnumber of times (N) the alert conditions must be met in the text input fields provided.Once, after N errors in this group - SiteScope executes the action only after any monitor inthe group has been in error exactly N consecutive times. Type the number of errors in thetext input field.Once, when all monitors of group are in error - SiteScope executes the action the firsttime all monitors in the group are in error.
Advanced Options
Using the Advanced Options, you can further filter which conditions should trigger an alert.
Disabled
This check box prevents the alert from executing the action, even if the conditions are met.This is useful for temporarily turning off alerts.
Name Match
This field allows you to make use of naming conventions for your monitors. You may enter aword or string that appears in the names of monitors in this field, and SiteScope will onlygenerate an alert if the name of the monitor in error contains this word or string. Forexample, entering Ping: triggers this alert only for monitors that have a name that contains "Ping:" . The match is case sensitive.
Status Match
This field allows you to match on specific status readings returned by a monitor. Forexample,if you type timeout in this field, an alert will only be triggered by a monitor whichhas a status of " timeout." This match is case sensitive.
SiteScope User Guide
Completing the Pager Alert Form 181

SiteScope User Guide
Advanced Options 182
Post Alerts
The Post Alert form allows you to add or edit an Alert which submits a form with a description of the error toa CGI script. This type of alert provides you with a way of sending alert information through a firewallwithout having to make any security changes.
Completing the Post Alert Form
Complete each section of the form as described below and then click the Add or Update button.
On
The category of monitor that activates this alert. You may choose either Error, Warning, orOk.
Alert Subjects
Select the groups and monitors handled by this alert. Select multiple groups and monitors byholding down the control key while making your selection. The choices are:All Groups - Select All Groups if you want SiteScope to perform an action wheneverany monitor returns the indicated status condition. For example, you would choose thisoption if you want SiteScope to page you whenever any monitor returns an error status.[group name] - Select a specific group if you want SiteScope to perform an action wheneverany monitor in the selected group returns the indicated status condition. For example, youwould select the Network group if you wanted SiteScope to page you if any monitor in theNetwork group returned an error status.[group name]: [monitor name] - Select a specific monitor if you want SiteScope to performan action only if the selected monitor returns the indicated status condition. For example, youwould choose this option if you wanted SiteScope to send you e-mail if one specific monitorreturned a warning status.
Action
Send a standard SiteScope form submission to the indicated CGI URL. Type the desiredURL in the text input field.
Template
By default, SiteScope sends a descriptive form submission about the error or warning statusreturned by a monitor. If you would prefer a specific format, choose the desired option fromthe Template drop-down menu. You may add additional templates into thetemplates.post directory.
When
The number of times the alert conditions should be met before SiteScope executes the actionyou specified.
Post Alerts 183

Always, after the condition has occurred at least N times - After the condition occurs atleast N times, SiteScope executes the action every time the alert conditions are met. Type theminimum number of times the alert conditions must be met in the text input field. Once, after condition occurs exactly N times - SiteScope executes the action once, after theconditions are met for the Nth time. Type the number of times the alert conditions must bemet in the text input field.Every E times, after condition occurs at least N times - Executes the alert action everymultiple of E, beginning after the condition has occured at least N times. For example,if Ewas set to 3, and N was set to 4, then the action would be triggered on the 6th, 9th, 12th, etc.occurrences of the condition. The alert is suppressed when the 3rd occurrence is detectedbecause N is greater than 3. After the condition occurs 4 times, the alert is sent after the nexttriggering condition that is a multiple of 3, in this example, the 6th occurrence. Choose thisoption by selecting the applicable radio button, entering the multiple (E) and the minimumnumber of times (N) the alert conditions must be met in the text input fields provided.Once, after N errors in this group - SiteScope executes the action only after any monitor inthe group has been in error exactly N consecutive times. Type the number of errors in thetext input field.Once, when all monitors of group are in error - SiteScope executes the action the firsttime all monitors in the group are in error.
Advanced Options
Authorization User Name
If the URL specified requires a name and password for access, enter the name in this field.
Authorization Password
If the URL specified requires a name and password for access, enter the password in thisfield.
NT Challenge Response
Check this box if you want SiteScope to use Window's NT Challenge Responseauthorization when Posting to this Web page.
Proxy Server User Name
If the proxy server requires a name and password to access the URL, enter the name here.Technical note: your proxy server must support Proxy-Authenticate for these options tofunction.
Proxy Server Password
If the proxy server requires a name and password to access the URL, enter the passwordhere. Technical note: your proxy server must support Proxy-Authenticate for these options tofunction.
SiteScope User Guide
Completing the Post Alert Form 184
Disabled
This check box prevents the alert from executing the action, even if the conditions are met.This is useful for temporarily turning off alerts.
Name Match
This field allows you to make use of naming conventions for your monitors. You may enter aword or string that appears in the names of monitors in this field, and SiteScope will onlygenerate an alert if the name of the monitor in error contains this word or string. Forexample, entering Ping: triggers this alert only for monitors that have a name that contains "Ping:" . The match is case sensitive.
Status Match
This field allows you to match on specific status readings returned by a monitor. Forexample, if you type timeout in this field, an alert will only be triggered by a monitor whichhas a status of " timeout." This match is case sensitive.
SiteScope User Guide
Advanced Options 185

Script Alerts
The Script Alert form allows you to add or edit an Alert which runs a custom script.
Completing the Script Alert Form
Complete each section of the form as described below and then click the Add or Update button. Refer to theAdvanced Topics section of the User Guide for information about writing recovery scripts.
On
The category of monitor that activates this alert. You may choose either Error, Warning, orOk.
Alert Subjects
Select the groups and monitors handled by this alert. Select multiple groups and monitors byholding down the control key while making your selection. The choices are:All Groups - Select All Groups if you want SiteScope to perform an action wheneverany monitor returns the indicated status condition. For example, you would choose thisoption if you want SiteScope to page you whenever any monitor returns an error status.[group name] - Select a specific group if you want SiteScope to perform an action wheneverany monitor in the selected group returns the indicated status condition. For example, youwould select the Network group if you wanted SiteScope to page you if any monitor in theNetwork group returned an error status.[group name]: [monitor name] - Select a specific monitor if you want SiteScope to performan action only if the selected monitor returns the indicated status condition. For example, youwould choose this option if you wanted SiteScope to send you e-mail if one specific monitorreturned a warning status.
Run Script
Run a recovery script from the command line. ServerChoose the server on which the script should be run. On remote Unix servers, run thecommand line on the remote machine. Create a " scripts" directory in the remote loginaccount to allow remote scripts to be invoked. ScriptSelect the script that you want SiteScope to run in response to the selected condition.SiteScope comes with a simple script that will restart an IIS server, RestartIIS.bat, whichyou'll see on the pop-up menu. You may create as many custom scripts as you like. If youchoose to create your own scripts, you must place them in the ~SiteScope/scripts directory.SiteScope will list all files in this directory on the pop-up menu. TemplateSiteScope creates a file containing information about the monitor that caused the error andpasses the filename to your script. Use the Template pull-down to create the file using adifferent template. You may add additional templates into the templates.script directory.
Script Alerts 186
When
The number of times the alert conditions should be met before SiteScope executes the actionyou specified.Always, after the condition has occurred at least N times - After the condition occurs atleast N times, SiteScope executes the action every time the alert conditions are met. Type theminimum number of times the alert conditions must be met in the text input field. Once, after condition occurs exactly N times - SiteScope executes the action once, after theconditions are met for the Nth time. Type the number of times the alert conditions must bemet in the text input field.Every E times, after condition occurs at least N times - Executes the alert action everymultiple of E, beginning after the condition has occured at least N times. For example,if Ewas set to 3, and N was set to 4, then the action would be triggered on the 6th, 9th, 12th, etc.occurrences of the condition. The alert is suppressed when the 3rd occurrence is detectedbecause N is greater than 3. After the condition occurs 4 times, the alert is sent after the nexttriggering condition that is a multiple of 3, in this example, the 6th occurrence. Choose thisoption by selecting the applicable radio button, entering the multiple (E) and the minimumnumber of times (N) the alert conditions must be met in the text input fields provided.Once, after N errors in this group - SiteScope executes the action only after any monitor inthe group has been in error exactly N consecutive times. Type the number of errors in thetext input field.Once, when all monitors of group are in error - SiteScope executes the action the firsttime all monitors in the group are in error.
Advanced Options
Using the Advanced Options, you can further filter which conditions should trigger an alert.
Disabled
This check box prevents the alert from executing the action, even if the conditions are met.This is useful for temporarily turning off alerts.
Name Match
This field allows you to make use of naming conventions for your monitors. You may enter aword or string that appears in the names of monitors in this field, and SiteScope will onlygenerate an alert if the name of the monitor in error contains this word or string. Forexample, entering Ping: triggers this alert only for monitors that have a name that contains "Ping:" . The match is case sensitive.
Status Match
This field allows you to match on specific status readings returned by a monitor. Forexample, if you type timeout in this field, an alert will only be triggered by a monitor whichhas a status of " timeout." This match is case sensitive.
SiteScope User Guide
Completing the Script Alert Form 187
SNMP Trap Alerts
The SNMP Alert form allows you to add or edit an Alert which sends an SNMP trap to an SNMPmanagement console.
Completing the SNMP Alert Form
Complete each section of the form as described below and then click the Add or Update button.
On
The category of monitor that activates this alert. You may choose either Error, Warning, orOk.
Alert Subjects
Select the groups and monitors handled by this alert. Select multiple groups and monitors byholding down the control key while making your selection. The choices are:All Groups - Select All Groups if you want SiteScope to perform an action wheneverany monitor returns the indicated status condition. For example, you would choose thisoption if you want SiteScope to page you whenever any monitor returns an error status.[group name] - Select a specific group if you want SiteScope to perform an action wheneverany monitor in the selected group returns the indicated status condition. For example, youwould select the Network group if you wanted SiteScope to page you if any monitor in theNetwork group returned an error status.[group name]: [monitor name] - Select a specific monitor if you want SiteScope to performan action only if the selected monitor returns the indicated status condition. For example, youwould choose this option if you wanted SiteScope to send you e-mail if one specific monitorreturned a warning status.
Send SNMP Trap
Send a SNMP trap message to an SNMP console defined in the SiteScope SNMPPreferences.
Message
Type and optional prefix to the SNMP trap in the text input field.
Template
Choose the template for the SNMP trap to be sent. Each line in the template will be sent as aseparate SNMP variable. If the first line of the template file is of the form: [Agent Host:hostname-or-ip-address] , then the trap will be sent with that hostname or IP address as
SNMP Trap Alerts 188

the source of the trap. By default, the IP address of the machine that SiteScope is running onis used as the source of the trap.The template file can also be modified of the form[Command: command name] this will override the default command. Or for the default type[Type: var-type] will override the default type of the object. [OID: object id] willchange the default object id. This could be a solution for varying the the var-binding variableobject id.
To
Choose the SNMP settings to use when sending this trap. Normally only the default SNMPwill be available. To add or edit SNMP trap settings see the SNMP Preferences for optionson SNMP settings as well as the help page for Adding Additional SNMP settings.
When
Enter the number of times the alert conditions should be met before SiteScope executes theaction you specified. The options are:
♦ Always, after the condition has occurred at least N times - After the condition occurs atleast N times, SiteScope executes the action every time the alert conditions are met. Type theminimum number of times the alert conditions must be met in the text input field.
♦ Once, after condition occurs exactly N times - SiteScope executes the action once, after theconditions are met for the Nth time. Type the number of times the alert conditions must bemet in the text input field.
♦ Every E times, after condition occurs at least N times - Executes the alert action everymultiple of E, beginning after the condition has occured at least N times. For example,if Ewas set to 3, and N was set to 4, then the action would be triggered on the 6th, 9th, 12th, etc.occurrences of the condition. The alert is suppressed when the 3rd occurrence is detectedbecause N is greater than 3. After the condition occurs 4 times, the alert is sent after the nexttriggering condition that is a multiple of 3, in this example, the 6th occurrence. Choose thisoption by selecting the applicable radio button, entering the multiple (E) and the minimumnumber of times (N) the alert conditions must be met in the text input fields provided.
♦ Once, after N errors in this group - SiteScope executes the action only after any monitor inthe group has been in error exactly N consecutive times. Type the number of errors in thetext input field.
♦ Once, when all monitors of group are in error - SiteScope executes the action the firsttime all monitors in the group are in error.
Advanced Options
Using the Advanced Options, you can further filter which conditions should trigger an SNMP alert.
Disabled
SiteScope User Guide
Completing the SNMP Alert Form 189
Checking this check box prevents the disables the alert from executing the action, even if theconditions are met. This is useful for temporarily turning off alerts.
Name Match
This field allows you to make use of naming conventions for your monitors. You may enter aword or string that appears in the names of monitors in this field, and SiteScope will onlygenerate an alert if the name of the monitor in error contains this word or string. Forexample, entering Ping: triggers this alert only for monitors that have a name that contains "Ping:" . The name match is case sensitive.
Status Match
This field allows you to match on specific status readings returned by a monitor. Forexample, if you type timeout in this field, an alert will only be triggered by a monitor whichhas a status of " timeout." This match is case sensitive.
SiteScope User Guide
Advanced Options 190

Sound Alerts
The Sound Alert form allows you to add or edit an Alert which plays a sound on the machine on whichSiteScope is running. It is important to note that the sound alert is limited to the machine on which SiteScopeis running. Therefore, a sound alert will be effective only if the SiteScope server is in an area that is regularlyoccupied by your support staff.
Completing the Sound Alert Form
Complete each section of the form as described below and then click the Add or Update button.
On
The category of monitor that activates this alert. You may choose either Error, Warning, orOk.
Alert Subjects
Select the groups and monitors handled by this alert. Select multiple groups and monitors byholding down the control key while making your selection. The choices are:All Groups - Select All Groups if you want SiteScope to perform an action wheneverany monitor returns the indicated status condition. For example, you would choose thisoption if you want SiteScope to page you whenever any monitor returns an error status.[group name] - Select a specific group if you want SiteScope to perform an action wheneverany monitor in the selected group returns the indicated status condition. For example, youwould select the Network group if you wanted SiteScope to page you if any monitor in theNetwork group returned an error status.[group name]: [monitor name] - Select a specific monitor if you want SiteScope to performan action only if the selected monitor returns the indicated status condition. For example, youwould choose this option if you wanted SiteScope to send you e-mail if one specific monitorreturned a warning status.
Sound File
Pick the sound to be played from the list. Additional sounds may be added to thetemplates.sound directory in the AU format (8 bit, law, 8000 Hz, one-channel) with a.au suffix.
When
The number of times the alert conditions should be met before SiteScope executes the actionyou specified.Always, after the condition has occurred at least N times - After the condition occurs atleast N times, SiteScope executes the action every time the alert conditions are met. Type theminimum number of times the alert conditions must be met in the text input field. Once, after condition occurs exactly N times - SiteScope executes the action once, after theconditions are met for the Nth time. Type the number of times the alert conditions must be
Sound Alerts 191

met in the text input field.Every E times, after condition occurs at least N times - Executes the alert action everymultiple of E, beginning after the condition has occured at least N times. For example,if Ewas set to 3, and N was set to 4, then the action would be triggered on the 6th, 9th, 12th, etc.occurrences of the condition. The alert is suppressed when the 3rd occurrence is detectedbecause N is greater than 3. After the condition occurs 4 times, the alert is sent after the nexttriggering condition that is a multiple of 3, in this example, the 6th occurrence. Choose thisoption by selecting the applicable radio button, entering the multiple (E) and the minimumnumber of times (N) the alert conditions must be met in the text input fields provided.Once, after N errors in this group - SiteScope executes the action only after any monitor inthe group has been in error exactly N consecutive times. Type the number of errors in thetext input field.Once, when all monitors of group are in error - SiteScope executes the action the firsttime all monitors in the group are in error.
Advanced Options
Using the Advanced Options, you can further filter which conditions should trigger an alert.
Disabled
This check box prevents the alert from executing the action, even if the conditions are met.This is useful for temporarily turning off alerts.
This field allows you to make use of naming conventions for your monitors. You may enter aword or string that appears in the names of monitors in this field, and SiteScope will onlygenerate an alert if the name of the monitor in error contains this word or string. Forexample, entering Ping: triggers this alert only for monitors that have a name that containsPing:. The match is case sensitive.
Status Match
This field allows you to match on specific status readings returned by a monitor. Forexample, if you type timeout in this field, an alert will only be triggered by a monitor whichhas a status of timeout. This match is case sensitive.
SiteScope User Guide
Completing the Sound Alert Form 192

Disable or Enable Monitor Alerts
The Disable or Enable Monitor(s) Alert form allows you to enable or disable one or more monitors or groups.This is useful for times when you're doing maintenance or other activities that will cause unnecessary alerts.
Completing the Disable or Enable Monitor(s) Alert Form
Complete each section of the form as described below and then click the Add or Update button.
On
The category of monitor that activates this alert. You may choose either Error, Warning, orOk.
Alert Subjects
Select the groups and monitors handled by this alert. Select multiple groups and monitors byholding down the control key while making your selection. The choices are:All Groups - Select All Groups if you want SiteScope to perform an action wheneverany monitor returns the indicated status condition. For example, you would choose thisoption if you want SiteScope to page you whenever any monitor returns an error status.[group name] - Select a specific group if you want SiteScope to perform an action wheneverany monitor in the selected group returns the indicated status condition. For example, youwould select the Network group if you wanted SiteScope to page you if any monitor in theNetwork group returned an error status.[group name]: [monitor name] - Select a specific monitor if you want SiteScope to performan action only if the selected monitor returns the indicated status condition. For example, youwould choose this option if you wanted SiteScope to send you e-mail if one specific monitorreturned a warning status.
Disable or Enable Monitor(s)
Choose whether this action will enable or disable monitors. Remember that monitors are notautomatically enabled after a given period of time; therefore, if you disable monitors on anerror condition, you should add another Enable Monitors alert to re-enable them.You can choose any combination of groups and monitors to act upon from the Targets list -to select multiple items, hold down the Control key while clicking on additional items.
When
The number of times the alert conditions should be met before SiteScope executes the actionyou specified.Always, after the condition has occurred at least N times - After the condition occurs atleast N times, SiteScope executes the action every time the alert conditions are met. Type theminimum number of times the alert conditions must be met in the text input field. Once, after condition occurs exactly N times - SiteScope executes the action once, after the
Disable or Enable Monitor Alerts 193

conditions are met for the Nth time. Type the number of times the alert conditions must bemet in the text input field.Every E times, after condition occurs at least N times - Executes the alert action everymultiple of E, beginning after the condition has occured at least N times. For example,if Ewas set to 3, and N was set to 4, then the action would be triggered on the 6th, 9th, 12th, etc.occurrences of the condition. The alert is suppressed when the 3rd occurrence is detectedbecause N is greater than 3. After the condition occurs 4 times, the alert is sent after the nexttriggering condition that is a multiple of 3, in this example, the 6th occurrence. Choose thisoption by selecting the applicable radio button, entering the multiple (E) and the minimumnumber of times (N) the alert conditions must be met in the text input fields provided.Once, after N errors in this group - SiteScope executes the action only after any monitor inthe group has been in error exactly N consecutive times. Type the number of errors in thetext input field.Once, when all monitors of group are in error - SiteScope executes the action the firsttime all monitors in the group are in error.
Advanced Options
Using the Advanced Options, you can further filter which conditions should trigger an alert.
Disabled
This check box prevents the alert from executing the action, even if the conditions are met.This is useful for temporarily turning off alerts.
Name Match
This field allows you to make use of naming conventions for your monitors. You may enter aword or string that appears in the names of monitors in this field, and SiteScope will onlygenerate an alert if the name of the monitor in error contains this word or string. Forexample, entering Ping: triggers this alert only for monitors that have a name that contains"Ping:". The match is case sensitive.
Status Match
This field allows you to match on specific status readings returned by a monitor. Forexample, if you type timeout in this field, an alert will only be triggered by a monitor whichhas a status of "timeout." This match is case sensitive.
SiteScope User Guide
Completing the Disable or Enable Monitor(s) Alert Form 194

Show Quick Alert Report
The Show Quick Alert Report form allows you to create a one-time SiteScope alert report. This report willdisplay the alerts sent over the specified time period.
Completing the Quick Alert Form
To generate a quick management report, complete each section of the form as described below and then clickthe " View Alerts" button. The length of time that it takes to generate the report will vary depending upon thespeed of the Web server machine, the number of monitors to report on, and the selected report time period.
Time Period
Select the time period for which you want to view alerts.
Alert Type
Select the types of alerts that will be displayed in the report. You can use control-click (inmost browser) to select multiple types, or accept the All Types default to see all alerts sent.
Detail Level
Select the detail level for the alert report. Basic shows the time and summary information foreach alert. Detail for Failed Alerts shows detailed diagnostic output for any alerts that failed -all other alerts are shown with summary information. Detail for All Alerts shows the detailedalert output for all alerts in the report.
Example Report
Show Quick Alert Report 195
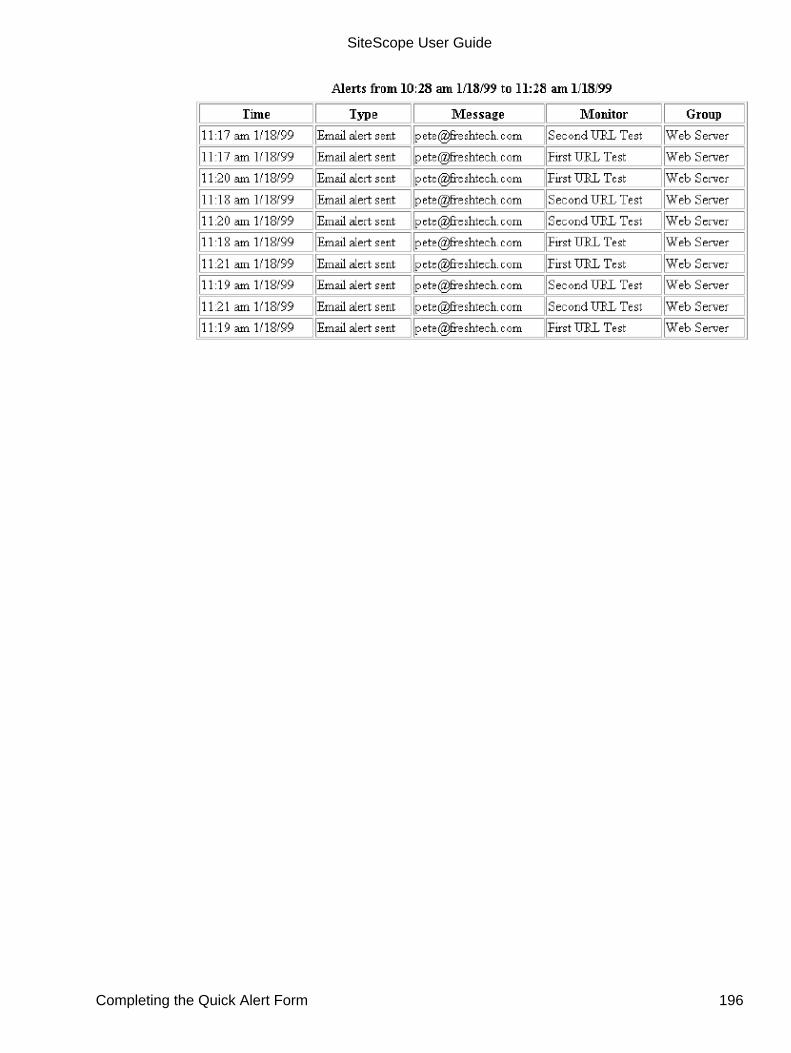
SiteScope User Guide
Completing the Quick Alert Form 196

Management Reports
Knowing the current status of parameters that SiteScope is monitoring is only half the battle. It is alsoimportant to know how monitored items have performed over time. SiteScope's comprehensive managementreports provide you with the information you need to see emerging trends and correct potential problemsbefore they become a crisis.
Because of SiteScope's broad range of monitoring capabilities, SiteScope management reports are alsovaluable to anyone in your organization that uses the Web as a message forum, including key management inSales, Marketing, PR, Customer Support, and Operations. Because it may not be necessary for people in theseareas to have the ability to make changes to SiteScope, you may use your Web server's security features torestrict their access to only the management report directories.
SiteScope gives you a wide range of reporting options. You can choose to generate a management report for asingle monitor, several monitors, or even several monitor groups. SiteScope management reports aregenerated in table format and may include bar charts or line graphs.
The management reports can be printed directly from the browser window. You can also save report data to atext file suitable for importing into a spreadsheet application. Bar charts and line graphs can alternately besaved individually as JPEG graphics. To save a graph or chart graphic, move your mouse pointer over theobject, right-click with the mouse, and select the Picture As"option.
Each time you choose to view a particular report, SiteScope reads the SiteScope log file and generates thereport based on the most recent information.
In this section we'll discuss:
• The Management Reports page.• What the default management reports are.• How to add management reports.• How to edit management reports.• How to delete management reports.
The Management Report Page
The SiteScope Management Report page contains a table that lists all defined management reports. SiteScopeautomatically creates two default management reports for both the Network and Server groups. If you findthese reports useful, you can keep them; otherwise, you can edit them to better meet your needs or, if youdon't need them, you can delete them. You can also add as many additional reports as you like.
Report Table
Management Reports 197
The report table contains the following columns:
Report
By default, this column contains the name of the report. Click the link in this field for accessto the Report page. The Report page contains a link to the most recently generated report aswell as a table that shows summary information for the ten most recently generated reports.There is also an option on this page to generate the management report immediately.
Time Period
This column contains the time period for which the historical data will be reported.
Edit
This column contains a link to the Update Management Report page. From this page you canedit the management report parameters.
Del
Click the X in this column to delete a management report.
Additional Links
The Management Reports page also contains the following links below the Report Table:
Add a new management report
Click this link to go to the Add Management Report page whereyou can define a newmanagement report.
Quick management report
Click this link to generate a quick management report. A quick management report isgenerated just once and cannot be saved to a text file.
View the Progress page
Click this link to go to the SiteScope Progress page. This page indicates which is the nextmonitor that will be run as well as a listing of the monitors that have run most recently.
View the Monitor Description report
Click this link to display a list of currently defined monitors and monitor names. You maychoose to view all defined monitors or all defined monitors in a particular group.
SiteScope User Guide
Report Table 198
Default Management Reports
SiteScope automatically creates two management reports for each of the default Network and Server monitorgroups. These reports provide historical information for the monitors in these groups over the last day andweek. You can leave the reports as they are, change them to meet your needs, or delete them altogether.
Click the link in the Report Subject(s) column to view a list of the ten most recently generated managementreports as well as summary information for each of the reports. Each report is listed by the date and time thereport was generated. To view an entire report, click the link in the Link to Report column. You'll find moreinformation about how the historical information is presented in Reading SiteScope Management Reports.
Adding Management Reports
You can add management reports for a single monitor, multiple monitors, or entire monitor groups. Whenyou add a management report, you set the report parameters. You choose which monitor or group of monitorsyou want to report on and over what time period. You can also choose to output the report to a text file forimport to a spreadsheet application such as Excel.
To create a management report:
1. Choose the Add a new management report link at the bottom of the Management Reports page. TheAdd Management Report page appears.
2. Complete the Add Management Report form.
3. Click the Add Management Report button. The Management Reports page appears with the newreport listed at the bottom of the report table.
To generate and view a management report immediately, click the link in the Report Subject(s) column onthe report table and choose the Generate This Report Now link. Otherwise you can wait to view a report untilafter the report's scheduled generation time.
Editing Management Reports
The parameters for a management report can be changed at any time. You can change the monitors you'regathering historical information for, the time period over which to report, and the scheduled generation time.
To edit a management report:
SiteScope User Guide
Additional Links 199
1. Click the Edit link in the report table for the management report you want to edit. The UpdateManagement Report form appears.
2. Complete the Update Management Report form.
3. Choose the Update Management Report link. The Management Report page appears and displays theupdated information.
Deleting Management Reports
There is no limit to the number of management reports you can have, but for ease of use you should probablydelete any reports that you no longer need.
Deleting management reports is easy. Simply click the X in the Del column for that report. A confirmationscreen appears. Click on the Delete Report button to complete the action.
SiteScope User Guide
Editing Management Reports 200

Adding a Management Report
The Add Management Report form allows you to create a new SiteScope management report. A SiteScopemanagement report displays historical information for one or more monitors or one or more groups ofmonitors. See the section on Reading Management Reports for additional information.
Completing the Add Management Report Form
To create a management report, complete each section of the form as described below and then click the"Add management report" link.
Report Subject(s)
You may choose to show the past performance of one or more groups of monitors or one ormore selected monitors. Select the monitor(s) you want included in the report from theselection list.
Time Period
Select the time period for which you want to view historical data. You may choose to showdata for the last day, week, or month. Daily reports are generated every day at the scheduledtime, weekly reports are generated on Sunday at the scheduled time, and monthly reports aregenerated on the first day of following the selected month so that they'll contain an entiremonth's worth of data.
Report Sections
The SiteScope Management reports can be customized to show key monitor data in differentformats. By default, SiteScope generates reports with four sections.Uptime and ReadingsA choice of graphical formatsTable of Monitor ReadingsListing of ErrorsA fifth report section, Listing of Alerts Sent, is also available, though normally disabled.You can choose to include or exclude each of these five report sections by checking orun-checking the check box next to the section title. A sixth option in this group allows you tochoose table and color formatting for the report.
For graph reports, use the pull-down box to choose either a bar chart or one of the line graphformats described below. A bar graph is generated using standard HTML, so it can be printedfrom all browser types. Line graphs are generated using a java applet and may not printdirectly from all browsers. Read About Line Graphs for more information about this type ofgraph.
♦ bar graph - one graph per measurement: This bar graph displays a single type of
Adding a Management Report 201

measurement for one monitor during a specified time frame. For example, this type of graphis useful for displaying information like CPU usage over a given period of time.
♦ line graph - one graph per measurement: This line graph displays a single type ofmeasurement for a single monitor during a specified time frame. Like the bar graph, this typeof graph is useful for displaying CPU usage, URL round-trip times, and other items you'reinterested in measuring over time.
♦ line graph - one graph per monitor: This line graph plots all the readings from a singlemonitor on one graph. This is useful when you want to compare the readings against oneanother. For example, this type of graph would be very useful in comparing the stepsexecuted by a URL Transaction Monitor.
♦ line graph - one graph per type of measurement: This line graph plots a single type ofmeasurement gathered by several different monitors. For example, you can use this type ofgraph to plot the URL round trip times returned by several different URL monitors.
♦ line graph - one graph for all measurements: Using this option, you may select multipleinstances of similar monitors and display all measurements from those monitors on a singlegraph. The monitor data is grouped for the monitors selected and line graphs are generatedfor each type of monitor in the group. If all of the monitors selected for the report are of thesame type, for example URL monitors, then one line graph is generated with a line for eachof the monitors. If different types of monitors are selected, such as CPU and Memorymonitors, separate line graphs are created for each type of monitor in the group.
Send Report by E-mail
E-mailYour may choose to forward reports by e-mail. Enter the e-mail address(es) to which thisreport should be sent each time its generated. To send the reports to multiple e-mailaddresses, separate the e-mail addresses with commas.
Send using HTML formatSelect this option box if you want the report(s) sent in HTML format. Use this option to include theSiteScope report graphics. If you do not select this option only a text summary of the report is sent.
TemplateSelect a template for SiteScope to use to create the e-mail message. You can choose from:
♦ HistoryLongMail - Choose this option to send a detailed history report. It contains both userand administration links.
♦ HistoryMail - This is the default option.♦ HistoryMailAlertDetail - Choose this option to have all alerts included in the report that's
e-mailed.♦ HistoryMailAttachment - Choose this option to send the report as an attachment.♦ HistoryMailNoLinks - Choose this option to send the report without any links in it.♦ HistoryUserMail - Choose this option for users without SiteScope administration privileges.
Report Title (optional)
Enter a name for this report. This name will appear at the top of each report and on the reportlist. If you don't specify a name here, SiteScope will use a default name.
SiteScope User Guide
Completing the Add Management Report Form 202
Advanced Options
Show Detail
If this box is checked, the all of the information gathered for each monitor is displayed on thereport. Otherwise, only the primary data is displayed for each monitor. For example, on aURL Transaction Monitor, if this box is checked, the timing information for each step in thetransaction will be displayed in the report.
Disable
Check this box to temporarily disable this report. To enable the report again, un-check thebox.
Generate comma-delimited file
Check this box to save a generated management report to a comma-delimited text file whichyou can then import into a spreadsheet application. SiteScope automatically saves these filesin the ~SiteScope/htdocs directory. To find the exact location of the saved file on yourmachine, choose the Reports button on the SiteScope navigation bar and click the link forthis report in the Report Subject column to go to the Report page. The full path to the filewill be listed in parenthesis directly underneath the title on this page. If you enter an e-mailaddress in the e-mail text entry area, SiteScope will send a copy of the comma-delimited fileto that address.
Time Scale
The time scale option allows you to choose the time interval between monitor readings. Bydefault, SiteScope uses automatic scaling. When automatic scaling is used, SiteScopedetermines how many readings were taken over the chosen time period for the givenmonitor(s) and then selects an appropriate interval for the management report. The Scaleoption allows you to choose intervals that range from once every minute to once a day.
Vertical Scale
The vertical scale option allows you to choose the maximum value displayed on a graph. Bydefault, SiteScope will use the maximum sample value. Choosing a specific scale value willmake it easier to compare graphs from different monitors and times.
End Time
By default SiteScope generates reports starting at the indicated time and ending at the timethe report was generated. You may choose an alternate end time by selecting a time from thedrop-down menu.
Schedule
Indicate the time that you want SiteScope to generate this management report. The report
SiteScope User Guide
Completing the Add Management Report Form 203

will contain information for the last day, week, or month, ending at the time the report is run.For example, if a daily report is generated at 24:00 (midnight), it will contain data generatedbetween midnight the previous day and midnight of the current day.
SiteScope User Guide
Advanced Options 204

Editing a Management Report
The Update Management Report form allows you to edit a SiteScope management report. You can add ordelete monitors from the report, as well as change which data is shown, how the data is displayed, and thetime period to be reported on. Making changes to a management report will become effective for futurereports. Previously generated reports will continue to reflect the format and content choices that were ineffect when they were generated.
Completing the Update Management Report Form
To edit a management report, complete each section of the form as described below and then click the"Update management report" link.
Report Subject(s)
You may choose to show historical data for one or more groups of monitors or one or moreselected monitors. Select the monitor(s) you want included in the management report fromthe selection list.
Time Period
Select the time period for which you want to view historical data. You may choose to showdata for the last day, week, or month. Daily reports are generated every day at the scheduledtime, weekly reports are generated on Sunday at the scheduled time, and monthly reports aregenerated on the first day of following month so that they'll contain an entire month's worthof data.
Report Sections
Use the check boxes and drop-down menus in the Report Sections to control how SiteScopeReports are displayed. The options available in this section include: Summary of Uptime and Readings Graph type selection Table of Monitor Readings Listing of Errors Listing of Alerts Sent - Detail-Level Formatting
Check the Summary of Uptime and Readings to have SiteScope provide a summary ofserver uptime statistics and status readings. This option is selected by default
Use the graph type selection drop-down menu to select how the report should be displayed.A bar graph is generated using standard HTML, so it can be printed from all browser types.Line graphs are generated using a java applet and may not print from all browsers. ReadAbout Line Graphs for more information about this type of graph. The following is a list
Editing a Management Report 205

describing the graph type options bar graph - one graph per measurement: This bar graph displays a single type ofmeasurement for one monitor during a specified time frame. For example, this type of graphis useful for displaying information like CPU usage over a given period of time.line graph - one graph per measurement: This line graph displays a single type ofmeasurement for a single monitor during a specified time frame. Like the bar graph, this typeof graph is useful for displaying CPU usage, URL round-trip times, and other items you'reinterested in measuring over time. line graph - one graph per monitor: This line graph plots all the readings from a singlemonitor on one graph. This is useful when you want to compare the readings against oneanother. For example, this type of graph would be very useful in comparing the stepsexecuted by a URL Transaction Monitor.line graph - one graph per type of measurement: This line graph plots a single type ofmeasurement gathered by several different monitors. For example, you can use this type ofgraph to plot the URL round trip times returned by several different URL monitors. line graph - one graph for all measurements: Using this option, you may select multiplemonitors and display all measurements from those monitors on a single graph.
Select the Table of Monitor Readings box to have the SiteScope monitor status readingsdisplayed in a table format. This option is selected by default.
Check the Listing of Errors box to have SiteScope include a listing of errors in the report.This option is selected by default.
Select the List of Alerts Sent - Detail Level to have SiteScope include a listing of alerts thathave been sent and use the drop-down menu to choose the detail of the report.
Use the Formatting drop-down menu to select options that control how SiteScope willformat report tables (background color and table borders).
Send Report by e-mail
SiteScope Management Reports can be sent by e-mail. Fill in the E-mail address where youwant SiteScope to send e-mail reports. Check the Send using HTML format box if youwant the reports sent with HTML tables and graph images. If you leave this check boxun-checked the reports will be sent as text summaries. If you choose text format reports, usethe Template format drop-down menu to select a text format template to use for the report.
Report Title
Use the Title and Description text fields to enter your own title and description for the reportyou are creating. If you leave these fields blank SiteScope will create a title that describes thecontent of the report.
Advanced Options
SiteScope User Guide
Completing the Update Management Report Form 206

Show Detail
By default, SiteScope shows only the primary reading for a each monitor. Check this box ifyou want to graph all of the readings for each monitor.
Disable
Check this box to temporarily disable this monitor and any associated alerts. To enable themonitor again, un-check the box.
Generate Comma-Delimited File
Check this box to save a generated management report to a comma-delimited text file whichyou can then import into a spreadsheet application. SiteScope automatically saves these filesin the ~SiteScope/htdocs directory. To find the exact location of the saved file on yourmachine, choose the Reports button on the SiteScope navigation bar and click the link forthis management report in the Report Subject column to go to the Report page. The full pathto the file will be listed in parenthesis directly underneath the title on this page.
Time Scale
The time scale option allows you to choose the time interval between monitor readings. Bydefault, SiteScope uses automatic scaling. When automatic scaling is used, SiteScopedetermines how many readings were taken over the chosen time period for the givenmonitor(s) and then selects an appropriate interval for the management report. The Scaleoption allows you to choose intervals that range from once every minute to once a day.
Vertical Scale
The vertical scale option allows you to choose the maximum value displayed on a graph. Bydefault, SiteScope will use the maximum sample value. Choosing a specific scale value willmake it easier to compare graphs from different monitors and times.
End Time
By default SiteScope generates reports starting at the indicated time and ending at the timethe report was generated. You may choose an alternate end time by selecting a time from thedrop-down menu.
Schedule
Indicate the time that you want SiteScope to generate this management report. Themanagement report will contain information for the last day, week, or month, ending at thetime the report is run. For example, if a daily report is generated at 24:00 (midnight), it willcontain data generated between midnight the previous day and midnight of the current day.
SiteScope User Guide
Advanced Options 207
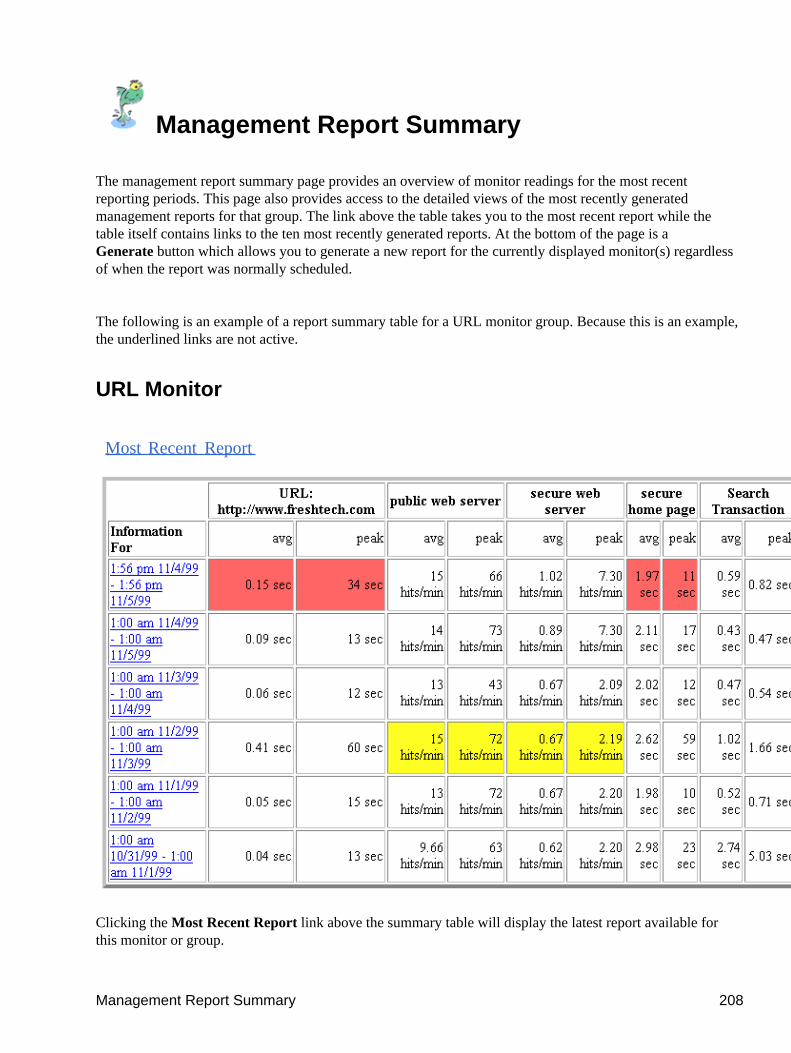
Management Report Summary
The management report summary page provides an overview of monitor readings for the most recentreporting periods. This page also provides access to the detailed views of the most recently generatedmanagement reports for that group. The link above the table takes you to the most recent report while thetable itself contains links to the ten most recently generated reports. At the bottom of the page is aGenerate button which allows you to generate a new report for the currently displayed monitor(s) regardlessof when the report was normally scheduled.
The following is an example of a report summary table for a URL monitor group. Because this is an example,the underlined links are not active.
URL Monitor
Most Recent Report
Clicking the Most Recent Report link above the summary table will display the latest report available forthis monitor or group.
Management Report Summary 208
The Report column contains date coded links to previously generated reports. The link to the report isactually the date and time the report was generated. For example, in the table above, the first report linkcontains the following information: 1:00am 9/23/99 - 1:00am 9/24/99. This link would display the reportgenerated at 1:00am on September 24, 1999. SiteScope uses a 24 hour clock, so if this report had beengenerated at 1:00 P.M. on September 24, 1999, the link would have read 13:00pm 9/23/99 - 13:00pm9/24/99.
Each report is stored with the content and formatting that was in effect when the report was generated. If youupdate a report format, the changes will only apply to future reports. Changes are not retroactive to previousreports.
To the right of the Report column you'll see columns headed with the names of the monitors being reportedon. Each monitor includes two columns of data: avg and peak.
The peak column contains the highest reading returned for each monitor during the reporting period. Forexample, if three readings of 7, 4, and 13 were returned for a particular monitor during this time period, thepeak column would contain the number 13 because it was the highest number returned. To help you quicklyspot values that are in the warning or error range defined for that monitor, the background color of the cellswith readings in these ranges are colored red or yellow, with red indicating an error status and yellow awarning status.
The avg column contains the average of all the readings returned during the report time period. The averageis the sum of all readings returned during the report time period divided by the number of readings taken.
For example, if three readings of 7, 4, and 13 were returned during this time period, the avg column wouldcontain the number 8, which is the average of these three numbers. To help you quickly spot values in thewarning or error range, the background color in cells with readings in these ranges are colored red or yellow,with red indicating an error status and yellow a warning status.
SiteScope User Guide
URL Monitor 209
Reading Management Reports
SiteScope management reports provide status information for one or more monitors over a given period oftime. When you add a management report you specify when or how often you want SiteScope toautomatically generate the report. The reports are generated from current monitor readings and previousreadings recorded in the SiteScope log data
There are a number of ways that you can access management reports. To view custom management reportsthat you have created and the SiteScope default management reports, click on the Report button on thenavigation bar from anywhere within SiteScope. This brings up the Management Reports page. Click on thename of the monitor or monitor group that you want to view to bring up the Management ReportSummary page. The dated links in the left hand column of the summary table are links to the applicablereports for the date indicated.
To view the default management report for an individual monitor, go to the group page and click themonitor's name in the monitor table. This generates a management report for the individual monitor using thedefault report format.
You can generate a management report at a time other than the scheduled time by going to the SiteScopeManagement Reports page. On the Management Reports table, click the named link in the Report column ofthe table for the report you want to generate. This takes you to the Management Report page for that group ormonitor. Choose the Generate button at the bottom of the page to generate an update to that report.
Another way to generate a report is to use the Quick management report link Management ReportSummary page. The Quick management report allows you to select monitors and groups as well as a numberof parameters to define a one-time management report. The selections you make are not saved for future use.
The Management Report Format
Each management report includes up to five optional report sections. These are:
1. Uptime and Readings2. Readings in Graphical Format
a. Bar Graph Formatb. Line Graph Format
3. Readings in Table Format4. Error Listing5. Alert Listing
By default, the first four sections are enabled for every report. The content of each report will reflectselections made when the report was defined in the Add Management Report page. Each of the reportsections may be enabled or disabled by select/de-select check boxes on the Update ManagementReports form.
Reading Management Reports 210
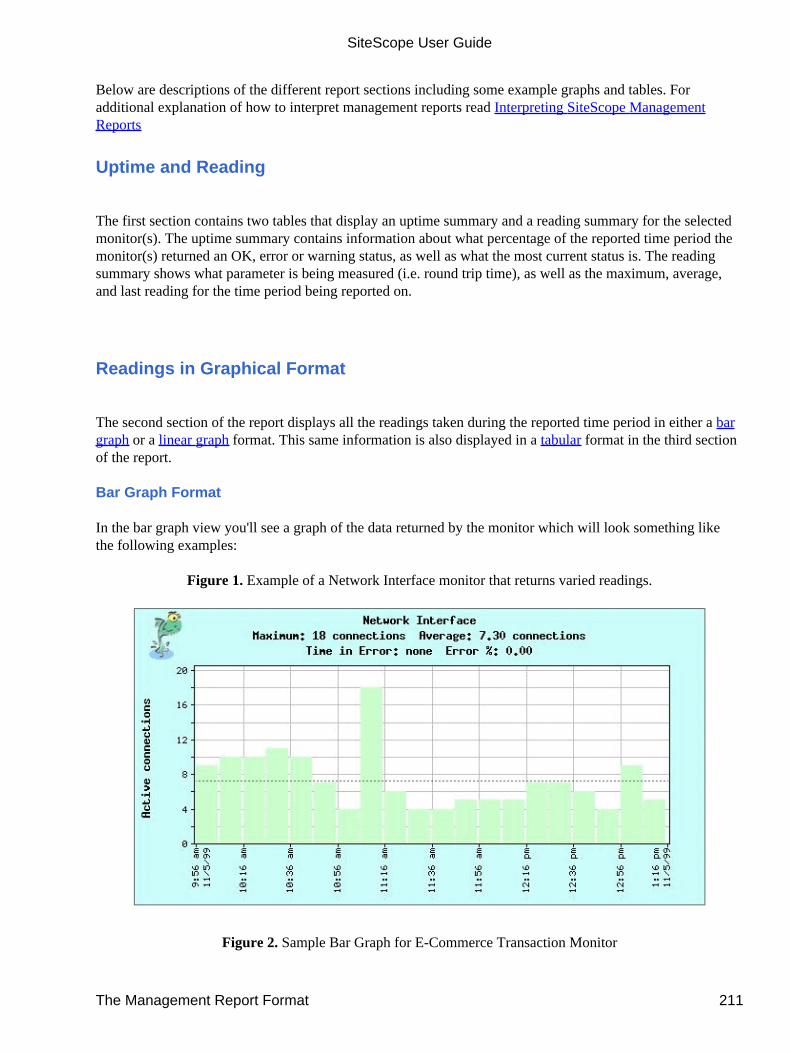
Below are descriptions of the different report sections including some example graphs and tables. Foradditional explanation of how to interpret management reports read Interpreting SiteScope ManagementReports
Uptime and Reading
The first section contains two tables that display an uptime summary and a reading summary for the selectedmonitor(s). The uptime summary contains information about what percentage of the reported time period themonitor(s) returned an OK, error or warning status, as well as what the most current status is. The readingsummary shows what parameter is being measured (i.e. round trip time), as well as the maximum, average,and last reading for the time period being reported on.
Readings in Graphical Format
The second section of the report displays all the readings taken during the reported time period in either a bargraph or a linear graph format. This same information is also displayed in a tabular format in the third sectionof the report.
Bar Graph Format
In the bar graph view you'll see a graph of the data returned by the monitor which will look something likethe following examples:
Figure 1. Example of a Network Interface monitor that returns varied readings.
Figure 2. Sample Bar Graph for E-Commerce Transaction Monitor
SiteScope User Guide
The Management Report Format 211

Each bar represents a fraction of the total reporting time period. This fraction of time is variable and dependsupon the total length of time for which the data is being reported as well as the scale that you chose for thereport. If you didn't indicate a scale when you created the report, SiteScope will automatically choose anappropriate scale based upon the number of readings for the monitor over the entire report period.
The height of the bar represents the monitor's reading during that portion of the report period. If the monitorran more than once during this time, the height represents the average reading. If you didn't indicate a scalewhen you created the report, SiteScope will scale the heights based on the maximum reading. The color ofthe bar indicates what status that reading indicates, with red representing an error status, yellow a warningstatus, and green an OK status.
Some bars may have also have a gray colored portion above the status color. This represents the peak readingduring that time period. If the peak reading is the same as the average status, the gray bar won't be present.No bar means that that no reading was taken during that period of time.
The title block of each bar graph may contain the following additional historical information:
Maximum
This is the highest reading returned during the entire reporting period.
Average
This is the average of all of the readings returned during the entire reporting period.
Time In Error
This is the total amount of time that the monitor was in error during the reporting period.
Error %
SiteScope User Guide
Readings in Graphical Format 212

This is the percent of time that the monitor was in error during the reporting period.
Line Graph Format
Line graph reports are shown using a Java applet. Unlike bar graphs, line graphs can show multiple items ona single graph as well as individual measurements. They cannot, however, be printed directly from mostbrowsers.
Figure 3. Sample Line Graph for a Server Monitor
Line graphs can be created in a Quick Report, or can be scheduled to run, just like bar graphs. Line graphs arenot generated for reports that are triggered from the monitor name link on the Monitor Detail page.
The line graph shows the type of measurement, with the vertical scale on the far left and the time scale at thebottom. When the line graph is displayed as small squares connected by lines, each square represents anindividual sample (see figure 1). Monitors that are sampling less often have more widely separated samplesthan those that sample more often.
As with the bar graph format, the title block of the line graph contains includes the maximum reading,average reading, Time in Error, and error percentage for the period. If the readings for more than one monitorare displayed on a single graph, the color legend at the bottom of each graph shows the name of the monitorrepresented by that color and the average and maximum values for that monitor over the graphed time period.
The Error section (see figure 2 for an example) shows the period of time that the monitor was in error, andthus, has no value for display in the main graph area. Error bars are color coded to match the monitors theyrepresent.
When there are too many samples to show separately on a graph, such as on the monthly graph shown in
SiteScope User Guide
Readings in Graphical Format 213

figure 2, the line chart displays a modified bar chart. In this case, the height of the solid colored linesrepresents an average of several values for each interval on the graph. The dashed lines represent themaximum values for each interval on the chart.
Readings in Table Format
The historical information of monitor readings is available in a tabular format in the third section of thereport. An example of this section is shown below:
As in the graphical view, the total reporting period is divided into equal fractions of the total reporting period.If you chose a specific time increment using the scale option, that will be used; otherwise SiteScope willchoose an appropriate scale based on the number of readings taken over the course of the entire reportingperiod.
The values reported for each time period may or may not reflect actual values returned by the monitor. If onlyone reading was taken during that segment of time, the value listed will reflect that reading; otherwise, the
SiteScope User Guide
Readings in Graphical Format 214

value will be an average of all readings taken during that time. If the monitor returns only an OK or failstatus, the value will reflect the "worst" status reported during that segment of time.
There may be times that you see blank entries. This indicates that no readings were available for that portionof the reporting period. This doesn't mean that the monitor wasn't running correctly - only that the monitorwas running less frequently than the length of the time increments on the management report.
Error Listing
The fourth section of the report contains a list of up to the last 100 errors generated for the monitors includedin the report. The Error Listing section displays the time that each error was detected by SiteScope. The nameof the monitor that was in error and the status are also listed. This allows you to see at a glance how themonitors described in this report performed during the reported time period. If no errors were generated, thatwill be indicated as well.
Alert Listing
The Alert Listing details the Alerts that were generated for the monitor(s) during the reported time period. Inaddition to the time the alert was generated, you can also see what type of alert was generated (pager, email,SNMP, or script), the message that was sent, the name of the monitor and the group to which it belongs.
It's easy to look at the Error Listing and compare it with the Alert listing to see if alerts were generatedappropriately. If an error was detected but no alert was generated, it's very likely that you don't have youralerts defined properly. Go back and check them out.
SiteScope User Guide
Readings in Table Format 215
Interpreting Management Reports
SiteScope provides you with a lot of great information about your Web environment, but what does it allmean? Should you be happy with SiteScope's findings, or should you be trying to implement improvements.And what if there's a problem - what then?
How you interpret a SiteScope report is dependent upon the item being monitored. To keep things simple,we'll divide the eight SiteScope monitors into two groups: network dependent monitors and networkindependent monitors. The first group consists of the DNS, URL, Mail, and Ping monitors, all of whichdepend on network connectivity. The second group consists of the Disk Space, CPU, Service, and WebServer monitors.
An ideal report for all monitors has all green bars with values in an acceptable range. For network dependentmonitors the values should be less than a couple of seconds. For network independent monitors, acceptablevalues will vary. A graph like this means that your site has high availability and is performing well. Good foryou!
Let's say you don't live in a perfect world though, and you see errors (red bars) in your SiteScope reports.The first step is to understand what the errors mean. First, ignore any errors that you were already expectingto see. For example, if your system crashed and you were down for a short time, you would expect to seeerrors in your reports and you wouldn't need to look any further for a cause. Now you're ready to deal withthe other errors you're seeing.
Now you need to determine what type of error you're looking at. There are two basic causes of errors:component failure and capacity overload.
Component Failure
Component failure means something different for network dependent and independent monitors. For networkdependent monitors, it's when one of the many pieces necessary to handle requests is down for a period oftime. For network independent monitors, it's when the monitored item itself is down. These errors show up asa block of several errors in a row for the duration of the problem. For example, if the web server processcrashes, a report for a URL monitor will show a series of red bars until it's started again.
Interpreting Management Reports 216

To determine where component failure is occurring for network dependent items, do a traceroute todetermine if the errors were caused by your server, your network, your ISP, or the internet backbone. Thenecessary corrective action will depend on where you determine the problem is occurring.
For network independent items, first set up an Alert that automatically initiates corrective action to minimizeany impact on users. Next, analyze your reports to see if there's a pattern of failure. For example, if you haveprocess that is continually crashing, check to see if there are any consistent factors associated with thecrashes, like another process starting up, etc.
Capacity Overload
Capacity overload is when an error occurs because some part of your site has reached capacity. For networkdependent items these errors appear one at a time on graphs because while most requests are handledcorrectly, some of them are refused. This type of problem can also show up as increased response times.Often you'll notice the increase occurs at the same time every day. For example, if your T1 line is at capacityevery morning, you'll see higher response times and possibly an error or two on your reports.
For network independent items, these errors can appear as either spikes or continuous high readings on thegraph. These high readings may correspond directly to errors reported by other monitors.
SiteScope User Guide
Component Failure 217
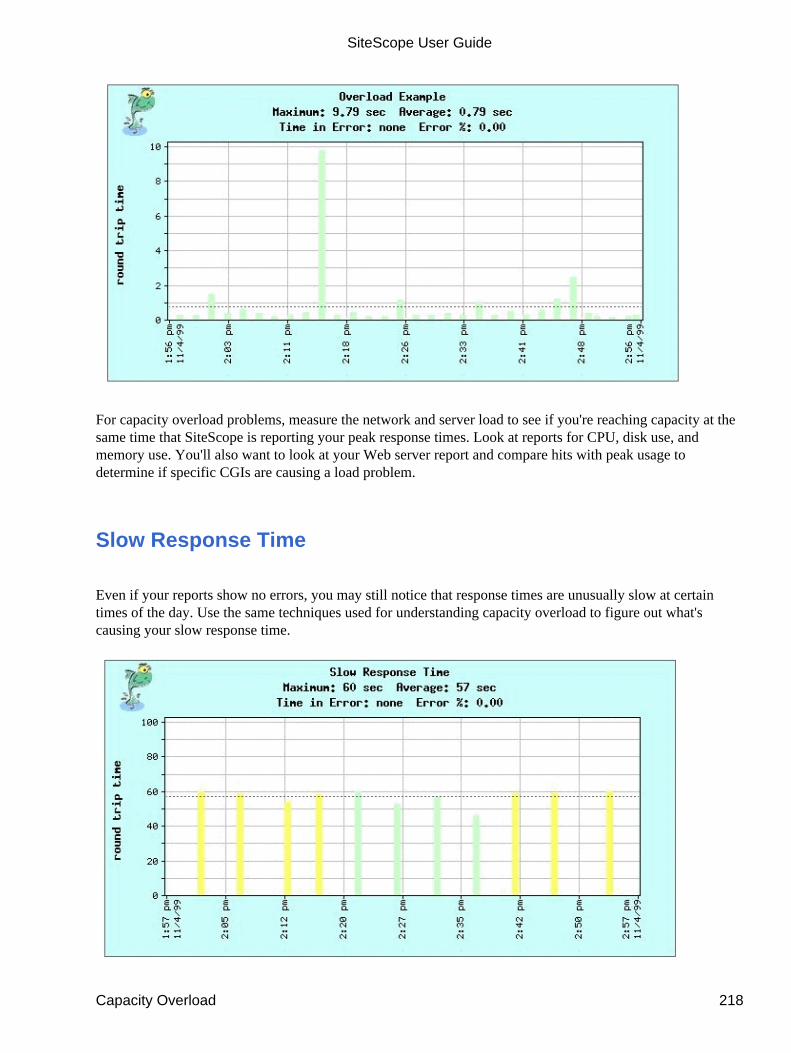
For capacity overload problems, measure the network and server load to see if you're reaching capacity at thesame time that SiteScope is reporting your peak response times. Look at reports for CPU, disk use, andmemory use. You'll also want to look at your Web server report and compare hits with peak usage todetermine if specific CGIs are causing a load problem.
Slow Response Time
Even if your reports show no errors, you may still notice that response times are unusually slow at certaintimes of the day. Use the same techniques used for understanding capacity overload to figure out what'scausing your slow response time.
SiteScope User Guide
Capacity Overload 218

Check to see if you're reaching capacity at the times that SiteScope is reporting slow response times. Look atreports for CPU, disk use, and memory use on the server, and do some log analysis to determine if CGIs arecausing the problem
SiteScope User Guide
Slow Response Time 219
Show Quick Management Report
The Show Quick Management Report form allows you to create a one-time SiteScope management report.This report will be generated immediately and will be displayed in both a text and graph format, but it willnot be automatically saved. If you'd like to retain a quick management report, you'll have to save it using theFile/Save As command on your browser. To get to the Quick Management Report form, click theReports button on the navigation bar and then choose the "Quick management report" link. This displays theShow Quick Management Form.
Completing the Quick Management Form
To generate a quick management report, complete each section of the form as described below and then clickthe "Show Quick Management Report" link. The length of time that it takes to generate the report will varydepending upon the speed of the Web server machine, the number of monitors to report on, and the selectedreport time period.
Report Subject(s)
You may choose to report on a single monitor, several monitors, or even several monitorgroups. Select whatever report subjects you want in the selection window.
Time Period
Select the time period for which you want to view historical data.
Report Type
Select how the report should be displayed, choosing the sections of information that will beincluded in the report. The possible sections to be included are: Summary of Uptime and Readings - a summary of uptime percentage, error percentage,and the average and maximum of the monitor readings shown over the specified time period.Graph Type - Bar graphs are the only reports that can be printed. Line graphs, displayedusing a java applet, are useful for showing several measurements on one graph but cannot beprinted with many browsers. Read Creating Line Graphs for more information about thistype of graph. The Comma-delimited type is useful for importing into other tools like Excelor a database.Table of Monitor Readings - a tabular view of the monitor readingsListing of Errors - a listing of the error readings taken over the time period of the report.Listing of Alerts Sent - lists alerts sent over the time period for any of the monitors in thereport. The Detail Level controls the amount of information printed for each alert.Basicshows the time and summary information for each alert. Detail for Failed Alerts showsdetailed diagnostic output for any alerts that failed - all other alerts are shown with summaryinformation. Detail for All Alerts shows the detailed alert output for all alerts in the report.
Show Quick Management Report 220

Advanced Options
Show Detail
Check this box to have the full detail of monitor readings displayed on the report. Leavingthis box un-checked will display only the summary data.
Time Scale
The time scale option allows you to choose the time interval between monitor readings. Bydefault, SiteScope uses automatic scaling. When automatic scaling is used, SiteScopedetermines how many readings were taken over the chosen time period for the givenmonitor(s) and then selects an appropriate interval for the management report. The Scaleoption allows you to choose intervals that range from once every minute to once a day.
Vertical Scale
The vertical scale option allows you to choose the maximum value displayed on a graph. Bydefault, SiteScope will use the maximum sample value. Choosing a specific scale value willmake it easier to compare graphs from different monitors and times.
Report Title
Fill in the optional Report Title and Description text fields to identify the report you arecreating. If you leave these fields blank SiteScope will create a title that is descriptive of thereport content.
SiteScope User Guide
Advanced Options 221

Monitor Description Report
The Monitor Description report contains detailed information about the monitors defined in one or moremonitor groups. You can use this report to view information on groups of monitors.
Completing the SiteScope Monitor Description Report Form
To display the SiteScope Monitor Description Form, choose the Reports button on the navigation bar andclick the View the Monitor Description report link, located at the bottom of the Reports page. This brings upthe the SiteScope Monitor Description Report Form.
Complete the fields on the SiteScope Monitor Description Form as follows:
Monitor selection box
Choose the groups of monitors that you'd like the report to include. Hold down the shift keyto select multiple groups.
Show Parameters
Check this box if you want the report to contain the parameters defined for each monitor.
When all the fields are complete, click the Show Report button to generate the report.
Reading the SiteScope Monitor Description Report
Monitor Description Report is presented in a table format. The columns in the report include the followinginformation:
1. Group to which the monitor belongs2. Name of the monitor3. The frequency at which it is run4. Whether or not this monitor is disabled5. The schedule this monitor is tied to6. A description of the parameters defined for the monitor
Below is an example of a Monitor Description Report for the Server group running on Windows NT.
Monitor Description Report 222
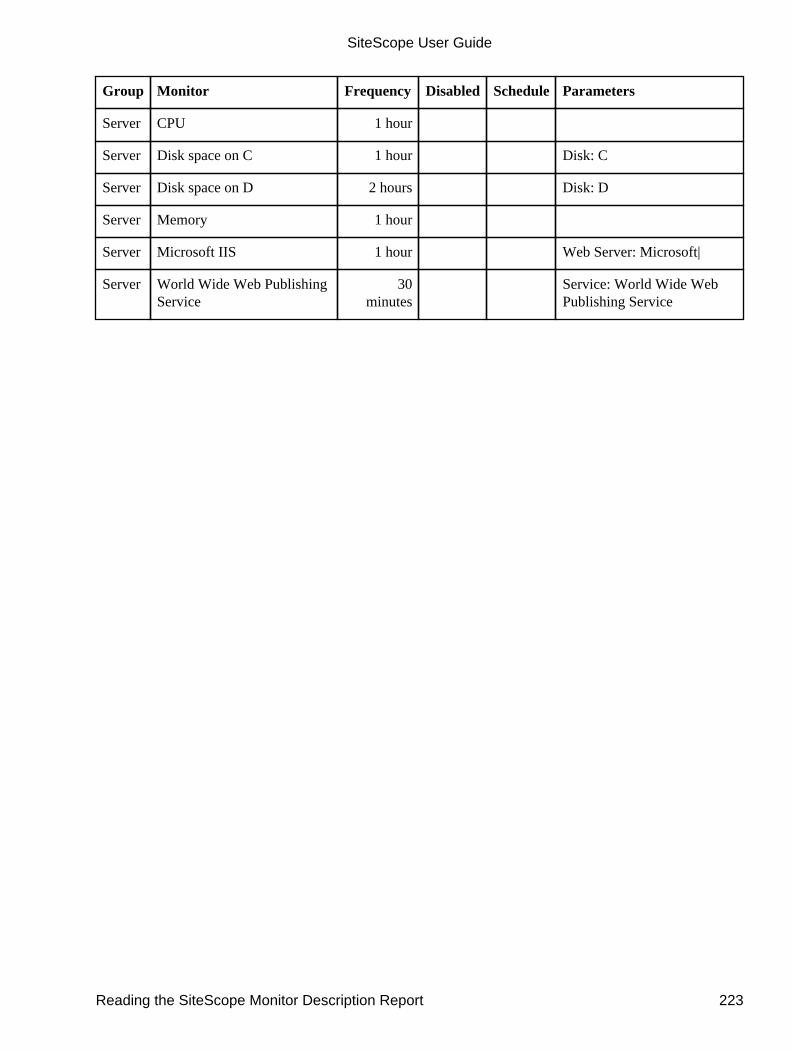
Group Monitor Frequency Disabled Schedule Parameters
Server CPU 1 hour
Server Disk space on C 1 hour Disk: C
Server Disk space on D 2 hours Disk: D
Server Memory 1 hour
Server Microsoft IIS 1 hour Web Server: Microsoft|
Server World Wide Web PublishingService
30minutes
Service: World Wide WebPublishing Service
SiteScope User Guide
Reading the SiteScope Monitor Description Report 223
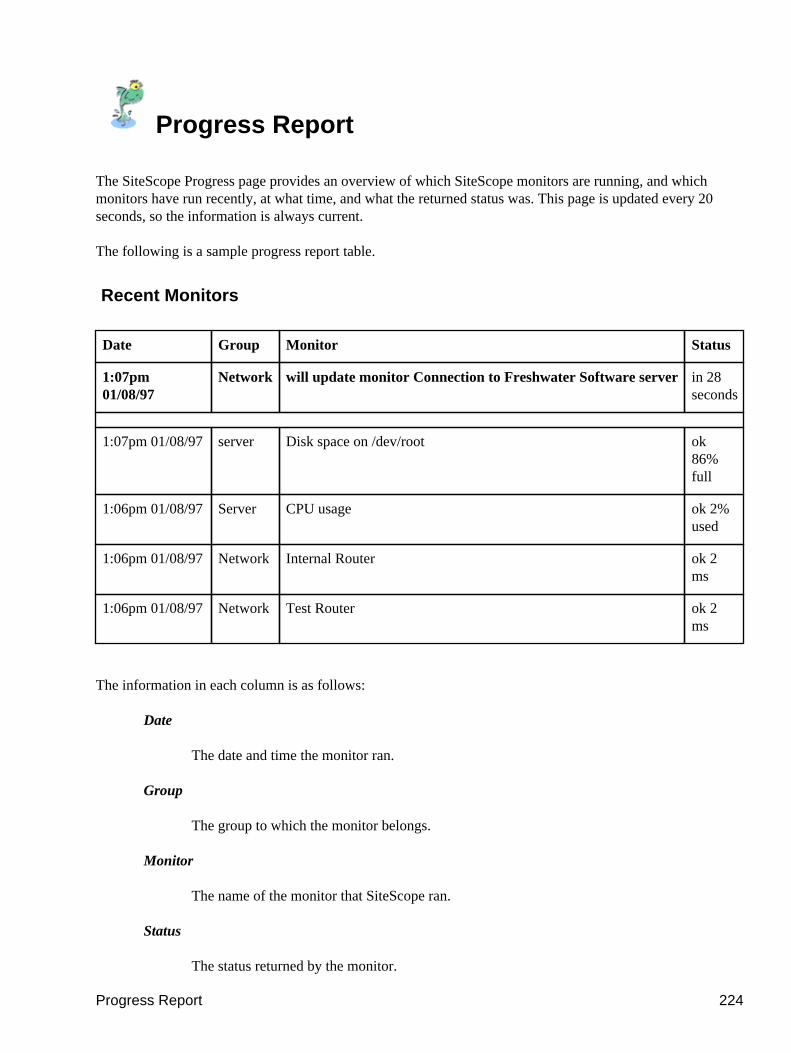
Progress Report
The SiteScope Progress page provides an overview of which SiteScope monitors are running, and whichmonitors have run recently, at what time, and what the returned status was. This page is updated every 20seconds, so the information is always current.
The following is a sample progress report table.
Recent Monitors
Date Group Monitor Status
1:07pm01/08/97
Network will update monitor Connection to Freshwater Software server in 28seconds
1:07pm 01/08/97 server Disk space on /dev/root ok86%full
1:06pm 01/08/97 Server CPU usage ok 2%used
1:06pm 01/08/97 Network Internal Router ok 2ms
1:06pm 01/08/97 Network Test Router ok 2ms
The information in each column is as follows:
Date
The date and time the monitor ran.
Group
The group to which the monitor belongs.
Monitor
The name of the monitor that SiteScope ran.
Status
The status returned by the monitor.
Progress Report 224
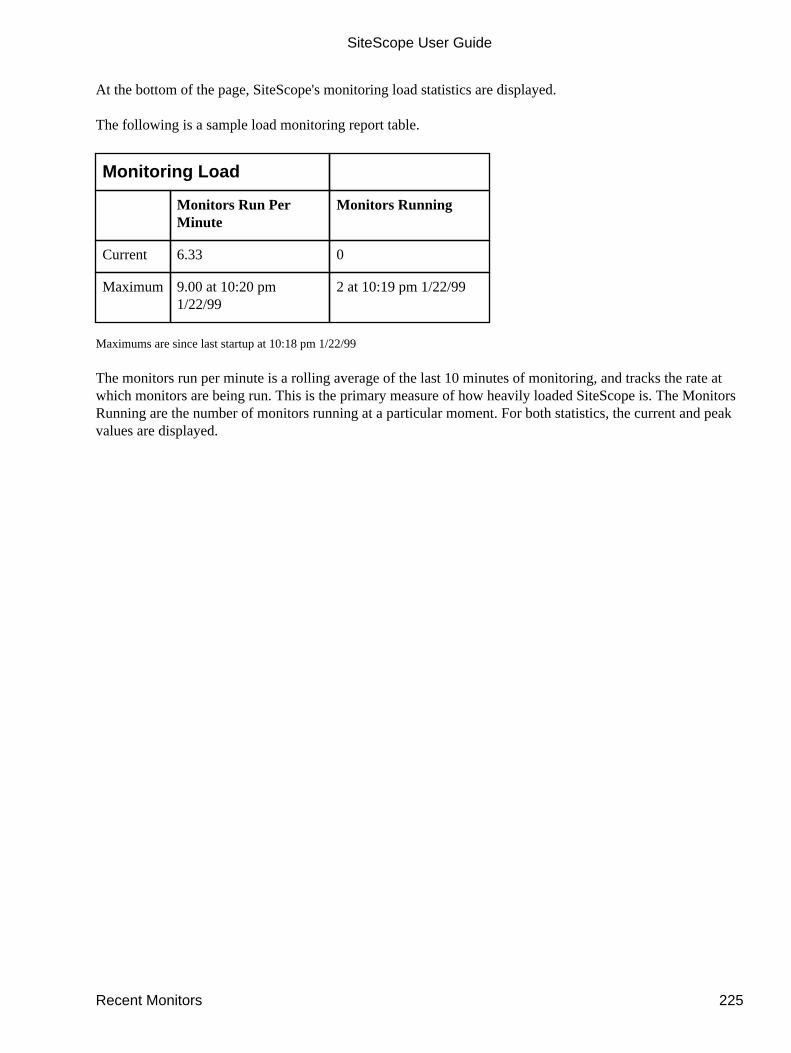
At the bottom of the page, SiteScope's monitoring load statistics are displayed.
The following is a sample load monitoring report table.
Monitoring Load
Monitors Run PerMinute
Monitors Running
Current 6.33 0
Maximum 9.00 at 10:20 pm1/22/99
2 at 10:19 pm 1/22/99
Maximums are since last startup at 10:18 pm 1/22/99
The monitors run per minute is a rolling average of the last 10 minutes of monitoring, and tracks the rate atwhich monitors are being run. This is the primary measure of how heavily loaded SiteScope is. The MonitorsRunning are the number of monitors running at a particular moment. For both statistics, the current and peakvalues are displayed.
SiteScope User Guide
Recent Monitors 225

Preferences
SiteScope allows you to set several types of preferences: general, SNMP, pager, and e-mail. Generalpreferences are related to the SiteScope built-in Web server. SNMP preferences allow you to set theparameters that SiteScope uses when sending an SNMP trap message. Pager and e-mail notificationpreferences allow you to tell SiteScope how to contact you via pager and e-mail.
To get to the General Preferences page, choose the General Preferences link on the SiteScope main panel. Toreach the SNMP, pager, and e-mail preference pages, choose the Alert option on the SiteScope navigation barto display the Alert Detail page. Beneath the alert table you'll see three links that take you to these preferencepages.
For more information about how to set the various preferences, choose the appropriate link below:
• general preferences• pager preferences• mail preferences• SNMP preferences
Preferences 226
General Preferences
The General Preferences page gives you access to a number of other pages that allow you to set variouspreferences for SiteScope. This includes E-mail, Pager, Log, and User account configurations.
The General Preferences page itself is where you enter your SiteScope license information and where you canchoose to use a web server other than the built-in server which is part of the SiteScope package. If you chooseto use the SiteScope server, you can specify a port and access privileges for the server so you can restrictaccess to SiteScope. If you choose not to use the SiteScope Web server and instead want to use a stand-aloneWeb server, you'll need to refer to the instructions for how to set up your server to serve SiteScope pages.
Completing the General Preferences Form
Complete the form as indicated below and then click the Save Changes button located at the bottom of thepage.
License Number
Enter your SiteScope license number to register your SiteScope monitors. This number isissued to you when you purchase a set of monitors. You must purchase a license if youintend to use SiteScope beyond the trial period. If you have multiple installations ofSiteScope you will need to enter the same license number in each of your SiteScopeinstallations.
IP Addresses Allowed Access
You can restrict the IP addresses that are allowed access to the SiteScope Web server byentering which IP addresses should be allowed access. You can use a wildcard at the end ofthe IP address to indicate a range of addresses. For example, 206.168.191.* allows access tothe 206.168.191 subnet.
Require both IP address and Login
Selecting this option adds further security by restricting SiteScope access to users who haveboth a correct username/password and an allowed IP address.
SiteScope Port
Enter the port on which the SiteScope server should be started. If you do not enter a validport in this field, the SiteScope Web server will not start and will not serve the SiteScopeWeb pages. If you want to use another Web server to serve SiteScope pages, refer to theinstructions for how to set up a stand-alone server.
General Preferences 227
Create static HTML pages
Selecting this option tells SiteScope to write out HTML files. This allows access toSiteScope information from a separate web server application. You may choose to use thisoption if you need to use special security options supported by your web server.
Web Server Address
Enter the name or the IP address of the machine on which SiteScope is installed. Forexample, you could enter either the machine's IP address, as in 206.168.191.44, or you couldenter the machine's name. as in trout.freshtech.com. This information is used for providinglinks to SiteScope management report pages in your management summary e-mail.
Other Links
The General Preferences page also includes links to pages that allow you to configure the following:
• Where SiteScope will send E-mail reports and warnings• Set the size of SiteScope Log files• Pager telephone numbers• Define a Schedule that can trigger monitors• Integration of your SiteSeer account• SNMP hosts or addresses• Connections to Unix Remotes• Account names and privileges for other Users
SiteScope User Guide
Completing the General Preferences Form 228
Using a Stand-alone Web server
SiteScope has a built-in Web server which we encourage you to use to serve SiteScope's Web pages.SiteScope can interface directly with this server rather than invoking a CGI script, making retrieval timesquicker, and eliminating the need for configuration changes to your stand-alone Web server. There may betimes, however, when it's necessary to serve SiteScope's pages through your own Web server, such as whenyou have a firewall set up and want SiteScope's pages to use that firewall.
If you do decide to serve SiteScope's pages through a stand-alone server, you will first have to set upSiteScope using the default setup as downloaded. After installing SiteScope, you will need to set up twovirtual server paths for the SiteScope documents. The following are instructions for doing this using either anIIS, Apache, or Netscape or other server.
Using an IIS Server
1. Connect to SiteScope through the SiteScope server (default installation), and choose the GeneralPreferences link on the SiteScope main page.
2. Under the section Built-in Web Server remove anything in the SiteScope Port field, (normally8888) and select the Create Static HTML checkbox.
3. Save these changes. This shuts down SiteScope's internal web server and tells SiteScope to createHTML files that can be accessed using a separate web server. The browser will normally return anerror message when refreshed at this point.
4. From the Windows Start menu, open the Internet Service Manager and open up the IIS properties.Choose the Directories option.
5. In the IIS directory view or using the IIS Wizard, add a new virtual directory configured to point towherever you have SiteScope installed as follows:
Virtual Directory name or Alias: SiteScopePhysical Directory: path:\SiteScope where path represents the physical device path whereSiteScope is installed. Select Read as the only access permission Create the virtual directory
6. In the IIS directory view, open the new SiteScope directory and select the cgi subdirectory. Changethe properties of this subdirectory as follows :
Where applicable, verify that only the "Read", "Log visits", and "Index this resource" options arechecked. Otherwise deselect all other Access Permissions and Content Controls. Select the Execute Scripts option or set the Execute Permissions to "Scripts and Executables". Save the changes
Now, you'll be able to access SiteScope at:
Using a Stand-alone Web server 229

http://your.machine/SiteScope/htdocs/SiteScope.html
Restricting Access To SiteScope Using an IIS Server
IIS uses NT file permissions to restrict access. By changing the NT file permissions, you can control who canaccess the SiteScope web pages:
1. Open the Directory Permissions window for the SiteScope directory.2. Select the SiteScope directory3. Choose Properties from the File Menu4. Choose the Security tab5. Choose the Permissions button6. Check Replace Permissions on Subdirectories7. Check Replace Permission on Exiting Files
To restrict access to SiteScope, complete the following instructions:
1. Remove the Everyone group2. Add the sitescope administrator account with Full Control permissions3. If you want to allow read only access to some users, add these accounts with Read permission4. Choose OK to save the permissions
The url for admin access will be:http://yourServerName/SiteScope/htdocs/SiteScope.html
The url for read only access will be:http://yourServerName/SiteScope/userhtml/SiteScope.html
Note: If you're using Internet Explorer, one confusing "feature" is that IE automatically logs into web pagesusing your current login account, without showing you a password dialog. For example, if you are loggedinto the TestUser account and go to an IIS web server that restricts access to a page, IE will invisibly log youin using TestUser. To always get the login dialog, disable the "Windows NT Challenge/Response" checkboxin the authentication options of IIS.
Using Apache
For the Apache web server, add these lines to conf/srm.conf and restartAddHandler cgi-script .exe Alias /SiteScope /usr/SiteScope ScriptAlias /SiteScope/cgi/usr/SiteScope/cgi
SiteScope User Guide
Using an IIS Server 230
Using a Netscape or Other Server
1. Determine how virtual directories are added for your server.
2. Add a virtual directory that maps /SiteScope to wherever you installed SiteScope.
For example, if SiteScope is installed in a folder named Applications located on your C drive, youwould map /SiteScope to c:/Applications/SiteScope.
3. Add a virtual cgi directory for /SiteScope/cgi as follows:
♦ for "url prefix", use /SitesScope/cgi♦ for "shell cgi directory", use C:/SiteScope/cgi (or use the path where you installed
SiteScope) press OK
4. Save and apply your changes.
Note: it may be necessary to restart your server to apply these changes.
5. Now, you'll be able to access SiteScope at:
http://your.machine/SiteScope/htdocs/SiteScope.html
SiteScope User Guide
Using a Netscape or Other Server 231

Pager Preferences
Use the Pager Preferences form to set the default method that SiteScope should use when instructed to send apage. SiteScope sends pages using a modem connected directly to the server on which the SiteScopeapplication resides.
If you would like for SiteScope to know about more than one pager so that it can send pages to differentpeople or more than one person at once, complete the Add Additional Pager Settings form. This form isavailable from the Add additional pager settings link at the bottom of the SiteScope Pager Preferences form.
Completing the Pager Preferences Form
From the Modem port pull-down menu, select the port that your modem is connected to.
From the Modem speed pull-down menu, select the modem speed used for connections. The default of 1200is most likely to work different paging systems.
There are different methods for sending a message to your paging service.
The preferred method is to connect to a modem at your pager service. When a modem connection is used,SiteScope is able to verify that the message was sent successfully and the messages can contain a descriptionof the problem.
The other options allow numeric messages to be sent using touch tone dialing. Touch tone dialing is limitedto numeric messages and SiteScope cannot confirm that your paging service correctly received the message.
Alphanumeric pages
Choose this option if you have an alphanumeric pager and an alphanumeric paging service. In the Modem Number text entry field, type the phone number for sending alphanumericpages. This number is provided by your paging service. Sometimes, the paging service willcall this the TAP/IXO number. Some of the Modem Numbers for the larger services are:Airtouch: (800)326-0038 MCI: (800) 555-0909 Mobile Media: (800)622-5742 Mobilecomm: (800)946-4644 Pagenet: (800)720-8398 PageMart: (800)864-9499 SkyTel: (800)759-6366 or (800)679-2778 USA Mobile: (800)589-9776 You may also be able to find the Modem Number for your service at: http://www.wildfire.com/w3p/help_sspIn the PIN number text entry field, type the last seven digits of the PIN number for youralphanumeric pager.
Pager Preferences 232
Dial phone number and enter message
Choose this option if you dial a direct phone number to send a page. Most local pagingcompanies work like this.In the Phone number text entry field, enter the phone number exactly as you would dial itfrom your telephone, including other numbers you might need such as a number to get anoutside line. You can use dashes to make the number easier to read, but they aren't required.Use commas to separate the portions of the phone number. Each comma causes the modemscript to pause for a few seconds before dialing the rest of the number. For example, if you're dialing your pager from your office and you have to dial 9 to get anoutside line, you might type: 9, 555-6789
Dial phone number, enter a command, and then enter message
Choose this option if you have a direct number, but need to enter a command before sendinga page. Also, choose this option if your paging company uses a single phone number for allpagers and requests a PIN number before sending a page.In the Phone number text entry field, type the phone number exactly as you would dial itfrom your telephone, including other numbers you might need such as a number to get anoutside line. You can use dashes to make the number easier to read, but they aren't required.Use commas to separate the portions of the phone number. Each comma causes the modemscript to pause for a few seconds before dialing the rest of the number.For example, if you're dialing your pager from your office where you have to dial 9 to get anoutside line, you might type: 9, 123-4567 In the Send page command text entry field, type the page command exactly as you woulddial it from your touch tone telephone.
Customized modem command string
Use this option if your paging company does not use either of the two previous choices.In the Modem command text entry field, type the entire modem command including thephone number to dial, any additional digits, and $message. SiteScope replaces $message withthe message you specified for each alert. Use commas to separate the portions of the phonenumber. Each comma causes the modem script to pause for a few seconds before dialing therest of the number.For example, if the pager company's number is 123-4567, your pager PIN is 333-3333, andyour pager company requires that you follow each command with the # key, the commandmight look like this:ATDT 123-4567,,333-3333#,,$message#
Unix Only: Enter the device path for your modem in the Modem Path field. To see a list of devicesusing Solaris, use the ls /dev/term/* command. To see a list of devices using IRIX, use the ls/dev/ttym* command .
Additional Pager Settings
This table lists any pager settings that you've defined in addition to the default settings. Ifyou only define the default settings, this table will be empty. When you create an alert, youmay choose to send a page to one or more of these settings.
SiteScope User Guide
Completing the Pager Preferences Form 233

Click the X to delete settings for a pager. Click the name of an entry to edit the pager settings for thatentry.
If you'd like to add additional pager settings, choose the Add additional pager setting link. Thiswill take you to the Add Additional Pager Settings form.
When you've completed the form choose the Save Changes button.
SiteScope User Guide
Completing the Pager Preferences Form 234

Add Additional Pager Settings
Use the Add Additional Pager Settings form to define additional pagers to which SiteScope can send pages inthe event of an error or warning condition. You must complete this form for each pager you want to add. Youmay instruct SiteScope to send a page to one or more of the defined pagers when you set up a new pageralert.
SiteScope sends pages using a modem connected directly to the server on which the SiteScope applicationresides.
Once you've completed the this form, click the Save Additional Setting button to save the new pagersettings.
Completing the Add Additional Pager Settings Form
Different paging companies have different procedures for sending a page. If you have an alphanumericpaging service, choose that option. For numeric pages, choose the option that matches the steps you use tosend a page using a touch tone phone.
Setting Name
Type in the name for these pager settings. For example, if this pager belongs to Joe, youmight simply type Joe in the text entry area. When you add an alert you can choose Joe fromthe list of pager settings to have a page sent to him in the event of an error or warningcondition.
Disabled
Click this button to stop pages from being sent to this pager. This allows you to temporarilydisable a particular pager without editing every alert that contains this persons pager. Forexample, when Joe goes on vacation you will want to disable his pager setting. Of course,you'll also want to make sure that there's another pager specified for each alert that Joe isselected on so that someone will receive a page if there's a problem.
Alphanumeric pages
Choose this option if you have an alphanumeric pager and an alphanumeric paging service. In the Phone number text entry field, type the phone number for sending alphanumericpages. This number is provided by your paging service. Sometimes, the paging service willcall this the Modem number. In the PIN number text entry field, type the PIN number for your alphanumeric pager.
Dial phone number and enter message
Choose this option if you dial a direct phone number to send a page. Most local paging
Add Additional Pager Settings 235

companies work like this. In the Phone number text entry field, enter the phone number exactly as you would dial itfrom your telephone, including other numbers you might need such as a number to get anoutside line. You can use dashes to make the number easier to read, but they aren't required.Use commas to separate the portions of the phone number. Each comma causes the modemscript to pause for a few seconds before dialing the rest of the number.For example, if you're dialing your pager from your office and you have to dial 9 to get anoutside line, you might type: 9, 555-6789
Dial phone number, enter a command, and then enter message
Choose this option if you have a direct number, but need to enter a command before sendinga page. Also, choose this option if your paging company uses a single phone number for allpagers and requests a PIN number before sending a page. In the Phone number text entry field, type the phone number exactly as you would dial itfrom your telephone, including other numbers you might need such as a number to get anoutside line. You can use dashes to make the number easier to read, but they aren't required.Use commas to separate the portions of the phone number. Each comma causes the modemscript to pause for a few seconds before dialing the rest of the number. For example, if you're dialing your pager from your office where you have to dial 9 to get anoutside line, you might type: 9, 123-4567 In the Send page command text entry field, type the page command exactly as you woulddial it from your touch tone telephone.
Customized modem command string
Use this option if your paging company does not use either of the two previous choices.In the Modem command text entry field, type the entire modem command including thephone number to dial, any additional digits, and $message. SiteScope replaces $message withthe message you specified for each alert. Use commas to separate the portions of the phonenumber. Each comma causes the modem script to pause for a few seconds before dialing therest of the number.For example, if the pager company's number is 123-4567, your pager PIN is 333-3333, andyour pager company requires that you follow each command with the # key, the commandmight look like this:ATDT 123-4567,,333-3333#,,$message#
When you've completed the form choose the Save Changes button.
Advanced Options
You can specify when these pager settings should be enabled and disabled. By default, they are enabled everyday of the week. You can define specific times for the settings to be either enabled or disabled by typing afrom and to time in the appropriate fields and then choosing either the enable or the disable button.
SiteScope User Guide
Completing the Add Additional Pager Settings Form 236

Note: All times should be entered in 24 hour notation. For example, you would enter 13:00 instead of 1:00PM, and 15:00 instead of 3:00 PM. This would mean that if you have a person who should only be pagedduring normal business hours, you should enter type 8:00 and 17:00 in the from and to fields for Mondaythrough Friday. You would then also need to specify that these pager settings should be disabled for all ofSaturday and Sunday.
As above, choose the Save Changes button when you've completed the form to save your changes.
SiteScope User Guide
Advanced Options 237

Mail Preferences
The Mail Preferences form allows you to indicate the SMTP mail server that SiteScope should use whensending an alert e-mail message. If you would like to create named e-mail lists for SiteScope to send alerts to,complete the Add Additional Mail Settings form. This form is available from the Add Additional E-mailsettings link at the bottom of the SiteScope E-mail Preferences form.
Completing the Mail Preferences Form
Complete the form as indicated below and then click the Save Changes button.
Mail Server Domain Name
Enter the domain name of the SMTP mail server that SiteScope should use when sendinge-mail messages. For example, the domain name for the Freshwater Software mail server ismail.freshtech.com. If you are unsure of your mail server's domain name, check with yourSystems Administrator.
Administrator E-mail Address
Enter the e-mail address to which SiteScope should send status messages. For example, theadministrator e-mail address for Freshwater Software is "[email protected]".SiteScope uses this address to send various status messages.
Send daily status messages
If this checkbox is selected, SiteScope will send a brief daily status message to theadministrator's e-mail address. This email is scheduled to be generated at 7:07 AM everyday. The subject of email sent will include: "SiteScope daily status". The e-mail contentincludes the number of active monitors and groups, along with a URL link to the applicableSiteScope main page plus the version number of SiteScope installation. .
Send message whenever SiteScope starts
If this checkbox is selected, SiteScope will send a brief status message to the administrator'se-mail address whenever SiteScope starts running or re-initializes. SiteScope normallyre-intializes itself once each day. This means that you would normally receive a messageonce per day. The subject of email sent will include: "SiteScope started". The e-mail contentincludes the number of active monitors and groups, along with a URL link to the applicableSiteScope main page plus the version number of SiteScope installation. This message willalso be generated if someone manually stops and restarts the SiteScope process. Otherincidences of this message may indicate that a monitor or process has taken too long to run.An example might be if a script being run by a script monitor hangs up during execution.
From Email Address
Mail Preferences 238

Enter the email address used as the From Address for mail generated by SiteScope.Specifying an email address may make it easier for you to browse and sort email sent bySiteScope. For example, you may want mail generated by SiteScope to come [email protected]. If nothing is entered, the from address will be the same as theaddress where the mail is sent.
Backup Mail Server Domain Name
Enter the domain name of the SMTP mail server that SiteScope should use whenever theprimary mail server cannot be reached. For example, the domain name for the FreshwaterSoftware backup mail server is gateway.freshtech.com. If you are unsure of your backupmail server's domain name, check with your Systems Administrator.
Additional E-mail Settings
At the bottom of the E-mail Preferences page is a table of Additional E-mail Settings. This table lists thename of any alert e-mail lists and schedules that have been defined. Click on the "Add additional e-mailsetting" link to bring up the Add Additional E-mail Setting form.
SiteScope User Guide
Completing the Mail Preferences Form 239
Add Additional E-Mail Settings
Use the Add Additional E-mail Settings form to define named e-mail lists to which SiteScope can sende-mail in the event of an error or warning condition. You access the Add Additional E-mail Settings form byclicking on the link You must complete this form for each e-mail list you want to add. You can then instructSiteScope to use one of these named lists when sending alerts.
Once you've completed this form, click the Save Additional Setting button to save the new e-mail settings.
Completing the E-mail Additional Setting Form
Setting Name
Type in the name for this e-mail list. For example, if the e-mail addresses in this list belongto the night shift operators, you might simply type Night Shift in the text entry area. Whenyou add an alert you can choose Night Shift from the list of e-mail settings to have an e-mailsent to the e-mail addresses in the list when an error or warning condition occurs.
E-mail To
The e-mail address(es) that you want to send the alert to (for example, [email protected]).You can enter multiple e-mail addresses by separating the e-mail addresses with commas([email protected], [email protected]).
Disabled
Click this button to stop e-mail alerts from being sent to these e-mail addresses. This allowsyou to temporarily disable a particular e-mail without editing every alert that contains thise-mail setting
Advanced Options
Template
If you want e-mail alerts sent to these settings to use a particular template, then choose itfrom the popup menu. Otherwise, whatever template is specified in the alert will be used.One use of this feature is to define a single alert that will go to people and pagers, using theShortMail template for the pagers.
Schedule
You may specify when these e-mail settings should be enabled. By default, they are enabled
Add Additional E-Mail Settings 240

every day of the week. You may specify specific times for the settings to be either enabled ordisabled by typing a from and to time in the appropriate fields and then choosing either theenable or the disable button. Note: All times should be entered in 24 hour notation. Forexample, you would enter 13:00 instead of 1:00 PM, and 15:00 instead of 3:00 PM. You can use the scheduling feature in the following way. If you have a person who shouldonly be e-mailed during normal business hours, you can type 8:00 and 17:00 in the from andto fields for Monday through Friday. You would then also need to specify that these e-mailsettings should be disabled for all of Saturday and Sunday.
SiteScope User Guide
Advanced Options 241
Log Preferences
SiteScope saves alert data, error data, and other readings returned by monitors into special log files. Thesedata are stored as tab delimited text files. SiteScope uses the log files to generate various managementreports. SiteScope can also send the data to a database application. Within SiteScope you can access thecurrent alert and monitor logs through the "View the log of alerts sent" link on the SiteScope Alert detailpage. In this section we discuss setting SiteScope log preferences.
Completing the Log Preferences Form
The Log Preferences page allows you to limit how much log information SiteScope saves. In order to create amanagement report the log information for the duration of the report must be available. Log file informationis kept in separate daily files.
Complete the form as indicated below and then click the Save Changes button located at the bottom of theform.
Daily Logs To Keep
Enter the number of days of monitoring data to keep. Once a day, SiteScope deletes any logsolder than the specified number of days. By default this is set to 40 days, which saves enoughdata to create monthly reports.
Maximum Size of Logs
Enter the maximum size allowed for all monitoring logs. Once a day, SiteScope checks thetotal size of all monitoring logs and removes any old logs that are over the maximum size.By default, this setting is blank and not used.
Database Logging
SiteScope can optionally log a copy of all the monitoring data into a database. Any database which supportsthe ODBC or JDBC standards can be used, including Microsoft SQL Server and Oracle.
Database Connection URL
To enable Database logging, enter a URL to a Database Connection. The easiest way tocreate a database connection is to use ODBC to create a named connection to a database. Forexample, first use the ODBC control panel to create a connection called SiteScopeLog. Then,enter jdbc:odbc:SiteScopeLog in this field as the connection URL.
Log Preferences 242
Database Username
Enter the username used to login to the database. If you are using Microsoft SQL server, youcan leave this blank and choose NT Authentication when you setup the ODBC connection.With NT Authentication, SiteScope connects using the login account of the SiteScopeservice.
Database Password
Enter a password used to login to the database. If you are using Microsoft SQL server, youcan leave this blank and choose NT Authentication when you create the ODBC connection.With NT Authentication, SiteScope connects using the login account of the SiteScopeservice.
After you save changes to the Database preferences, restart the SiteScope service to have the changes takeeffect.
When Database logging is active, you should see a table called SiteScopeLog in your database and a recordadded every time a monitor runs. The data is sent to the database in a single table in a flat-file format. Foradditional details, go to Log Descriptions.
Database Troubleshooting
If a table called SiteScopeLog is not created or is empty, check the RunMonitor.log and Error.log files formessages starting with "jdbc". When Database logging is working correctly, you should see a set of messagesin RunMonitor.log that looks like this: jdbc log, reconnect seconds=600 jdbc log, loading, driver=sun.jdbc.odbc.JdbcOdbcDriver jdbc log, connecting, url=jdbc:odbc:SiteScopeLog, jdbc log, logged in jdbc log, checking log table jdbc log, created log table jdbc log, prepare insert, 19, INSERT INTO SiteScopeLog... jdbc log, connected
If these entries don't appear in the log there is a problem with the interface or configuration of the databaseconnection.
SiteScope User Guide
Database Logging 243

Log Descriptions
SiteScope records the readings and measurements from the monitors you have defined in log files. The tabdelimited text log files can be viewed directly and they are used to generate management reports. The logfiles can also be used for operational analysis by other software applications. This page describes the formatof the SiteScope log files and log database.
SiteScope Log Files
Every time SiteScope runs a monitor, the measurements for the monitor are written in the SiteScope log file.The current SiteScope log files are located in the ~SiteScope/logs directory and is named based on the date- for example, the log file for August 1, 1998 is named SiteScope1998_08_01.log. Within SiteScope youcan access the monitor logs by clicking on the "View the log of alerts sent" link on the SiteScope Alert detailpage.
(Previous versions of SiteScope saved this information in files called SiteScope.log and SiteScope.log.old)
The SiteScope log file contains moniroting data separated into tab delimited fields. The following is a sampleof some log entries:
11:54:50 07/25/96 good Server Web server performance 8.61 hits/min 1:232 10 12000 8.61 1023.4 11:54:51 07/25/96 error Server Local home page forbidden 2:11211:54:54 07/25/96 good Server FTP Service running 3:154 11:55:04 07/25/96 good Network CPU 36% used 1:311 11:56:28 07/25/96 good Network CPU 34% used 1:31211:57:27 07/25/96 good Network CPU 19% used 1:313 11:58:06 07/25/96 good Server Disk space on C drive 68% full 4:43
Below is a description of the information listed in each column of the log file:
Log FileColumn
Data Description
1 11:54:50 The first column contains the time and date thatthe monitor ran.
2 good The second column contains the monitor'scurrent status.
3 Server The third column contains the name of the groupthat the monitor belongs to.
4 Web serverperformance
The fourth column contains the monitor's name.
5 8.61 hits/min The fifth column contains the monitor's currentreading.
Log Descriptions 244
6 1:232 The sixth column contains the monitor ID andsample number. The monitor ID is before the : (inthis case 1) and the sample number is after the :(in this case 232).
7, 8,9, ...
(variable) The remaining columns contain additional dataspecific to that monitor. For a full description ofall of the columns for each type of monitor, referto the Detailed SiteScope Log FileColumns listing.
For information about a monitor's status or reading, refer to the help text for that monitor.
Other Logs
SiteScope produces several other log files and the following provides a brief outline of what you'll find ineach one. All log files are found in the SiteScope/logs directory.
access.log
Access.log records hits on SiteScope's internal web server. The format follows the CommonLogfile Format, which is the format used by many web servers.
alert.log
alert.log records all of the alerts sent or run by SiteScope -- both those that are successful andthose that fail for some reason
error.log
error.log records any errors and some diagnostic information (SiteScope startup is the mostcommon). Errors include failed alerts, errors in the web server HTTP requests (if you have alogin, the most common will be an HTTPRequestException 401, which are normalauthentication errors), or monitors that run for a long time.
RunMonitor.log
RunMonitor.log is a progress log for SiteScope and is not all that useful for most users.
SiteScope Log Database Table
When a monitor runs, a record can optionally be saved into a SQL database. See the Log Preferences page for
SiteScope User Guide
SiteScope Log Files 245

more information about database logging.
Log data is contained in a single table called SiteScopeLog. The first nine fields of each database record arethe same for all monitors. The next ten fields contain different measurements depending on the kind ofmonitor supplying the data. All the fields use the VARCHAR(255) data type. A description of the fields in thelog database record are shown in the table below along with their default field names:
Field Name Example Data Description
datex 1999-01-20 11:54:54 The first field contains the date that themonitor ran.
serverName demo.freshwater.com The second field contains the name of theserver where SiteScope is running.
class URLMonitor The third field contains the type of themonitor
sample 23 The fourth field contains the samplenumber of this monitor
category good The fifth field contains the category nameof the monitor
groupName URLs The sixth field contains the group name ofthe monitor
monitorName Home Page The seventh field contains the name of themonitor
status 1.01 seconds The eighth field contains the status of themonitor
monitorID 10 The ninth field contains the ID of themonitor
value1, value2, ...value10
(variable) The tenth through nineteeth fields containthe monitor specific data as described in theLog Columns page. The first variable field(value1) will correspond to the value listedas column 7 in the log files.
The logging statement can be changed by editing _logJdbcInsertSiteScopeLog in the groups/master.configfile. A stored procedure can be called by replacing the insert statement with a call statement. For example,"call logit(?,?,?)" would call the stored procedure named logit passing it the first three parameters.
Contact [email protected] if you are interested in saving separate records for each measurement of amonitor.
SiteScope User Guide
SiteScope Log Database Table 246

Schedule Preferences
Use the Schedule Preferences page lets you view current schedules and gives you access to the forms used tocreate new schedules for your SiteScope monitors. The Schedule Preferences page includes a table ofSchedules that lists the currently defined schedule names and type. As with other tables within SiteScope, theSchedules table includes links that allow you to Edit or Delete items from the table. Below the table are linksto the forms you can use to create custom schedules.
SiteScope has two types of scheduling: Range Scheduling and Absolute Scheduling.
Range Scheduling
Range Scheduling allows you to specify a time range during which SiteScope will eitherenable or disable particular monitors. If you specify an enabled time range for a new monitor,SiteScope will only run the monitor during that range. For example, if you create a range of8am - 9pm, Monday through Friday, any monitors that have that range selected will only berun during those times. A common use of range scheduling is to set up different pager alertsand monitors to coincide with the times that various administrators are on call. Note: You can enter multiple ranges by entering several start times and several end timeseparated by commas. For example to disable from 2-3am and 7-8am, you would enter2:00,3:00 to 7:00,8:00
Absolute Scheduling
Absolute Scheduling lets you set specific times to trigger monitors to run. Generally, anabsolute schedule will trigger a monitor to run only once at each time specified in theschedule. Absolute times are specified in a daily schedule. You may define multiple times fora monitor to run in a single day (e.g. 6:00am, 12:00pm, and 6:00pm) by separating the timeswith a "," (comma). You may want to use this type of scheduling for monitors, such as theLink Checking monitor, which you want to only run once a day at a time when the servergenerally has a lighter load.
Adding Additional Schedules
To create a new schedule choose the either the Add additional range schedule or Add additional absoluteschedule links listed under the Schedules Table. The links bring up the Schedule Preferences page for thetype of schedule you have selected.
Completing the Schedule Preferences Form
For each new schedule you want to create, type the name you want for the schedule into the Schedule
Schedule Preferences 247
name text area. We encourage you to create descriptive schedule names so that you'll be able to easilyidentify them later. If you don't specify a name for a schedule, SiteScope will create one that describes thetimes specified. You can edit or change a schedule name by typing the new characters into the Schedulename text area.
After entering the schedule name, fill in the times that the schedule should be enabled for each of the dayslisted. For Range Scheduling, fill in the start and stop times that describe the period during which themonitors will be enabled. For Absolute Scheduling, enter the time at which you want monitors triggered.
Times are specified in 24 hour format, also known as military format. Multiple times can be entered on asingle day by separating the times by commas.Examples of valid times entries are:
• 10:23 (10:23 am)• 23 (11:00 pm)• 01,02:30,23:30 (1:00 am, again at 2:30 am, and again at 11:30 pm)• 00:00 (midnight)
When you've completed the form, choose the Save Changes button near the top of the page.
SiteScope User Guide
Completing the Schedule Preferences Form 248
SiteSeer Preferences
The SiteSeer Preferences form allows you to add the information from your SiteSeer remote monitoringaccount on the SiteScope main panel and the Multi-view page.
Completing the SiteSeer Preferences Form
Complete the form as indicated below and then click the Save Changes button located at the bottom of thepage.
SiteSeer Account
Enter the name of your SiteSeer account. The account name is normally the domain namespecified in your email address. You can determine what it is by looking at the URL for yourSiteSeer account. For example, if your SiteSeer URL ishttp://siteseer.freshtech.com/SiteScope?account=mycompany.com then your account name ismycompany.com
SiteSeer Username
Enter the user name used to login to your SiteSeer account.
SiteSeer Password
Enter the password used to login to the SiteSeer account.
SiteSeer Host Name
Enter the host name of the SiteSeer service. This is usally siteseer2.freshtech.com orsiteseer.freshtech.com. Look at the URL for your SiteSeer account to determine if yours isdifferent. For example, if your URL ishttp://siteseer2.freshtech.com/SiteScope?account=mycompany.com, your host name issiteseer2.freshtech.com
SiteSeer Preferences 249

SNMP Preferences
The SNMP Preferences form allows you to set the SNMP parameters that SiteScope should use when sendingan SNMP trap message.
Completing the SNMP Preferences Form
Complete the form as indicated below and then click the Save Changes button.
Send to Host
Enter the domain name or IP address of the machine that will receive all SNMP trapmessages. This is normally the machine running the SNMP console. For example,snmp.freshwater.com or 206.168.191.20.
SNMP Object ID
The System object from MIB-II (RFC 1213) that is sending the trap. The object is used byconsole to indentify what kind of object is sending the message. The default object ID is theSystem object.
SNMP Community
The SNMP community name used for this trap. The default community by most systems is"public". The community string must match the community string used by the SNMPconsole.
Trap ID
The type of trap to send. There are several predefined types for common conditions. If thetype is enterprise specific, the specific field should contain the number of the specific traptype.
SNMP Preferences 250
Add Additional SNMP Settings
Use the Add Additional SNMP Settings form to create named settings that you can then select when creatingalerts.
Once you've completed the this form, click the Save Additional Setting button to save the new SNMPsettings.
Completing the Additional SNMP Settings Form
Setting Name
Type in the name for these SNMP settings. For example, if you want to use these settings fora secnodary console, type secondary settings in the text entry area. When you add an alertyou can choose secondary settings from the list of SNMP settings.
Disabled
Click this button to stop SNMP alerts from being sent using these settings.
Send to Host
Enter the host name of the machine to which this trap should be sent. For example,snmp.freshtech.com. This machine must be running an SNMP console.
SNMP Object ID
Indicate the SNMP object that is sending the trap. For example .1.3.6.1.2.1.1 is the "system"object from MIB-II (RFC 1213).
SNMP Community
Enter the SNMP community name used for this trap - usually this is "public".
Trap ID:Generic
Specify the generic trap type. If the generic trap type is "enterprise specific", then enter thenumber that represents the specific trap type.
When you've completed the form choose the Save Changes button.
Add Additional SNMP Settings 251
Remote Servers
SiteScope can monitor other servers remotely for certain statistics (such as CPU, Disk Space, Memory, orServices). It does this by running command line tools on the remote machine. When you add or edit one ofthese types of monitors, you can select the choose server link to select the machine that you wish to monitor.
In this section we'll discuss:
• Remote Servers Table• Adding a remote machine• Technical notes
Remote Servers Table
From the General Preferences page click the Unix Remotes link under the navigation bar at the top of thepage. This brings up the Remote Servers page which lists in table format the currently defined remote servers.The Remote Servers Table lists the following information on the currently defined servers.
Name
This shows the optional name assigned to the server definition.
Server
This field indicates the server address or URL
OS
This shows the operating system that was defined for the server.
Method
The Method entry shows the connection method - Telnet, rlogin, HTTP - specified for theserver.
Edit
Click the Edit link to edit the specifications for that server.
Test
Click the Test link to run a test on that server.
Detailed Test
Remote Servers 252
Click the link in the Detailed Test column to run a test on that server.
Del
Click the X in this field to delete the server definition.
Adding a Remote Machine
You can add additional remote servers by choosing the Add a Remote Machine link below the RemoteServers Table. This brings up the Add Remote Server page.
To create a remote server, you need to provide the following information:
Server Address
The IP address or host name of the server you wish to monitor. If you are using the HTTPmethod of monitoring, enter the full URL of the CGI script (for example:http://demo.freshtech.com/cgi-bin/run.sh)
OS
The operating system running on the remote server. This is required so that the correctinformation can be obtained from that server. Use the drop down list feature to select fromthe currently supported operating systems. For servers running versions of Unix which arenot included in the list, see the section on the SiteScope Remote Unix Adapter Kit.
Connection Method
The method for connecting to the server. The currently supported methods are: Telnet: log in as a user using telnet and run the command from a command line. Telnet issupported on all platforms except for SGI Irix. SSH: log in as a user using the SSH client and run the command from a command line. SSHis currently only supported on Solaris. Rlogin: use the "rlogin" protocol to login and run the command remotely HTTP: run the command via a CGI on the remote machine. For this method the Login andPassword are optional and are used for authorizing SiteScope to logon to the remote machineif required.
Login
The login for the remote server.
Password
The password for the remote server.
SiteScope User Guide
Remote Servers Table 253

Title
A name by which the remote machine should be known. This name will appear in the pop-upmenu.
After defining the server for SiteScope, you can test the settings by clicking on the test link. SiteScopeattempts to display the working directory of the remote machine (the "pwd" command on Unix, or "cd" onWindows NT), as a test to ensure that the remote machine can be accessed and can run commands properly.
Advanced Options
Prompt
This is the prompt output when the system is ready to handle a command - the default is #
Login Prompt
This is the prompt output when the system is waiting for the login to be entered - the defaultis "ogin:"
Password Prompt
This is the prompt output when the system is waiting for the password to be entered - thedefault is "assword:"
Trace
Check this option to trace messages to and from the remote server in the RunMonitor.log file
Technical Notes
The following is additional information relating to the setup of remote servers:
SSH
To use the SSH access method, you must have the SSH client installed on the SiteScopemachine and the SSH server installed on the servers you are monitoring. The path to the SSHclient should be: /usr/local/bin/ssh.
Rlogin
SiteScope User Guide
Adding a Remote Machine 254
You can set up your remote servers to require a password for rlogin, or to allow accesswithout a password (like "rsh"). SiteScope will handle either case.
CGI
Two simple CGI scripts are included with SiteScope: /SiteScope/classes/CustomRemote/examples/remote.pl/SiteScope/classes/CustomRemote/examples/remote.sh
The remote.pl CGI is a Perl (version 4 and above) script that executes a command on the server; theremote.sh script does the same, except as a Unix sh script. CGI commands are passed in via the COMMANDCGI variable. If you are using the CGI connection method and you want to use remote actions, remember thatthe permissions for both the directory containing the CGI script and the /script directory need to allow theWeb server (probably running as a user with few permissions) to execute in those directories. Additionally,the scripts need to have execute permission.
If you wish to use a CGI script that puts greater limits on the commands that can be run, you can use adifferent CGI script. All that matters is that the CGI returns the output of the command passed in via theCOMMAND variable. For greater security, you can set up your Web server to require a login/passwordauthorization to run the script (this is recommended). Also, if you have a secure Web Server on that server,you can set up the script to run using the Secure Sockets Layer (SSL, used in https requests), so that therequest and output is encrypted.
We are open to requests for additional connection modes and the API for writing connectors is available. Wehave also included information on how to create an adapter file to remotely monitor versions of Unix that arenot currently supported as one of the SiteScope defaults. In either case, drop us an e-mail [email protected] and we can talk about adding a connector that fits your specific needs. A sampleconnector Java class, which outlines the structure of a connector, can be found in the following directory:/SiteScope/classes/CustomRemote/examples
If you choose to write one yourself, let us know - we'd like to hear how it goes.
SiteScope User Guide
Technical Notes 255
User Preferences
This preference page allows you to administer the user name and passwords that allow access to SiteScope. Acurrent list of user accounts is displayed in the Users Table which includes links for editing and removingusers. By default SiteScope creates two user profiles:
The SiteScope Administrator is a built-in account that allows full access to view and change anything inSiteScope. This account cannot be disabled or deleted.
Note: The SiteScope Administrator is the only account that is allowed to make changes on the UserPreferences form.
The SiteScope User is a built-in account that allows read only access to SiteScope. This account cannot bedeleted and is disabled by default. If you have selected to require other users to login to SiteScope (see theGeneral Preferences page), the users will login to SiteScope through a special URL:/SiteScope/userhtml/SiteScope.html
To edit a user profile, click the Edit link beside the user profile in the User table. To add a new user profile,click the Add User link below the User table. This will bring up the Update User or Add User forms.
Completing the Add / Update User Form
Use the Add User to create a new user account and set SiteScope permissions for that account. Use theUpdate User form to make changes to an exisiting user account. The following fields are displayed on theAdd User and Update User forms:
Login Name
Enter the login name for this user.
Password
Enter the login password for this user.
Groups
Optionally, limit the groups that can be accessed by this user. The default is to allow accessto all groups. By default, the login name is used.
Disabled
When Disabled is checked, access to SiteScope with this username and password is notallowed.
Title
User Preferences 256

Optionally, enter a title for this User. The title is displayed in the list of users. By default, thelogin name is used.
Permissions
Select the permissions for this account. The permissions determine which links are displayedand which actions are allowed when this user connects to SiteScope.
SiteScope User Guide
Completing the Add / Update User Form 257

Monitor Browser
The SiteScope Monitor Browser allows you to display your monitors using a variety of views. For example,you can display only the monitors that are in error, only selected URL Monitors, or only disk space monitors.
Browser Filter Options
Use the drop-down menus and text fields below the navigation bar at the top of the page to select whichmonitors you want SiteScope to display. Then use the Refresh button to display the monitors based on thefilter options you have selected.
Status Select
The first drop-down menu on the upper left allows you to select monitors based on theirreported status. Click the arrows to the right of the box to select the status criteria that youwish to display, such as error, warning, or OK. Some options allow you to exclude certainmonitors.
Monitor Type Select
The other menu selection box on the top row is the monitor type selection field. You canchoose to view only the monitors of a given type, such as URL, database, or Service. Bydefault, monitors of all type are shown. To choose another type, click the scroll arrows on theright side of the box.
Status Filter
This allows you to filter the monitors by the status of the monitor. You can use regularexpression to a perform a match in this field.
A regular expression is used to define the values to match. For example, the expression/timed out | unable to reach/ would match monitors which report the status of either"timed out" or "unable to reach"
Name Filter
This allows you to filter the monitors by the name of the monitor. You can perform a matchin this field.
A regular expression is used to define the values to match. For example, the expression /URLMonitor.* \.gov/ would match all monitor names containing the string URL Monitor withaddresses containing the domain .gov
Machine Filter
Type in the name or IP address of a particular machine to display only those monitors
Monitor Browser 258

associated with that machine. You can perform a match in this field.
A regular expression is used to define the values to match. For example, the expression/206.168.191.(\d+)/ would match all the machines at ports defined by the last digits of theIP address containing the string 206.168.191.
Sort Order
This drop-down menu allows you to choose the field on which to sort the monitors. Bydefault, monitors are sorted by status, with the monitors in error at the top, the monitors inwarning below them, and the monitors that are OK below them.
Refresh Option
You can choose the have this page automatically refresh at intervals between 15 seconds and5 minutes. By default, the page is set to manual refresh and does not refresh automatically.
Browse Monitor Table
The Browse Monitor table lists each of the monitors that meet the filter criteria selected above. The monitortable provides the following information for each monitor.
Status Icon
A status icon that indicates whether the monitor's current reading is OK, or whether itindicates a warning, error, or in-progress status. Refer to the individual monitor's help pagefor an explanation of OK, warning, and error status conditions for that monitor. Clicking onthe status icon also provides a shortcut to disable a monitor. Click the icon and aconfirmation message will appear asking if you want to disable the monitor. Click theDisable Monitor button to complete the action.
Status Gauge
A status gauge that provides a graphical representation of the monitor's current reading. Thereading is the current value returned by the monitor, such as 40% full for the Disk SpaceMonitor. Only those monitors that return a numeric reading have a status gauge.
Status
The status returned by the monitor the last time it ran. If the monitor is disabled, the reasonfor being disabled is displayed.
Name
The name that you specified for this monitor. If you didn't specify a name, "untitled [monitorname]" is displayed. The monitor name is also a link that will display the Summary report forthat monitor.
SiteScope User Guide
Browser Filter Options 259

More
A link to any tools or additional information that may help you to diagnose a problemdetected by a particular monitor.
Edit
Click the Edit link to edit the specifications for that monitor. For more information aboutediting a monitor, see the documentation for the specific monitor you want to edit.
Refresh
Click the Refresh link to tell SiteScope to run the monitor immediately.
Updated
The time that the monitor ran most recently.
Del
Click the X in this field to delete the monitor.
SiteScope User Guide
Browse Monitor Table 260
Diagnostic Tools
SiteScope provides tools to help you diagnose problems when they occur. In the future we'll add additionaltools that help diagnose problems. The tools can be accessed either by clicking on the "more" section of agroup's monitor list or by selecting a tool from the Diagnostic Tools page. The Diagnostic Tools page can beaccessed using the link in the main SiteScope page. Below are links to information on the current tools:
More about Check FTP Server test
More about Mail Round Trip Test
More about Get URL test
More about Check URL Transaction test
More about Network status check
More about Services listing
More about DNS Lookup test
More about Ping test
More about Check News Server test
More about Windows NT Event Log
More about Get URL Content test
More about Traceroute
Diagnostic Tools 261
DNS Lookup
DNS Lookup is a tool which looks up names from a Domain Name Server. It shows you the IP address for adomain name. It also shows you information about the name servers for a domain. When there is a problemon the network, one cause is that the DNS server is not providing the right IP addresses for your servers. Youcan use this utility to verify that your DNS server is returning the correct addresses for your own servers. Youcan also use it to verify that it is able to lookup the addresses for external domains.
The DNS Lookup form provides a gateway to the standard nslookup program. It will send the request to theDNS server entered in the "DNS Address" text entry box. Alternately, it will display the IP address for thehost name entered in the "Host Name" text entry box. Clicking the DNS Lookup button initiates the test. Theresults of the DNS lookup are displayed in the lower portion of the page.
DNS Lookup 262
Check FTP Server
Check FTP Server is a tool that allows you to access an FTP server and view the interaction betweenSiteScope (acting as an FTP client) and the FTP server. For example, if you receive an alert from SiteScopesaying that your FTP server is not working properly, the first step is to use this tool to help track down theproblem.
To check an FTP server complete the fields on the Check FTP Server form as outlined below. When therequired fields are complete, click the Check FTP Server button to initiate the test.
FTP Server
Enter the IP address or the name of the FTP server that you want to test. For example, youcould enter either 206.168.191.22 or ftp.freshtech.com.
File
Enter the file name to retrieve in this field, for example /pub/docs/mydoc.txt.
User Name
Enter the name used to log into the FTP server in this field.
Password
Enter the password used to log into the FTP server in this field.
Update every
Enter how frequently the monitor should check this FTP server. The pull-down menu to theright of the entry field lets you specify time increments of seconds, minutes, hours, or days.You must specify a time increment of at least 15 seconds.
Use Passive
Select this box to have SiteScope use a passive FTP connection. This is commonly requiredto access FTP servers through a firewall.
Proxy (Optional)
Enter the proxy name or IP address if you want to use a proxy server for the FTP test.
Proxy User Name (Optional)
Enter the name used to log into the proxy server in this field.
Proxy User Password (Optional)
Check FTP Server 263

Enter the password used to log into the proxy server in this field.
The following is an sample output from the Check FTP Server tool. In this case, the FTP server allowed us tolog on without a problem, indicating that the server is running and accepting requests. The failure is causedwhen the server was unable to locate the file that was requested: file.txt. Correcting this particular problemmay be as easy as replacing the missing file or verifying the file location.
Received: 220 public Microsoft FTP Service (Version 2.0).Sent: USER anonymousReceived: 331 Anonymous access allowed, send identity (e-mail name) as password.Sent: PASS anonymousReceived: 230 Anonymous user logged in.Sent: PASVReceived: 227 Entering Passive Mode (206,168,191,1,5,183).
Connecting to server 206.168.191.1 port 1463
Sent: RETR file.txtReceived: 550 file.txt: The system cannot find the file specified. Sent: QUITReceived: 221
SiteScope User Guide
Check FTP Server 264
Mail Round Trip Test
The SiteScope Mail Test checks a Mail Server via the network. It verifies that the mail server is acceptingrequests, and also verifies that a message can be sent and retrieved. It does this by sending a standard mailmessage using SMTP and then retrieving that same message via a POP user account. Each message thatSiteScope sends includes a unique key which it checks for to insure that it doesn't retrieve the wrong messageand return a false OK reading.
Completing the Send and Receive Mail Test Form
Complete the fields on the Mail Monitor form as follows. When all the fields are complete, click the "CheckMail Server" button.
Outgoing Mail Server (SMTP):
Enter the hostname of the SMTP mail server to which the test mail message should be sent.(for example, mail.freshtech.com).
Incoming Mail Server (POP):
Enter the hostname of the POP mail server that should receive the test message. This can bethe same mail server to which the test message was sent (for example, mail.freshtech.com).
Mail Server User Name:
Enter a POP user account name (for example, [email protected]). A test email messagewill be sent to this account and the Mail monitor will login to the account and verify that themessage was received. No other mail in the account will be touched; therefore you can useyour own personal mail account or another existing account for this purpose.Note: If you usea mail reader that automatically retrieves and deletes messages from the server, there's achance that the Mail Monitor will never see the mail message and will therefore report anerror.
Mail Server Password: (Optional)
Enter a password, if necessary, for the test mail account.
To Address
Enter the mail address to which the test message should be sent. This should be the addressfor the POP account that you specified in the Mail Server User Name field. For example, ifyou specified "support" as the Mail Server User Name, the To Address might be"[email protected]."
Timeout
Mail Round Trip Test 265

The number of seconds that the Mail monitor should wait for a mail message to be receivedbefore timing-out. Once this time period passes, the Mail monitor will log an error and reportan error status.
Retrieve Pause:
After SiteScope sends the test message, it immediately logs into the mail account to verifythat the message has been received. If the message hasn't been received, SiteScope willautomatically wait 10 seconds before it checks again. You can adjust this wait time byindicating an alternate number of seconds to wait in this field.
SiteScope User Guide
Completing the Send and Receive Mail Test Form 266

Check News Server
Check News Server is a tool that allows you to access a news server and view the NNTP interaction betweenSiteScope (acting as a news client) and the news server.
To perform a news server check, complete the Check News Server form as indicated. You can optionallyspecify one or more news groups by entering them into the "News group" field. Separate multiple news groupnames by commas. If the news server requires a username and password, enter them in the fields provided.Clicking the Check News Group button will initiate the test. The results of the test will be displayed in thelower portion of the page.
Check News Server 267

Ping
Ping is a tool that sends a packet to another location and back to the sender. It shows you the round-trip timealong the path. When there is a problem with the network, ping can tell you if another location can bereached. The Ping Tool will do a ping from the current server to another location. Enter the domain name orIP address of the location you want to ping in the text entry box.
For example, enter either:
demo.freshtech.com (this is the host name)OR206.168.112.53 (this is the IP address)
You will see something like this displayed on the screen:
Pinging 206.168.112.53 with 32 bytes of data:
Reply from 206.168.112.53: bytes=32 time=20ms TTL=59
Reply from 206.168.112.53: bytes=32 time=10ms TTL=59
Reply from 206.168.112.53: bytes=32 time=10ms TTL=59
Reply from 206.168.112.53: bytes=32 time=10ms TTL=59
Reply from 206.168.112.53: bytes=32 time=20ms TTL=59
The Ping tool page also contains a link to the TraceRoute tool. Click on the TraceRoute link below thenavigation bar at the top of the page.
Ping 268

TraceRoute
TraceRoute is a tool that shows you the network path between two locations. It shows you the address andhow long it takes to get to each hop in the path. When there is a problem with the network, traceroute canoften be used to narrow down where the problem is occurring. This tool will do a traceroute from your serverto another location. The TraceRoute tool is accessible by a link below the navigation bar on the Ping toolpage.
This TraceRoute form provides a gateway to the standard UNIX traceroute program which determines theroute across a network taken by packets from one host to another host. In this case, the traceroute will startfrom your server. It will display the path taken to reach the host or IP address you have listed in the text entrybox.
You can use this utility to verify connectivity of a host and determine how the host is connected to theInternet. You can also determine the path taken from your server to the specified host. This will allow you,for example, to determine where packet loss may be occurring when you attempt to connect to hostselsewhere on the Internet.
To perform a traceroute, enter the domain name or IP address of the other location in the text entry box.Clicking the TraceRoute button initiates the action.
TraceRoute 269

Get URL Tool
Get URL is a tool to retrieve an item from a web server. The URL specifies the server to contact and the itemto return. Because SiteScope displays the content of the requested URL, this tool also functions as a Get URLContent tool. You can use this utility to verify that a given URL can be accessed from a web server. You canalso use it to see how long it takes for the page to be returned.
The user name and password can be optionally entered for pages requiring authorization, and a proxy nameor address can be optionally entered to use a given proxy. You can also choose to have SiteScope retrieve anyframes and/or images that are part of the URL being requested. Normally SiteScope retreives only the contentof the requested URL.
Complete the Get URL form as indicated. Clicking the Get URL button will initiate the test. The results ofthe test are displayed on the lower portion of the page. The results include statistics on the URL retreival aswell as a text representation of the URL content.
Get URL Tool 270
URL Transaction Tool
The URL Transaction Tool simulates a user's session across several pages. An example of this would beentering an account name via a Web form, checking an account status for the page that is returned, and thenfollowing a sequence of links through several more pages.
A URL transaction is specified by giving a URL to start at and then specifying either additional URLs, ormore commonly, links or buttons to follow. For each step you may specify a match or error string to searchfor, a user name and password to enter, and POST data for that step.
The URL Transaction tool returns the status and time taken for each step in the sequence. It also embeds acopy of the page returned at each step of the sequence in it's output so that a more graphical view of thetransaction can be viewed. Note that any graphics referenced by these pages will show up as broken - this isso that the HTML that is output is the exact same HTML that was retrieved, making debugging more precise.
Status
The reading is the current value of the monitor. Possible values are:
• OK• unknown host name• unable to reach server• unable to connect to server• timed out reading• content match error• document moved• unauthorized• forbidden• not found• proxy authentication required• server error• not implemented• server busy
The status is logged as either good or error. An error status is returned if the current value of the monitor isanything other than OK. If you would like for SiteScope to respond if an error status is returned, create analert. An alert contains instructions that tell SiteScope to either notify you via e-mail, pager, SNMP trap, orexecute an automatic recovery script when a problem is detected.
Completing the Check URL Transaction Form
To display the Check URL Transaction Form, click the Tools link listed in the More column next to a URL
URL Transaction Tool 271
Transaction Monitor. This will display the Check URL Sequence form. Complete the fields on the CheckURL Transaction form as follows. When all the fields are complete, click the Check URLTransaction button.
Step 1 - Type:
SiteScope expects that the first step in the transaction will be a URL, so the default is alreadychosen for you.
Step 1 - Reference:
Enter the URL of the first page in the transaction that you want SiteScope to complete. Forexample, if you want SiteScope to test your order process, you might enter a URL such ashttps://www.freshtech.com/order.html
Step (2 thru N) - Type:
From Step 2 on, you must tell SiteScope what you want it to do next. In the Type field, tellSiteScope what type of item it will be looking for in this step. For example, if SiteScope willbe doing the equivalent of selecting a submit button, you would choose the Form - matchthe displayed name of a Submit button. SiteScope uses this information to scan the HTMLfor the proper text matches.
Step (2 thru N) - Reference
Enter the URL, link, or submit button to be followed at this step. For example, if SiteScopeshould follow the submit button on the page and the name on the button (its value) is "PlaceMy Order", type Place My Order in this field. To instruct SiteScope to follow a link on thepage, type the text of the link. For example, if the link says Next, type the word Next in thisfield. You can also type in a full URL. If an image is used as the submit button, you must enter the name value for the image. You'llfind this by looking at the HTML for the form.
Advanced Options
The advanced options give you the ability to customize error and warning thresholds, or complete optionalsettings.
POST Data:
If this step contains a URL for a POST request, enter the post variables, one per line asname=value pairs. This option is used to verify that a form is working correctly byperforming the same request that occurs when a user submits a form. See also the MatchContent field for a way to verify that the correct form response was received. If this field isblank, a GET request is performed.
SiteScope User Guide
Completing the Check URL Transaction Form 272

User Name:
Enter the user name, if any, required for this step.
Password:
Enter the password, if any, required for this step.
SiteScope User Guide
Advanced Options 273
Network Tool
The Network Tool reports the current network interface statistics and lists the active network connections. This information can be useful to determine the health of you network interface. You can also use this tool totrack down problems where network connections are being left open or runaway conditions where more andmore connections are being opened without ever being closed.
The Network Tool runs once when it is opened and reports the network information. The data returned by thetool are displayed on the lower portion of the Network Tool page. The information can be updated byclicking on the Run Network button.
Network Tool 274

Services
Services is a tool that lists which services (processes) are running on a machine. By default, it will display theservices running on the same machine as SiteScope, but you may enter the name of a different machine todisplay the list of services running on that machine.
Services 275

Get URL
Get URL is a tool to retrieve an item from a web server. The URL specifies the server to contact and the itemto return. The user name and password can be optionally entered for pages requiring authorization, and theproxy can be optionally entered to use a given proxy.
You can use this utility to verify that a given URL can be accessed from a web server. You can also use it tosee how long it takes for the page to be returned.
Get URL 276
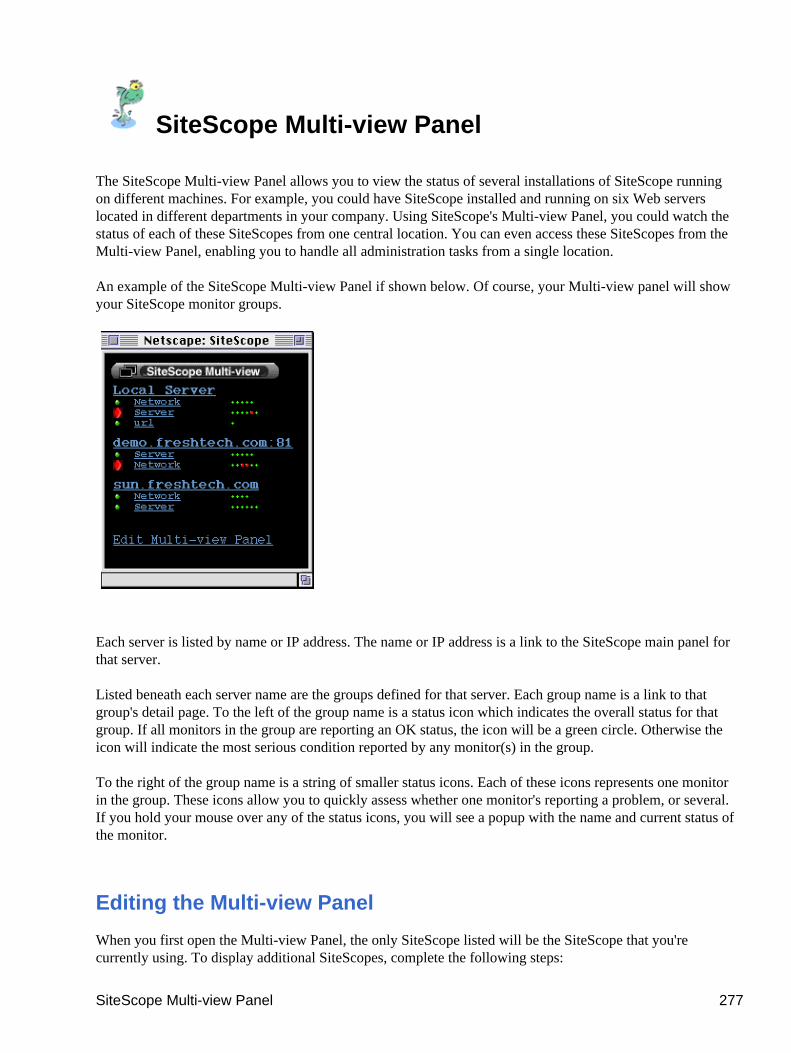
SiteScope Multi-view Panel
The SiteScope Multi-view Panel allows you to view the status of several installations of SiteScope runningon different machines. For example, you could have SiteScope installed and running on six Web serverslocated in different departments in your company. Using SiteScope's Multi-view Panel, you could watch thestatus of each of these SiteScopes from one central location. You can even access these SiteScopes from theMulti-view Panel, enabling you to handle all administration tasks from a single location.
An example of the SiteScope Multi-view Panel if shown below. Of course, your Multi-view panel will showyour SiteScope monitor groups.
Each server is listed by name or IP address. The name or IP address is a link to the SiteScope main panel forthat server.
Listed beneath each server name are the groups defined for that server. Each group name is a link to thatgroup's detail page. To the left of the group name is a status icon which indicates the overall status for thatgroup. If all monitors in the group are reporting an OK status, the icon will be a green circle. Otherwise theicon will indicate the most serious condition reported by any monitor(s) in the group.
To the right of the group name is a string of smaller status icons. Each of these icons represents one monitorin the group. These icons allow you to quickly assess whether one monitor's reporting a problem, or several.If you hold your mouse over any of the status icons, you will see a popup with the name and current status ofthe monitor.
Editing the Multi-view Panel
When you first open the Multi-view Panel, the only SiteScope listed will be the SiteScope that you'recurrently using. To display additional SiteScopes, complete the following steps:
SiteScope Multi-view Panel 277

1. Choose the Edit Multi-view Panel link in the lower portion of the Multi-view Panel. The Servers inMulti-view Panel appears.
2. Choose the Add to Multi-view Panel link. The Add to Multi-view Panel appears.3. Type the host name and SiteScope port number of the server in the text entry field (for example,
demo.freshtech.com:8888).4. Press the Add to Multi-view Panel button.
The newly added server will be listed last in the server table and will appear on the Multi-view panel the nexttime the screen refreshes.
Advanced Options
The following options can be changed by editing the SiteScope/groups/master.config file.
• The size of the Multi-view window can be changed by editing the _overviewOptions value in theSiteScope/groups/master.config file. Other window options, such as whether scroll bars or toolbarsare displayed, can also be controlled with this option.
• The number of columns in the Multi-view Panel can be changed by editing the_overviewColumns value. A value of 0 (zero) will put all the groups for a server on one line.
• The refresh rate (the number of seconds before the page is automatically reloaded) can be changed byediting the _overviewRefreshRate value.
SiteScope User Guide
Editing the Multi-view Panel 278
Servers in Multi-view Panel
This page allows you to administer the different SiteScopes displayed on the Multi-view Panel. At the top ofthe page you'll see the servers table which displays the servers currently listed on the SiteScope Multi-viewPanel. Each of these servers must be running SiteScope. In addition to viewing the currently displayedservers, you may add, edit, and delete servers from this page.
In this section we'll discuss:
• The servers table• Adding a server to the Multi-view Panel• Deleting a server from the Multi-view Panel• Editing a server on the Multi-view Panel
The Servers Table
The servers table displays the servers currently displayed on the Multi-view Panel. The server's name is listedin the Name column, and directly to the right of each name are an Edit and Del columns. To edit the servername or IP address, choose the Edit link. To remove a server from the Multi-view Panel, choose the link inthe Del column.
Adding a Server to the Multi-view Panel
When you first open the Multi-view Panel, only the SiteScope that you're currently using will be displayed.If you have SiteScope running on additional servers and would like to be able to view and administer themfrom a central location, you may add them from this page.
To add a server running SiteScope to the SiteScope Multi-view Panel, complete the following steps:
1. Choose the Add to Multi-view Panel link. The Add to Multi-view Panel appears.2. Type the host name and port number of the server in the text entry field (for example,
demo.freshtech.com:8888).3. Optionally, enter a title to use instead of the server name and port number.4. Optionally, enter the user name and password needed to connect to this server.5. Optionally, enter the proxy, proxy username, and proxy password to connect to this server using a
proxy server.6. Press the Add to Multi-view Panel button.
The newly added server will be listed last in the server table and will appear on the Multi-view panel the nexttime the screen refreshes.
Note: If you've added a server that doesn't exist or is not running SiteScope, you will see an error on the
Servers in Multi-view Panel 279

Multi-view Panel.
Deleting a Server from the Multi-view Panel
To delete a server from the Multi-view Panel, complete the following steps:
1. Click the X link in the Del column. A confirmation message appears.2. Click the Delete button.
The server will no longer appear in either the server table or the Multi-view Panel.
Editing a Server in the Multi-view Panel
To change the name or IP address of a server in the Multi-view Panel, complete the following steps.
1. Choose the Edit link in the Edit column next to the server you want to change. The UpdateMulti-view Panel page appears.
2. Type the new name or IP address in the Server Address text entry field.3. Optionally, enter a title to use instead of the server name and port number.4. Optionally, enter the user name and password needed to connect to this server.5. Optionally, enter the proxy, proxy username, and proxy password to connect to this server using a
proxy server.6. Click the Update Multi-view Panel button.
Your changes will appear immediately in the server table, and will appear on the Multi-view Panel the nexttime the page refreshes.
SiteScope User Guide
Adding a Server to the Multi-view Panel 280