site 1 datacenter
TRANSCRIPT
Integral Group 161 Bowery, 4th Floor New York, NY 10002 (510) 868-0485 www.IntegralGroup.com
January 25, 2013
Thermal Mapping Scoping Study for:
Site 1 Datacenter Southeastern, MA
Level 2 Assessment
1
Contents
Executive Summary ....................................................................................................................... 2
Table 1: Summary of Initial Calculations ........................................................................................... 3
Thermal Mapping Process Overview .................................................................................................. 4
Measure 1: Re-pipe and Operate Free Cooling Heat Exchanger ............................................................ 7
Measure 2: Implement Aisle Containment in Hot Spots ....................................................................... 8
Appendix I: Full Size Temperature, Relative Humidity and Underfloor Pressure Maps
2
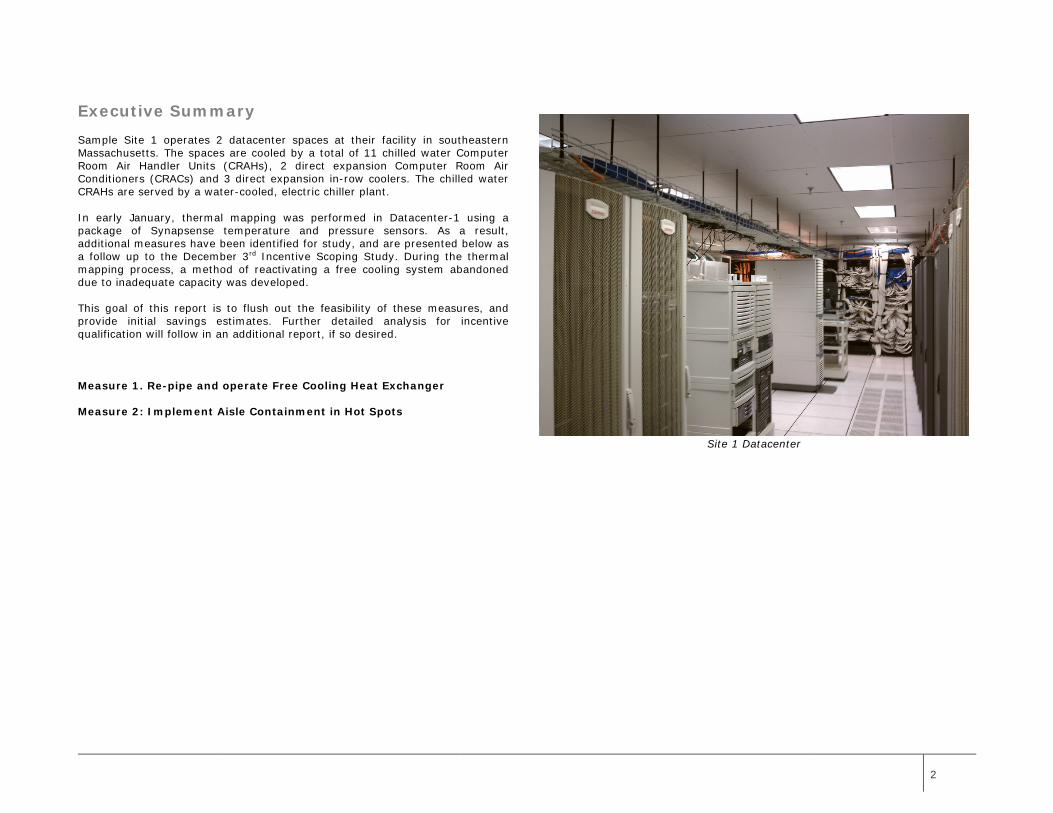
Executive Summary Sample Site 1 operates 2 datacenter spaces at their facility in southeastern Massachusetts. The spaces are cooled by a total of 11 chilled water Computer Room Air Handler Units (CRAHs), 2 direct expansion Computer Room Air Conditioners (CRACs) and 3 direct expansion in-row coolers. The chilled water CRAHs are served by a water-cooled, electric chiller plant.
In early January, thermal mapping was performed in Datacenter-1 using a package of Synapsense temperature and pressure sensors. As a result, additional measures have been identified for study, and are presented below as a follow up to the December 3rd Incentive Scoping Study. During the thermal mapping process, a method of reactivating a free cooling system abandoned due to inadequate capacity was developed.
This goal of this report is to flush out the feasibility of these measures, and provide initial savings estimates. Further detailed analysis for incentive qualification will follow in an additional report, if so desired.
Measure 1. Re-pipe and operate Free Cooling Heat Exchanger
Measure 2: Implement Aisle Containment in Hot Spots
Site 1 Datacenter
3
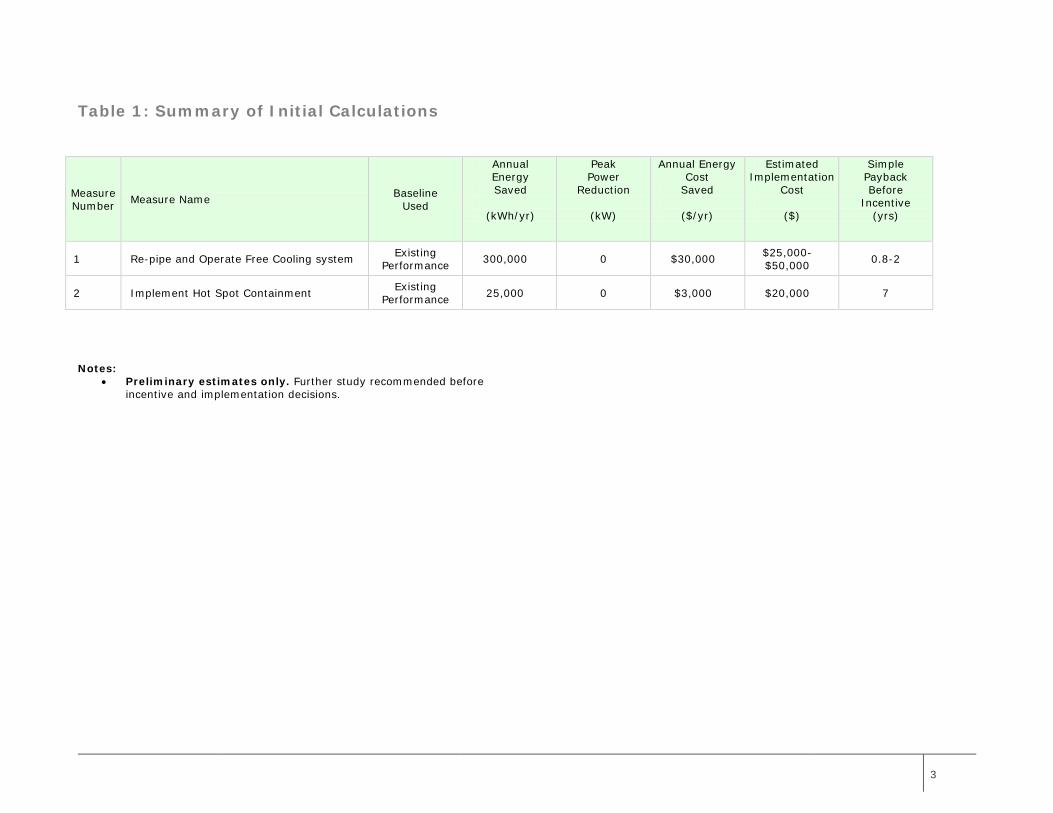
Table 1: Summary of Initial Calculations
Notes: • Preliminary estimates only. Further study recommended before
incentive and implementation decisions.
Measure Number Measure Name Baseline
Used
Annual Energy Saved
(kWh/yr)
Peak Power
Reduction
(kW)
Annual Energy Cost
Saved
($/yr)
Estimated Implementation
Cost
($)
Simple Payback Before
Incentive (yrs)
1 Re-pipe and Operate Free Cooling system Existing Performance 300,000 0 $30,000 $25,000-
$50,000 0.8-2
2 Implement Hot Spot Containment Existing Performance 25,000 0 $3,000 $20,000 7
4
Thermal Mapping Process Overview
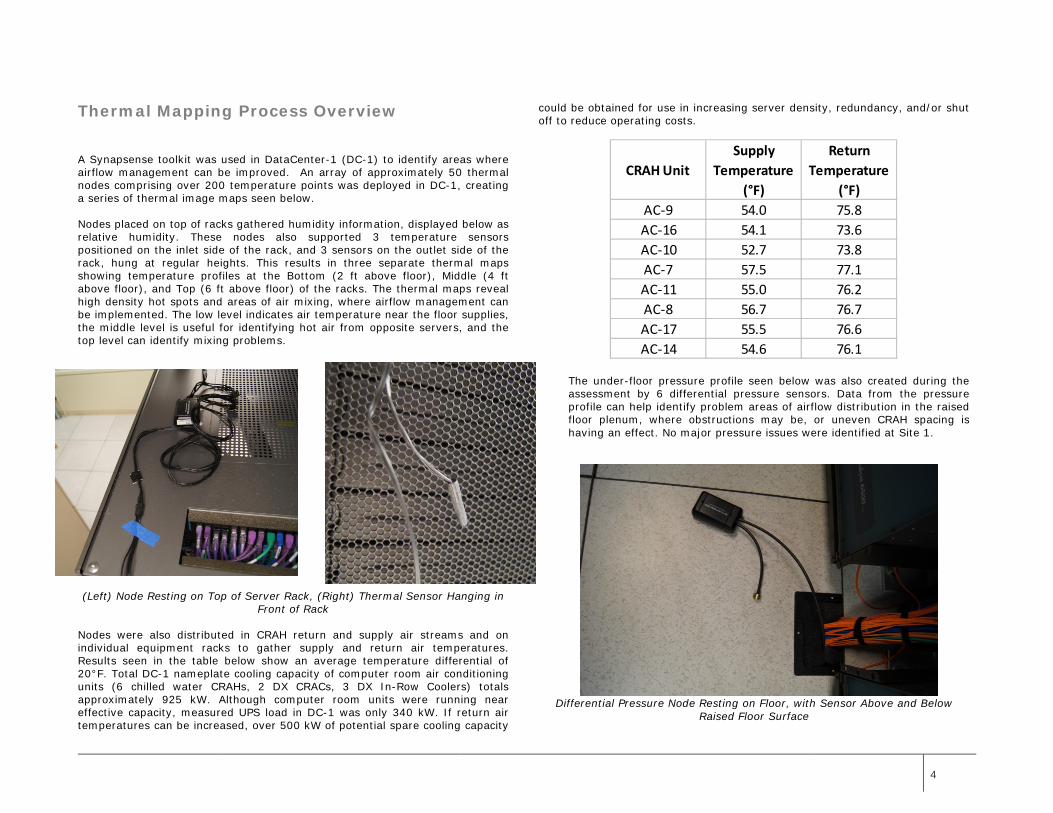
A Synapsense toolkit was used in DataCenter-1 (DC-1) to identify areas where airflow management can be improved. An array of approximately 50 thermal nodes comprising over 200 temperature points was deployed in DC-1, creating a series of thermal image maps seen below.
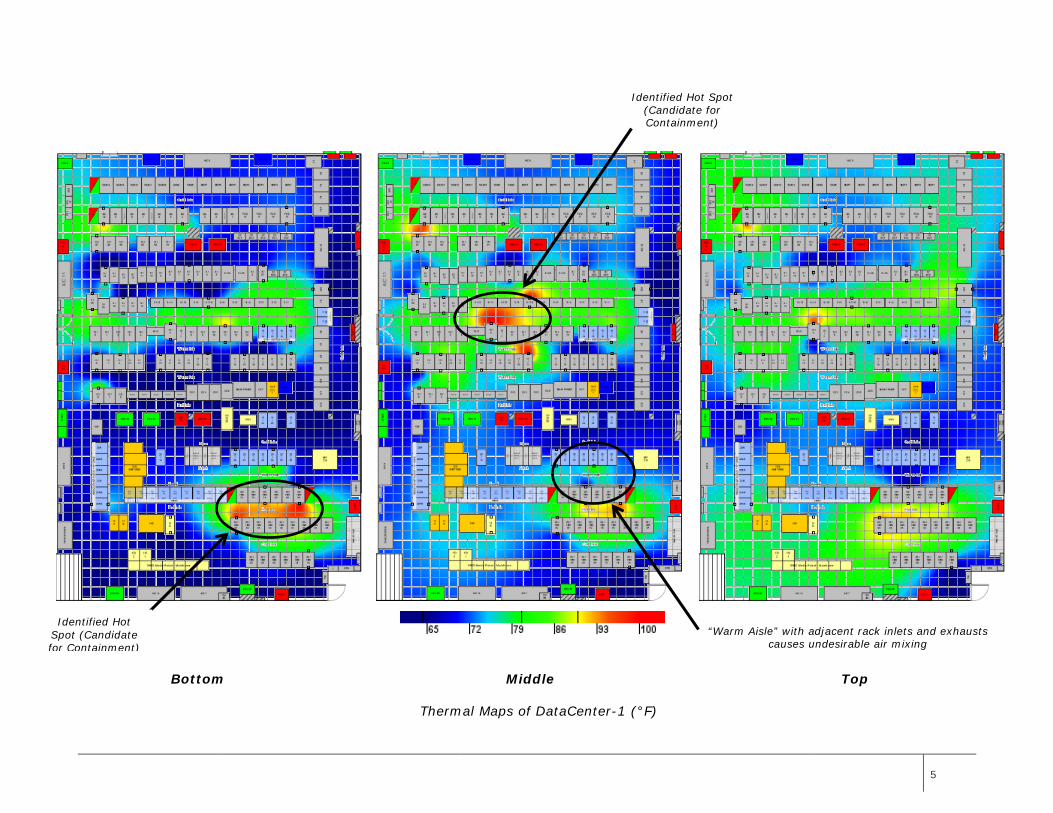
Nodes placed on top of racks gathered humidity information, displayed below as relative humidity. These nodes also supported 3 temperature sensors positioned on the inlet side of the rack, and 3 sensors on the outlet side of the rack, hung at regular heights. This results in three separate thermal maps showing temperature profiles at the Bottom (2 ft above floor), Middle (4 ft above floor), and Top (6 ft above floor) of the racks. The thermal maps reveal high density hot spots and areas of air mixing, where airflow management can be implemented. The low level indicates air temperature near the floor supplies, the middle level is useful for identifying hot air from opposite servers, and the top level can identify mixing problems.
(Left) Node Resting on Top of Server Rack, (Right) Thermal Sensor Hanging in Front of Rack
Nodes were also distributed in CRAH return and supply air streams and on individual equipment racks to gather supply and return air temperatures. Results seen in the table below show an average temperature differential of 20°F. Total DC-1 nameplate cooling capacity of computer room air conditioning units (6 chilled water CRAHs, 2 DX CRACs, 3 DX In-Row Coolers) totals approximately 925 kW. Although computer room units were running near effective capacity, measured UPS load in DC-1 was only 340 kW. If return air temperatures can be increased, over 500 kW of potential spare cooling capacity
could be obtained for use in increasing server density, redundancy, and/or shut off to reduce operating costs.
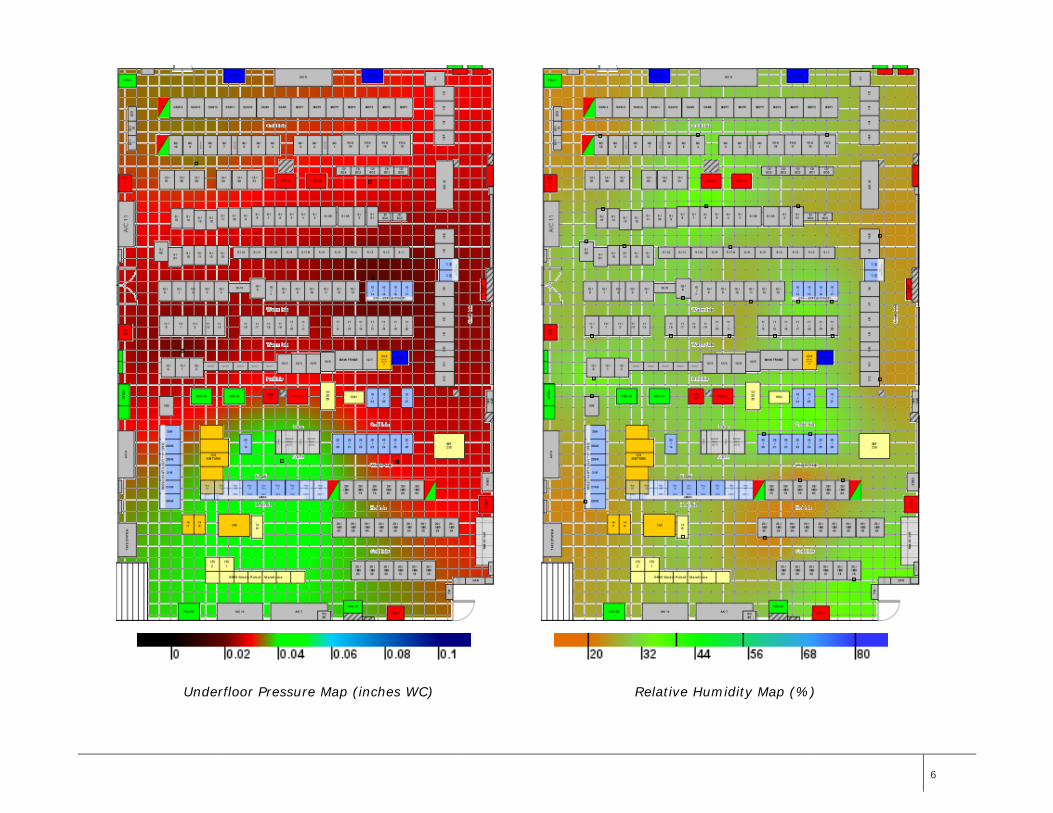
The under-floor pressure profile seen below was also created during the assessment by 6 differential pressure sensors. Data from the pressure profile can help identify problem areas of airflow distribution in the raised floor plenum, where obstructions may be, or uneven CRAH spacing is having an effect. No major pressure issues were identified at Site 1.
Differential Pressure Node Resting on Floor, with Sensor Above and Below Raised Floor Surface
CRAH UnitSupply
Temperature (°F)
Return Temperature
(°F)AC-9 54.0 75.8AC-16 54.1 73.6AC-10 52.7 73.8AC-7 57.5 77.1AC-11 55.0 76.2AC-8 56.7 76.7AC-17 55.5 76.6AC-14 54.6 76.1
5
Bottom Middle Top
Thermal Maps of DataCenter-1 (°F)
Identified Hot Spot (Candidate for Containment)
Identified Hot Spot (Candidate for Containment)
“Warm Aisle” with adjacent rack inlets and exhausts causes undesirable air mixing
6
Underfloor Pressure Map (inches WC) Relative Humidity Map (%)
7
Measure 1: Re-pipe and Operate Free Cooling Heat Exchanger
General Description
A survey of the data center while implementing the Thermal Mapping program revealed 6 chilled water CRAH units serving DC-1. Further investigation lead to the large chilled water plant which serves these CRAHs, plus 5 CHW CRAHs in DC-2, and building air handlers.
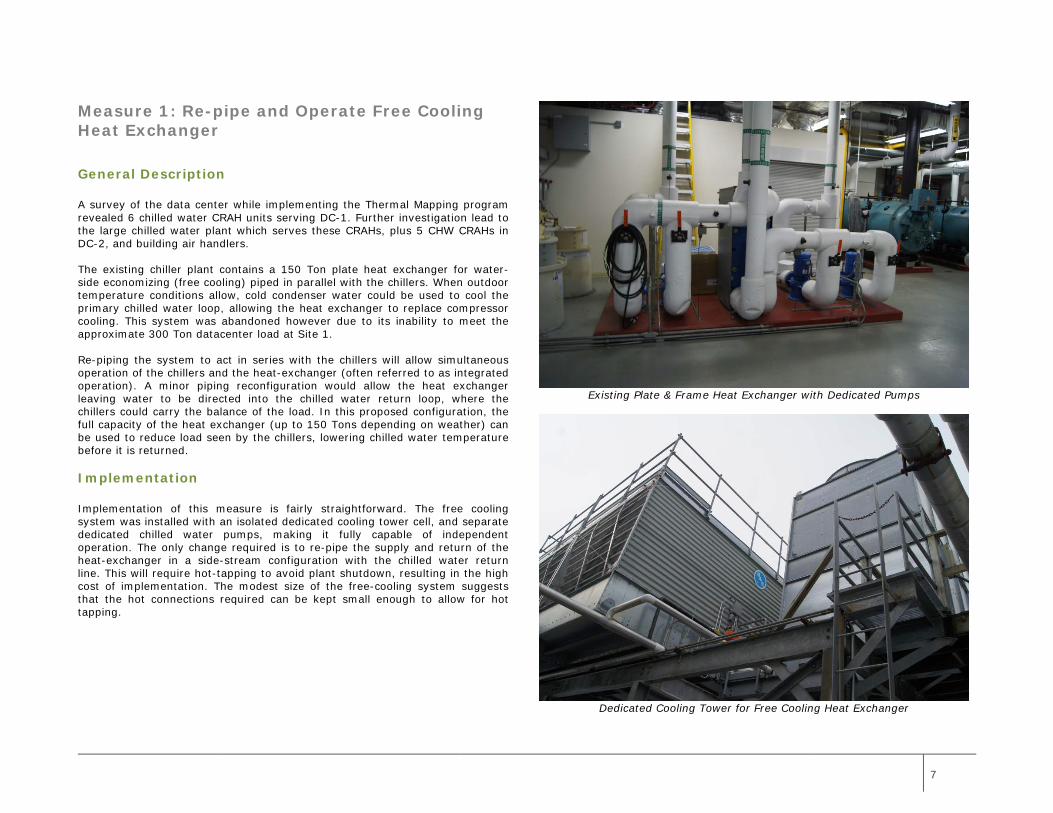
The existing chiller plant contains a 150 Ton plate heat exchanger for water-side economizing (free cooling) piped in parallel with the chillers. When outdoor temperature conditions allow, cold condenser water could be used to cool the primary chilled water loop, allowing the heat exchanger to replace compressor cooling. This system was abandoned however due to its inability to meet the approximate 300 Ton datacenter load at Site 1.
Re-piping the system to act in series with the chillers will allow simultaneous operation of the chillers and the heat-exchanger (often referred to as integrated operation). A minor piping reconfiguration would allow the heat exchanger leaving water to be directed into the chilled water return loop, where the chillers could carry the balance of the load. In this proposed configuration, the full capacity of the heat exchanger (up to 150 Tons depending on weather) can be used to reduce load seen by the chillers, lowering chilled water temperature before it is returned.
Implementation
Implementation of this measure is fairly straightforward. The free cooling system was installed with an isolated dedicated cooling tower cell, and separate dedicated chilled water pumps, making it fully capable of independent operation. The only change required is to re-pipe the supply and return of the heat-exchanger in a side-stream configuration with the chilled water return line. This will require hot-tapping to avoid plant shutdown, resulting in the high cost of implementation. The modest size of the free-cooling system suggests that the hot connections required can be kept small enough to allow for hot tapping.
Existing Plate & Frame Heat Exchanger with Dedicated Pumps
Dedicated Cooling Tower for Free Cooling Heat Exchanger
8
Measure 2: Implement Aisle Containment in Hot Spots
General Description
According to the ASHRAE publication Thermal Guidelines for Data Processing Environments, a key recommendation is to use a hot aisle/cold aisle configuration in datacenters. The intent of this concept is to maximize the delivery of cooled air to the intakes of the electronic equipment and allow for efficient extraction of the discharged warm air. The hot aisle/cold aisle configuration permits a greater difference in temperature between the supply and return air (‘delta-T’) than would be allowable otherwise. This larger temperature difference in turn allows for a lower quantity of air to perform the required cooling, saving fan energy.
Site 1 has already taken a number of steps to increase return air temperature, including ducting return air from a ceiling plenum, and installing blanking panels to reduce air mixing. Operating staff however is not under complete control of rack arrangement, and problem areas exist in configuration, such as exhaust sides of racks facing inlet sides, creating a mixing region referred to by staff as “warm aisles.”
Proposed
Areas identified in the thermal map with hottest temperatures, represent the best places to focus efforts to improve efficiency and recover capacity (see “Thermal Mapping Process Overview”). Wherever a true hot aisle occurs also represents opportunity. These areas should be isolated with strip curtains on the ends of aisles, and the tops of the racks, in order to direct exhaust air directly into the overhead plenum. By adding such curtains in the hottest areas of the data center, it is estimated that overall return air temperature can be increased by approximately 1 degree F.
Implementation
Fan energy can be reduced where possible to take advantage in the increased CRAH cooling capacity. This approach has the added benefits of increasing system redundancy, and reducing fan motor waste heat (and therefore cooling load).
AC-17 is currently the only CRAH in DC-1 equipped with a variable speed fan. Estimated savings for this measure are based on reducing fan speed of AC-17. Further savings and better overall space control can be achieved by retrofitting other units with VFDs.
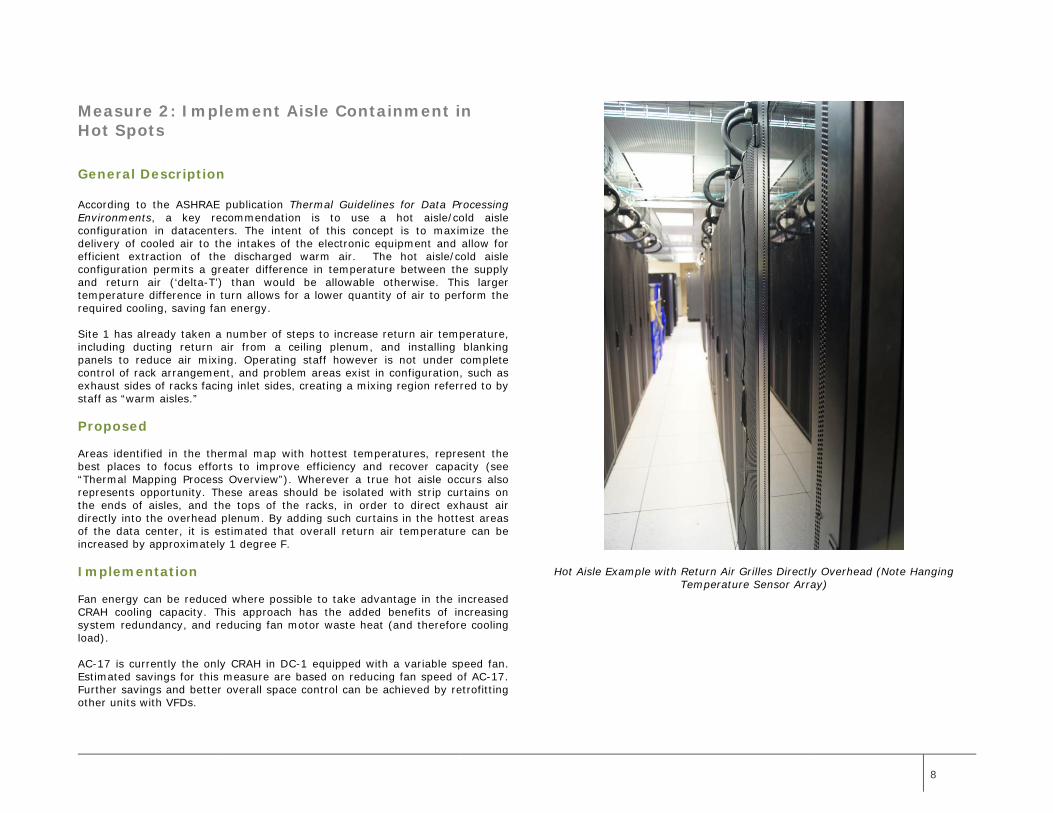
Hot Aisle Example with Return Air Grilles Directly Overhead (Note Hanging Temperature Sensor Array)
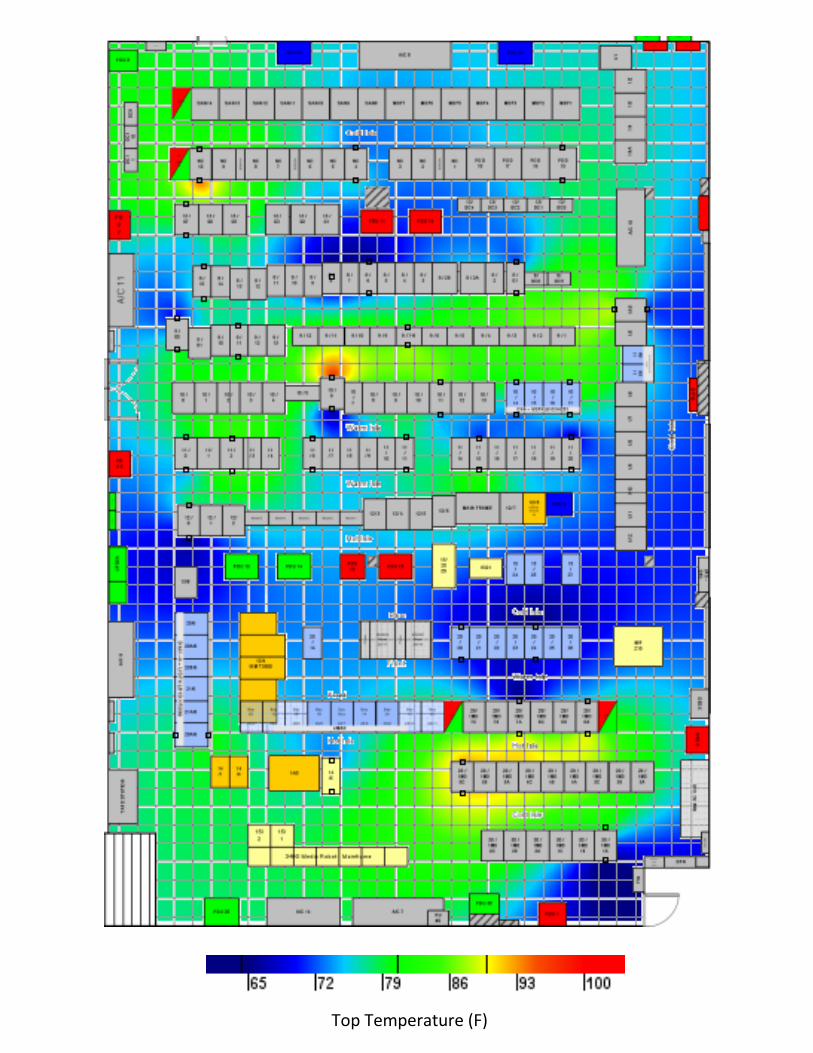
Top Temperature (F)
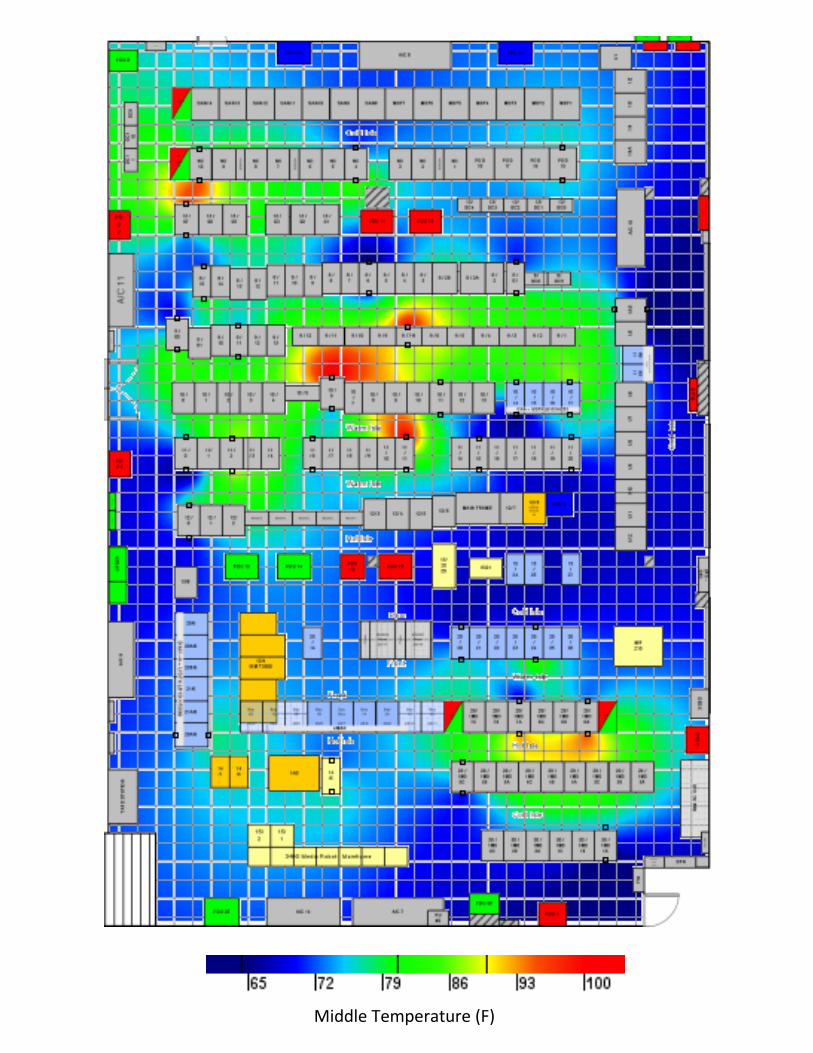
Middle Temperature (F)
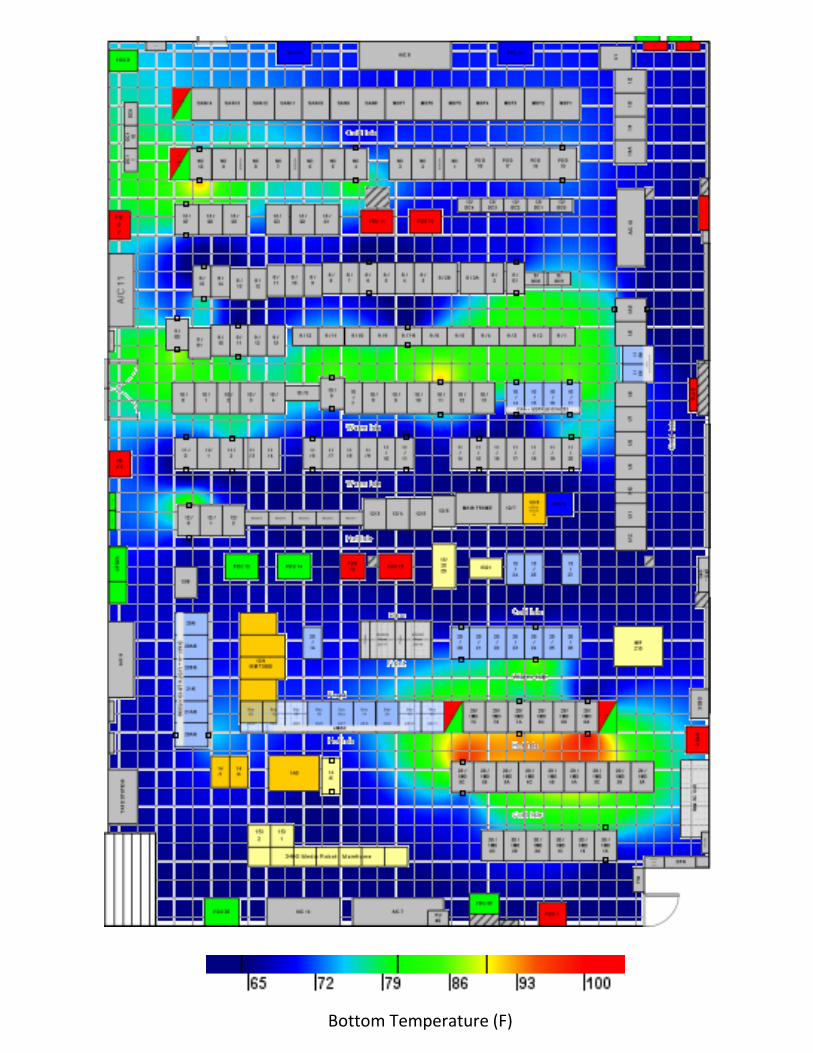
Bottom Temperature (F)
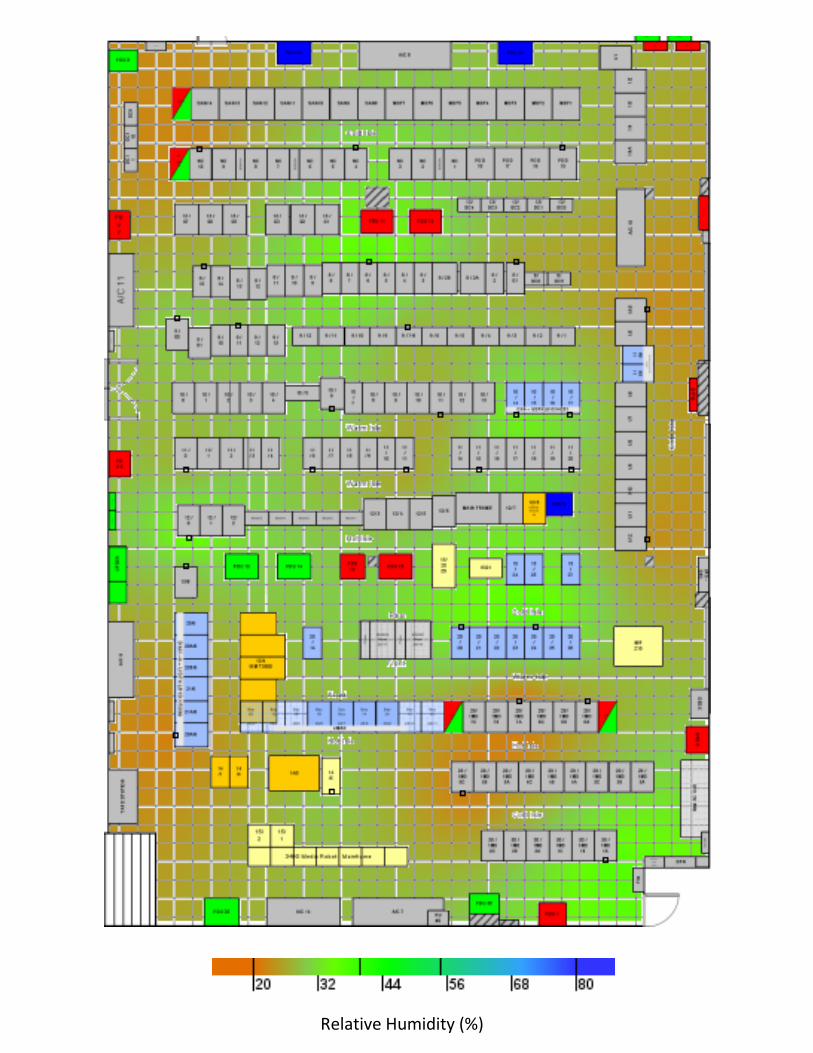
Relative Humidity (%)
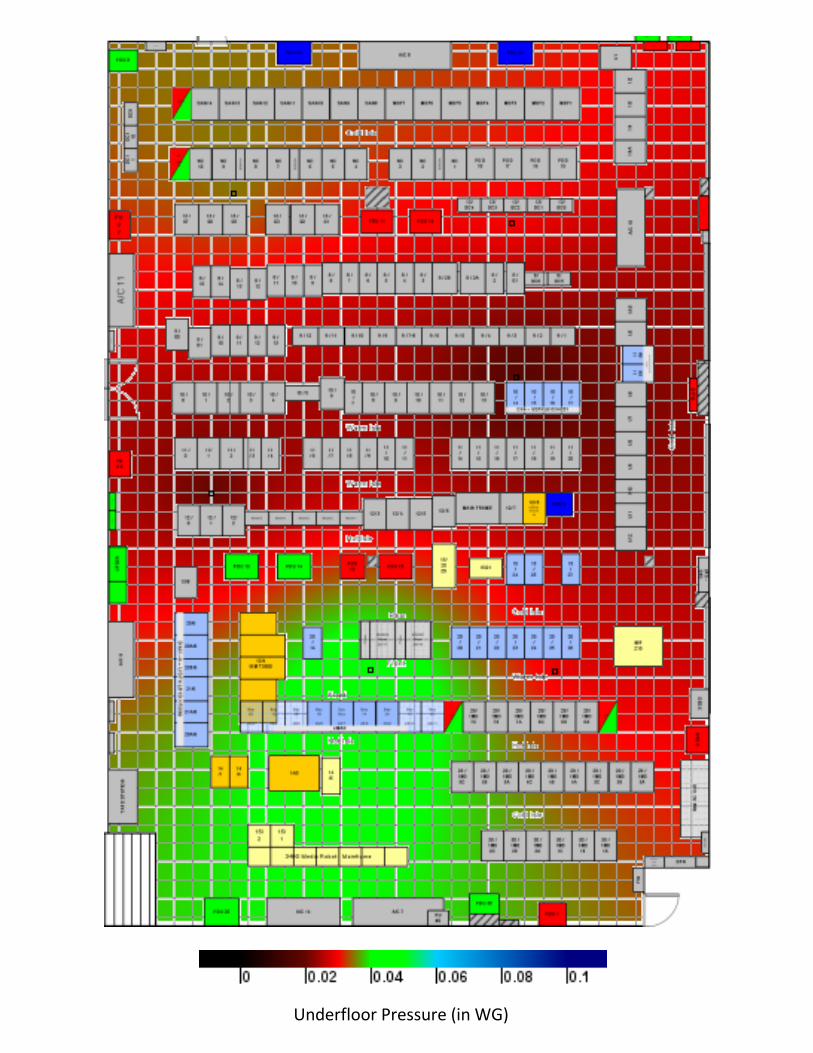
Underfloor Pressure (in WG)