séissmograph public final - · pdf file(fmcg) results 3. in short: ... therefore,...
TRANSCRIPT

Séissmograph 2012/ 2013
Market CartographyFree Sorting in Qualitative Market Research
Séissmo - Markt und Forschung
Inh. Natacha DagneaudG7, 34
68159 Mannheim, Germanywww.seissmo.com
10.Séissmograph

Our Starting Point: We Live in Permanently Oversaturated Markets
The researchers’ point of view:
Ø Clusters belong to our methodological repertoire, and are almost part of our inventory.
Ø Nevertheless, we often get feedback that our love of real products (or brand logos) on a table is a typical Séissmo specialty.
Ø For a long time we’ve wanted to know how we’ve intuitively refinedour method.
We wanted to arrive at a consolidated theory of
clusters, assuming that one cluster isn’t equal to another.
The consumers’ point of view:
Ø Consumers want choice and novelty. They want the exact hair dye product that perfectly matches their hair colour.
Ø But they feel overwhelmed, fail to get an overview of the offer and feel frustrated. Have they overlooked an interesting product that could have better answered their needs?
Ø Facing thousands of SKUs, consumers develop coping strategies that simplify the offer.
We wanted to make the consumers’ navigation
visible.
The manufacturers’ point of view:
Ø Manufacturers and retailers face a huge challenge of complexity:
Ø Towards more and more: Permanent innovation, with new boundaries and emerging product categories.
Ø Towards less and less: Permanent pressure on SKUs and shelf space, forcing strict portfolio management.
We wanted to help in making better decisions,
including both needs and constraints.
The researchers’ point of view:
The consumers’ point of view:
The manufacturers’ point of view:
2

Why Are Qualitative Clusters in Séissmo’s DNA?
• Séissmo’s name stems from geology:– deep layers and their composition– tremors and shifts/ movements
• Annual self-funded experimental research: Séissmograph 2012/2013– We introduce a sorting technique capable of detecting such trends and
tremors: The Market Cartography.
A solid fundament:
• First applications in 2002, strongly developed in 2004 and the years after
• 103 ad hoc research projects using clusters were analysed in 2012/2013 to consolidate our theory
• Self-funded experiments conducted during summer 2013, in total 6 consumer groups across different product categories (FMCG)
Results
3

In Short: The Method

Free Sorting: Intuitive and So Normal!
Do the consumers arrange the screws according to…
?
sorting
Basic Principle: Arranging items according to their similarity and with respect to their proximity
The crux for market research: the sorting criteria chosen by consumers= what you pay attention to when you choose a screw (or any other product)
…their length …their head ….their thread
5
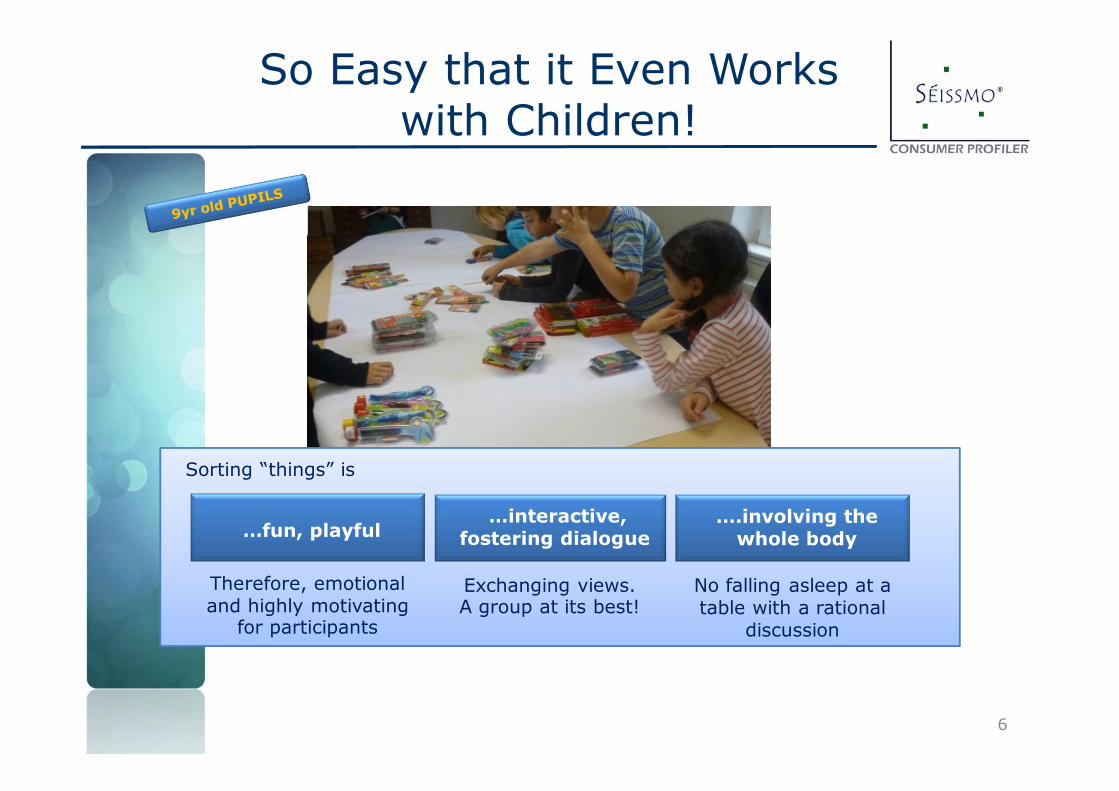
So Easy that it Even Works with Children!
Sorting “things” is
…fun, playful…interactive,
fostering dialogue….involving the
whole body
Therefore, emotional and highly motivating
for participants
Exchanging views.A group at its best!
No falling asleep at a table with a rational
discussion
6

Our International Practice
Perfumes Chewing gum
Shower gelsMale grooming
Pots/ Pans
Baby toys
Sweeteners
Skin care
Examples of our practice around the
world…
Pasta, Sauces,Ready Meals
Dairy products
7

What Is Market Cartography?- a Technical Definition
Ø A market cartography models the consumers’ mental mapping of a market, i.e. a product category, portfolio structure or other defined product scope.
Ø It is based on free sorting techniques that can be used as part of a group discussion, where 6 or more respondents organize a randomly arranged set of products into segments according to their own criteria.
Ø A non-directive, implicit and iterative method:§ Consumers are free to choose their own sorting criteria and hence we
learn how they see the market è hypothesis finding rather than thesis verification.
§ Free sorting + projective techniques = decoding of the consumers’ mental categories and relevant segmentation criteria/ purchase criteria.
§ The sorting process can be repeated multiple times in one group and in many variations (e.g. with more/ less/ different products) across different groups.
8

7 Kinds of Answers You Get

1. Checking Comprehension
2. Measuring Heartbeats
5. Detecting Trends
4. Cracking the Code(s)
6. Piloting Launches
3. Mastering Navigation
Learning (a Lot!) While They Are Doing
10
7. Steering Innovation

1. Checking Comprehension
This reveals the level of cognitive involvement required by your product.
If it is not immediately clear what it is about, it will have a hard time to emerge out of the crowd. It will create confusion and insecurity.
Unless you have a wonderful and striking design/ feature to encourage the consumer to spend time and effort!
– Via the process of sorting, consumers are under pressure to be quick.
– This reproduces the very fast paced orientation processes in real life.
– When they don’t understand a product, they leave it. Ignore it. Put it aside. Or hesitate a lot before they attribute it to a group. Move the product from place to place. Bad sign for your product…
11
Do the consumers understand your intentions?How do they comprehend your products?

2. Measuring Heartbeats
We not only check the cognitive involvement, we listen to the heartbeat as well:– Some clusters are built very
quickly. Decoding can be easy, yet emotional involvement does not automatically correlate.
A good sign for your product?– When they spend time & effort
and talk a lot about a category…– When they joke, laugh, debate,
disagree…– When they give metaphoric
names and forget the descriptive ones to label the sub-group…
Are consumers motivated to pay more attention to your product than required just to sort and classify it? Is there something more…?
Biscuit assortments1) easily decoded…
2) yet no motivation to spend more time:
12
“rather for guests than for me”Cannot touch emotionally and enter the private sphere, because the “I” is missing.

3. Mastering Navigation
Observing the consecutive steps of classification, sub-segmentation and all kinds of corrective measures during the process, we end up delivering a mental map on how the consumer navigates inside the category.
13

4. Cracking the Code(s)
Thanks to the spontaneous sorting, latent segmenting criteria become visible. It is amazing how consumers sometimes perceive “difference”. This knowledge is precious for manufacturers to guide them into action.
14

5. Detecting Trends
15
Sorting does not just mirror the status quo of market perception. In the clusters we can also read where the road is taking us, as well as the lands we leave behind…

Within a cluster round, some items remain alone. They are a precious indicator of how well the new product launch performs (if at all)!
6. Piloting Launches
16

The axes of segmentation of the product set help to understand the rules of the category and reveal the need states. Some areas appear crowded, but by analytical deduction or simple observation we find unexploited spaces.
7. Steering Innovation
17
After the clustering step: our analytic
output
Codes↓
Parameters↓
Mapping

Consolidated Theory: Séissmo Customizes the
Methodology and Takes it Further!

We Validated Mainly 3 Types of Cartographies
Tectonic Cartographycross category clustering
Scope of competition and zones of influence
– wide scope, direct & indirect
the whole world of competition,
& market dynamics
Ø To (re-)define and understand who your competition really is
Ø And where you are within this world è brand positioning
Ø Draw (new) boarders between the relevant categories
Dynamic Cartographymono category clustering
What are the rules of your category? – immediate scope
a full map of allsub categories
Ø To learn how the consumer approaches a category
Ø Product positioning: where are your products anchored in this landscape
Ø How strong is your current/ new product in this category
Structural Cartographyclustering within your brand
How do consumers approach your products? – home ground
an organogram orfamily tree of your
brand portfolio
Ø How do consumers navigate through your portfolio?
Ø Star products, structure, history
Ø Brand legitimacy, brand stretch
Ø Cross-usage and cannibalization
consumer: (unmet) needs, desires, values, attitudes, motivatorsè influencing the consumers’ purchase decision criteria
shopper: socially learned signals and (culture) codesè impact and navigation at shelf level -> findability
Car
tog
rap
hy
teac
hes
us
abou
t b
oth
Strategic Exploration
Category Investigation
Portfolio Analysis
19

Tectonic Cartographycross category
clustering
Dynamic Cartographymono category
clustering
Structural Cartographyclustering
within your brand
Strategic Exploration
Category Investigation
Portfolio Analysis
20
Which Answer Different Types of Questions
WHAT EXACTLY IS the product we offer?
WHICH SEGMENTScurrently build the category
we are in?
WHO IS WHOin our portfolio?
ER&D E MarketingF Cat Man F

Our Own Experiments: An Overview
Tectonic Cartographycross category
clustering
126 products selected from different
categories: biscuits, cakes, sweets, chocolate
to explorethe whole world of
competition & market dynamics
CategoryCartography
mono category clustering
108 biscuits and close relatives selected by
consumersto understand
the rules of a single category and provide
a full map of allsub categories
PortfolioCartography
clustering within your brand
to investigate how consumers approach the products of a brand
and to build an organogram or family tree
of a brand portfolio
WHAT IS A BISCUIT?
WHICH SEGMENTS ARE THERE IN THE
CATEGORY OF BISCUITS?
HOW IS THE BRAND PORTFOLIO
STRUCTURED?
Experiment 1 Experiment 2 Experiment 3
74 Stabilo pens
21
Strategic Exploration
Category Investigation
Portfolio Analysis

Type 1: TECTONIC CARTOGRAPHY
cross categories
Scope of competition
Emerging needs
Trends
Innovation

Applicability in R&D and Marketing
§ To (re-)define and understand who your competition (direct and indirect) really is
§ To anticipate where the new competition (or source of inspiration??) might come from (category mergers and splits, white spaces)
§ To state where you (your brand, your products, your formats) are positioned within this world
§ To draw (new) borders between the relevant categories, decide about the relevant neighbourhood of categories at the POS (shelf close to which other one?)
§ To prepare the launch of a range, especially if you intend to stretch the category or want to enter a foreign market
§ To identify the trends, what drives consumers’ attention
“Tectonic Cartography”
23

Presentation of Experiment 1
What we did
By this tectonic cartography we learned:Ü What differentiate biscuits from other products’
categories (cakes, sweets, chocolate) àterritory’s delimitation
Ü That the most important and spontaneous criterion in sorting biscuits is the presence/ absence of chocolate à main driver
Ü Which trends affect these categories:complexity à evolution/ revolution
What we learned
§ We conducted two consumer groups to sort a large number of products from different categories (biscuits, cakes, sweets, chocolate)
§ Free sorting of 126 products with projective mapping and tectonic cartography
§ The participants were male and female, aged from 15 to 50
Separate table
Alternative: let the
consumers go hunting!
Safari purchase as a group task at a retailer nearby,
then back in facility
24

Learning 1: Draw the Category’s Boundaries and Delimitation!
Do you really know where your category starts and where it ends?We found out that the manufacturers’ opinion might strongly differ from the consumers’ view. Qualitative Clusters help to draw the frontiers and to define the true identity of each product.
25

Learning 2: Find Who Your (unexpected) Competitor is!
A biscuit with chocolate is still a biscuit, but not for example if it has a soft dough or is mini-sized! Consumers differentiate between soft and hard/ crumbling dough. This separates the biscuit world. But not the presence of chocolate. Therefore, chocolate is a powerful entrant in your world, merging with the crumbling cookies! Qualitative Clusters help to identify who is threatening/ entering your category and which products are perceived as far away.
26

Learning 3: Create Best Laboratory Conditions for NPD
27
Assorted biscuits
Chocolate Chocolate Chip
Cookies
Biscuits
With topping
With filling
Chocolate bar
Bar of chocolate
With filling
Round sandwich
“ ”
Round sandwich biscuits
“Doppelkekse”Test tubeH
Cell Division
Contours get sharperand allow
two categories/ territories to emerge
Filling Filling without a particular
shape
Decomposable assembly Composed unityLike a toy to play with
à “child”(Lego-principle)
Like a recipe à „adult“

Drivers
Codes
Rules
Differentiation
Type 2: CATEGORY CARTOGRAPHY
mono category

Applicability in Marketing and Category Management
§ To learn how consumers grasp a category: who and what drives the category, what are the rules and how do you deal with them
§ To find out what makes the category desirable versus boring§ To verify if people notice your products, where they are
anchored in this landscape – and what differentiates them from the competitors
§ To identify the need states served by the category and their respective connotations – and how you meet these needs with your offer
§ To fine-tune the launch of a new product in the category, especially if you are in a dynamic market with a lot of new entrants and short product cycles
§ To derive learning on how to organize and compose the shelf
“Category Cartography”
29
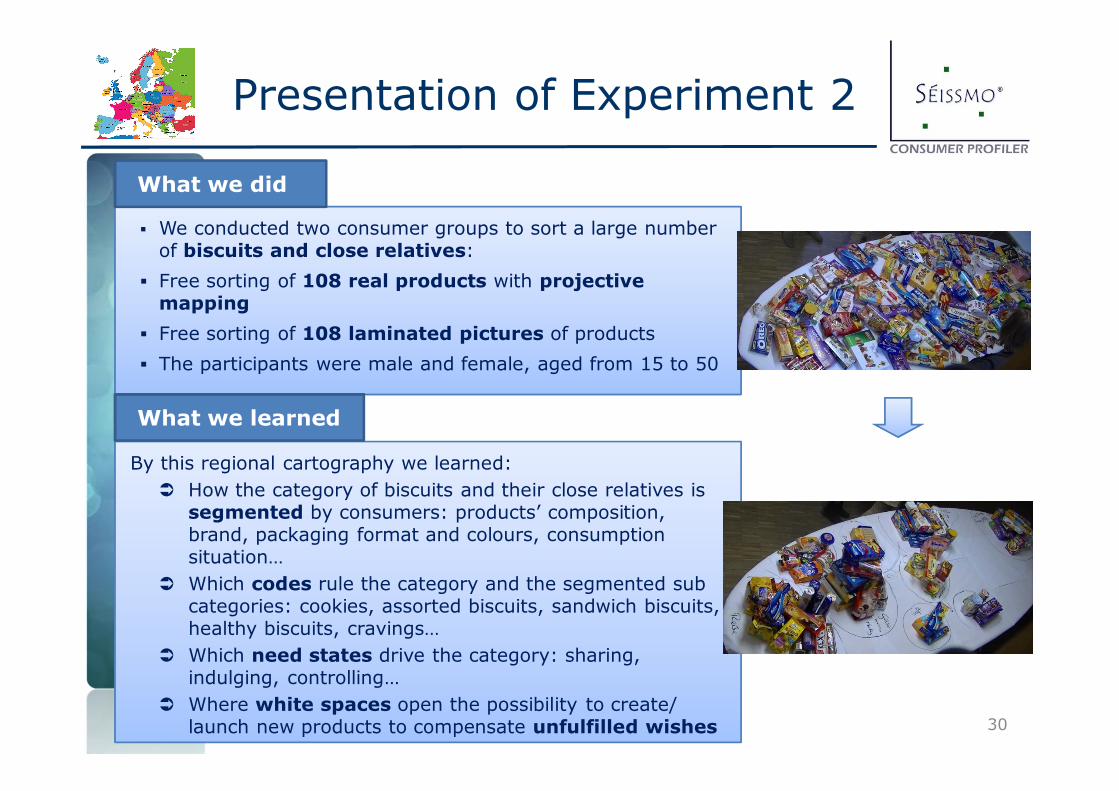
Presentation of Experiment 2
§ We conducted two consumer groups to sort a large number of biscuits and close relatives:
§ Free sorting of 108 real products with projectivemapping
§ Free sorting of 108 laminated pictures of products § The participants were male and female, aged from 15 to 50
By this regional cartography we learned:Ü How the category of biscuits and their close relatives is
segmented by consumers: products’ composition, brand, packaging format and colours, consumption situation…
Ü Which codes rule the category and the segmented sub categories: cookies, assorted biscuits, sandwich biscuits, healthy biscuits, cravings…
Ü Which need states drive the category: sharing, indulging, controlling…
Ü Where white spaces open the possibility to create/ launch new products to compensate unfulfilled wishes
What we did
What we learned
30

Learning 1: Draw the Category’s Sub-Segments and Identify the Need States!
Identification of the obvious (best visible, most discriminating and relevant criteria like colour, brand, material etc.) à rational(what is “logic”) salientsegmentation criteria emerge.Inside the biscuit territory, there are different sub-categories which a biscuit can be assigned to.
Consumers’ cluster:
1st round
Inside the biscuit territory a further clustering according to the consumption situation allow emotional segmentation criteria to emerge à consumers dip down beyond the obvious to reach a deeper segmentation level, showing a higher involvement.
Consumers’ cluster:
2nd , 3rd, 4th
rounds
leve
l of
invo
lvem
ent
31

Learning 2: Anticipate Emerging Sub-Segments!
Thanks to the iterative process of moving products around or re-assigning them to territories, we see how many need-states they fulfill and if they create new benefit platforms with tangible benefits and clear messages.
32

Learning 3: Learn to Exploit(or Manipulate) the Codes!
Successfully playing with the codes requires an understanding of the market rules. Decoding the implicit messages of the category enables you to interpret them and keeps you from disregarding and failing the codes.
33

Type 3: PORTFOLIO CARTOGRAPHY
within your brand
Product legitimacyBrand DNA
Brand stretch Product credibility

Applicability in Category Management and Marketing
§ To check if your portfolio has a clear, comprehensible structure resonating with the consumers’ inner logic (opportunity to derive learning for better navigation on shelf)
§ To identify your DNA, your core business, your star products, your brand pillars (independently of the sales figures)
§ When you ask yourself the question of the relevance and legitimacy of new products in your portfolio
§ If you have to skip some SKU’s (the shelf space might require it…)
“Portfolio Cartography”
35

Presentation of Experiment 3
What we did§ We conducted two consumer groups to sort
products belonging to the Stabilo portfolio§ Stabilo offers a huge range of diverse products
in several segments§ Free sorting and projective mapping of 74
Stabilo products with a group of 6 students§ Free sorting of 74 Stabilo products with 5
young pupils (9 yrs)
From this family cartography we learnedÜ about the perceived structure of the Stabilo rangeÜ about the relevance of distinctive product benefits
(and the way they are communicated)Ü about the brand DNA: how many Stabilo genes each
product contains
What we learned
And we also learned, that even children can do family cartography…!
36

Learning 1: Clarify What Your Genes Really Are
Sorting Stabilo pens by seemingly functional criteria also reveals brand-fit issues: Even if not asked for explicitly, students classified (and commented) the set of pens by the level of brand DNA inside.
Sorting a brand implies probing the DNA: Free Sorting a brand portfolio by your own chosen criteria automatically reveals the uniqueness of the brand and the level of brand-fit for each SKU.
core
37
typicalcompatible
“Fineliner” is designated as the only exclusive
unique brand-own segment
fineliner
highlighter
fineliner
finelinerhighlighter
pencil
felt tip
ballpoint
coloured pencils
separation of the “useful” (target-specific familiarity)
from the “useless”
separation of clearly coded (corporate design) pens from the ones without clear codes
…
6 clusters of products “on brand” sorted by obvious criteria: function/ material/ benefit…

„Stabilo represents fineliner –exists already for a long time”
“…the coloured pencils we position far far away from them…”
“Stabilo have those white bars, the light orange, which they always have”
Learning 2: Experience WhereYour Genes Can Take You
brand territory: typical look and benefitbrand territory: typical look and benefit
Felt tipsHighlighter
Coloured pencils
“Nonsense”
“Individual pens”
Less brand typical: (Competitive territory)
Fineliner
38
From projective exercises after the sorting session we experienced which kinds of products may be part of the portfolio to stretch the brand without tearing it.
familiar
typical untypicalCORE
NO BRAND AREA
STRETCH
The area of credibility proof: A typical brand
design is not enough (and just a disguise), when the
benefit is unfamiliar (a colour deleting pen)!
“Ergonomic/ Shaped”
unfamiliar
STRETCH“colorKilla”

Learning 3: Do the Acid Test – Who May Bear the Brand Name?
39
A brand is a collective good – and we all share a common understanding: Same results across different targets are not surprising but prove a clear brand profile. “Users” and “Non
Users” are similarly able to detect what fits the brand personality.
PUPILS
both targets miss the brand DNA of this product.The link to the core is cut.
„we are alone”
„funny pen/ a punk…”
both targets, students and pupils, point out the same products as core of the brand and benchmark.
„I’m so beautiful…”
Also a small child notices if a launch hits the core
or fails the target.Sorting is a way to enable
them to express this intuition.
STUDENTS

More Detail for the Researchers’ Passionate Heart!

Everybody Clusters What is Different About Séissmo?
§ FreeConsumers always choose their own criteria at least during the first rounds of sorting.
§ 2-DimensionalThe items are sorted: not linear (1-dimensional) but spatial, multi-dimensional.
§ Multiple We do it not just once but usually have several rounds of free sorting to reveal the deeper hidden or slowly emerging (trend) variables = the criteria is not immediately obvious.
§ DynamicAfter the sorting, a projective discussion of the territories is essential to understand the dynamics.Some items are wanderers, hence we don’t just look at the end result but the process.
§ TailoredDifferent research questions demand different types of techniques, therefore we have developed three kinds of market cartographies (see next page).Also each global market demands an unique approach: in China we will use different techniques to Germany or the US (e.g. do not cluster families in China as they are too small, nor political regimes…).
41

Procedure: A Two Step System
Visuals contributed by our sketch artist J.O.
All three types of cartographies are built in a two step system. However, the instruction and questions asked in each step
differ according to type.
§ Projective questioning§ Open questions§ Relevant criteria
used for segmentation§ Relationships between
product families
§ Projective questioning§ Open questions§ Relevant criteria
used for segmentation§ Relationships between
product families
§ Simple instruction§ No interference§ Interactive process§ Intuitive§ Spontaneous § Minimal verbal censorship§ Active
§ Simple instruction§ No interference§ Interactive process§ Intuitive§ Spontaneous § Minimal verbal censorship§ Active 42
Step 1: Free Sorting Step 2: Projective Mapping

è INTUITIONrevealing various segmentation
criteria
What We Discover in Each Step
Step 1: Free Sorting Step 2: Projective Mapping
The moderator steps back after giving the instructions.
Several processes happen (sometimes simultaneously):
§ Discover: consumers familiarize themselves with the set of products (look, touch, read, awake memories,…)
§ Discuss: the group starts deliberating which products may belong together and in this define their sorting system
§ Differentiate: consumers build homogenous groups of products that can be differentiated from one another
Moderator steps in again when categories are complete
for deeper questioning and projective techniques
§ Borders: circling and naming each product cluster and in this ask what separates one group from another à semiotics
§ Domestic Affairs: projective techniques like “visiting the planet of…” or “who is the speaker” reveal the system’s actors
§ Tectonic Dynamics: with the metaphor of plate tectonics discuss market movements and potential trends
è IMMERSIONemotional and rational
appropriation43
Why One Round is not Enough
Free sorting can be repeated 2-5 times § Because during the first rounds only the obvious, rational (what is “logic”)
salient segmentation criteria emerge.§ Obvious (best visible, most discriminating and relevant criteria like colour,
brand, material etc.) enable the consumers to act efficiently and fulfil the required task.
The first round – also important as a warm up§ Consumers need time to discover all products (which enables them to
act easier and faster in the following rounds)à Nevertheless: Also in s first round we learn a lot about what is “obvious”
More to come – more to emerge! When the rational part is done……in additional rounds consumers start getting creative, dig deeper and diversify their ways of mappingÆ the deeper hidden or slowly emerging (trend) variables are revealed.Æ the criteria not obvious for everybody but with a growing potential to
subconsciously influence our purchase become relevant.
Example biscuits: It was striking, that in the first rounds consumers sorted the biscuits by their “composition” and NOT by brands –
which would have been an obvious criteria as well !
44

What We Keep in Mind During the Analysis:
(How) does the shelf organization correspond
with consumers’ perspective:
Shopper reality?
Market mechanisms
rules & principles:Is a market e.g. rather driven by brands or need
states?Triggers
Principles and logic of sorting: Sequential cell division or many
clusters from the start?Do the criteria emerge by sorting firstmental clarity and orientation
Multi-match or mismatch?When products move across and between clusters: Are they rather homeless without benefits or somehow at home everywhere
thanks to multiple competing qualitiesLevel of innovative potential
Wasted time or pastime?
Is it rather pleasant or strenuous to spend time with
a distinctive cluster?Level of cognitive and
emotional involvement
45

Stimulus Material: If Possible Use Real Products!
The more realistic the betterIn general real products are preferred, since they convey the complete impression: the whole visual and haptic sensation - life sized also in relation to each other.Sometimes the alternative to use pictures is the more pragmatic or useful way… when not all required products are
available… when the products are too big (to handle,
i.e. keep from free sorting): like cars…… when they are too precious or hard to
get… when not all products really exist!… to give smuggled in innovations the
same chance(and otherwise consumers could easily identify 3D-dummies or mock-ups)
When we use images consumers sort cards, not just products
Consumers want to touch the
products, not only see:There is a good reason, why the German word
“be-greifen” (touch) means to
understand!
46

Careful with 2D Material„Playing Cards“
„Playing Cards“ influences the process and affects the result: Æ The weighting of criteria may change, if all stimulus is 2-D and the
same size: In our biscuit study we could observe, that colours of the images become more important. Sorting by brands (which are blue, yellow, lilac…) happened at an earlier stage. Thus it gives too much weight to some criteria which might not be so relevant in front of the shelf.
Æ During the moderation we have to take care, that items do not get out of perception: Pictures tend to get covered easily, get invisible and vanish from sight and memory. Only the top of a cluster (staple) stays visible, the feeling for size of clusters is lost by flat staples… Thus the described content depends a lot on the “top of the pile” and partly ruins the holistic view of the category.
Better images than no cluster!If images, better a small number of images
which stay visible on the table all time!
Irregular Regular
Floating Linear
Chaotic Orderly
Vertical Horizontal
Clusters Staples47

Ø STOP SPLITTING YOUR TARGET GROUPS INTO A HUNDRED PIECES
Ø TRUST THE TRANSVERSAL INTUITION OF THE MARKET
Ø HAVE A MORE HOLISTIC VIEW OF YOUR “POTENTIAL CUSTOMERS”
Ø USERS/ NON USERS (or other marketing) DEFINITIONS ARE EPHEMERAL, CARTOGRAPHY IS STABLE AND DELIVERS CONSTANT AND VALID RESULTS (with sometimes only 2 short groups)
Ø STOP ASKING 100 QUESTIONS (per hour)
Ø USE THE NON-VERBAL ELEMENTS (physical product movements, attraction and rejection…)
Ø JUST LET PEOPLE “do”
Ø THEY’LL TALK (ANYWAY) ABOUT THE RELEVANT ASPECTS TO THEM
Consumers (and clients!) find it easy and playful. Just a nice effect?
Some Provocative Thoughts in the End
48

Thank You to all “Cartographers” and Analysts at Séissmo
49
NatachaDAGNEAUD
Jagoda ZEIS
FrancescaDANDOLO
Elena DIETZ
Theoretical framing
Empirical research
We welcome your input, questions, feedback, thoughts and experiences,so please get in touch … [email protected]
Many thanks also to: Lisa GrötickeJan WagnerMartin TrebeljahrMichelle Janzfor a helping hand: desk research, translation, correction, editing…
… and a very warm THANK YOU to: Jürgen Meyer International MarketingHead of Digital & Market Research STABILO International GmbHfor offering a set of pens and brainstorming with us during the methodological proof phase.
The Séissmograph was realized between August and December 2013
Rolf DOBLER
ChristianeTREBELJAHR
13.12.2013