sirkari bhyol-rupsiabagar h.e. project …...sirkari bhyol-rupsiabagar h.e. project (4x42mw) -...
TRANSCRIPT

SIRKARI BHYOL-RUPSIABAGAR H.E. PROJECT (4x42MW)
- SALIENT FEATURES - POWER POTENTIAL STUDY - LAYOUT OPTIMIZATION REPORT

SIRKARI BHYOL-RUPSIABAGAR HE PROJECT
(4X42MW)
SALIENT FEATURES
For: UJVN Ltd

LAYOUT OPTIMISATION REPORT [SIRKARI BHYOL HYDRO-ELECTRIC PROJECT (4 x 42.0 MW)] UJVN LIMITED (A Govt. of India Enterprise)
Page iii
SIRKARI BHYOL-RUPSIABAGAR H.E. PROJECT (168 MW) DISTRICT PITHORAGARH, UTTARAKHAND
SALIENT FEATURES
LOCATION
State Uttarakhand
District Pithoragarh
River Goriganga
Diversion Site U/s of confluence of Ralam Gad with Goriganga river, 470m D/s of confluence of Jaulchidda Gad
with Goriganga river
Nearest Airport Jolly-Grant (Dehradun)
Nearest Rail Head Tanakpur
Geographical Coordinates of Barrage site
(a) Longitude 80° 14’ 05”E
(b) Latitude 30° 11’ 1.5” N
HYDROLOGY
River Basin Goriganga
Catchment area at Barrage Site 957 sq.km
Average Discharge at Barrage site 111.61 cumec
Annual Runoff 1180.30 MCM
Standard Project Flood 2,742 cumecs
Probable Maximum Flood 3,652 cumecs
RESERVOIR
Maximum water level (MWL) 2084.90 m
Full reservoir level (FRL) 2084.0 m
Minimum draw down level (MDDL) 2082.0 m
Gross storage at FRL 0.14 MCM

LAYOUT OPTIMISATION REPORT [SIRKARI BHYOL HYDRO-ELECTRIC PROJECT (4 x 42.0 MW)] UJVN LIMITED (A Govt. of India Enterprise)
Page iv
Live storage 0.05 MCM
Area under Submergence at FRL 0.03 ha
COFFER DAM
Type Boulder with wire crate(Stage-1) Boulder with wire crate (Stage-2)
Max. Height (Stage-1) 7.00 m high
Crest Elevation (Stage-1) Varies
Length (Stage-1) 254.50 m
Max. Height (Stage-2) 4.50m high
Crest Elevation (Stage-2) Varies
Length (Stage-2) 201 m ( plus, in the barrage portion 61m length of divide wall which already will have been
constructed in Stage-1)
DIVERSION STRUCTURE
Type Barrage
Barrage Top 2087.00 m
Height of Barrage 12.00 m
River Bed Level 2075.00 m
Total length of Barrage at top 118.30 m
MAIN SPILLWAY
Design flood 2,742 cumecs (SPF)
Type Gated Spillway
Length of spillway 56.00 m
Number of bays 4 Nos. Main bays
Crest level of Barrage 2075.0 m
Size of spillway radial gates 14.0 m (W) x 9.0 m (H)
AUXILLIARY SPILLWAY
LAYOUT OPTIMISATION REPORT [SIRKARI BHYOL HYDRO-ELECTRIC PROJECT (4 x 42.0 MW)] UJVN LIMITED (A Govt. of India Enterprise)
Page v
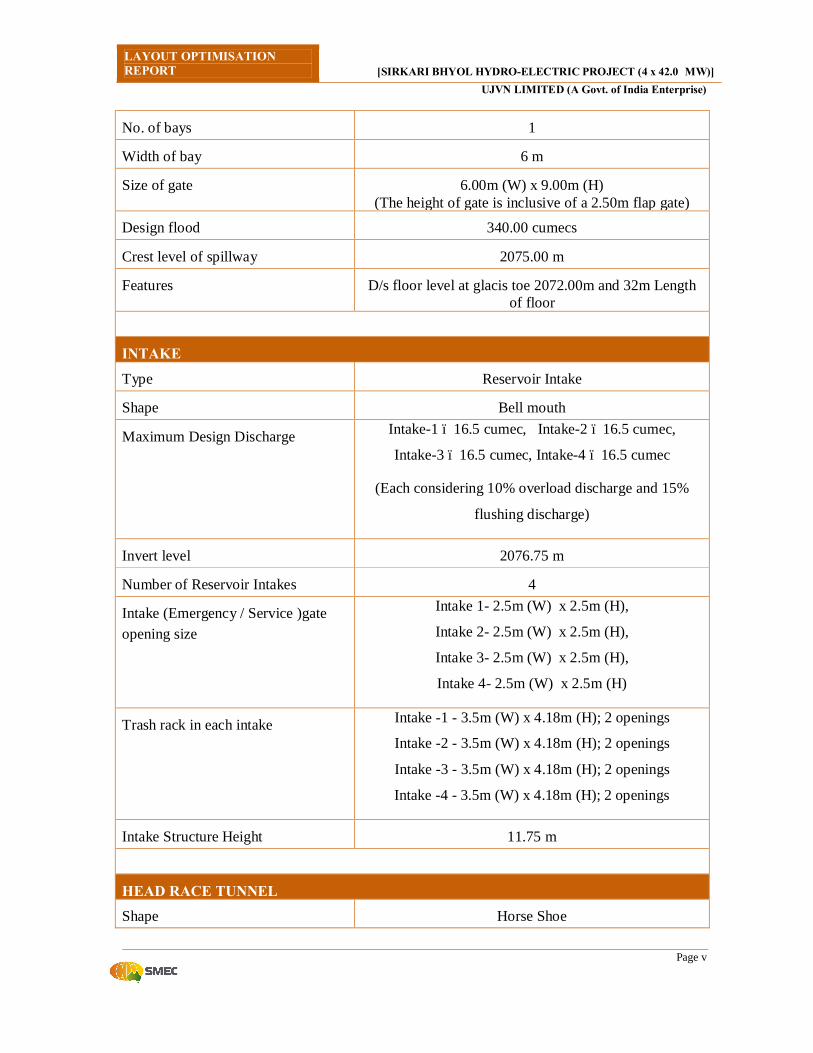
No. of bays 1
Width of bay 6 m
Size of gate 6.00m (W) x 9.00m (H) (The height of gate is inclusive of a 2.50m flap gate)
Design flood 340.00 cumecs
Crest level of spillway 2075.00 m
Features D/s floor level at glacis toe 2072.00m and 32m Length of floor
INTAKE
Type Reservoir Intake
Shape Bell mouth
Maximum Design Discharge Intake-1 – 16.5 cumec, Intake-2 – 16.5 cumec,
Intake-3 – 16.5 cumec, Intake-4 – 16.5 cumec
(Each considering 10% overload discharge and 15%
flushing discharge)
Invert level 2076.75 m
Number of Reservoir Intakes 4
Intake (Emergency / Service )gate opening size
Intake 1- 2.5m (W) x 2.5m (H),
Intake 2- 2.5m (W) x 2.5m (H),
Intake 3- 2.5m (W) x 2.5m (H),
Intake 4- 2.5m (W) x 2.5m (H)
Trash rack in each intake
Intake -1 - 3.5m (W) x 4.18m (H); 2 openings
Intake -2 - 3.5m (W) x 4.18m (H); 2 openings
Intake -3 - 3.5m (W) x 4.18m (H); 2 openings
Intake -4 - 3.5m (W) x 4.18m (H); 2 openings
Intake Structure Height 11.75 m
HEAD RACE TUNNEL
Shape Horse Shoe
LAYOUT OPTIMISATION REPORT [SIRKARI BHYOL HYDRO-ELECTRIC PROJECT (4 x 42.0 MW)] UJVN LIMITED (A Govt. of India Enterprise)
Page vi
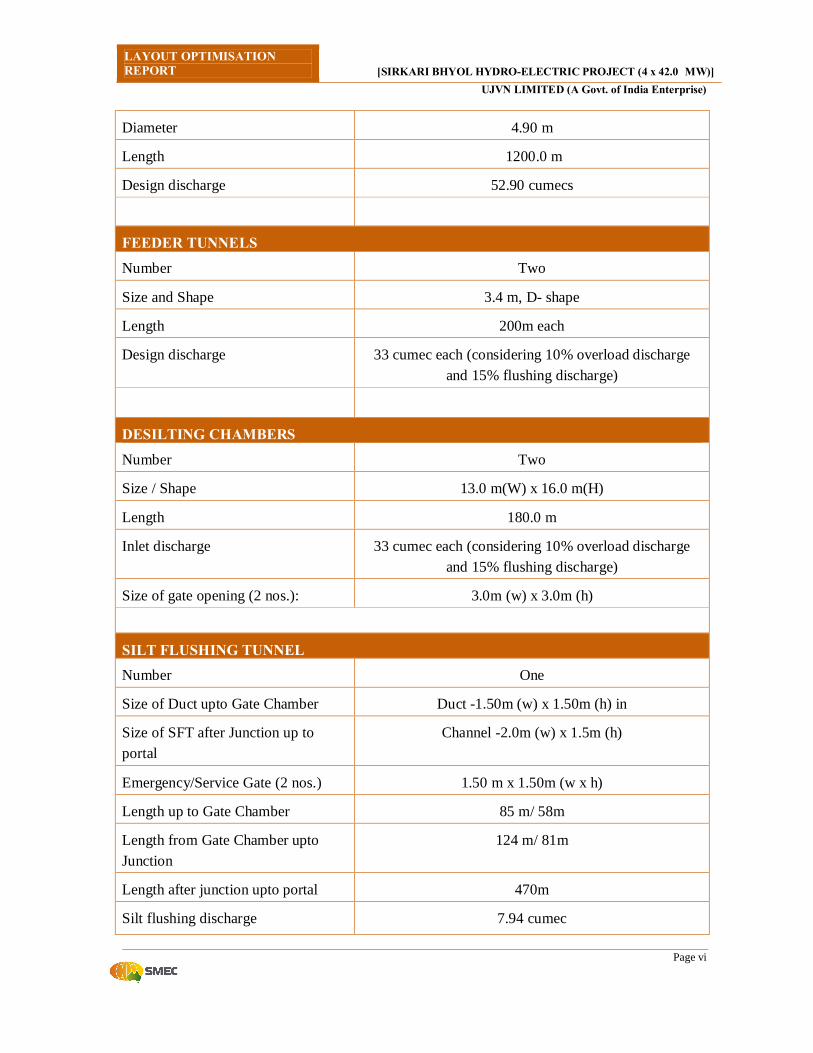
Diameter 4.90 m
Length 1200.0 m
Design discharge 52.90 cumecs
FEEDER TUNNELS
Number Two
Size and Shape 3.4 m, D- shape
Length 200m each
Design discharge 33 cumec each (considering 10% overload discharge and 15% flushing discharge)
DESILTING CHAMBERS
Number Two
Size / Shape 13.0 m(W) x 16.0 m(H)
Length 180.0 m
Inlet discharge 33 cumec each (considering 10% overload discharge and 15% flushing discharge)
Size of gate opening (2 nos.): 3.0m (w) x 3.0m (h)
SILT FLUSHING TUNNEL Number One
Size of Duct upto Gate Chamber Duct -1.50m (w) x 1.50m (h) in
Size of SFT after Junction up to portal
Channel -2.0m (w) x 1.5m (h)
Emergency/Service Gate (2 nos.) 1.50 m x 1.50m (w x h)
Length up to Gate Chamber 85 m/ 58m
Length from Gate Chamber upto Junction
124 m/ 81m
Length after junction upto portal 470m
Silt flushing discharge 7.94 cumec

LAYOUT OPTIMISATION REPORT [SIRKARI BHYOL HYDRO-ELECTRIC PROJECT (4 x 42.0 MW)] UJVN LIMITED (A Govt. of India Enterprise)
Page vii
CONNECTING/LINK TUNNEL TO HRT
Number Two
Size 3.0m Dia.
Shape D-shape
Length 93m each
Design discharge 26.45 cumec each
SURGE SHAFT
Number One
Type Restricted Orifice Underground surge shaft
Size 10m Dia.
Orifice dia 2.80 m diameter
Height 34.50 m
Top EL EL 2100.5 m
Bottom EL EL 2066.0 m
Size of gate opening (1 no.) 3.6m x 3.6m
Maximum surge level EL 2097.98 m
Minimum surge level EL 2070.58 m
PENSTOCK/PRESSURE SHAFT
Type Underground
Number 3.6 m dia. bifurcating into two 2.50 m dia. branch penstocks each of which further bifurcates into two
branch penstocks of 1.75 m Dia. each
Diameter 3.6m, 2.50 m and 1.75m
Length up to Bifurcation of main pressure shaft
570m
Grade of Steel ASTM-537 Class II/ASTM 517 Gr.A
Liner Thickness Varies from 20mm to 34 mm
LAYOUT OPTIMISATION REPORT [SIRKARI BHYOL HYDRO-ELECTRIC PROJECT (4 x 42.0 MW)] UJVN LIMITED (A Govt. of India Enterprise)
Page viii
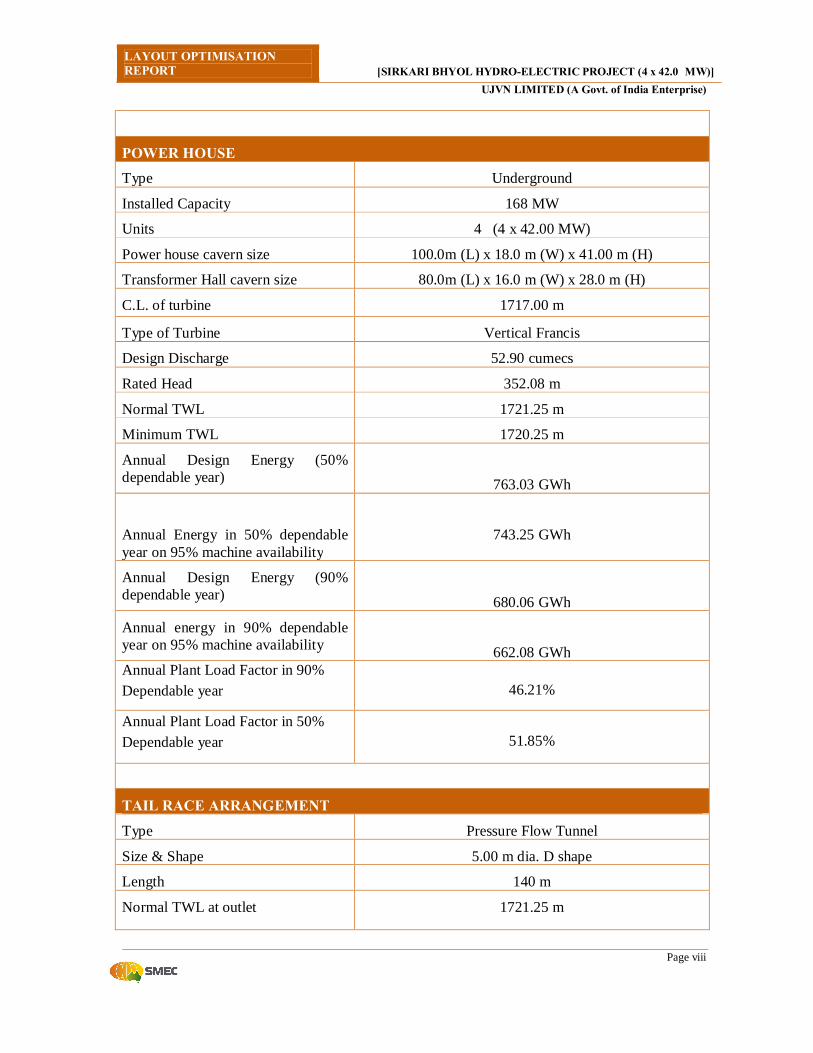
POWER HOUSE Type Underground
Installed Capacity 168 MW
Units 4 (4 x 42.00 MW)
Power house cavern size 100.0m (L) x 18.0 m (W) x 41.00 m (H)
Transformer Hall cavern size 80.0m (L) x 16.0 m (W) x 28.0 m (H)
C.L. of turbine 1717.00 m
Type of Turbine Vertical Francis
Design Discharge 52.90 cumecs
Rated Head 352.08 m
Normal TWL 1721.25 m
Minimum TWL 1720.25 m
Annual Design Energy (50% dependable year)
763.03 GWh
Annual Energy in 50% dependable year on 95% machine availability
743.25 GWh
Annual Design Energy (90% dependable year)
680.06 GWh
Annual energy in 90% dependable year on 95% machine availability
662.08 GWh Annual Plant Load Factor in 90% Dependable year 46.21%
Annual Plant Load Factor in 50% Dependable year 51.85%
TAIL RACE ARRANGEMENT
Type Pressure Flow Tunnel
Size & Shape 5.00 m dia. D shape
Length 140 m
Normal TWL at outlet 1721.25 m
LAYOUT OPTIMISATION REPORT [SIRKARI BHYOL HYDRO-ELECTRIC PROJECT (4 x 42.0 MW)] UJVN LIMITED (A Govt. of India Enterprise)
Page ix
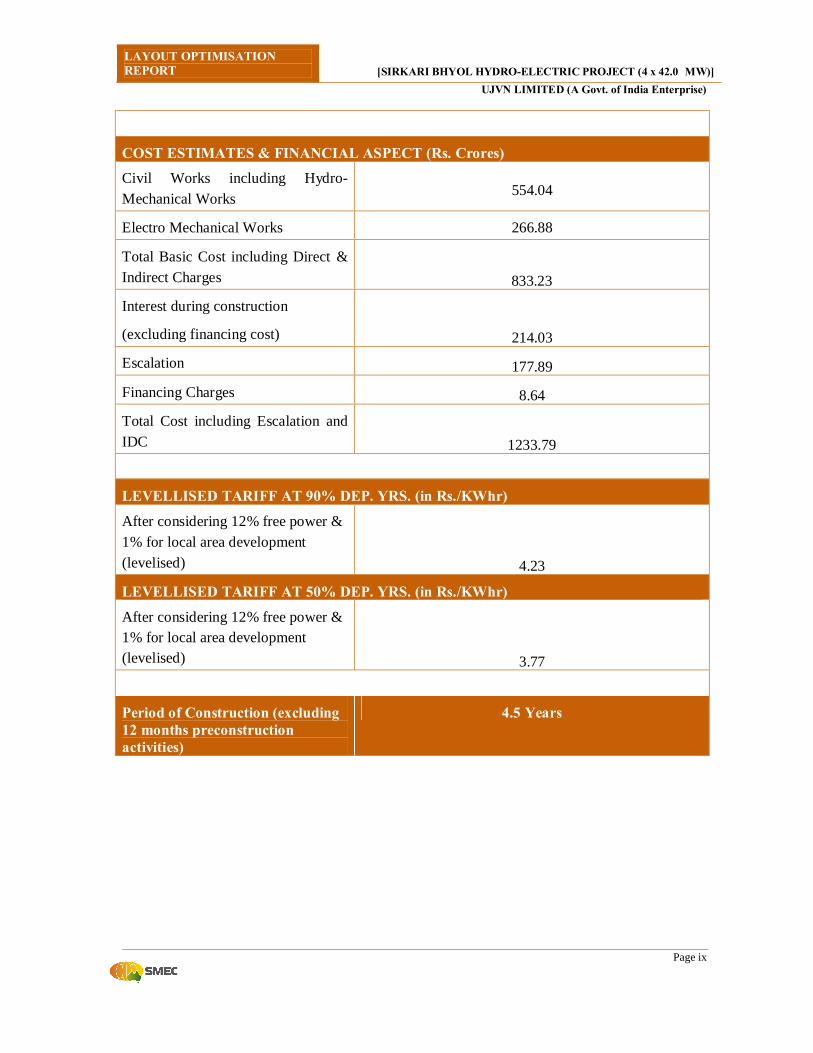
COST ESTIMATES & FINANCIAL ASPECT (Rs. Crores) Civil Works including Hydro-Mechanical Works 554.04
Electro Mechanical Works 266.88
Total Basic Cost including Direct & Indirect Charges 833.23
Interest during construction
(excluding financing cost) 214.03
Escalation 177.89
Financing Charges 8.64
Total Cost including Escalation and IDC 1233.79
LEVELLISED TARIFF AT 90% DEP. YRS. (in Rs./KWhr)
After considering 12% free power & 1% for local area development (levelised) 4.23
LEVELLISED TARIFF AT 50% DEP. YRS. (in Rs./KWhr)
After considering 12% free power & 1% for local area development (levelised) 3.77
Period of Construction (excluding 12 months preconstruction activities)
4.5 Years
SIRKARI BHYOL-RUPSIABAGAR HE PROJECT
(4X42MW)
POWER POTENTIAL STUDIES
For: UJVN Ltd

i
TABLE OF CONTENTS 7. POWER POTENTIAL AND ENERGY AVAILABILITY STUDIES ....................................... 7-1 7.1. INTRODUCTION ............................................................................................................... 7-1
7.2. SCHEME LAYOUT ............................................................................................................ 7-3 7.3. PROPOSED OPERATION SCHEDULE ............................................................................. 7-4
7.4. TEN DAILY HYDROLOGICAL INFLOW SERIES ............................................................... 7-4
7.5. NET 10–DAILY FLOWS AVAILABLE FOR POWER GENERATION ................................... 7-4 7.6. COMPUTATION OF UNRESTRICTED ENERGY GENERATION ....................................... 7-4
7.7. DETERMINATION OF 90% AND 50% DEPENDABLE YEARS .......................................... 7-4
7.8. EFFICIENCY OF TURBINE AND GENERATOR ................................................................ 7-5 7.9. HEAD FOR POWER GENERATION .................................................................................. 7-5
7.10. POWER POTENTIAL (MW) ............................................................................................... 7-6 7.11. ENERGY GENERATION (GWH) ........................................................................................ 7-7
7.12. FIXING INSTALLED CAPACITY ........................................................................................ 7-7
7.13. DISCUSSION .................................................................................................................... 7-8 7.14. UNIT SIZE ......................................................................................................................... 7-9
7.15. PEAKING ENERGY ........................................................................................................... 7-9
7.16. FIRM POWER ................................................................................................................... 7-9 7.17. SUMMARY ........................................................................................................................ 7-9
ii
ANNEXURES ANNEX -7.1 10-DAILY DISCHARGE DATA AT SIRKARI BHIYOL BARRAGE SITE (JUNE 1977-
MAY 2009)
ANNEX -7.2 COMPUTATION OF UNRESTRICTED FLOW AVAILABLE FOR POWER GENERATION IN 90% DEPENDABLE YEAR (1987-88)
ANNEX -7.3 COMPUTATION OF UNRESTRICTED FLOW AVAILABLE FOR POWER GENERATION IN 50% DEPENDABLE YEAR (1985-86)
ANNEX -7.4 UNRESTRICTED ENERGY (GWH) AT SIRKARI BHIYOL BARRAGE SITE 1977-78 TO 2008-09
ANNEX -7.5 COMPUTATION FOR 90% & 50% DEPENDABLE YEARS
ANNEX -7.6 POWER POTENTIAL WITH DIFFERENT INSTALLED CAPACITY WITH 90% DEPENDABLE YEAR (1987-88) FOR DISCHARGE DATA JUNE 1977 TO MAY 2009 AT THANA PLAUN DAM SITE
ANNEX -7.7 POWER POTENTIAL WITH DIFFERENT INSTALLED CAPACITY WITH 50% DEPENDABLE YEAR (1985-86)FOR DISCHARGE DATA JUNE 1977 TO MAY 2009 AT THANA PLAUN DAM SITE
ANNEX -7.8 COMPUTATION OF PEAKING HOURS IN 90% DEPENDABLE YEAR
ANNEX -7.9 INCREMENTAL ENERGY BENEFITS IN A 90% DEPENDABLE YEAR
ANNEX -7.10 HEADLOSS CALCULATIONS
FIG -7.1 INCREMENTAL ENERGY VS INSTALLED CAPACITY WITH 95% MACHINE AVAILABILITY DATA : (JUNE1977-MAY2009), 90% DEP. YEAR 1987-88 , 50% DEP. YEAR 1985-86
FIG -7.2 % POTENTIAL UTILISED VS INSTALLED CAPACITY DATA : (JUNE1977-MAY2009), 90% DEP. YEAR 1987-88 , 50% DEP. YEAR 1985-86
FIG -7.3 PLANT LOAD FACTOR VS INSTALLED CAPACITY DATA : (JUNE1977-MAY2009), 90% DEP. YEAR 1987-88 , 50% DEP. YEAR 1985-86
FIG -7.4 ANNUAL ENERGY VS INSTALLED CAPACITY DATA : (JUNE1977-MAY2009), 90% DEP. YEAR 1987-88 , 50% DEP. YEAR 1985-86
ATTACHMENTS ATTACH A: EXPERT APPRAISAL COMMITTEE, MOEF APPROVAL OF TOR
ATTACH B: PROJECT LAYOUT PLAN
POWER POTENTIAL AND ENERGY AVAILABILITY STUDIES
SIRKARI BHYOL HYDRO-ELECTRIC PROJECT (4 x 42.0 MW)
UJVN LIMITED (A Govt. of India Enterprise)
7-1
7. POWER POTENTIAL AND ENERGY AVAILABILITY STUDIES
7.1. INTRODUCTION
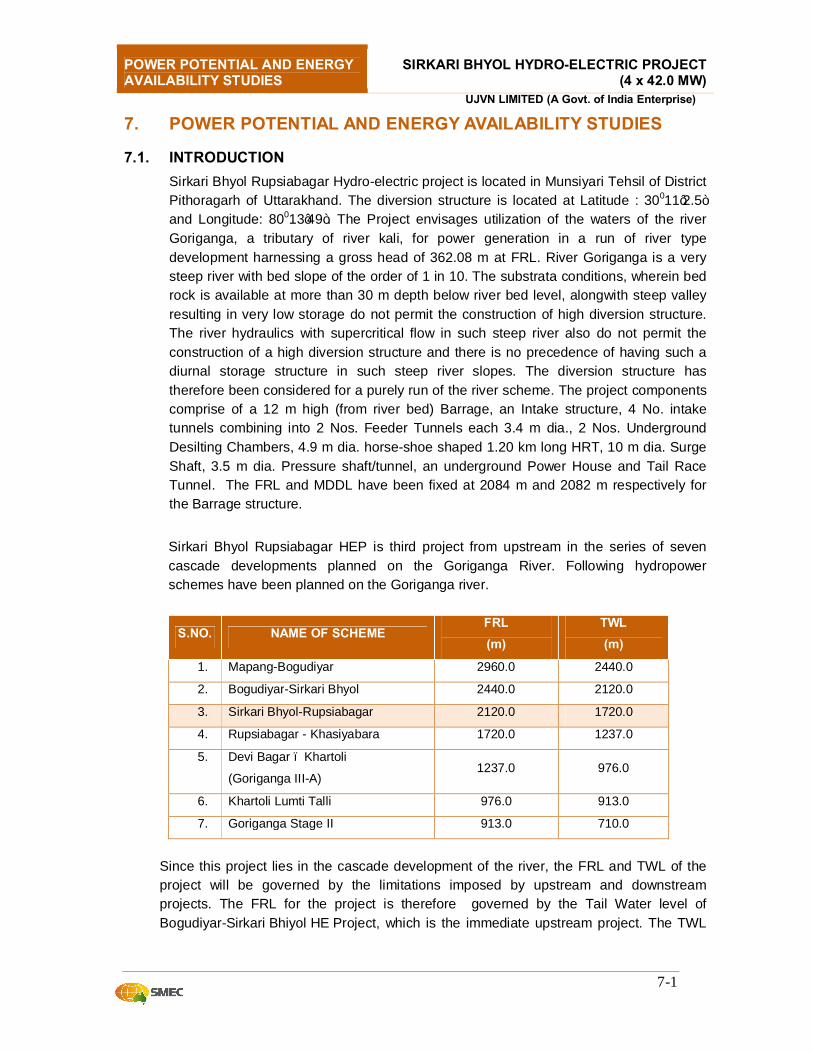
Sirkari Bhyol Rupsiabagar Hydro-electric project is located in Munsiyari Tehsil of District Pithoragarh of Uttarakhand. The diversion structure is located at Latitude : 30011’2.5” and Longitude: 80013’49”. The Project envisages utilization of the waters of the river Goriganga, a tributary of river kali, for power generation in a run of river type development harnessing a gross head of 362.08 m at FRL. River Goriganga is a very steep river with bed slope of the order of 1 in 10. The substrata conditions, wherein bed rock is available at more than 30 m depth below river bed level, alongwith steep valley resulting in very low storage do not permit the construction of high diversion structure. The river hydraulics with supercritical flow in such steep river also do not permit the construction of a high diversion structure and there is no precedence of having such a diurnal storage structure in such steep river slopes. The diversion structure has therefore been considered for a purely run of the river scheme. The project components comprise of a 12 m high (from river bed) Barrage, an Intake structure, 4 No. intake tunnels combining into 2 Nos. Feeder Tunnels each 3.4 m dia., 2 Nos. Underground Desilting Chambers, 4.9 m dia. horse-shoe shaped 1.20 km long HRT, 10 m dia. Surge Shaft, 3.5 m dia. Pressure shaft/tunnel, an underground Power House and Tail Race Tunnel. The FRL and MDDL have been fixed at 2084 m and 2082 m respectively for the Barrage structure.
Sirkari Bhyol Rupsiabagar HEP is third project from upstream in the series of seven cascade developments planned on the Goriganga River. Following hydropower schemes have been planned on the Goriganga river.
S.NO. NAME OF SCHEME FRL
(m)
TWL
(m)
1. Mapang-Bogudiyar 2960.0 2440.0
2. Bogudiyar-Sirkari Bhyol 2440.0 2120.0
3. Sirkari Bhyol-Rupsiabagar 2120.0 1720.0
4. Rupsiabagar - Khasiyabara 1720.0 1237.0
5. Devi Bagar – Khartoli
(Goriganga III-A) 1237.0 976.0
6. Khartoli Lumti Talli 976.0 913.0
7. Goriganga Stage II 913.0 710.0
Since this project lies in the cascade development of the river, the FRL and TWL of the project will be governed by the limitations imposed by upstream and downstream projects. The FRL for the project is therefore governed by the Tail Water level of Bogudiyar-Sirkari Bhiyol HE Project, which is the immediate upstream project. The TWL
POWER POTENTIAL AND ENERGY AVAILABILITY STUDIES
SIRKARI BHYOL HYDRO-ELECTRIC PROJECT (4 x 42.0 MW)
UJVN LIMITED (A Govt. of India Enterprise)
7-2
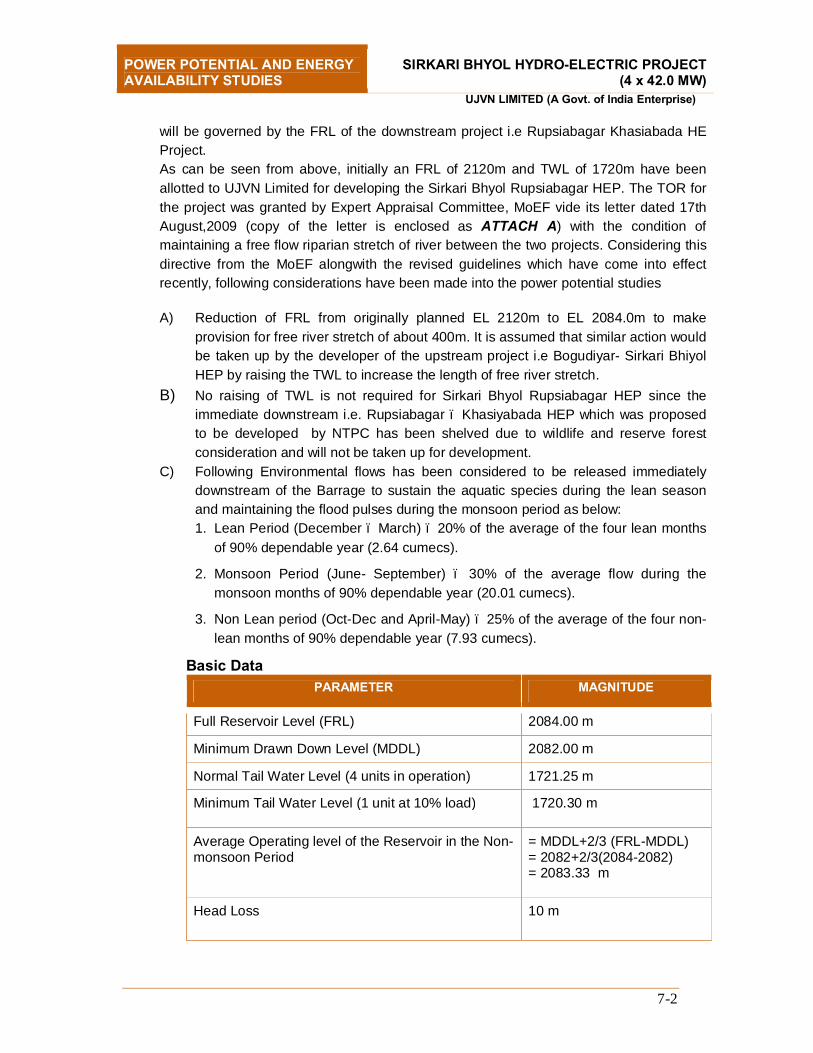
will be governed by the FRL of the downstream project i.e Rupsiabagar Khasiabada HE Project. As can be seen from above, initially an FRL of 2120m and TWL of 1720m have been allotted to UJVN Limited for developing the Sirkari Bhyol Rupsiabagar HEP. The TOR for the project was granted by Expert Appraisal Committee, MoEF vide its letter dated 17th August,2009 (copy of the letter is enclosed as ATTACH A) with the condition of maintaining a free flow riparian stretch of river between the two projects. Considering this directive from the MoEF alongwith the revised guidelines which have come into effect recently, following considerations have been made into the power potential studies
A) Reduction of FRL from originally planned EL 2120m to EL 2084.0m to make
provision for free river stretch of about 400m. It is assumed that similar action would be taken up by the developer of the upstream project i.e Bogudiyar- Sirkari Bhiyol HEP by raising the TWL to increase the length of free river stretch.
B) No raising of TWL is not required for Sirkari Bhyol Rupsiabagar HEP since the immediate downstream i.e. Rupsiabagar – Khasiyabada HEP which was proposed to be developed by NTPC has been shelved due to wildlife and reserve forest consideration and will not be taken up for development.
C) Following Environmental flows has been considered to be released immediately downstream of the Barrage to sustain the aquatic species during the lean season and maintaining the flood pulses during the monsoon period as below: 1. Lean Period (December – March) – 20% of the average of the four lean months
of 90% dependable year (2.64 cumecs).
2. Monsoon Period (June- September) – 30% of the average flow during the monsoon months of 90% dependable year (20.01 cumecs).
3. Non Lean period (Oct-Dec and April-May) – 25% of the average of the four non-lean months of 90% dependable year (7.93 cumecs).
Basic Data PARAMETER MAGNITUDE
Full Reservoir Level (FRL) 2084.00 m
Minimum Drawn Down Level (MDDL) 2082.00 m
Normal Tail Water Level (4 units in operation) 1721.25 m
Minimum Tail Water Level (1 unit at 10% load) 1720.30 m
Average Operating level of the Reservoir in the Non-monsoon Period
= MDDL+2/3 (FRL-MDDL) = 2082+2/3(2084-2082) = 2083.33 m
Head Loss 10 m
POWER POTENTIAL AND ENERGY AVAILABILITY STUDIES
SIRKARI BHYOL HYDRO-ELECTRIC PROJECT (4 x 42.0 MW)
UJVN LIMITED (A Govt. of India Enterprise)
7-3
In this study, 10-daily hydrological inflow series in cumec at the Sirkari Bhiyol Barrage site has been adopted as per the hydrological studies carried out based on 32 years long term data. The flow series adopted is presented in Annexure – 7.1 and the same has been used in the power and energy availability studies.
The flushing discharge (7.92 cumecs) has been considered as 15% of the design discharge (52.9 cumecs) during the monsoon months of June-Sept for the silt flushing through desilting basin arrangement. The net 10-daily flows for power generation have been computed after deducting flushing discharge and environmental releases from the natural river flows at the barrage site and the same are given in Annexure 7.2 for 90% Dependable year and Annexure 7.3 for 50% Dependable year respectively.
The power optimization studies have been carried out to arrive at the most effective and economical plant size consistent with the energy generation benefits has been presented in this chapter.
7.2. SCHEME LAYOUT
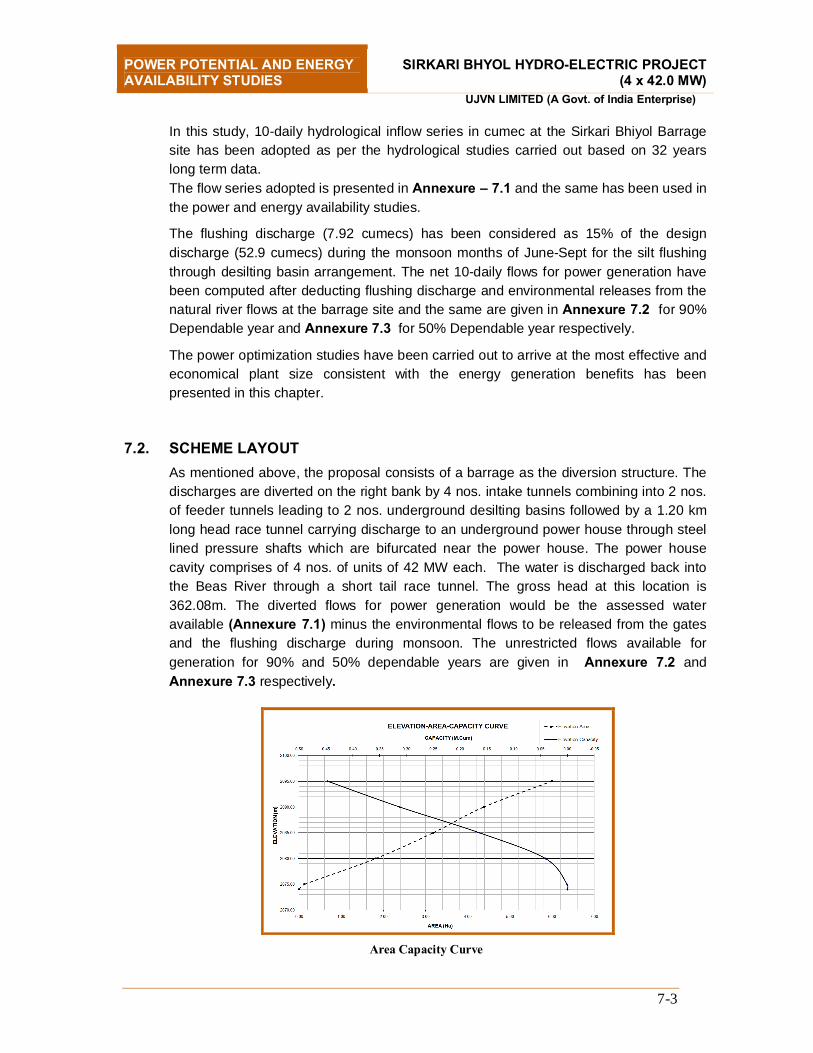
As mentioned above, the proposal consists of a barrage as the diversion structure. The discharges are diverted on the right bank by 4 nos. intake tunnels combining into 2 nos. of feeder tunnels leading to 2 nos. underground desilting basins followed by a 1.20 km long head race tunnel carrying discharge to an underground power house through steel lined pressure shafts which are bifurcated near the power house. The power house cavity comprises of 4 nos. of units of 42 MW each. The water is discharged back into the Beas River through a short tail race tunnel. The gross head at this location is 362.08m. The diverted flows for power generation would be the assessed water available (Annexure 7.1) minus the environmental flows to be released from the gates and the flushing discharge during monsoon. The unrestricted flows available for generation for 90% and 50% dependable years are given in Annexure 7.2 and Annexure 7.3 respectively.
Area Capacity Curve
POWER POTENTIAL AND ENERGY AVAILABILITY STUDIES
SIRKARI BHYOL HYDRO-ELECTRIC PROJECT (4 x 42.0 MW)
UJVN LIMITED (A Govt. of India Enterprise)
7-4
7.3. PROPOSED OPERATION SCHEDULE
Sirkari Bhyol-Rupsiabagar plant is proposed to be operated purely as a run of the river plant as there is practically no live storage due to very steep and narrow valley (0.05 MCM). Incoming discharges as coming into the reservoir will be fed into the water conductor system to run the power plant which will be operated for the whole day (24 hours). Since the live storage is very small, operating levels will fluctuate between FRL and MDDL during the period when the flows are less than the design discharge. However, during the period of surplus flows, the plant would operate at FRL.
7.4. TEN DAILY HYDROLOGICAL INFLOW SERIES
As mentioned above, 10-daily hydrological inflow series at the Sirkari Bhiyol Barrge site from 1977-78 to 2008-09 has been considered as per Annexure – 7.1.
7.5. NET 10–DAILY FLOWS AVAILABLE FOR POWER GENERATION
The net 10 daily flows for power generation have been derived by deducting the mandatory environmental flows as per guidelines of MoEF to release from the barrage as well as the flushing discharge of 15% during the monsoon period for the silt flushing arrangement.
7.6. COMPUTATION OF UNRESTRICTED ENERGY GENERATION
The computations of year wise unrestricted energy generation for all the years of data available are presented in Annexure 7.4.
7.7. DETERMINATION OF 90% AND 50% DEPENDABLE YEARS
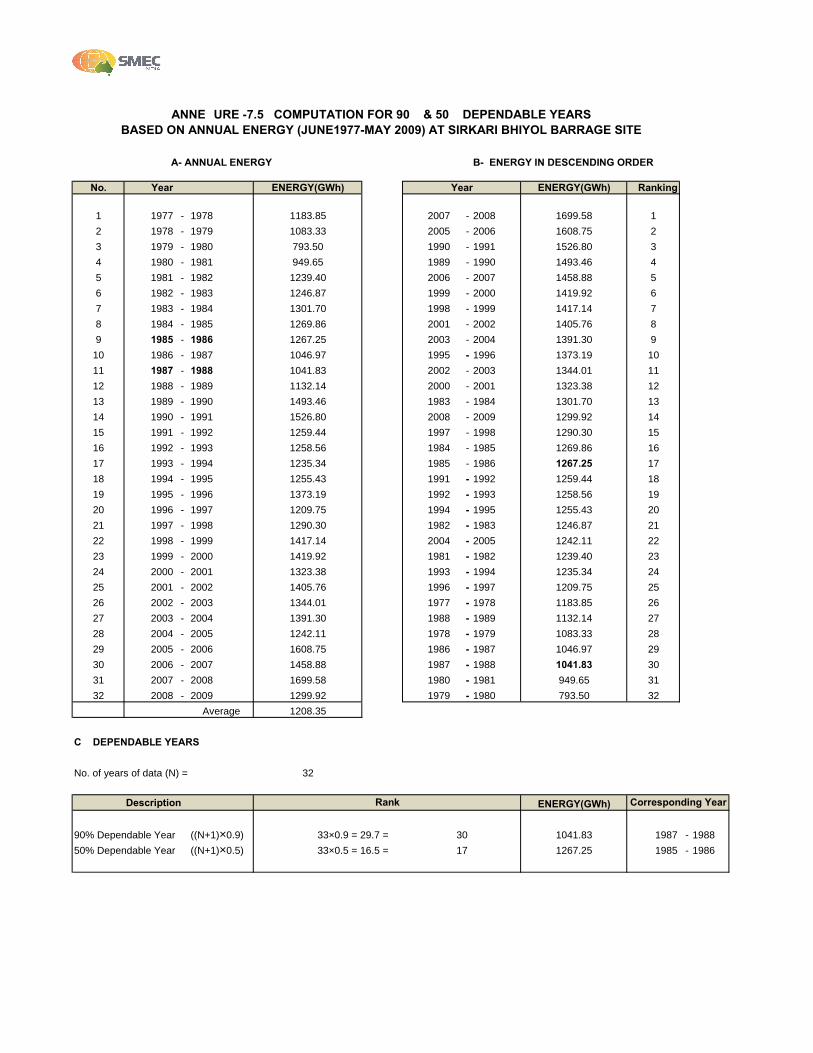
The year wise unrestricted energy generation for 32 years has been arranged in reverse chronological order in Annexure 7.5.
The dependable year is calculated from the following formula:
Y p = (n + 1) x P
Where
Yp = Dependable year with probability P
n = Number of years considered in the computation = 32 years
P = Probability of the flow being exceeded
Y90%= (32 + 1) x 0.9, Say 30th year
Y50% = (32 + 1) x 0.5, 17th year
As per table of unrestricted energy in reverse chronological order, the 90% and 50% dependable years are 1987-88 and 1985-86 respectively.
POWER POTENTIAL AND ENERGY AVAILABILITY STUDIES
SIRKARI BHYOL HYDRO-ELECTRIC PROJECT (4 x 42.0 MW)
UJVN LIMITED (A Govt. of India Enterprise)
7-5
7.8. EFFICIENCY OF TURBINE AND GENERATOR
Considering the head available for power generation, Francis turbine appears to be the suitable choice for the Project. The following efficiencies have been considered for the turbine and generator.
Efficiency of Francis Turbine = 93.5 %
Efficiency of Generator = 98.5 %
Combined efficiency (0.935×0.985) = 0.9209, say= 92.0 %
7.9. HEAD FOR POWER GENERATION
(i) Gross Head
During the monsoon months Sirkari Bhyol Power Station will run mostly on continuous basis and during the non monsoon months, the power station will run on partial capacity. The operating level in the reservoir has been considered as the average level of the reservoir throughout the year.
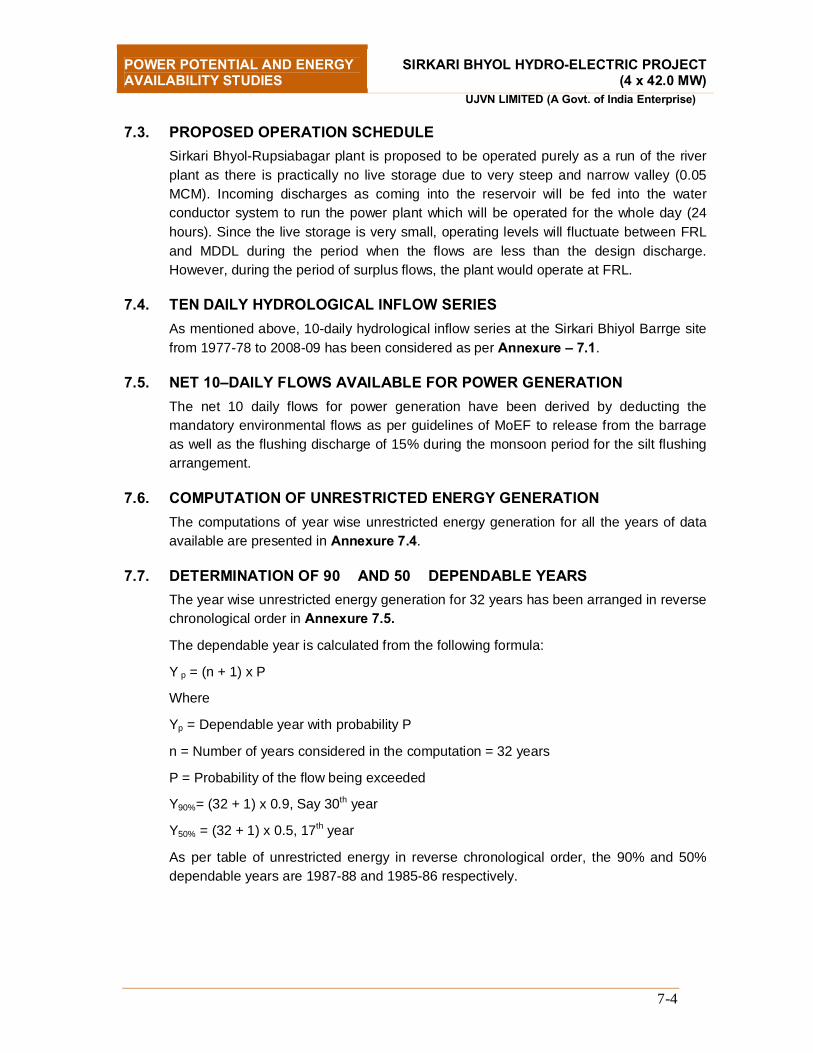
The gross head has been obtained from the difference of the operating level in the reservoir and the normal tail water level (TWL). For all the four units operating on full load and a corresponding design discharge of 52.9 m3/sec in HRT, the tail water level at TRT outfall location is 1721.25 m. The gross head HG has been determined as below:
Average reservoir level = MDDL+2/3 (FRL-MDDL) = 2083.33m
HGross = Operating level in the reservoir – TWL
HGross = (2082.0+2/3(2084-2082)) – 1721.25 = 362.08 m
Rating Curve at TRT outfall

POWER POTENTIAL AND ENERGY AVAILABILITY STUDIES
SIRKARI BHYOL HYDRO-ELECTRIC PROJECT (4 x 42.0 MW)
UJVN LIMITED (A Govt. of India Enterprise)
7-6
(ii) Head Loss in Water Conductor System
The total head loss in water conductor system for four unit operation at full load has been worked out as 10.0m (Annexure 7.10). The station will run mostly on full load during monsoon season (June to September) when the discharges are usually surplus than the design discharge. The plant would utilize the available flows and run the station on partial capacity on continuous basis in a 24 hour cycle during non monsoon season. The number of units to be operated will depend on the inflow available during non-monsoon season such that one unit can run at full load or at least 55%-60% load. Net Head: Available net head has been worked out by deducting head losses in the water conductor system from the gross head.
Net Head on turbine = HG – HL
(iii) Design Discharge, QD
Rated Net Head (main units) = MDDL+2/3 (FRL-MDDL) – TWL–Losses (all units running on full load)
= 2082 + 2/3× (2084 - 2082) -1721.25 – 10.00
= 352.08 m
Design Discharge at Full Load for 4 units QD = HnetapacityInstalledC
ΧΧΧ
η81.91000
m3/sec
=08.35292.081.9
10000.168ΧΧ
Χ =52.9m3/s
7.10. POWER POTENTIAL (MW)
The power potential has been calculated from the following formula:
P = 1000
η××× gHQ net MW
Where,
P = Power generated in MW
Q = Discharge through turbines in m3/sec
Hnet = Net head on turbines in m
g = acceleration due to gravity 9.81 m/sec2
η = overall efficiency of generating unit = 92 %
Assuming overall efficiency as 92%, the power generation is given by
P = 100081.992.0 netHQ ×××
MW
POWER POTENTIAL AND ENERGY AVAILABILITY STUDIES
SIRKARI BHYOL HYDRO-ELECTRIC PROJECT (4 x 42.0 MW)
UJVN LIMITED (A Govt. of India Enterprise)
7-7
= 1000
025.9 netHQ ×× MW
7.11. ENERGY GENERATION (GWH)
The energy generated has been calculated by the following formula:
E = 1000
TP×
Where E = Energy generated in GWh
P = Power in MW
T = Period of generation in hours.
7.12. FIXING INSTALLED CAPACITY
One of the commonly used criterion for optimization of the installed capacity is based on the analysis of incremental energy that is generated with a unit increase in the installed capacity. Although this criterion does not use any economic or financial parameters, it gives a good idea about the “beneficial” installed capacity above which the incremental
energy benefits are less attractive. A wide range of installed capacities have been studied using this criterion and the final installed capacity beyond which incremental energy benefits cease to be attractive is selected.
In this optimization study, energy generation with different installed capacities is analyzed. The energy computations are done for the 90% dependable year and 50% dependable year with the installed capacities increased in steps of 2 MW. Incremental Energy for different installed capacities has been tabulated in Annexure- 7.6 for the 90% dependable year & Annexure- 7.7 for 50% dependable respectively. The ratio of incremental energy per kW to incremental installed capacity (dkWh/dkW) for 90% dependable year & for 50% dependable flows is plotted against the installed capacities in the following figure from Annexure- 7.9.
POWER POTENTIAL AND ENERGY AVAILABILITY STUDIES
SIRKARI BHYOL HYDRO-ELECTRIC PROJECT (4 x 42.0 MW)
UJVN LIMITED (A Govt. of India Enterprise)
7-8
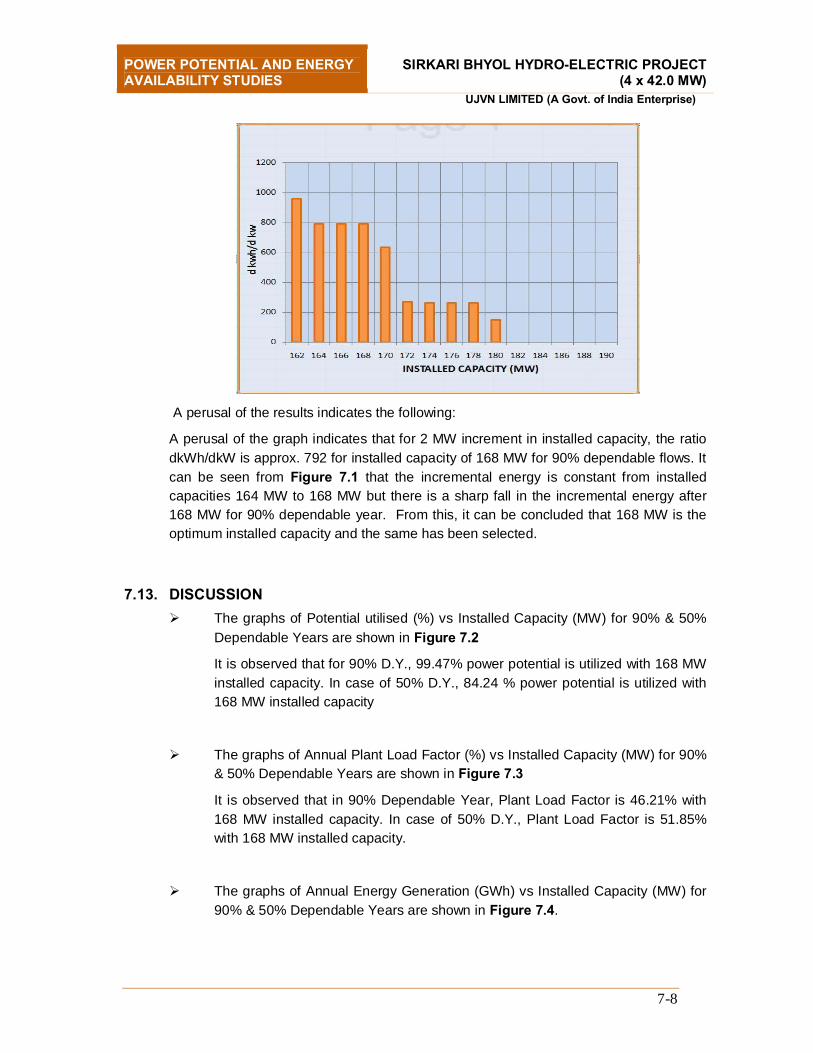
A perusal of the results indicates the following:
A perusal of the graph indicates that for 2 MW increment in installed capacity, the ratio dkWh/dkW is approx. 792 for installed capacity of 168 MW for 90% dependable flows. It can be seen from Figure 7.1 that the incremental energy is constant from installed capacities 164 MW to 168 MW but there is a sharp fall in the incremental energy after 168 MW for 90% dependable year. From this, it can be concluded that 168 MW is the optimum installed capacity and the same has been selected.
7.13. DISCUSSION
Ø The graphs of Potential utilised (%) vs Installed Capacity (MW) for 90% & 50%
Dependable Years are shown in Figure 7.2
It is observed that for 90% D.Y., 99.47% power potential is utilized with 168 MW installed capacity. In case of 50% D.Y., 84.24 % power potential is utilized with 168 MW installed capacity
Ø The graphs of Annual Plant Load Factor (%) vs Installed Capacity (MW) for 90% & 50% Dependable Years are shown in Figure 7.3
It is observed that in 90% Dependable Year, Plant Load Factor is 46.21% with 168 MW installed capacity. In case of 50% D.Y., Plant Load Factor is 51.85% with 168 MW installed capacity.
Ø The graphs of Annual Energy Generation (GWh) vs Installed Capacity (MW) for 90% & 50% Dependable Years are shown in Figure 7.4.
POWER POTENTIAL AND ENERGY AVAILABILITY STUDIES
SIRKARI BHYOL HYDRO-ELECTRIC PROJECT (4 x 42.0 MW)
UJVN LIMITED (A Govt. of India Enterprise)
7-9
It is observed that in 90% Dependable year the annual energy is 680.06 GWh with 168 MW installed capacity. In case of 50% D.Y. the energy available is 763.03 GWh with 168 MW installed capacity.
7.14. UNIT SIZE
For flexibility of operation and considering the average non-monsoon season discharge, it is proposed to provide the chosen capacity of 168 MW in four (4) units' configuration. This will ensure that at least one unit can operate at 55-60% load capacity during the period of lean discharge.
7.15. PEAKING ENERGY
As the project lies on a river which has a very steep gradient (1 in 10), it is not possible to achieve the peaking requirement of 3 hours in a 24 hour cycle with a low height structure. Hence, the project has been planned as a purely run-of-the river scheme only.
However, maximum possible generation during the peak demand period in the lean season shall be provided with the available pondage. The peaking hours available with 90% dependable year flows and average flows are given in Annexure-7.8. The pondage available between FRL and MDDL is 0.05 million cubic meters (MCM). Therefore Sirkari Bhiyol HEP is proposed to be planned as a purely ROR scheme.
7.16. FIRM POWER
The firm power is worked out on the basis of average discharge during the non-monsoon season (December to March) of 90% dependable year which is 10.55 m3/sec. Therefore, Firm Power = 9.81 x 10.55 x 352.08 x 0.92 / 1000 = 33.52 MW
7.17. SUMMARY
The various results / conclusions of the Power Potential Studies of Sirkari Bhyol Rupsiabagar HEP are summarized below.
S.NO. PARAMETER MAGNITUDE
(1) Proposed installed capacity 168 MW
(4 x 42.0 MW)
(2) Proposed overload capacity 10% in each unit
(3) Annual Energy Generation in 90% Dependable Year (1987-88) (100% Machine availability)
680.06 GWh
(4) Design Energy Generation in 90% Dependable Year (1987-88) (95% Machine availability)
662.08 GWh
(5) Annual Energy Generation in 50% Dependable Year (1985-86) (100% Machine availability)
763.03 GWh
(6) Energy Generation in 50% Dependable Year (1985-86) (95% Machine availability)
743.25 GWh
POWER POTENTIAL AND ENERGY AVAILABILITY STUDIES
SIRKARI BHYOL HYDRO-ELECTRIC PROJECT (4 x 42.0 MW)
UJVN LIMITED (A Govt. of India Enterprise)
7-10
(7) d KWH/ d KW in 90% Dependable Year 792
(8) % Potential utilized in 90% dependable year 99.47%
(9) % Potential utilized in 50% dependable year 84.24%
(10) Annual Plant Load Factor in 90% Dependable year 46.21%
(11) Annual Plant Load Factor in 50% Dependable year 51.85%
(12) Monsoon Load Factor in 90% Dependable year 73.10%
(13) Monsoon Load Factor in 50% Dependable year 80.39%
(14) Lean Period Plant Load Factor in 90% Dependable year (Dec-March)
20.07%
(15) Lean Period Plant Load Factor in 50% Dependable year (Dec-March)
19.45%
(16) Firm Power 33.52 MW

ANNEXURES

State: Uttarakhand
Catchment area: 957 km2
Unit: Cumec
Month Days 1977-78 1978-79 1979-80 1980-81 1981-82 1982-83 1983-84 1984-85 1985-86 1986-87 1987-88 1988-89 1989-90 1990-91 1991-92 1992-93 1993-94 1994-95 1995-96 1996-97 1997-98 1998-99 1999-2000 2000-01 2001-02 2002-03 2003-04 2004-05 2005-06 2006-07 2007-08 2008-09 Average1 2 3 4 5 6 7 8 9 10 11 12 13 14 15 16 17 18 19 20 21 22 23 24 25 26 27 28 29 30 31 32 20.0
June 10 I 50.4 69.7 41.6 51.2 58.4 62.2 69.1 99.5 41.2 49.1 54.8 62.6 56.3 76.6 71.6 51.1 61.5 59.0 73.1 60.5 49.8 67.7 45.2 96.6 58.8 61.6 71.0 48.2 45.5 69.6 67.3 56.1 61.210 II 46.1 70.0 47.4 52.3 58.3 82.3 57.2 100.0 45.9 79.6 56.4 48.0 54.3 71.9 74.9 62.7 66.9 62.3 78.0 73.9 52.2 61.2 66.4 81.4 68.7 69.3 71.6 60.0 58.3 57.0 88.3 98.0 66.310 III 65.9 85.5 56.2 58.3 86.5 77.5 78.7 97.4 61.0 106.2 57.1 74.5 70.8 109.7 74.6 68.7 71.5 85.9 64.4 87.9 68.4 98.4 69.4 88.0 78.3 82.1 79.1 59.7 81.3 67.5 90.0 89.4 77.8
July 10 I 89.2 91.4 57.2 65.3 104.5 93.8 87.5 109.6 75.4 105.2 65.8 82.5 75.3 132.4 91.3 57.9 72.8 99.7 86.6 63.7 80.0 107.0 110.5 96.9 88.4 106.7 101.3 83.3 117.7 124.3 123.2 100.4 92.110 II 92.5 88.0 60.8 68.6 123.7 103.2 80.7 84.2 106.2 123.5 68.1 97.9 108.8 163.7 93.6 84.1 102.2 96.0 108.5 111.3 101.3 110.0 104.0 117.6 129.4 98.0 116.0 89.5 130.7 120.7 116.0 105.1 103.211 III 99.5 94.6 73.8 72.0 126.1 119.1 97.7 99.5 104.9 119.3 84.3 130.7 131.5 134.7 117.0 104.1 92.5 112.7 104.6 102.3 110.5 121.0 137.3 113.7 150.0 97.9 121.9 110.0 129.0 132.1 143.4 135.8 113.2
August 10 I 95.9 108.0 71.5 78.2 131.9 123.4 106.9 91.6 102.7 105.5 77.0 116.7 128.0 120.4 116.7 125.5 119.5 105.3 119.8 108.0 135.7 143.8 123.0 122.9 122.9 108.5 123.8 124.6 146.2 118.3 137.1 116.3 114.910 II 114.3 92.0 66.8 64.7 129.8 133.1 121.8 93.4 136.0 92.6 78.7 109.2 127.1 135.6 117.8 110.4 93.8 106.3 109.5 112.2 107.3 139.7 110.4 117.9 121.5 105.2 112.4 131.0 133.4 108.2 139.3 111.8 112.011 III 79.3 94.3 58.5 64.0 101.4 123.0 111.8 92.3 119.9 70.1 81.4 81.9 154.9 116.2 117.6 130.4 86.0 123.4 112.2 97.6 81.3 113.6 112.8 103.7 93.8 102.4 133.5 106.9 103.8 151.1 129.9 108.6 104.9
Sept 10 I 74.2 89.6 52.9 64.7 71.2 92.1 119.1 91.0 94.9 61.2 72.9 55.5 135.2 113.0 97.4 107.9 107.9 99.9 140.9 105.4 97.6 88.1 85.3 97.7 83.6 119.5 119.8 85.4 97.4 108.9 134.0 82.5 95.210 II 75.4 74.5 43.8 56.4 60.0 77.4 103.0 69.0 76.3 38.4 58.4 43.6 93.7 89.8 81.4 84.0 100.6 74.6 88.9 81.2 94.1 72.6 87.1 75.4 67.9 112.6 97.6 75.0 107.0 100.9 99.5 76.9 79.310 III 68.5 62.9 40.9 53.4 61.8 55.6 91.4 45.8 58.5 28.1 45.3 70.1 73.5 71.2 64.4 64.2 77.1 62.6 70.1 68.1 66.9 76.2 81.8 66.2 61.9 72.7 89.9 73.4 114.6 76.8 124.7 84.4 69.5
Monsoon (MCM) 837.3 897.9 591.6 658.9 981.6 1008.2 990.0 944.0 903.3 862.0 705.8 859.1 1069.8 1175.3 986.5 928.4 924.7 960.2 1017.9 943.7 919.5 1056.5 1000.6 1036.4 993.3 999.1 1091.6 923.4 1113.0 1091.8 1226.9 1027.9 960.2Monsoon (mm) 874.9 938.3 618.2 688.5 1025.7 1053.5 1034.5 986.4 943.9 900.7 737.5 897.7 1117.8 1228.2 1030.9 970.1 966.3 1003.3 1063.7 986.1 960.8 1104.0 1045.5 1083.0 1037.9 1044.0 1140.7 964.9 1163.0 1140.8 1282.0 1074.1 1003.3Oct 10 I 45.7 39.9 18.4 31.8 39.0 30.4 61.0 40.0 48.4 21.6 29.5 39.2 54.4 53.1 44.7 44.2 55.2 40.6 51.2 53.3 37.2 57.7 64.3 45.6 38.7 53.0 61.0 61.9 108.9 53.5 109.2 55.5 49.6
10 II 35.1 31.6 16.9 26.6 28.8 22.7 43.5 32.8 66.3 20.5 24.6 28.2 47.9 41.0 35.2 35.8 41.2 32.6 42.0 34.5 30.5 65.1 42.5 34.9 34.4 40.2 44.6 50.6 80.8 42.9 66.5 41.7 39.411 III 28.7 23.3 13.2 22.4 25.1 19.8 31.5 31.6 39.6 17.0 21.1 26.3 40.2 32.3 29.8 28.3 31.3 27.9 31.4 28.8 27.1 45.8 33.6 29.4 31.7 29.5 38.2 32.9 64.7 37.2 53.4 33.1 31.4
Nov 10 I 26.7 18.5 12.2 23.5 22.7 17.5 25.8 21.9 32.1 15.9 17.5 21.5 32.3 28.8 22.9 23.7 26.3 22.2 25.4 25.7 23.6 35.2 26.3 26.8 31.4 24.7 26.8 27.2 58.0 33.5 47.2 28.1 26.610 II 21.5 16.8 11.2 19.8 17.5 16.5 23.0 20.5 25.1 14.1 15.2 19.1 30.1 27.1 18.4 21.7 24.2 19.2 24.0 21.8 21.6 28.9 24.7 21.4 28.1 21.2 25.6 24.1 65.1 31.1 44.2 24.6 24.010 III 18.4 15.2 10.4 16.9 14.6 13.2 19.3 20.0 19.4 14.0 15.2 16.4 27.9 23.9 16.1 18.7 20.5 17.2 20.8 18.4 20.1 24.7 22.0 18.2 26.5 18.6 22.9 22.3 48.1 20.2 37.3 21.8 20.6
Dec 10 I 16.2 12.6 10.1 13.9 13.5 11.7 17.4 18.7 16.3 14.4 13.7 14.3 23.5 21.8 14.9 16.2 18.3 16.1 18.0 16.6 20.4 21.7 20.6 17.2 23.8 17.8 20.8 21.4 18.9 17.8 35.1 19.6 17.910 II 14.6 11.3 9.5 12.9 12.7 10.8 16.5 18.0 14.9 13.1 13.0 13.3 21.9 19.1 14.6 14.1 16.9 14.4 17.1 15.6 20.6 20.0 18.4 15.8 19.4 16.7 19.1 20.7 17.7 17.2 29.7 17.7 16.511 III 14.2 10.3 8.9 12.3 12.4 10.4 15.2 16.0 13.6 12.1 12.6 13.3 21.0 18.4 14.0 13.6 15.3 13.3 16.1 14.9 18.2 17.9 18.0 15.4 16.5 15.9 18.4 20.1 14.9 15.0 24.6 17.0 15.3
Jan 10 I 13.2 9.4 9.2 12.1 11.8 10.1 13.1 17.0 13.0 11.2 11.9 11.9 17.5 13.8 13.0 15.2 14.4 13.0 15.2 14.3 17.4 16.3 16.8 15.1 15.7 15.3 17.4 14.4 14.6 14.1 20.5 16.5 14.210 II 12.9 9.1 8.5 11.4 11.3 11.0 12.0 14.8 12.0 11.2 10.8 13.9 16.6 13.3 12.9 14.7 14.4 12.8 15.6 13.9 15.6 15.1 16.0 14.2 15.7 15.0 14.7 13.3 15.7 13.9 18.2 15.7 13.611 III 12.1 8.6 8.3 12.1 10.9 11.4 11.1 14.4 11.5 10.6 9.4 11.8 16.3 13.2 12.7 13.6 13.3 12.5 15.4 11.2 13.7 14.5 15.4 13.8 15.9 14.7 13.8 13.0 15.4 13.3 17.4 14.8 13.0
Feb 10 I 11.4 8.7 8.2 11.9 11.5 11.0 10.5 14.0 11.5 10.4 11.0 10.1 13.4 12.9 13.5 14.3 13.3 12.1 14.9 11.4 13.6 14.1 16.2 13.6 12.2 14.3 13.1 13.2 15.1 13.4 17.5 14.2 12.710 II 11.3 8.7 8.2 11.8 11.5 10.7 11.3 14.4 11.9 10.8 11.2 9.8 14.2 12.7 13.0 15.1 12.9 13.3 14.4 13.2 14.2 14.0 15.4 13.5 14.0 14.2 13.0 14.5 15.3 14.1 16.9 14.1 12.98 III 12.7 8.9 11.8 11.8 11.1 10.5 12.1 15.4 11.9 11.1 11.0 10.3 13.6 12.6 12.4 14.2 13.3 12.3 15.8 13.3 14.5 14.3 14.7 13.0 14.1 15.2 13.0 14.2 15.4 13.6 17.3 12.2 13.0
Mar 10 I 13.8 9.3 12.6 12.6 12.4 11.2 14.2 16.5 12.0 10.9 11.7 11.7 14.9 14.4 13.7 16.0 13.7 12.1 15.1 13.6 15.6 14.6 15.9 12.9 24.9 16.5 13.2 15.1 14.6 15.0 25.9 12.0 14.310 II 16.1 9.9 12.4 12.0 14.1 12.7 15.2 16.8 12.6 12.2 21.9 12.2 17.3 15.8 14.2 15.6 16.6 12.2 19.7 13.3 15.5 13.9 16.4 13.2 23.0 15.7 13.5 17.0 15.4 19.1 23.4 12.1 15.311 III 14.9 10.6 14.7 15.0 17.4 15.4 19.1 18.8 13.8 13.5 20.1 14.5 19.4 17.9 15.1 17.5 17.3 19.3 21.8 14.7 18.2 14.8 19.0 14.2 25.2 18.9 15.6 16.5 14.8 24.8 17.5 12.6 17.0
Apr 10 I 16.4 12.6 15.9 16.4 22.2 16.5 16.2 18.4 16.1 16.3 23.3 16.7 19.3 24.7 16.6 17.1 17.8 16.6 24.2 16.6 24.8 17.1 25.2 17.4 26.3 22.5 15.3 16.7 16.5 28.4 18.3 13.7 18.810 II 29.4 15.6 19.0 25.3 24.2 19.1 18.8 23.9 27.7 14.9 33.6 19.6 28.1 27.5 19.9 24.9 16.1 19.4 31.6 18.7 26.9 22.6 31.4 19.3 29.2 32.2 15.8 18.3 17.0 39.7 21.0 16.1 23.310 III 28.1 19.3 24.3 27.2 27.4 20.3 22.0 28.2 33.0 21.4 38.7 21.0 38.1 32.2 25.9 36.9 16.9 25.3 35.1 23.6 39.2 33.3 39.5 23.2 35.3 38.0 24.5 22.9 21.3 32.5 31.3 18.2 28.3
May 10 I 45.9 20.6 28.0 32.0 37.1 40.2 29.5 36.0 43.8 22.6 44.6 21.9 40.2 42.8 32.0 51.8 27.9 29.3 45.3 25.4 48.3 32.0 43.3 37.3 43.6 34.4 24.0 27.8 34.8 39.5 34.8 21.9 35.010 II 58.3 26.5 29.3 37.8 34.8 55.3 39.7 37.6 51.3 19.6 56.4 48.5 69.4 49.1 41.3 36.0 29.5 69.1 37.0 22.8 46.8 27.9 59.2 43.7 85.6 42.8 33.2 27.2 50.4 46.7 33.2 23.0 42.811 III 55.8 18.5 29.5 44.8 36.9 51.1 52.6 56.4 48.1 29.8 61.1 54.7 68.6 61.7 34.8 47.5 52.5 42.8 45.7 31.0 71.6 43.2 75.7 38.1 51.3 48.9 33.9 26.6 54.5 42.3 36.4 30.2 46.1
Non-monsoon (MCM) 503.9 329.4 307.4 416.9 422.5 404.4 484.7 494.6 532.4 324.2 474.5 423.5 622.2 554.4 440.3 497.4 474.8 462.1 537.8 426.8 542.3 549.0 608.1 462.9 599.4 523.5 484.6 483.8 709.6 561.0 698.6 444.8 493.8Non-monsoon (mm) 526.6 344.2 321.2 435.7 441.5 422.6 506.5 516.8 556.3 338.7 495.8 442.6 650.2 579.3 460.1 519.8 496.1 482.9 561.9 446.0 566.7 573.7 635.4 483.7 626.3 547.1 506.4 505.6 741.5 586.2 730.0 464.8 516.0
Annual (MCM) 1341.2 1227.3 899.0 1075.9 1404.1 1412.6 1474.7 1438.7 1435.7 1186.1 1180.3 1282.6 1692.0 1729.7 1426.9 1425.9 1399.5 1422.3 1555.7 1370.6 1461.8 1605.5 1608.7 1499.3 1592.6 1522.7 1576.2 1407.2 1822.6 1652.8 1925.5 1472.7 1454.0Annual (mm) 1401.5 1282.5 939.4 1124.2 1467.2 1476.1 1541.0 1503.3 1500.2 1239.4 1233.4 1340.3 1768.0 1807.5 1491.0 1489.9 1462.4 1486.2 1625.6 1432.1 1527.5 1677.6 1680.9 1566.7 1664.2 1591.1 1647.1 1470.4 1904.5 1727.1 2012.0 1538.9 1519.3
River : GorigangaDistt. : Pithoragarh
ANNEX - 7.1 10-DAILY DISCHARGE DATA AT SIRKARI BHYOL BARRAGE SITE ( JUNE 1977-MAY 2009 )

Design Discharge = 52.9 cumecs
June 10 I 54.84 7.93 20.01 20.01 26.9010 II 56.44 7.93 20.01 20.01 28.5010 III 57.07 7.93 20.01 20.01 29.13
July 10 I 65.80 7.93 20.01 20.01 37.8610 II 68.11 7.93 20.01 20.01 40.1711 III 84.31 7.93 20.01 23.51 56.38
August 10 I 76.98 7.93 20.01 20.01 49.0410 II 78.73 7.93 20.01 20.01 50.7911 III 81.45 7.93 20.01 20.65 53.51
Sept 10 I 72.93 7.93 20.01 20.01 44.9910 II 58.40 7.93 20.01 20.01 30.4610 III 45.27 7.93 20.01 20.01 17.33
Oct 10 I 29.55 0.00 7.93 7.93 21.6210 II 24.59 0.00 7.93 7.93 16.6611 III 21.10 0.00 7.93 7.93 13.16
Nov 10 I 17.53 0.00 7.93 7.93 9.6010 II 15.16 0.00 7.93 7.93 7.2310 III 15.16 0.00 7.93 7.93 7.23
Dec 10 I 13.69 0.00 2.64 2.64 11.0510 II 12.99 0.00 2.64 2.64 10.3511 III 12.57 0.00 2.64 2.64 9.94
Jan 10 I 11.88 0.00 2.64 2.64 9.2410 II 10.83 0.00 2.64 2.64 8.1911 III 9.43 0.00 2.64 2.64 6.79
Feb 10 I 10.97 0.00 2.64 2.64 8.3310 II 11.25 0.00 2.64 2.64 8.618 III 11.04 0.00 2.64 2.64 8.40
Mar 10 I 11.67 0.00 2.64 2.64 9.0310 II 21.86 0.00 2.64 2.64 19.2311 III 20.12 0.00 2.64 2.64 17.48
Apr 10 I 23.33 0.00 7.93 7.93 15.4010 II 33.60 0.00 7.93 7.93 25.6710 III 38.70 0.00 7.93 7.93 30.77
May 10 I 44.57 0.00 7.93 7.93 36.6410 II 56.37 0.00 7.93 7.93 48.4411 III 61.05 0.00 7.93 8.18 53.12
ANNEXURE -7.2 COMPUTATION OF UNRESTRICTED FLOW AVAILABLE FOR POWER GENERATION IN 90% DEPENDABLE YEAR (1987-88)
Month DaysRiver Inflow
(cumec)Total Spill from Gates (Cumecs)
Flushing Discharge (Cumec)
Environmental Releases (Cumec)
Unrestricted flow available for generation (Cumecs)

Design Discharge = 52.9 cumecs
June 10 I 41.21 7.93 20.01 20.01 13.2810 II 45.89 7.93 20.01 20.01 17.9610 III 60.98 7.93 20.01 20.01 33.04
July 10 I 75.44 7.93 20.01 20.01 47.5010 II 106.25 7.93 20.01 45.45 78.3111 III 104.92 7.93 20.01 44.12 76.98
August 10 I 102.69 7.93 20.01 41.89 74.7510 II 136.01 7.93 20.01 75.21 108.0711 III 119.87 7.93 20.01 59.07 91.93
Sept 10 I 94.93 7.93 20.01 34.13 66.9910 II 76.28 7.93 20.01 20.01 48.3410 III 58.54 7.93 20.01 20.01 30.60
Oct 10 I 48.41 0.00 7.93 7.93 40.4810 II 66.29 0.00 7.93 13.42 58.3611 III 39.61 0.00 7.93 7.93 31.68
Nov 10 I 32.13 0.00 7.93 7.93 24.2010 II 25.15 0.00 7.93 7.93 17.2210 III 19.42 0.00 7.93 7.93 11.49
Dec 10 I 16.35 0.00 2.64 2.64 13.7110 II 14.88 0.00 2.64 2.64 12.2411 III 13.55 0.00 2.64 2.64 10.91
Jan 10 I 12.99 0.00 2.64 2.64 10.3510 II 12.01 0.00 2.64 2.64 9.3811 III 11.46 0.00 2.64 2.64 8.82
Feb 10 I 11.53 0.00 2.64 2.64 8.8910 II 11.88 0.00 2.64 2.64 9.248 III 11.88 0.00 2.64 2.64 9.24
Mar 10 I 12.01 0.00 2.64 2.64 9.3810 II 12.57 0.00 2.64 2.64 9.9411 III 13.76 0.00 2.64 2.64 11.12
Apr 10 I 16.14 0.00 7.93 7.93 8.2010 II 27.66 0.00 7.93 7.93 19.7310 III 33.04 0.00 7.93 7.93 25.11
May 10 I 43.80 0.00 7.93 7.93 35.8710 II 51.27 0.00 7.93 7.93 43.3411 III 48.13 0.00 7.93 7.93 40.20
Unrestricted flow available for generation (Cumecs)
ANNEXURE -7.3 COMPUTATION OF UNRESTRICTED FLOW AVAILABLE FOR POWER GENERATION IN 50% DEPENDABLE YEAR (1985-86)
Month DaysRiver Inflow
(cumec)
Flushing Discharge (Cumec)
Environmental Releases (Cumec)
Total Spill from Gates (Cumecs)

Months 77-78 78-79 79-80 80-81 81-82 82-83 83-84 84-85 85-86 86-87 87-88 88-89 89-90 90-91 91-92 92-93 93-94 94-95 95-96 96-97 97-98 98-99 99-00 2000-01 2001-02 2002-03 2003-04 2004-05 2005-06 2006-07 2007-08 2008-09
June I 10.0 38.4 53.2 31.8 39.0 44.6 47.4 52.7 75.9 31.4 37.5 41.8 47.7 42.9 58.4 54.6 39.0 46.9 45.0 55.8 46.2 38.0 51.6 34.5 73.7 44.8 47.0 54.1 36.7 34.7 53.1 51.3 42.8
II 10.0 35.1 53.3 36.1 39.9 44.5 62.7 43.6 76.3 35.0 60.7 43.0 36.6 41.4 54.8 57.1 47.8 51.1 47.5 59.5 56.4 39.8 46.7 50.7 62.0 52.4 52.9 54.6 45.8 44.5 43.5 67.3 74.7
III 10.0 50.2 65.2 42.9 44.5 65.9 59.1 60.0 74.3 46.5 81.0 43.5 56.8 54.0 83.7 56.9 52.4 54.5 65.5 49.1 67.0 52.2 75.1 52.9 67.1 59.7 62.6 60.3 45.5 62.0 51.4 68.6 68.2
July I 10.0 68.1 69.7 43.6 49.8 79.7 71.5 66.7 83.6 57.5 80.2 50.2 62.9 57.4 101.0 69.6 44.2 55.5 76.0 66.1 48.6 61.0 81.6 84.2 73.9 67.4 81.4 77.2 63.5 89.8 94.8 94.0 76.6
II 10.0 70.5 67.1 46.4 52.3 94.3 78.7 61.6 64.2 81.0 94.2 51.9 74.6 83.0 124.9 71.4 64.1 77.9 73.2 82.7 84.9 77.2 83.9 79.3 89.7 98.7 74.7 88.5 68.3 99.7 92.1 88.5 80.1
III 11.0 83.4 79.4 61.9 60.4 105.8 99.9 81.9 83.4 88.0 100.1 70.7 109.6 110.3 113.0 98.2 87.4 77.6 94.5 87.7 85.8 92.7 101.5 115.2 95.4 125.8 82.1 102.3 92.3 108.2 110.8 120.3 113.9
August I 10.0 73.2 82.3 54.5 59.6 100.6 94.1 81.6 69.9 78.3 80.4 58.7 89.0 97.6 91.8 89.0 95.7 91.1 80.3 91.4 82.4 103.5 109.7 93.8 93.7 93.7 82.7 94.4 95.0 111.5 90.2 104.6 88.7
II 10.0 87.1 70.2 50.9 49.4 99.0 101.5 92.9 71.2 103.7 70.6 60.0 83.3 96.9 103.4 89.9 84.2 71.5 81.1 83.5 85.5 81.8 106.5 84.2 89.9 92.7 80.3 85.7 99.9 101.8 82.5 106.2 85.3
III 11.0 66.6 79.1 49.1 53.7 85.1 103.2 93.8 77.5 100.6 58.8 68.3 68.7 130.0 97.5 98.6 109.4 72.2 103.5 94.1 81.9 68.2 95.3 94.7 87.0 78.7 85.9 112.0 89.7 87.1 126.7 109.0 91.1
Sept I 10.0 56.6 68.3 40.4 49.4 54.3 70.2 90.8 69.4 72.4 46.7 55.6 42.3 103.1 86.2 74.3 82.3 82.3 76.2 107.4 80.4 74.4 67.2 65.0 74.5 63.8 91.2 91.4 65.1 74.3 83.0 102.2 62.9
II 10.0 57.5 56.8 33.4 43.0 45.7 59.0 78.5 52.6 58.2 29.3 44.5 33.2 71.5 68.5 62.0 64.0 76.8 56.9 67.8 62.0 71.8 55.4 66.4 57.5 51.8 85.8 74.4 57.2 81.6 76.9 75.9 58.6
III 10.0 52.2 47.9 31.2 40.7 47.1 42.4 69.7 34.9 44.6 21.4 34.5 53.5 56.0 54.3 49.1 49.0 58.8 47.7 53.4 51.9 51.0 58.1 62.4 50.5 47.2 55.4 68.6 56.0 87.4 58.5 95.1 64.4
Oct I 10.0 34.8 30.4 14.0 24.2 29.7 23.2 46.5 30.5 36.9 16.5 22.5 29.9 41.5 40.5 34.1 33.7 42.1 31.0 39.0 40.6 28.4 44.0 49.0 34.8 29.5 40.4 46.6 47.2 83.0 40.8 83.3 42.3
II 10.0 26.7 24.1 12.9 20.3 22.0 17.3 33.1 25.0 50.6 15.6 18.8 21.5 36.5 31.3 26.8 27.3 31.4 24.8 32.0 26.3 23.2 49.7 32.4 26.6 26.2 30.7 34.0 38.6 61.6 32.7 50.7 31.8
III 11.0 24.0 19.6 11.0 18.8 21.1 16.6 26.4 26.5 33.2 14.2 17.7 22.1 33.7 27.1 25.0 23.7 26.3 23.4 26.3 24.1 22.7 38.4 28.2 24.6 26.6 24.8 32.0 27.6 54.3 31.2 44.8 27.7
Nov I 10.0 20.3 14.1 9.3 17.9 17.3 13.3 19.7 16.7 24.5 12.1 13.4 16.4 24.7 22.0 17.4 18.1 20.0 16.9 19.3 19.6 18.0 26.8 20.1 20.5 23.9 18.8 20.5 20.7 44.2 25.5 36.0 21.4
II 10.0 16.4 12.8 8.5 15.1 13.4 12.6 17.6 15.7 19.2 10.8 11.6 14.5 23.0 20.7 14.0 16.5 18.5 14.6 18.3 16.7 16.5 22.0 18.8 16.4 21.5 16.2 19.5 18.4 49.7 23.7 33.7 18.8
III 10.0 14.0 11.6 7.9 12.9 11.1 10.1 14.7 15.2 14.8 10.7 11.6 12.5 21.3 18.2 12.3 14.3 15.6 13.1 15.8 14.1 15.3 18.9 16.8 13.8 20.2 14.2 17.5 17.0 36.7 15.4 28.5 16.6
Dec I 10.0 12.3 9.6 7.7 10.6 10.3 8.9 13.3 14.3 12.5 11.0 10.4 10.9 18.0 16.6 11.4 12.3 13.9 12.2 13.7 12.7 15.6 16.5 15.7 13.1 18.1 13.6 15.9 16.3 14.4 13.6 26.8 14.9
II 10.0 11.1 8.6 7.3 9.9 9.7 8.2 12.6 13.7 11.3 10.0 9.9 10.1 16.7 14.5 11.2 10.8 12.9 11.0 13.0 11.9 15.7 15.3 14.1 12.1 14.8 12.8 14.6 15.8 13.5 13.1 22.7 13.5
III 11.0 11.9 8.6 7.5 10.3 10.4 8.8 12.7 13.4 11.4 10.1 10.5 11.2 17.6 15.4 11.7 11.4 12.8 11.2 13.5 12.5 15.2 15.0 15.1 12.9 13.9 13.3 15.4 16.9 12.5 12.6 20.6 14.3
Jan I 10.0 10.1 7.2 7.0 9.3 9.0 7.7 10.0 13.0 9.9 8.5 9.1 9.1 13.3 10.5 9.9 11.6 11.0 9.9 11.6 10.9 13.3 12.4 12.8 11.5 12.0 11.7 13.3 11.0 11.2 10.7 15.7 12.6
II 10.0 9.8 6.9 6.5 8.7 8.6 8.4 9.2 11.3 9.2 8.5 8.3 10.6 12.7 10.1 9.8 11.2 11.0 9.8 11.9 10.6 11.9 11.5 12.2 10.9 12.0 11.4 11.2 10.1 12.0 10.6 13.9 12.0
III 11.0 10.2 7.3 7.0 10.1 9.1 9.6 9.3 12.1 9.6 8.9 7.9 9.9 13.7 11.0 10.7 11.4 11.2 10.5 12.9 9.4 11.5 12.1 12.9 11.6 13.4 12.3 11.6 10.9 12.9 11.2 14.6 12.4
Feb I 10.0 8.7 6.6 6.2 9.1 8.8 8.4 8.0 10.7 8.8 7.9 8.4 7.7 10.2 9.8 10.3 10.9 10.1 9.2 11.4 8.7 10.4 10.8 12.4 10.3 9.3 10.9 10.0 10.0 11.5 10.2 13.3 10.8
II 10.0 8.6 6.6 6.3 9.0 8.8 8.2 8.6 11.0 9.1 8.2 8.6 7.5 10.8 9.7 9.9 11.5 9.8 10.2 11.0 10.1 10.8 10.6 11.7 10.3 10.7 10.8 9.9 11.1 11.7 10.8 12.9 10.8
III 8.0 7.8 5.4 7.2 7.2 6.8 6.4 7.4 9.4 7.2 6.8 6.7 6.3 8.3 7.7 7.5 8.7 8.1 7.5 9.6 8.1 8.8 8.7 9.0 7.9 8.6 9.3 8.0 8.7 9.4 8.3 10.6 7.4
Mar I 10.0 10.5 7.1 9.6 9.6 9.5 8.6 10.8 12.6 9.2 8.3 8.9 8.9 11.3 11.0 10.5 12.2 10.5 9.2 11.5 10.4 11.9 11.1 12.1 9.8 19.0 12.6 10.0 11.5 11.1 11.5 19.7 9.2
II 10.0 12.3 7.6 9.5 9.1 10.8 9.7 11.6 12.8 9.6 9.3 16.7 9.3 13.2 12.1 10.8 11.9 12.6 9.3 15.0 10.2 11.9 10.6 12.5 10.1 17.6 12.0 10.3 13.0 11.7 14.5 17.8 9.2
III 11.0 12.5 8.9 12.3 12.6 14.6 12.9 16.0 15.8 11.5 11.3 16.9 12.1 16.3 15.0 12.7 14.7 14.5 16.2 18.3 12.3 15.3 12.4 16.0 11.9 21.2 15.9 13.1 13.8 12.4 20.8 14.7 10.5
Apr I 10.0 12.5 9.6 12.1 12.5 16.9 12.6 12.3 14.1 12.3 12.4 17.8 12.7 14.7 18.9 12.7 13.0 13.6 12.7 18.5 12.7 18.9 13.1 19.3 13.3 20.0 17.2 11.6 12.8 12.6 21.7 13.9 10.4
II 10.0 22.4 11.9 14.5 19.3 18.4 14.5 14.4 18.2 21.1 11.4 25.6 15.0 21.4 20.9 15.2 19.0 12.3 14.8 24.1 14.3 20.5 17.2 23.9 14.7 22.3 24.5 12.1 14.0 13.0 30.2 16.0 12.3
III 10.0 21.5 14.7 18.5 20.7 20.9 15.5 16.7 21.5 25.2 16.3 29.5 16.0 29.1 24.6 19.8 28.1 12.9 19.3 26.8 18.0 29.9 25.4 30.2 17.7 26.9 29.0 18.7 17.4 16.3 24.8 23.9 13.9
May I 10.0 35.0 15.7 21.4 24.4 28.3 30.7 22.5 27.4 33.4 17.3 34.0 16.7 30.7 32.6 24.4 39.5 21.3 22.4 34.5 19.4 36.9 24.4 33.0 28.5 33.2 26.2 18.3 21.2 26.5 30.1 26.6 16.7
II 10.0 44.4 20.2 22.3 28.8 26.5 42.1 30.3 28.7 39.1 14.9 43.0 37.0 53.0 37.4 31.5 27.4 22.5 52.7 28.2 17.4 35.7 21.3 45.1 33.4 65.3 32.6 25.3 20.7 38.4 35.6 25.3 17.5
III 11.0 46.8 15.5 24.8 37.6 31.0 42.9 44.2 47.3 40.4 25.0 51.2 45.9 57.5 51.8 29.2 39.9 44.1 35.9 38.3 26.0 60.1 36.2 63.5 32.0 43.0 41.0 28.4 22.3 45.7 35.4 30.5 25.3
Yearly Energy (GWh) 1183.8 1083.3 793.5 949.7 1239.4 1246.9 1301.7 1269.9 1267.2 1047.0 1041.8 1132.1 1493.5 1526.8 1259.4 1258.6 1235.3 1255.4 1373.2 1209.8 1290.3 1417.1 1419.9 1323.4 1405.8 1344.0 1391.3 1242.1 1608.8 1458.9 1699.6 1299.9
Annexure - 7.4 Unrestricted Energy (GWh) at Sirkari Bhyol Barrage Site 1977-78 to 2008-09
ANNEXURE -7.5 COMPUTATION FOR 90% & 50% DEPENDABLE YEARS BASED ON ANNUAL ENERGY (JUNE1977-MAY 2009) AT SIRKARI BHIYOL BARRAGE SITE
A- ANNUAL ENERGY B- ENERGY IN DESCENDING ORDER
No. Year ENERGY(GWh) ENERGY(GWh) Ranking
1 1977 - 1978 1183.85 2007 - 2008 1699.58 1
2 1978 - 1979 1083.33 2005 - 2006 1608.75 2
3 1979 - 1980 793.50 1990 - 1991 1526.80 3
4 1980 - 1981 949.65 1989 - 1990 1493.46 4
5 1981 - 1982 1239.40 2006 - 2007 1458.88 5
6 1982 - 1983 1246.87 1999 - 2000 1419.92 6
7 1983 - 1984 1301.70 1998 - 1999 1417.14 7
8 1984 - 1985 1269.86 2001 - 2002 1405.76 8
9 1985 - 1986 1267.25 2003 - 2004 1391.30 9
10 1986 - 1987 1046.97 1995 - 1996 1373.19 10
11 1987 - 1988 1041.83 2002 - 2003 1344.01 11
12 1988 - 1989 1132.14 2000 - 2001 1323.38 12
13 1989 - 1990 1493.46 1983 - 1984 1301.70 13
14 1990 - 1991 1526.80 2008 - 2009 1299.92 14
15 1991 - 1992 1259.44 1997 - 1998 1290.30 15
16 1992 - 1993 1258.56 1984 - 1985 1269.86 16
17 1993 - 1994 1235.34 1985 - 1986 1267.25 17
18 1994 - 1995 1255.43 1991 - 1992 1259.44 18
19 1995 - 1996 1373.19 1992 - 1993 1258.56 19
20 1996 - 1997 1209.75 1994 - 1995 1255.43 20
21 1997 - 1998 1290.30 1982 - 1983 1246.87 21
22 1998 - 1999 1417.14 2004 - 2005 1242.11 22
23 1999 - 2000 1419.92 1981 - 1982 1239.40 23
24 2000 - 2001 1323.38 1993 - 1994 1235.34 24
25 2001 - 2002 1405.76 1996 - 1997 1209.75 25
26 2002 - 2003 1344.01 1977 - 1978 1183.85 26
27 2003 - 2004 1391.30 1988 - 1989 1132.14 27
28 2004 - 2005 1242.11 1978 - 1979 1083.33 28
29 2005 - 2006 1608.75 1986 - 1987 1046.97 29
30 2006 - 2007 1458.88 1987 - 1988 1041.83 30
31 2007 - 2008 1699.58 1980 - 1981 949.65 31
32 2008 - 2009 1299.92 1979 - 1980 793.50 32
Average 1208.35
C= DEPENDABLE YEARS
No. of years of data (N) = 32
Description ENERGY(GWh)
90% Dependable Year ((N+1)×0.9) 30 1041.83 1987 - 1988
50% Dependable Year ((N+1)×0.5) 17 1267.25 1985 - 1986
33×0.9 = 29.7 =
33×0.5 = 16.5 =
Corresponding Year
Year
Rank

2084.0 Turbine Efficiency 93.5%
2082.0 Generator Efficiency 98.5%
1721.3 Combined fficiency 92.00% Flow for Firm Power
362.75 10.55261
360.75
160 MW 162 MW 164 MW 166 MW 168 MW 170 MW 172 MW 174 MW 176 MW 178 MW 180 MW 182 MW 184 MW 186 MW 188 MW 190 MW
Power (MW)
Energy (GWh)
Power (MW)
Energy (GWh)
Power (MW)
Energy (GWh)
Power (MW)
Energy (GWh)
Power (MW)
Energy (GWh)
Power (MW)
Energy (GWh)
Power (MW)
Energy (GWh)
Power (MW)
Energy (GWh)
Power (MW)
Energy (GWh)
Power (MW)
Energy (GWh)
Power (MW)
Energy (GWh)
Power (MW)
Energy (GWh)
Power (MW)
Energy (GWh)
Power (MW)
Energy (GWh)
Power (MW)
Energy (GWh)
Power (MW)
Energy (GWh)
June 10 I 26.90 362.08 10.00 352.08 85.47 20.51 85.47 20.51 85.47 20.51 85.47 20.51 85.47 20.51 85.47 20.51 85.47 20.51 85.47 20.51 85.47 20.51 85.47 20.51 85.47 20.51 85.47 20.51 85.47 20.51 85.47 20.51 85.47 20.51 85.47 20.51 85.47 20.51
10 II 28.50 362.08 10.00 352.08 90.57 21.74 90.57 21.74 90.57 21.74 90.57 21.74 90.57 21.74 90.57 21.74 90.57 21.74 90.57 21.74 90.57 21.74 90.57 21.74 90.57 21.74 90.57 21.74 90.57 21.74 90.57 21.74 90.57 21.74 90.57 21.74 90.57 21.74
10 III 29.13 362.08 10.00 352.08 92.57 22.22 92.57 22.22 92.57 22.22 92.57 22.22 92.57 22.22 92.57 22.22 92.57 22.22 92.57 22.22 92.57 22.22 92.57 22.22 92.57 22.22 92.57 22.22 92.57 22.22 92.57 22.22 92.57 22.22 92.57 22.22 92.57 22.22July 10 I 37.86 362.08 10.00 352.08 120.32 28.88 120.32 28.88 120.32 28.88 120.32 28.88 120.32 28.88 120.32 28.88 120.32 28.88 120.32 28.88 120.32 28.88 120.32 28.88 120.32 28.88 120.32 28.88 120.32 28.88 120.32 28.88 120.32 28.88 120.32 28.88 120.32 28.88
10 II 40.17 362.08 10.00 352.08 127.64 30.63 127.64 30.63 127.64 30.63 127.64 30.63 127.64 30.63 127.64 30.63 127.64 30.63 127.64 30.63 127.64 30.63 127.64 30.63 127.64 30.63 127.64 30.63 127.64 30.63 127.64 30.63 127.64 30.63 127.64 30.63 127.64 30.63
11 III 56.38 362.08 10.00 352.08 179.14 47.29 160.00 42.24 162.00 42.77 164.00 43.30 166.00 43.82 168.00 44.35 170.00 44.88 172.00 45.41 174.00 45.94 176.00 46.46 178.00 46.99 179.14 47.29 179.14 47.29 179.14 47.29 179.14 47.29 179.14 47.29 179.14 47.29August 10 I 49.04 362.08 10.00 352.08 155.83 37.40 155.83 37.40 155.83 37.40 155.83 37.40 155.83 37.40 155.83 37.40 155.83 37.40 155.83 37.40 155.83 37.40 155.83 37.40 155.83 37.40 155.83 37.40 155.83 37.40 155.83 37.40 155.83 37.40 155.83 37.40 155.83 37.40
10 II 50.79 362.08 10.00 352.08 161.38 38.73 160.00 38.40 161.38 38.73 161.38 38.73 161.38 38.73 161.38 38.73 161.38 38.73 161.38 38.73 161.38 38.73 161.38 38.73 161.38 38.73 161.38 38.73 161.38 38.73 161.38 38.73 161.38 38.73 161.38 38.73 161.38 38.73
11 III 53.51 362.08 10.00 352.08 170.04 44.89 160.00 42.24 162.00 42.77 164.00 43.30 166.00 43.82 168.00 44.35 170.00 44.88 170.04 44.89 170.04 44.89 170.04 44.89 170.04 44.89 170.04 44.89 170.04 44.89 170.04 44.89 170.04 44.89 170.04 44.89 170.04 44.89Sept 10 I 44.99 362.08 10.00 352.08 142.96 34.31 142.96 34.31 142.96 34.31 142.96 34.31 142.96 34.31 142.96 34.31 142.96 34.31 142.96 34.31 142.96 34.31 142.96 34.31 142.96 34.31 142.96 34.31 142.96 34.31 142.96 34.31 142.96 34.31 142.96 34.31 142.96 34.31
10 II 30.46 362.08 10.00 352.08 96.79 23.23 96.79 23.23 96.79 23.23 96.79 23.23 96.79 23.23 96.79 23.23 96.79 23.23 96.79 23.23 96.79 23.23 96.79 23.23 96.79 23.23 96.79 23.23 96.79 23.23 96.79 23.23 96.79 23.23 96.79 23.23 96.79 23.23
10 III 17.33 362.08 10.00 352.08 55.06 13.21 55.06 13.21 55.06 13.21 55.06 13.21 55.06 13.21 55.06 13.21 55.06 13.21 55.06 13.21 55.06 13.21 55.06 13.21 55.06 13.21 55.06 13.21 55.06 13.21 55.06 13.21 55.06 13.21 55.06 13.21 55.06 13.21Oct 10 I 21.62 362.08 10.00 352.08 68.69 16.49 68.69 16.49 68.69 16.49 68.69 16.49 68.69 16.49 68.69 16.49 68.69 16.49 68.69 16.49 68.69 16.49 68.69 16.49 68.69 16.49 68.69 16.49 68.69 16.49 68.69 16.49 68.69 16.49 68.69 16.49 68.69 16.49
10 II 16.66 362.08 10.00 352.08 52.93 12.70 52.93 12.70 52.93 12.70 52.93 12.70 52.93 12.70 52.93 12.70 52.93 12.70 52.93 12.70 52.93 12.70 52.93 12.70 52.93 12.70 52.93 12.70 52.93 12.70 52.93 12.70 52.93 12.70 52.93 12.70 52.93 12.70
11 III 13.16 362.08 10.00 352.08 41.83 11.04 41.83 11.04 41.83 11.04 41.83 11.04 41.83 11.04 41.83 11.04 41.83 11.04 41.83 11.04 41.83 11.04 41.83 11.04 41.83 11.04 41.83 11.04 41.83 11.04 41.83 11.04 41.83 11.04 41.83 11.04 41.83 11.04Nov 10 I 9.60 362.08 10.00 352.08 30.51 7.32 30.51 7.32 30.51 7.32 30.51 7.32 30.51 7.32 30.51 7.32 30.51 7.32 30.51 7.32 30.51 7.32 30.51 7.32 30.51 7.32 30.51 7.32 30.51 7.32 30.51 7.32 30.51 7.32 30.51 7.32 30.51 7.32
10 II 7.23 362.08 10.00 352.08 22.96 5.51 22.96 5.51 22.96 5.51 22.96 5.51 22.96 5.51 22.96 5.51 22.96 5.51 22.96 5.51 22.96 5.51 22.96 5.51 22.96 5.51 22.96 5.51 22.96 5.51 22.96 5.51 22.96 5.51 22.96 5.51 22.96 5.51
10 III 7.23 362.08 10.00 352.08 22.96 5.51 22.96 5.51 22.96 5.51 22.96 5.51 22.96 5.51 22.96 5.51 22.96 5.51 22.96 5.51 22.96 5.51 22.96 5.51 22.96 5.51 22.96 5.51 22.96 5.51 22.96 5.51 22.96 5.51 22.96 5.51 22.96 5.51Dec 10 I 11.05 362.08 10.00 352.08 35.12 8.43 35.12 8.43 35.12 8.43 35.12 8.43 35.12 8.43 35.12 8.43 35.12 8.43 35.12 8.43 35.12 8.43 35.12 8.43 35.12 8.43 35.12 8.43 35.12 8.43 35.12 8.43 35.12 8.43 35.12 8.43 35.12 8.43
10 II 10.35 362.08 10.00 352.08 32.90 7.90 32.90 7.90 32.90 7.90 32.90 7.90 32.90 7.90 32.90 7.90 32.90 7.90 32.90 7.90 32.90 7.90 32.90 7.90 32.90 7.90 32.90 7.90 32.90 7.90 32.90 7.90 32.90 7.90 32.90 7.90 32.90 7.90
11 III 9.94 362.08 10.00 352.08 31.57 8.33 31.57 8.33 31.57 8.33 31.57 8.33 31.57 8.33 31.57 8.33 31.57 8.33 31.57 8.33 31.57 8.33 31.57 8.33 31.57 8.33 31.57 8.33 31.57 8.33 31.57 8.33 31.57 8.33 31.57 8.33 31.57 8.33Jan 10 I 9.24 362.08 10.00 352.08 29.35 7.04 29.35 7.04 29.35 7.04 29.35 7.04 29.35 7.04 29.35 7.04 29.35 7.04 29.35 7.04 29.35 7.04 29.35 7.04 29.35 7.04 29.35 7.04 29.35 7.04 29.35 7.04 29.35 7.04 29.35 7.04 29.35 7.04
10 II 8.19 362.08 10.00 352.08 26.02 6.25 26.02 6.24 26.02 6.24 26.02 6.24 26.02 6.24 26.02 6.24 26.02 6.24 26.02 6.24 26.02 6.24 26.02 6.24 26.02 6.24 26.02 6.24 26.02 6.24 26.02 6.24 26.02 6.24 26.02 6.24 26.02 6.24
11 III 6.79 362.08 10.00 352.08 21.58 5.70 21.58 5.70 21.58 5.70 21.58 5.70 21.58 5.70 21.58 5.70 21.58 5.70 21.58 5.70 21.58 5.70 21.58 5.70 21.58 5.70 21.58 5.70 21.58 5.70 21.58 5.70 21.58 5.70 21.58 5.70 21.58 5.70Feb 10 I 8.33 362.08 10.00 352.08 26.47 6.35 26.47 6.35 26.47 6.35 26.47 6.35 26.47 6.35 26.47 6.35 26.47 6.35 26.47 6.35 26.47 6.35 26.47 6.35 26.47 6.35 26.47 6.35 26.47 6.35 26.47 6.35 26.47 6.35 26.47 6.35 26.47 6.35
10 II 8.61 362.08 10.00 352.08 27.35 6.56 27.35 6.56 27.35 6.56 27.35 6.56 27.35 6.56 27.35 6.56 27.35 6.56 27.35 6.56 27.35 6.56 27.35 6.56 27.35 6.56 27.35 6.56 27.35 6.56 27.35 6.56 27.35 6.56 27.35 6.56 27.35 6.56
8 III 8.40 362.08 10.00 352.08 26.69 5.12 26.69 5.12 26.69 5.12 26.69 5.12 26.69 5.12 26.69 5.12 26.69 5.12 26.69 5.12 26.69 5.12 26.69 5.12 26.69 5.12 26.69 5.12 26.69 5.12 26.69 5.12 26.69 5.12 26.69 5.12 26.69 5.12Mar 10 I 9.03 362.08 10.00 352.08 28.69 6.88 28.69 6.89 28.69 6.89 28.69 6.89 28.69 6.89 28.69 6.89 28.69 6.89 28.69 6.89 28.69 6.89 28.69 6.89 28.69 6.89 28.69 6.89 28.69 6.89 28.69 6.89 28.69 6.89 28.69 6.89 28.69 6.89
10 II 19.23 362.08 10.00 352.08 61.09 14.66 61.09 14.66 61.09 14.66 61.09 14.66 61.09 14.66 61.09 14.66 61.09 14.66 61.09 14.66 61.09 14.66 61.09 14.66 61.09 14.66 61.09 14.66 61.09 14.66 61.09 14.66 61.09 14.66 61.09 14.66 61.09 14.66
11 III 17.48 362.08 10.00 352.08 55.54 14.66 55.54 14.66 55.54 14.66 55.54 14.66 55.54 14.66 55.54 14.66 55.54 14.66 55.54 14.66 55.54 14.66 55.54 14.66 55.54 14.66 55.54 14.66 55.54 14.66 55.54 14.66 55.54 14.66 55.54 14.66 55.54 14.66Apr 10 I 15.40 362.08 10.00 352.08 48.94 11.74 48.94 11.75 48.94 11.75 48.94 11.75 48.94 11.75 48.94 11.75 48.94 11.75 48.94 11.75 48.94 11.75 48.94 11.75 48.94 11.75 48.94 11.75 48.94 11.75 48.94 11.75 48.94 11.75 48.94 11.75 48.94 11.75
10 II 25.67 362.08 10.00 352.08 81.56 19.58 81.56 19.57 81.56 19.57 81.56 19.57 81.56 19.57 81.56 19.57 81.56 19.57 81.56 19.57 81.56 19.57 81.56 19.57 81.56 19.57 81.56 19.57 81.56 19.57 81.56 19.57 81.56 19.57 81.56 19.57 81.56 19.57
10 III 30.77 362.08 10.00 352.08 97.77 23.46 97.77 23.46 97.77 23.46 97.77 23.46 97.77 23.46 97.77 23.46 97.77 23.46 97.77 23.46 97.77 23.46 97.77 23.46 97.77 23.46 97.77 23.46 97.77 23.46 97.77 23.46 97.77 23.46 97.77 23.46 97.77 23.46May 10 I 36.64 362.08 10.00 352.08 116.41 27.94 116.41 27.94 116.41 27.94 116.41 27.94 116.41 27.94 116.41 27.94 116.41 27.94 116.41 27.94 116.41 27.94 116.41 27.94 116.41 27.94 116.41 27.94 116.41 27.94 116.41 27.94 116.41 27.94 116.41 27.94 116.41 27.94
10 II 48.44 362.08 10.00 352.08 153.93 36.94 153.93 36.94 153.93 36.94 153.93 36.94 153.93 36.94 153.93 36.94 153.93 36.94 153.93 36.94 153.93 36.94 153.93 36.94 153.93 36.94 153.93 36.94 153.93 36.94 153.93 36.94 153.93 36.94 153.93 36.94 153.93 36.94
11 III 53.12 362.08 10.00 352.08 168.80 44.56 160.00 42.24 162.00 42.77 164.00 43.30 166.00 43.82 168.00 44.35 168.80 44.56 168.80 44.56 168.80 44.56 168.80 44.56 168.80 44.56 168.80 44.56 168.80 44.56 168.80 44.56 168.80 44.56 168.80 44.56 168.80 44.56
Total Annual Energy (Gwh) 683.75 673.39 675.30 676.89 678.47 680.06 681.32 681.86 682.39 682.92 683.45 683.75 683.75 683.75 683.75 683.75 683.75
Monsoon Energy (Gwh) June-Sept 363.05 355.01 356.40 357.45 358.51 359.57 360.62 361.16 361.69 362.22 362.74 363.05 363.05 363.05 363.05 363.05 363.05
Total Lean period Energy (Gwh) (Dec-March) 97.90 97.90 97.90 97.90 97.90 97.90 97.90 97.90 97.90 97.90 97.90 97.90 97.90 97.90 97.90 97.90 97.90
Total Annual Energy with 95% machine availability 665.60 655.64 657.48 659.01 660.55 662.08 663.29 663.80 664.30 664.81 665.31 665.59 665.59 665.59 665.59 665.59 665.59
Incremental Energy (GWh) 1.92 1.58 1.58 1.58 1.27 0.54 0.53 0.53 0.53 0.30 0.00 0.00 0.00 0.00 0.00
% Potential Utilised 100% 98.5% 98.78% 99.01% 99.24% 99.47% 99.65% 99.73% 99.81% 99.88% 99.96% 100% 100% 100% 100% 100% 100%
Plant Load Factor (%) - Annual 48.04 % 47.59 % 47.12 % 46.66 % 46.21 % 45.75 % 45.25 % 44.77 % 44.29 % 43.83 % 43.36 % 42.89 % 42.42 % 41.96 % 41.52 % 41.08 %
Monsoon Load Factor (%) 75.78 % 75.14 % 74.44 % 73.76 % 73.10 % 72.45 % 71.71 % 70.99 % 70.29 % 69.60 % 68.88 % 68.13 % 67.39 % 66.66 % 65.95 % 65.26 %
Plant Load Factor (%) - Lean 21.07 % 20.81 % 20.56 % 20.31 % 20.07 % 19.83 % 19.60 % 19.37 % 19.15 % 18.94 % 18.73 % 18.52 % 18.32 % 18.12 % 17.93 % 17.74 %
FRL of Reservoir
MDDL
Tail Water Level
Gross Head (monsoon period)
Gross Head (non-monsoon period)
Installed Cap. Installed Cap. Installed Cap. Installed Cap. Installed Cap. Installed Cap. Installed Cap. Installed Cap. Installed Cap. Installed Cap. Installed Cap.
Gross Head (m)
Head Loss (m)
ANNEXURE - 7.6 POWER POTENTIAL WITH DIFFERENT INSTALLED CAPACITY WITH 90% DEPENDABLE YEAR (1987-88) FOR DISCHARGE DATA JUNE 1977 TO MAY 2009 AT SIRKARI BHYOL BARRAGE SITE
Month DaysInflow
(Qi) Cumecs
Installed Cap.
Net Head (m)
Power Potential
(MW)
Unrestricted
Energy (GWh)
Installed Cap. Installed Cap. Installed Cap. Installed Cap.

2084.0 Turbine Efficiency 93.5%
2082.0 Generator Efficiency 98.5%
1721.3 Combined fficiency 92.00%
362.75
360.75
160 MW 162 MW 164 MW 166 MW 168 MW 170 MW 172 MW 174 MW 176 MW 178 MW 180 MW 182 MW 184 MW 186 MW 188 MW 190 MW
Power (MW)
Energy (GWh)
Power (MW)
Energy (GWh)
Power (MW)
Energy (GWh)
Power (MW)
Energy (GWh)
Power (MW)
Energy (GWh)
Power (MW)
Energy (GWh)
Power (MW)
Energy (GWh)
Power (MW)
Energy (GWh)
Power (MW)
Energy (GWh)
Power (MW)
Energy (GWh)
Power (MW)
Energy (GWh)
Power (MW)
Energy (GWh)
Power (MW)
Energy (GWh)
Power (MW)
Energy (GWh)
Power (MW)
Energy (GWh)
Power (MW)
Energy (GWh)
June 10 I 13.28 362.08 10.00 352.08 42.18 10.12 42.18 10.12 42.18 10.12 42.18 10.12 42.18 10.12 42.18 10.12 42.18 10.12 42.18 10.12 42.18 10.12 42.18 10.12 42.18 10.12 42.18 10.12 42.18 10.12 42.18 10.12 42.18 10.12 42.18 10.12 42.18 10.12
10 II 17.96 362.08 10.00 352.08 57.06 13.69 57.06 13.69 57.06 13.69 57.06 13.69 57.06 13.69 57.06 13.69 57.06 13.69 57.06 13.69 57.06 13.69 57.06 13.69 57.06 13.69 57.06 13.69 57.06 13.69 57.06 13.69 57.06 13.69 57.06 13.69 57.06 13.69
10 III 33.04 362.08 10.00 352.08 105.00 25.20 105.00 25.20 105.00 25.20 105.00 25.20 105.00 25.20 105.00 25.20 105.00 25.20 105.00 25.20 105.00 25.20 105.00 25.20 105.00 25.20 105.00 25.20 105.00 25.20 105.00 25.20 105.00 25.20 105.00 25.20 105.00 25.20July 10 I 47.50 362.08 10.00 352.08 150.95 36.23 150.95 36.23 150.95 36.23 150.95 36.23 150.95 36.23 150.95 36.23 150.95 36.23 150.95 36.23 150.95 36.23 150.95 36.23 150.95 36.23 150.95 36.23 150.95 36.23 150.95 36.23 150.95 36.23 150.95 36.23 150.95 36.23
10 II 78.31 362.08 10.00 352.08 248.84 59.72 160.00 38.40 162.00 38.88 164.00 39.36 166.00 39.84 168.00 40.32 170.00 40.80 172.00 41.28 174.00 41.76 176.00 42.24 178.00 42.72 180.00 43.20 182.00 43.68 184.00 44.16 186.00 44.64 188.00 45.12 190.00 45.60
11 III 76.98 362.08 10.00 352.08 244.62 64.58 160.00 42.24 162.00 42.77 164.00 43.30 166.00 43.82 168.00 44.35 170.00 44.88 172.00 45.41 174.00 45.94 176.00 46.46 178.00 46.99 180.00 47.52 182.00 48.05 184.00 48.58 186.00 49.10 188.00 49.63 190.00 50.16August 10 I 74.75 362.08 10.00 352.08 237.52 57.00 160.00 38.40 162.00 38.88 164.00 39.36 166.00 39.84 168.00 40.32 170.00 40.80 172.00 41.28 174.00 41.76 176.00 42.24 178.00 42.72 180.00 43.20 182.00 43.68 184.00 44.16 186.00 44.64 188.00 45.12 190.00 45.60
10 II 108.07 362.08 10.00 352.08 343.40 82.42 160.00 38.40 162.00 38.88 164.00 39.36 166.00 39.84 168.00 40.32 170.00 40.80 172.00 41.28 174.00 41.76 176.00 42.24 178.00 42.72 180.00 43.20 182.00 43.68 184.00 44.16 186.00 44.64 188.00 45.12 190.00 45.60
11 III 91.93 362.08 10.00 352.08 292.12 77.12 160.00 42.24 162.00 42.77 164.00 43.30 166.00 43.82 168.00 44.35 170.00 44.88 172.00 45.41 174.00 45.94 176.00 46.46 178.00 46.99 180.00 47.52 182.00 48.05 184.00 48.58 186.00 49.10 188.00 49.63 190.00 50.16Sept 10 I 66.99 362.08 10.00 352.08 212.88 51.09 160.00 38.40 162.00 38.88 164.00 39.36 166.00 39.84 168.00 40.32 170.00 40.80 172.00 41.28 174.00 41.76 176.00 42.24 178.00 42.72 180.00 43.20 182.00 43.68 184.00 44.16 186.00 44.64 188.00 45.12 190.00 45.60
10 II 48.34 362.08 10.00 352.08 153.61 36.87 153.61 36.87 153.61 36.87 153.61 36.87 153.61 36.87 153.61 36.87 153.61 36.87 153.61 36.87 153.61 36.87 153.61 36.87 153.61 36.87 153.61 36.87 153.61 36.87 153.61 36.87 153.61 36.87 153.61 36.87 153.61 36.87
10 III 30.60 362.08 10.00 352.08 97.23 23.34 97.23 23.34 97.23 23.34 97.23 23.34 97.23 23.34 97.23 23.34 97.23 23.34 97.23 23.34 97.23 23.34 97.23 23.34 97.23 23.34 97.23 23.34 97.23 23.34 97.23 23.34 97.23 23.34 97.23 23.34 97.23 23.34Oct 10 I 40.48 362.08 10.00 352.08 128.62 30.87 128.62 30.87 128.62 30.87 128.62 30.87 128.62 30.87 128.62 30.87 128.62 30.87 128.62 30.87 128.62 30.87 128.62 30.87 128.62 30.87 128.62 30.87 128.62 30.87 128.62 30.87 128.62 30.87 128.62 30.87 128.62 30.87
10 II 58.36 362.08 10.00 352.08 185.45 44.51 160.00 38.40 162.00 38.88 164.00 39.36 166.00 39.84 168.00 40.32 170.00 40.80 172.00 41.28 174.00 41.76 176.00 42.24 178.00 42.72 180.00 43.20 182.00 43.68 184.00 44.16 185.45 44.51 185.45 44.51 185.45 44.51
11 III 31.68 362.08 10.00 352.08 100.65 26.57 100.65 26.57 100.65 26.57 100.65 26.57 100.65 26.57 100.65 26.57 100.65 26.57 100.65 26.57 100.65 26.57 100.65 26.57 100.65 26.57 100.65 26.57 100.65 26.57 100.65 26.57 100.65 26.57 100.65 26.57 100.65 26.57Nov 10 I 24.20 362.08 10.00 352.08 76.90 18.46 76.90 18.46 76.90 18.46 76.90 18.46 76.90 18.46 76.90 18.46 76.90 18.46 76.90 18.46 76.90 18.46 76.90 18.46 76.90 18.46 76.90 18.46 76.90 18.46 76.90 18.46 76.90 18.46 76.90 18.46 76.90 18.46
10 II 17.22 362.08 10.00 352.08 54.71 13.13 54.71 13.13 54.71 13.13 54.71 13.13 54.71 13.13 54.71 13.13 54.71 13.13 54.71 13.13 54.71 13.13 54.71 13.13 54.71 13.13 54.71 13.13 54.71 13.13 54.71 13.13 54.71 13.13 54.71 13.13 54.71 13.13
10 III 11.49 362.08 10.00 352.08 36.50 8.76 36.50 8.76 36.50 8.76 36.50 8.76 36.50 8.76 36.50 8.76 36.50 8.76 36.50 8.76 36.50 8.76 36.50 8.76 36.50 8.76 36.50 8.76 36.50 8.76 36.50 8.76 36.50 8.76 36.50 8.76 36.50 8.76Dec 10 I 13.71 362.08 10.00 352.08 43.56 10.45 43.56 10.45 43.56 10.45 43.56 10.45 43.56 10.45 43.56 10.45 43.56 10.45 43.56 10.45 43.56 10.45 43.56 10.45 43.56 10.45 43.56 10.45 43.56 10.45 43.56 10.45 43.56 10.45 43.56 10.45 43.56 10.45
10 II 12.24 362.08 10.00 352.08 38.90 9.34 38.90 9.34 38.90 9.34 38.90 9.34 38.90 9.34 38.90 9.34 38.90 9.34 38.90 9.34 38.90 9.34 38.90 9.34 38.90 9.34 38.90 9.34 38.90 9.34 38.90 9.34 38.90 9.34 38.90 9.34 38.90 9.34
11 III 10.91 362.08 10.00 352.08 34.68 9.16 34.68 9.16 34.68 9.16 34.68 9.16 34.68 9.16 34.68 9.16 34.68 9.16 34.68 9.16 34.68 9.16 34.68 9.16 34.68 9.16 34.68 9.16 34.68 9.16 34.68 9.16 34.68 9.16 34.68 9.16 34.68 9.16Jan 10 I 10.35 362.08 10.00 352.08 32.90 7.90 32.90 7.90 32.90 7.90 32.90 7.90 32.90 7.90 32.90 7.90 32.90 7.90 32.90 7.90 32.90 7.90 32.90 7.90 32.90 7.90 32.90 7.90 32.90 7.90 32.90 7.90 32.90 7.90 32.90 7.90 32.90 7.90
10 II 9.38 362.08 10.00 352.08 29.80 7.15 29.80 7.15 29.80 7.15 29.80 7.15 29.80 7.15 29.80 7.15 29.80 7.15 29.80 7.15 29.80 7.15 29.80 7.15 29.80 7.15 29.80 7.15 29.80 7.15 29.80 7.15 29.80 7.15 29.80 7.15 29.80 7.15
11 III 8.82 362.08 10.00 352.08 28.02 7.40 28.02 7.40 28.02 7.40 28.02 7.40 28.02 7.40 28.02 7.40 28.02 7.40 28.02 7.40 28.02 7.40 28.02 7.40 28.02 7.40 28.02 7.40 28.02 7.40 28.02 7.40 28.02 7.40 28.02 7.40 28.02 7.40Feb 10 I 8.89 362.08 10.00 352.08 28.24 6.78 28.24 6.78 28.24 6.78 28.24 6.78 28.24 6.78 28.24 6.78 28.24 6.78 28.24 6.78 28.24 6.78 28.24 6.78 28.24 6.78 28.24 6.78 28.24 6.78 28.24 6.78 28.24 6.78 28.24 6.78 28.24 6.78
10 II 9.24 362.08 10.00 352.08 29.35 7.04 29.35 7.04 29.35 7.04 29.35 7.04 29.35 7.04 29.35 7.04 29.35 7.04 29.35 7.04 29.35 7.04 29.35 7.04 29.35 7.04 29.35 7.04 29.35 7.04 29.35 7.04 29.35 7.04 29.35 7.04 29.35 7.04
8 III 9.24 362.08 10.00 352.08 29.35 5.64 29.35 5.64 29.35 5.64 29.35 5.64 29.35 5.64 29.35 5.64 29.35 5.64 29.35 5.64 29.35 5.64 29.35 5.64 29.35 5.64 29.35 5.64 29.35 5.64 29.35 5.64 29.35 5.64 29.35 5.64 29.35 5.64Mar 10 I 9.38 362.08 10.00 352.08 29.80 7.15 29.80 7.15 29.80 7.15 29.80 7.15 29.80 7.15 29.80 7.15 29.80 7.15 29.80 7.15 29.80 7.15 29.80 7.15 29.80 7.15 29.80 7.15 29.80 7.15 29.80 7.15 29.80 7.15 29.80 7.15 29.80 7.15
10 II 9.94 362.08 10.00 352.08 31.57 7.58 31.57 7.58 31.57 7.58 31.57 7.58 31.57 7.58 31.57 7.58 31.57 7.58 31.57 7.58 31.57 7.58 31.57 7.58 31.57 7.58 31.57 7.58 31.57 7.58 31.57 7.58 31.57 7.58 31.57 7.58 31.57 7.58
11 III 11.12 362.08 10.00 352.08 35.34 9.33 35.34 9.33 35.34 9.33 35.34 9.33 35.34 9.33 35.34 9.33 35.34 9.33 35.34 9.33 35.34 9.33 35.34 9.33 35.34 9.33 35.34 9.33 35.34 9.33 35.34 9.33 35.34 9.33 35.34 9.33 35.34 9.33Apr 10 I 8.20 362.08 10.00 352.08 26.07 6.26 26.07 6.26 26.07 6.26 26.07 6.26 26.07 6.26 26.07 6.26 26.07 6.26 26.07 6.26 26.07 6.26 26.07 6.26 26.07 6.26 26.07 6.26 26.07 6.26 26.07 6.26 26.07 6.26 26.07 6.26 26.07 6.26
10 II 19.73 362.08 10.00 352.08 62.70 15.05 62.70 15.05 62.70 15.05 62.70 15.05 62.70 15.05 62.70 15.05 62.70 15.05 62.70 15.05 62.70 15.05 62.70 15.05 62.70 15.05 62.70 15.05 62.70 15.05 62.70 15.05 62.70 15.05 62.70 15.05 62.70 15.05
10 III 25.11 362.08 10.00 352.08 79.79 19.15 79.79 19.15 79.79 19.15 79.79 19.15 79.79 19.15 79.79 19.15 79.79 19.15 79.79 19.15 79.79 19.15 79.79 19.15 79.79 19.15 79.79 19.15 79.79 19.15 79.79 19.15 79.79 19.15 79.79 19.15 79.79 19.15May 10 I 35.87 362.08 10.00 352.08 113.97 27.35 113.97 27.35 113.97 27.35 113.97 27.35 113.97 27.35 113.97 27.35 113.97 27.35 113.97 27.35 113.97 27.35 113.97 27.35 113.97 27.35 113.97 27.35 113.97 27.35 113.97 27.35 113.97 27.35 113.97 27.35 113.97 27.35
10 II 43.34 362.08 10.00 352.08 137.72 33.05 137.72 33.05 137.72 33.05 137.72 33.05 137.72 33.05 137.72 33.05 137.72 33.05 137.72 33.05 137.72 33.05 137.72 33.05 137.72 33.05 137.72 33.05 137.72 33.05 137.72 33.05 137.72 33.05 137.72 33.05 137.72 33.05
11 III 40.20 362.08 10.00 352.08 127.73 33.72 127.73 33.72 127.73 33.72 127.73 33.72 127.73 33.72 127.73 33.72 127.73 33.72 127.73 33.72 127.73 33.72 127.73 33.72 127.73 33.72 127.73 33.72 127.73 33.72 127.73 33.72 127.73 33.72 127.73 33.72 127.73 33.72
Total Annual Energy (Gwh) 909.17 749.20 752.66 756.11 759.57 763.03 766.48 769.94 773.39 776.85 780.31 783.76 787.22 790.67 794.00 796.97 799.95
Monsoon Energy (Gwh) June-Sept 537.38 383.53 386.50 389.48 392.46 395.43 398.41 401.38 404.36 407.34 410.31 413.29 416.26 419.24 422.22 425.19 428.17
Total Lean period Energy (Gwh) (Dec-March) 94.91 94.91 94.91 94.91 94.91 94.91 94.91 94.91 94.91 94.91 94.91 94.91 94.91 94.91 94.91 94.91 94.91
Total Annual Energy with 95% machine availability 882.30 730.02 733.33 736.64 739.95 743.25 746.56 749.87 753.18 756.48 759.79 763.10 766.40 769.71 772.89 775.71 778.54
Incremental Energy (GWh) 3.46 3.46 3.46 3.46 3.46 3.46 3.46 3.46 3.46 3.46 3.46 3.46 3.32 2.98 2.98
% Potential Utilised 100% 82.74% 83.12% 83.49% 83.87% 84.24% 84.62% 84.99% 85.37% 85.74% 86.11% 86.49% 86.86% 87.24% 87.6% 87.92% 88.24%
Plant Load Factor (%) - Annual 53.45 % 53.04 % 52.63 % 52.23 % 51.85 % 51.47 % 51.10 % 50.74 % 50.39 % 50.04 % 49.71 % 49.38 % 49.05 % 48.73 % 48.39 % 48.06 %
Monsoon Load Factor (%) 81.87 % 81.48 % 81.11 % 80.74 % 80.39 % 80.04 % 79.70 % 79.37 % 79.04 % 78.73 % 78.42 % 78.11 % 77.82 % 77.53 % 77.24 % 76.96 %
Plant Load Factor (%) - Lean 20.43 % 20.17 % 19.93 % 19.69 % 19.45 % 19.22 % 19.00 % 18.78 % 18.57 % 18.36 % 18.16 % 17.96 % 17.76 % 17.57 % 17.38 % 17.20 %
ANNEXURE - 7.7 POWER POTENTIAL WITH DIFFERENT INSTALLED CAPACITY WITH 50% DEPENDABLE YEAR (1985-86) FOR DISCHARGE DATA JUNE 1977 TO MAY 2009 AT SIRKARI BHYOL BARRAGE SITE
Month DaysInflow
(Qi) Cumecs
Gross Head (m)
Head Loss (m)
Net Head (m)
Power Potential
(MW)
Unrestricted
Energy (GWh)
Installed Cap. Installed Cap. Installed Cap. Installed Cap. Installed Cap. Installed Cap. Installed Cap. Installed Cap. Installed Cap. Installed Cap. Installed Cap. Installed Cap. Installed Cap. Installed Cap. Installed Cap. Installed Cap.
FRL of Reservoir
MDDL
Tail Water Level
Gross Head (monsoon period)
Gross Head (non-monsoon period)

10 26.90 52.87 1.50 12.2110 28.50 52.87 1.60 12.9410 29.13 52.87 1.64 13.2210 37.86 52.87 2.59 17.1910 40.17 52.87 3.06 18.2311 56.38 52.87 24.00 24.0010 49.04 52.87 10.16 22.2610 50.79 52.87 18.67 23.0511 53.51 52.87 24.00 24.0010 44.99 52.87 4.93 20.4210 30.46 52.87 1.74 13.8310 17.33 52.87 1.09 7.8710 21.62 52.87 1.24 9.8110 16.66 52.87 1.07 7.5611 13.16 52.87 0.98 5.9810 9.60 52.87 0.90 4.3610 7.23 52.87 0.85 3.2810 7.23 52.87 0.85 3.2810 11.05 52.87 0.93 5.0210 10.35 52.87 0.91 4.7011 9.94 52.87 0.91 4.5110 9.24 52.87 0.89 4.1910 8.19 52.87 0.87 3.7211 6.79 52.87 0.84 3.0810 8.33 52.87 0.87 3.7810 8.61 52.87 0.88 3.918 8.40 52.87 0.87 3.8110 9.03 52.87 0.89 4.1010 19.23 52.87 1.16 8.7311 17.48 52.87 1.10 7.9310 15.40 52.87 1.04 6.9910 25.67 52.87 1.43 11.6510 30.77 52.87 1.76 13.9710 36.64 52.87 2.40 16.6310 48.44 52.87 8.78 21.9911 53.12 52.87 24.00 24.00
TOTAL= 151.41 396.21
6.79 52.87 0.84 3.08
0.84 hrs
140000 cum 5.73 hrs 6.57 hrs 21.6 MW
3.08 hrs
Dec to March (Non-monsoon)
Dec
Jan
Feb
Mar
Apr
May
Sept
Oct
Nov
Month DaysInflow (m3/s) in 90% Dep.
Year
Design Discharge
(m3/s)
Peaking Time Based on Live Storage (Hour)
Firm Power =
Total peaking in a day
Annexure 7.8 - Computation of Peaking Hours in 90% Dependable Year
Minimum peaking time =
Storage available =Storage time =Total time =
Peaking Time in a day(Hour)
Min Peaking Time (Hrs.)
Months Minimum Inflow (m3/s)
Design Discharge
Min Peaking Time (Hrs.)
June
July
Aug
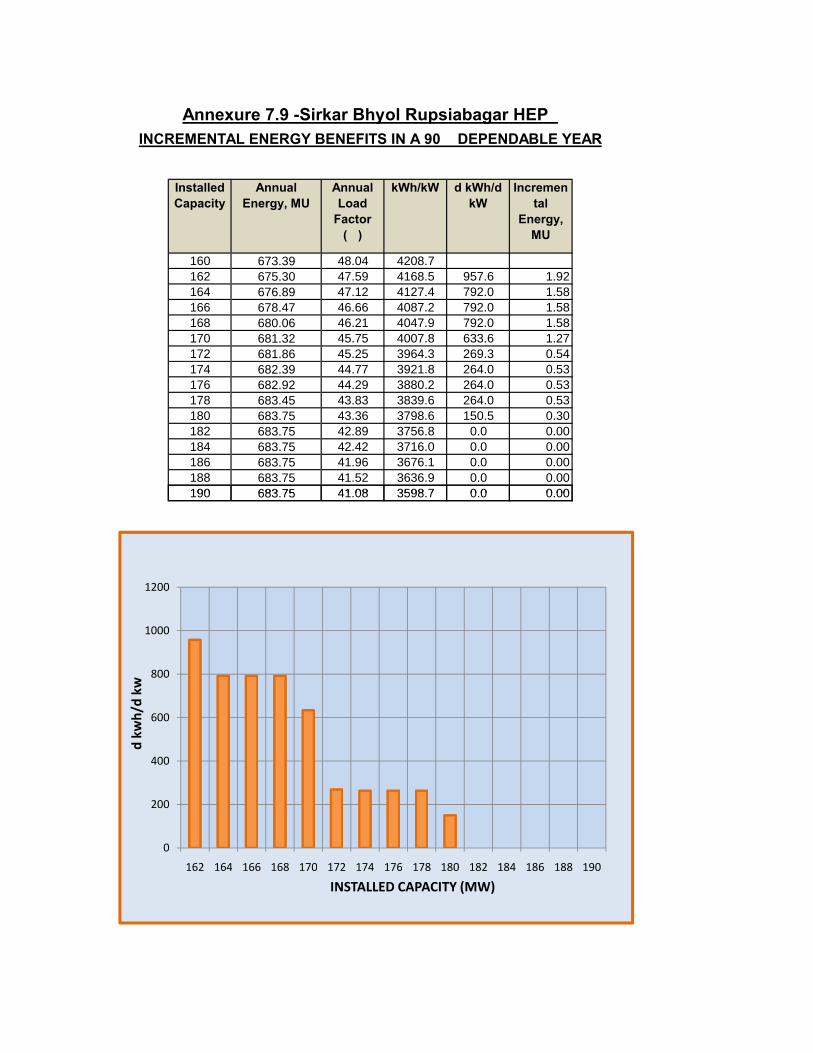
160 673.39 48.04 4208.7162 675.30 47.59 4168.5 957.6 1.92164 676.89 47.12 4127.4 792.0 1.58166 678.47 46.66 4087.2 792.0 1.58168 680.06 46.21 4047.9 792.0 1.58170 681.32 45.75 4007.8 633.6 1.27172 681.86 45.25 3964.3 269.3 0.54174 682.39 44.77 3921.8 264.0 0.53176 682.92 44.29 3880.2 264.0 0.53178 683.45 43.83 3839.6 264.0 0.53180 683.75 43.36 3798.6 150.5 0.30182 683.75 42.89 3756.8 0.0 0.00184 683.75 42.42 3716.0 0.0 0.00186 683.75 41.96 3676.1 0.0 0.00188 683.75 41.52 3636.9 0.0 0.00190 683.75 41.08 3598.7 0.0 0.00
Incremental
Energy, MU
Annexure 7.9 -Sirkar Bhyol Rupsiabagar HEP INCREMENTAL ENERGY BENEFITS IN A 90% DEPENDABLE YEAR
d kWh/d kW
Installed Capacity
Annual Energy, MU
Annual Load
Factor (%)
kWh/kW
190 683.75 41.08 3598.7 0.0 0.00
0
200
400
600
800
1000
1200
162 164 166 168 170 172 174 176 178 180 182 184 186 188 190
d kw
h/d
kw
INSTALLED CAPACITY (MW)

Total Design Discharge 52.90 cumecDesign discharge for one unit 13.23 cumec
TRASHRACK ENTRANCE LOSS
Design Discharge (Q) = 13.23 cumecHeight of trashrack = 4.175 m
Total width of the trashrack = 7 m
Gross Area of Trash Rack (ag) = 4.175* 7 = 29.225 m2
Percentage of open area in trash rack (Assumed) = 80 %Net Area (an) = 29.225* 80/100 = 23.38 m2
Clogging assumed = 30.00 %Net Area condsidering clogging = 23.38*(1-(30.00/100)) = 16.37 m2
Velocity (vt=Q/At) = = 0.8 m/s
Head loss coefficient (ktr )= 1.45-0.45 an/ag - (an/ag)2 = = 0.88As per clause 7 of IS 11388 -1995
Trash Rack Loss (Kt Vt2/2g) = = 0.029 m
ENTRANCE LOSS AT BELL MOUTH ENTRYType of Entrance Rectangular Bell MouthDesign Discharge (Q) = 13.23 cumecWidth at Entrance = 7.00 mHeight at Entrance = 4.18 mArea at Intake entry (Ae) = 7.00*4.18 = 29.225 m2
Velocity at Entrance (Ve) =Q/Ae) = = 0.45 m/sEntrance Loss Co-efficient(ke) = 0.16
As per Table -1 of IS4880 (Part III)-1976Entrance Loss (he =ke * ve
2/2g) = = 0.002 m
TRANSITION LOSS (FROM RECTANGULAR BELL MOUTH TO INTAKE GATE)
Transition Loss Co-efficient (kt) = 0.1As per Cl. 4.4.1.1 of IS4880 (Part III)-1976
Transition Loss (htr = 0.1 *( vg2/2g-ve
2/2g) = = 0.022 m
HEAD LOSS AT STOPLOG
Width of Gate = 2.50 mHeight of Gate = 2.50 m
Total Gate Area = = 6.25 m2
Design Discharge = 13.23 cumecVelocity (Vg) = = 2.116 m/sLoss coefficient at Gate = 0.10
As per Cl. 4.6 of IS4880 (Part III)-1976
Gate Loss (hg = Kg * vg2/2g) = = 0.023 m
LOSS IN TRANSITION FROM RECTANGULAR TO HORSE SHOE(INTAKE TUNNEL)
Shape Horse ShoeDiameter (D) = 2.50Wetted Area (A) = A=0.8293D2 = = 5.18Wetted Perimeter (P= 3.267D) = = 8.17Hydraulic radius (R=A/P) = = 0.63Design Discharge (Q) = 13.23Velocity (v) = = 2.552Rugosity coefficient (n) = 0.014(Considered for smooth concrete)Area of the Gate = 6.25Velocity at the Gate (vgate) = = 2.116Loss Coefficient = 0.1
As per Cl. 4.6 of IS4880 (Part III)-1976Transition Loss (htr = 0.1 *( vg
2/2g-ve2/2g) = = 0.002 m
ANNEXURE 7.10: HEAD LOSS CALCULATION
1.45-0.45*(16.37/ 29.225)/1-(16.37/ 29.225)^2
13.23/16.37
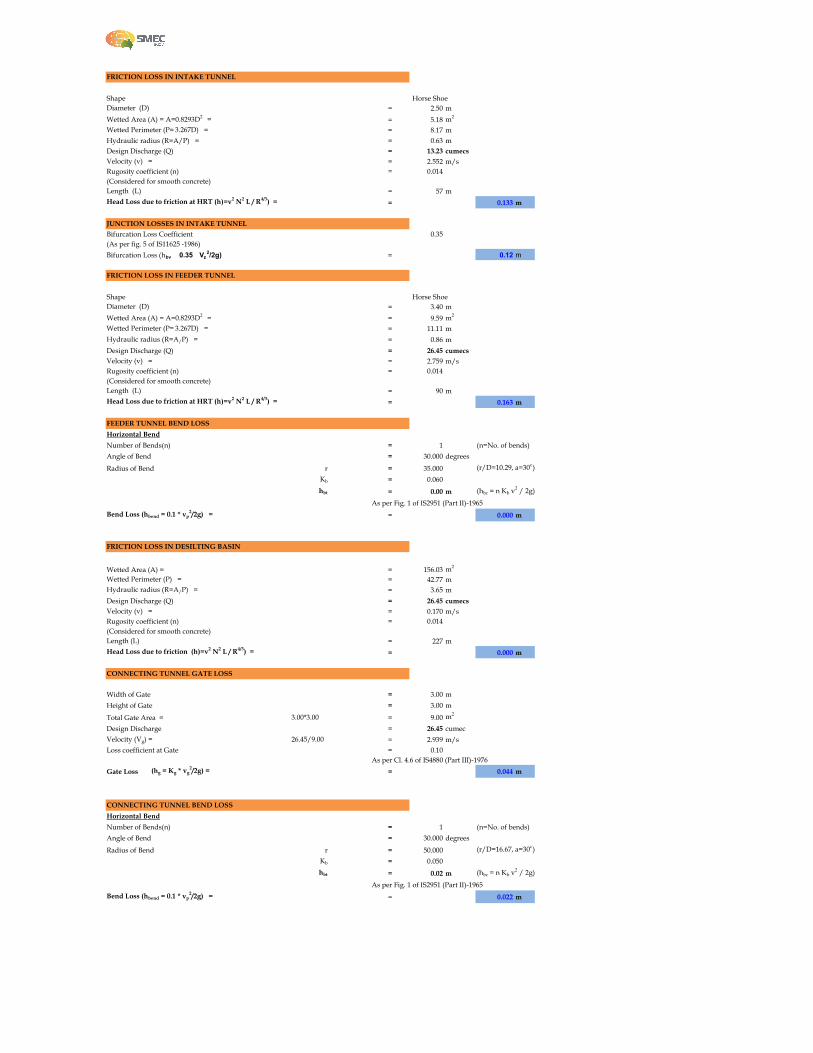
Shape Horse ShoeDiameter (D) = 2.50 mWetted Area (A) = A=0.8293D2 = = 5.18 m2
Wetted Perimeter (P= 3.267D) = = 8.17 mHydraulic radius (R=A/P) = = 0.63 mDesign Discharge (Q) = 13.23 cumecsVelocity (v) = = 2.552 m/sRugosity coefficient (n) = 0.014(Considered for smooth concrete)Length (L) = 57 mHead Loss due to friction at HRT (h)=v2 N2 L / R4/3) = = 0.133 m
JUNCTION LOSSES IN INTAKE TUNNELBifurcation Loss Coefficient 0.35(As per fig. 5 of IS11625 -1986)Bifurcation Loss (hbv = 0.35 * Vp
2/2g) = = 0.12 m
Shape Horse ShoeDiameter (D) = 3.40 mWetted Area (A) = A=0.8293D2 = = 9.59 m2
Wetted Perimeter (P= 3.267D) = = 11.11 mHydraulic radius (R=A/P) = = 0.86 mDesign Discharge (Q) = 26.45 cumecsVelocity (v) = = 2.759 m/sRugosity coefficient (n) = 0.014(Considered for smooth concrete)Length (L) = 90 mHead Loss due to friction at HRT (h)=v2 N2 L / R4/3) = = 0.163 m
FEEDER TUNNEL BEND LOSSHorizontal BendNumber of Bends(n) = 1 (n=No. of bends)Angle of Bend = 30.000 degrees
Radius of Bend r = 35.000 (r/D=10.29, a=30o)Kb = 0.060hbt = 0.00 m (hbc = n Kb v2 / 2g)
As per Fig. 1 of IS2951 (Part II)-1965Bend Loss (hbend = 0.1 * vp
2/2g) = = 0.000 m
Wetted Area (A) = = 156.03 m2
Wetted Perimeter (P) = = 42.77 mHydraulic radius (R=A/P) = = 3.65 mDesign Discharge (Q) = 26.45 cumecsVelocity (v) = = 0.170 m/sRugosity coefficient (n) = 0.014(Considered for smooth concrete)Length (L) = 227 mHead Loss due to friction (h)=v2 N2 L / R4/3) = = 0.000 m
Width of Gate = 3.00 mHeight of Gate = 3.00 m
Total Gate Area = = 9.00 m2
Design Discharge = 26.45 cumecVelocity (Vg) = = 2.939 m/sLoss coefficient at Gate = 0.10
As per Cl. 4.6 of IS4880 (Part III)-1976Gate Loss (hg = Kg * vg
2/2g) = = 0.044 m
CONNECTING TUNNEL BEND LOSSHorizontal BendNumber of Bends(n) = 1 (n=No. of bends)Angle of Bend = 30.000 degrees
Radius of Bend r = 50.000 (r/D=16.67, a=30o)Kb = 0.050hbt = 0.02 m (hbc = n Kb v2 / 2g)
As per Fig. 1 of IS2951 (Part II)-1965Bend Loss (hbend = 0.1 * vp
2/2g) = = 0.022 m
FRICTION LOSS IN INTAKE TUNNEL
FRICTION LOSS IN DESILTING BASIN
FRICTION LOSS IN FEEDER TUNNEL
CONNECTING TUNNEL GATE LOSS
3.00*3.00
26.45/9.00

Shape Horse ShoeDiameter (D) = 3.00 mWetted Area (A) = A=0.8293D2 = = 7.46 m2
Wetted Perimeter (P= 3.267D) = = 9.80 mHydraulic radius (R=A/P) = = 0.76 mDesign Discharge (Q) = 26.45 cumecsVelocity (v) = = 3.544 m/sRugosity coefficient (n) = 0.014(Considered for smooth concrete)Length (L) = 82 mHead Loss due to friction (h)=v2 N2 L / R4/3) = = 0.290 m
Number of Junctions = 1Bifurcation Loss Coefficient = 0.35(As per fig. 5 of IS11625 -1986)Bifurcation Loss (hbv = 0.35 * Vp
2/2g) = = 0.22 m
Shape of the HRT Horse ShoeDiameter of HRT (DHRT) = 4.90 mWetted Area (AHRT) = A=0.8293D2 = = 19.91 m2
Wetted Perimeter (PHRT= 3.267D) = = 16.01 mHydraulic radius (RHRT=AHRT/PHRT) = = 1.24 mDesign Discharge (Q) = 52.90 cumecsVelocity (vHRT) = = 2.657 m/sRugosity coefficient (n) = 0.014(Considered for smooth concrete)Length of HRT (LHRT) = 1200 mHead Loss due to friction at HRT (hHRT)=v2 N2 L / R4/3) = = 1.241 m
TRANSITION LOSS FROM HORSE SHOE HRT TO RECTANGULAR
Shape of the HRT Horse ShoeDiameter of HRT (DHRT) = 4.90Wetted Area (AHRT) = A=0.8293D2 = = 19.91Wetted Perimeter (PHRT= 3.267D) = = 16.01Hydraulic radius (RHRT=AHRT/PHRT) = = 1.24Design Discharge (Q) = 52.90Velocity (vHRT) = = 2.657Shape RectangularHeight/width (DP) = 4.90Wetted Area (AP) = A=D2 = = 24.01Wetted Perimeter (PP= 4D) = = 19.60Hydraulic radius (RP=AP/PP) = = 1.23Design Discharge (Q) = 52.90Velocity (vP) = = 2.203(Considered for smooth concrete)Loss Coefficient = 0.1
As per Cl. 4.6 of IS4880 (Part III)-1976Transition Loss (htr = 0.1 *( vg
2/2g-ve2/2g) = = 0.001 m
Headloss upto Surge Shaft = 2.313 m
Width of Gate = 3.60 mHeight of Gate = 3.60 m
Total Gate Area = = 12.96 m2
Design Discharge = 52.90 cumecVelocity (Vg) = = 4.082 m/sLoss coefficient at Gate = 0.10
As per Cl. 4.6 of IS4880 (Part III)-1976Gate Loss (hg = Kg * vg
2/2g) = = 0.085 m
Shape of penstock Circular Diameter of penstock(D) = 3.60 mWetted Area (A) = = 10.18 m2
Wetted Perimeter (P) = = 11.31 mHydraulic radius (R=A/P ) = = 0.90 mDesign Discharge (Q) = 52.90 cumecsVelocity at penstock (VPS) = = 5.197 m/sRugosity coefficient (n) = 0.012(Considered for steel liner)Length of penstock (L) = 620 m
Friction Loss (hft = vPS
2 n2 L / R4/3) = = 2.775 m
(3.14/4)*3.60^2
FRICTION LOSS IN MAIN PENSTOCK
FRICTION LOSS IN CONNECTING TUNNEL
JUNCTION LOSS IN HRT
FRICTION LOSS IN HRT
52.90/12.96
SURGE SHAFT GATE LOSS
3.60*3.60
3.14*3.6010.18/11.31

PENSTOCK BEND LOSSVertical BendsNumber of Bends(n) = 4 (n=No. of bends)Angle of Bend = 90.000 degrees
Radius of Bend r = 6.000 (r/D=1.72, a=90o)Kb = 0.100hbt = 0.55 m (hbc = n Kb v2 / 2g)
As per Fig. 1 of IS2951 (Part II)-1965Bend Loss (hbend = 0.1 * vp
2/2g) = = 0.55 m
BIFURCATION LOSSES IN PENSTOCKBifurcation Loss Coefficient 0.35(As per fig. 5 of IS11625 -1986)Bifurcation Loss (hbv = 0.35 * Vp
2/2g) = = 0.48 m
FRICTION LOSS IN BRANCH PENSTOCKSShape of branch penstock Circular Diameter of Branch Penstock = 2.50 mWetted Area (A) = = 4.91 m2
Wetted Perimeter (P) = = 7.85 mHydraulic radius (R=A/P ) = = 0.63 mDesign Discharge (Q) = 26.45 cumecsVelocity at penstock (VPS) = = 5.388 m/sRugosity coefficient (n) = 0.012(Considered for steel liner)Length of penstock (L) = 50 m
Friction Loss (hft = vPS2 n2 L / R4/3) = = 0.391 m
PENSTOCK BEND LOSSHorizontal BendNumber of Bends(n) = 1 (n=No. of bends)Angle of Bend = 45.000 degrees
Radius of Bend r = 5.000 (r/D=2.0, a=45o)Kb = 0.090hbt = 0.00 m (hbc = n Kb v2 / 2g)
As per Fig. 1 of IS2951 (Part II)-1965Bend Loss (hbend = 0.1 * vp
2/2g) = = 0.00 m
BIFURCATION LOSSES IN PENSTOCKBifurcation Loss Coefficient 0.35(As per fig. 5 of IS11625 -1986)Bifurcation Loss (hbv = 0.35 * Vp
2/2g) = = 0.52 m
FRICTION LOSS IN BRANCH PENSTOCKSShape of branch penstock Circular Diameter of Branch Penstock = 1.75 mWetted Area (A) = = 2.41 m2
Wetted Perimeter (P) = = 5.50 mHydraulic radius (R=A/P ) = = 0.44 mDesign Discharge (Q) = 13.23 cumecsVelocity at penstock (VPS) = = 5.498 m/sRugosity coefficient (n) = 0.012(Considered for steel liner)Length of penstock (L) = 32 mFriction Loss (hft = vPS
2 n2 L / R4/3) = = 0.419 m
PENSTOCK BEND LOSSHorizontal BendNumber of Bends(n) = 1 (n=No. of bends)Angle of Bend = 45.000 degrees
Radius of Bend r = 3.000 (r/D=1.72, a=45o)Kb = 0.100hbt = 0.15 m (hbc = n Kb v2 / 2g)
As per Fig. 2 of IS2951 (Part II)-1965Bend Loss (hbend = 0.1 * vp
2/2g) = = 0.15 m
3.14*1.752.41/5.50
13.23/(2.41)
(5.498^2*0.012^2* 32)/(0.44^(4/3))
(3.14/4)*2.50^23.14*2.504.91/7.85
26.45/(4.91)
(5.388^2*0.012^2* 50)/(0.63^(4/3))
(3.14/4)*1.75^2

TRANSITION LOSS BEFORE MIV IN REDUCERDiameter of Reducer 1.5000 m
Area of penstock at the end of reducer = 1.767 m2
Velocity at start of reducer,Vr1 = 5.197 m/sVelocity at the end of reducerVr2 = 7.484 m/sTransition Loss Co-efficient (kt) = 0.1
As per Cl. 4.4.1.1 of IS4880 (Part III)-1976Loss (htr = 0.1 *( vr12/2g-vr22/2g) = = 0.148 m
Discharge through valve = 13.2 m3/s
Length of Pipe upto c/l of MIV = 5.0 mvalve dia = 1.5 m
Total Area = 1.8 m2
wetted perimeter = 4.7 mHydraulic radius = 0.4 mVelocity of Water = 7.5 m/s
Mannings Coefficient = 0.012Head loss in valve = 0.149 m
Shape of the TRT D-ShapeDiameter of TRT (DTRT) = 3.10 mWetted Area (ATRT) = A=0.905D2 = 8.70 m2
Wetted Perimeter (PTRT= 3.58D) = = 11.10 mHydraulic radius (RTRT=ATRT/PTRT) = = 0.78 mDesign Discharge (Q) = 13.23 cumecsVelocity (vTRT) = = 1.521 m/sRugosity coefficient (n) = 0.014(Considered for smooth concrete)Length of TRT (LTRT) = 50 m
Head Loss due to friction at HRT (hHRT)=v2 N2 L / R4/3) = = 0.031 m
Shape of the TRT D-ShapeDiameter of TRT (DTRT) = 3.60 mWetted Area (ATRT) = A=0.905D2 = 11.73 m2
Wetted Perimeter (PTRT= 3.58D) = = 12.89 mHydraulic radius (RTRT=ATRT/PTRT) = = 0.91 mDesign Discharge (Q) = 26.45 cumecsVelocity (vTRT) = = 2.255 m/sRugosity coefficient (n) = 0.014(Considered for smooth concrete)Length of TRT (LTRT) = 25 m
Head Loss due to friction at HRT (hHRT)=v2 N2 L / R4/3) = = 0.028 m
FRICTION LOSS IN TRT
(3.14/4)*1.5000^2
LOSS IN MIV IN POWER HOUSE

Shape of the TRT D-ShapeDiameter of TRT (DTRT) = 4.20 mWetted Area (ATRT) = A=0.905D2 = 15.96 m2
Wetted Perimeter (PTRT= 3.58D) = = 15.04 mHydraulic radius (RTRT=ATRT/PTRT) = = 1.06 mDesign Discharge (Q) = 39.68 cumecsVelocity (vTRT) = = 2.485 m/sRugosity coefficient (n) = 0.014(Considered for smooth concrete)Length of TRT (LTRT) = 25 m
Head Loss due to friction at HRT (hHRT)=v2 N2 L / R4/3) = = 0.028 m
Shape of the TRT D-ShapeDiameter of TRT (DTRT) = 5.00 mWetted Area (ATRT) = A=0.905D2 = 22.63 m2
Wetted Perimeter (PTRT= 3.58D) = = 17.90 mHydraulic radius (RTRT=ATRT/PTRT) = = 1.26 mDesign Discharge (Q) = 52.90 cumecsVelocity (vTRT) = = 2.338 m/sRugosity coefficient (n) = 0.014(Considered for smooth concrete)Length of TRT (LTRT) = 140 m
Head Loss due to friction at HRT (hHRT)=v2 N2 L / R4/3) = = 0.110 m
TRT BEND LOSSHorizontal BendNumber of Bends(n) = 1 (n=No. of bends)Angle of Bend = 45.000 degrees
Radius of Bend r = 10.000 (r/D=4, a=45o)Kb = 0.065hbt = 0.01 m (hbc = n Kb v2 / 2g)
As per Fig. 2 of IS2951 (Part II)-1965
Angle of Bend = 45.000 degrees
Radius of Bend r = 15.000 (r/D=4.4, a=45o)Kb = 0.070hbt = 0.00 m (hbc = n Kb v2 / 2g)
As per Fig. 2 of IS2951 (Part II)-1965
Bend Loss (hbend = 0.1 * vp2/2g) = = 0.01 m
Number of Junctions = 3Bifurcation Loss Coefficient = 0.35(As per fig. 5 of IS11625 -1986)Bifurcation Loss (hbv = 0.35 * Vp
2/2g) = = 2.70 m
Width of Gate = 3.10 mHeight of Gate = 3.10 m
Total Gate Area = = 9.61 m2
Design Discharge = 13.23 cumecVelocity (Vg) = = 1.376 m/sLoss coefficient at Gate = 0.10
As per Cl. 4.6 of IS4880 (Part III)-1976Gate Loss (hg = Kg * vg
2/2g) = = 0.010 m
Exit Velocity (V) = = 2.338 m/sExit Loss Coefficient = 1.0Exit Loss (he = 1 * V2/2g) = = 0.279 m
TOTAL LOSS, hL = 10 m
EXIT LOSS FROM TRT
JUNCTION LOSS IN TRT
3.10*3.10
13.23/9.61
GATE LOSS

1.92
1.58 1.58 1.58
1.27
1.5
2.0
2.5
INC
RE
ME
NT
AL
EN
ER
GY
(G
WH
)
FIG 7.1 INCREMENTAL ENERGY VS INSTALLED CAPACITY
DATA (JUNE1977-MAY 2009), 90% DEP. YEAR 1987-88 , 50% DEP. YEAR 1985-86
90% Dep Year
50% Dependable year
INSTALLED CAPACITY (168MW)
0.54 0.53 0.53 0.53
0.30
0.00 0.00 0.00 0.00 0.000.0
0.5
1.0
160 162 164 166 168 170 172 174 176 178 180 182 184 186 188 190 192
INC
RE
ME
NT
AL
EN
ER
GY
(G
WH
)
INSTALLED CAPACITY(MW)
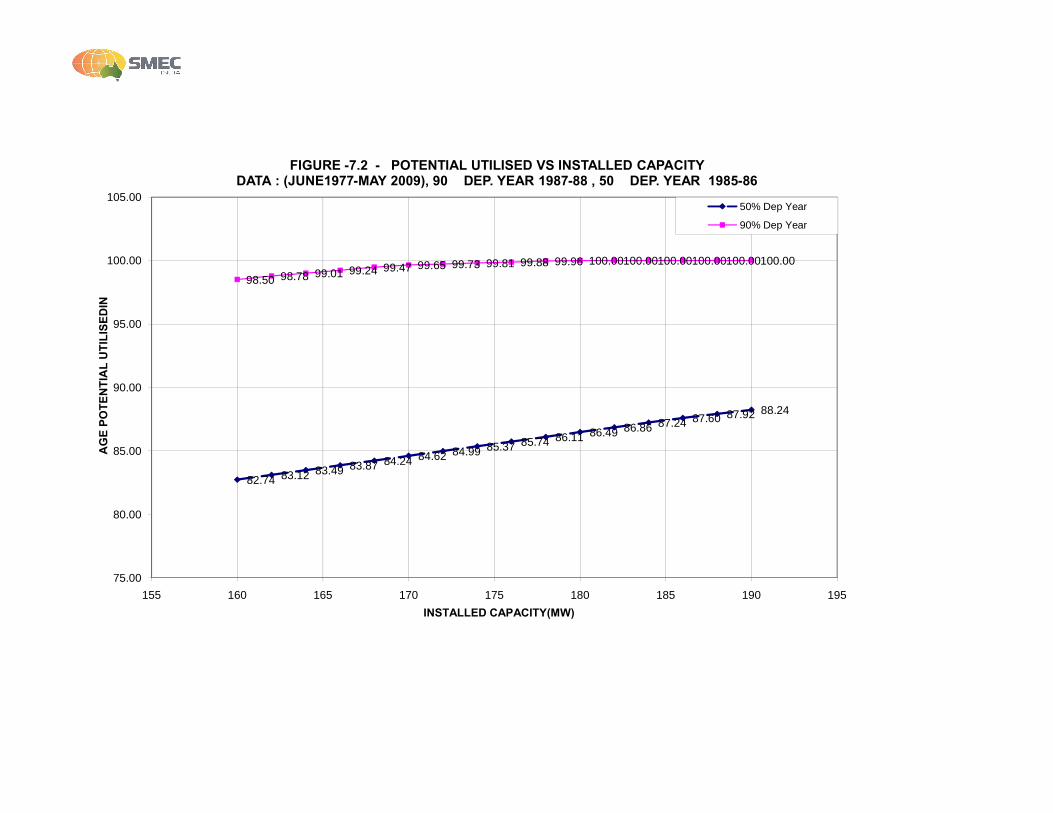
98.50 98.78 99.01 99.24 99.47 99.65 99.73 99.81 99.88 99.96 100.00100.00100.00100.00100.00100.00
95.00
100.00
105.00
% A
GE
PO
TE
NT
IAL
UT
ILIS
ED
IN
FIGURE -7.2 - POTENTIAL UTILISED VS INSTALLED CAPACITYDATA : (JUNE1977-MAY 2009), 90% DEP. YEAR 1987-88 , 50% DEP. YEAR 1985-86
50% Dep Year
90% Dep Year
82.74 83.12 83.49 83.87 84.24 84.62 84.99 85.37 85.74 86.11 86.49 86.86 87.24 87.60 87.92 88.24
75.00
80.00
85.00
90.00
155 160 165 170 175 180 185 190 195
% A
GE
PO
TE
NT
IAL
UT
ILIS
ED
IN
INSTALLED CAPACITY(MW)

48.0
53.553.0
52.652.2
51.851.5
51.150.7
50.450.0
49.749.4
49.148.7
48.448.148.0
50.0
52.0
54.0
56.0
PL
AN
T L
OA
D F
AC
TO
R
FIGURE -7.3 - PLANT LOAD FACTOR VS INSTALLED CAPACITYDATA : (JUNE1977-MAY 2009), 90% DEP. YEAR 1987-88 , 50% DEP. YEAR 1985-86
90% Dep Year
50% Dep Year
48.047.6
47.146.7
46.245.8
45.344.8
44.343.8
43.442.9
42.442.0
41.541.1
48.448.1
40.0
42.0
44.0
46.0
48.0
160 170 180 190
PL
AN
T L
OA
D F
AC
TO
R
INSTALLED CAPACITY(MW)
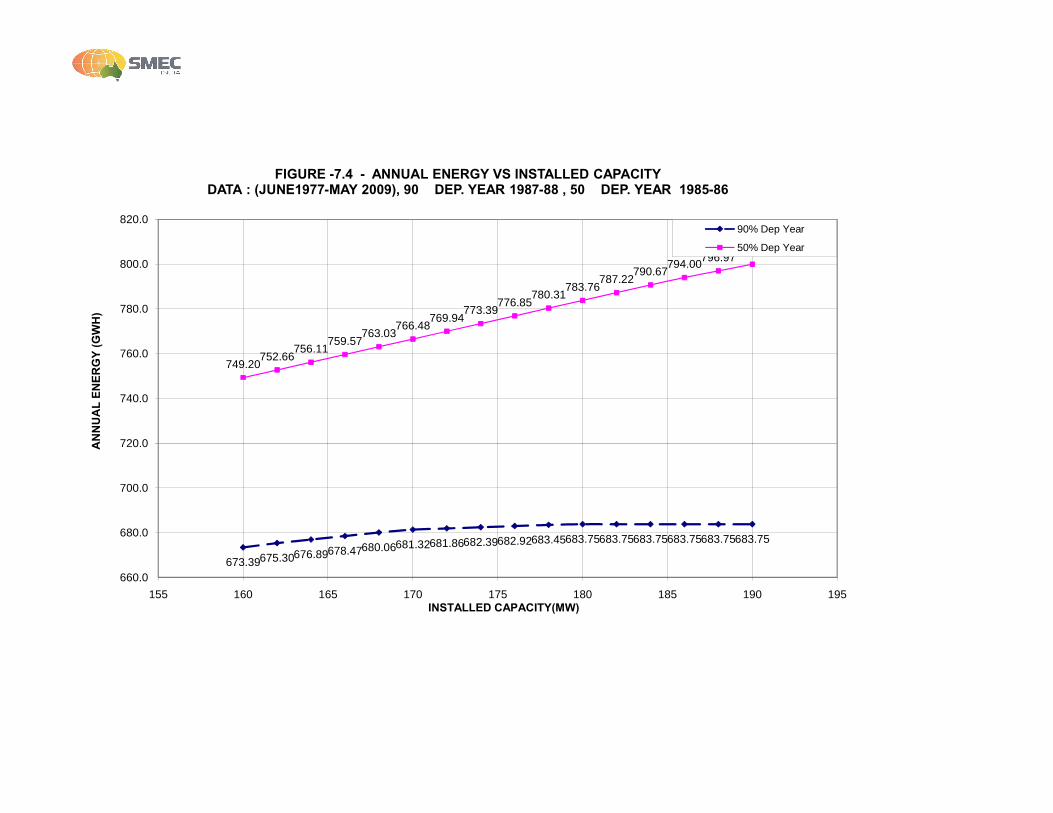
749.20752.66
756.11759.57
763.03766.48
769.94773.39
776.85780.31
783.76787.22
790.67794.00
796.97799.95
760.0
780.0
800.0
820.0
AN
NU
AL
EN
ER
GY
(G
WH
)
FIGURE -7.4 - ANNUAL ENERGY VS INSTALLED CAPACITYDATA : (JUNE1977-MAY 2009), 90% DEP. YEAR 1987-88 , 50% DEP. YEAR 1985-86
90% Dep Year
50% Dep Year
673.39675.30676.89678.47680.06681.32681.86682.39682.92683.45683.75683.75683.75683.75683.75683.75
660.0
680.0
700.0
720.0
740.0
155 160 165 170 175 180 185 190 195
AN
NU
AL
EN
ER
GY
(G
WH
)
INSTALLED CAPACITY(MW)

ATTACHMENTS

ATTACH A EXPERT APPRAISAL COMMITTEE,
MOEF APPROVAL OF TOR


ATTACH B PROJECT LAYOUT PLAN


SIRKARI BHYOL-RUPSIABAGAR HE PROJECT
(4X42MW)
LAYOUT OPTIMIZATION REPORT
For: UJVN Ltd
April 2014
Page i
TABLE OF CONTENTS
1.1 INTRODUCTION 1
1.2 LOCATION OF THE PROJECT 2
1.3 ACCESSIBILITY OF THE PROJECT 2
1.4 SITE VISIT 3
1.5 BRIEF BACKGROUND OF THE PROJECT 4
1.6 PRESENT STATUS OF THE PROJECT 7
1.7 CLIMATE OF THE PROJECT AREA 8
1.8 GEOGRAPHY OF THE PROJECT AREA 9
1.8.1 TOPOGRAPHY 9
1.8.2 PHYSIOGRAPHY 9
1.8.3 GEOMORPHOLOGY 11
1.8.4 REGIONAL GEOLOGY 13
1.8.5 STRUCTURES AND TECTONICS 16
1.8.6 SEISMICITY 18
1.9 GEOLOGICAL MAPPING 18
1.9.1 LITHOLOGY 19
1.9.2 STRUCTURE 22
1.9.3 HYDROGEOLOGY 23
1.9.4 GEOLOGY OF PROJECT COMPONENTS 24
1.10 SELECTION OF THE PROJECT LAYOUT 24
1.10.1 GEOLOGICAL ASSESSMENT 29
1.11 DESIGN CONSIDERATIONS FOR THE FINALISATION OF THE PROJECT LAYOUT 32
1.12 OPTIMISATION OF THE BARRAGE LOCATION 33
1.13 FINALISATION OF THE ALIGNMENT OF WATER CONDUCTOR SYSTEM 34
1.14 SURGE SHAFT AND POWERHOUSE LOCATION 36
1.15 DESCRIPTION OF THE COMPONENTS 38
1.15.1 RIVER DIVERSION SYSTEM 39
1.15.2 BARRAGE 40
1.15.3 INTAKE STRUCTURE 43
1.15.4 DESILTING BASIN 46
1.15.5 HEAD RACE TUNNEL 47
1.15.6 SURGE SHAFT 48
1.15.7 PRESSURE SHAFT 49
1.15.8 BUTTERFLY VALVE HOUSE 50
1.15.9 UNDERGROUND POWERHOUSE 51
1.15.10 TAIL RACE TUNNEL 52
1.16 LAND REQUIREMENT 53

Page ii
1.17 POPULATION AFFECTED BY PROJECT 53
1.18 ENVIRONMENTAL ASPECTS 53
1.19 INTER-STATE / INTERNATIONAL ASPECTS 53
1.20 DEFENCE ANGLE 54
1.21 COST & BENEFITS 54
1.22 CONSTRUCTION PROGRAMME 54

LAYOUT OPTIMISATION REPORT [SIRKARI BHYOL HYDRO-ELECTRIC PROJECT (4 x 42.0 MW)]
UJVN LIMITED (A Govt. of India Enterprise)
Page 1
LAYOUT OPTIMISATION REPORT
1.1 INTRODUCTION The Sirkari Bhyol - Rupsiabagar Hydroelectric Project located in Munsiyari tehsil of Pithoragarh district of Uttarakhand, envisages utilization of the waters of the river Goriganga, a tributary of river Kali (Sarda) for power generation on a run of river type development, harnessing a gross head of about 362.08 m. River Goriganga is a tributary of the Kali (also known as Mahakali/ Sarda in its lower reach) which joins the Ghaghara, a major river in its own right of the Ganga River System.
The Government of Uttarakhand proposes to develop the Sirkari Bhyol-Rupsiabagar Hydroelectric Project and has allocated the Project for Construction, Operation and Maintenance to UJVN Limited on Build, Own and Operate (BOO) basis. SMEC International Pty. Ltd. has been engaged by UJVN Limited to undertake the consultancy services including ''Preparation of Comprehensive and Bankable Detailed Project Report of this project.''
The Sirkari Bhyol - Rupsiabagar HE Project, a right bank development of the Goriganga river envisages harnessing the river potential between EL 2120.0 m and EL 1720.0 m and is third scheme from upstream in the series of these seven power schemes on Goriganga river. Following hydropower schemes have been identified on the Goriganga river:
S.No. Name of Scheme FRL
(m)
TWL
(m)
1. Mapang-Bogudiyar 2960.0 2440.0
2. Bogudiyar-Sirkari Bhyol 2440.0 2120.0
3. Sirkari Bhyol - Rupsiabagar 2120.0 1720.0
4. Rupsiabagar - Khasiyabara 1720.0 1237.0
5. Devi Bagar – Khartoli
(Goriganga III-A) 1237.0 976.0
6. Khartoli Lumti Talli 976.0 913.0
7. Goriganga Stage II 913.0 710.0
River Goriganga is a very steep river with bed slope of the order of 1 in 10. The substrata conditions, wherein bed rock is available at more than 30 m depth below river bed level, along with steep valley resulting in very low storage do not permit the construction of high diversion structure. The river hydraulics with supercritical flow in such steep river also do not permit the construction of a high diversion structure and there is no precedence of having such a diurnal storage structure in such steep river slopes. The
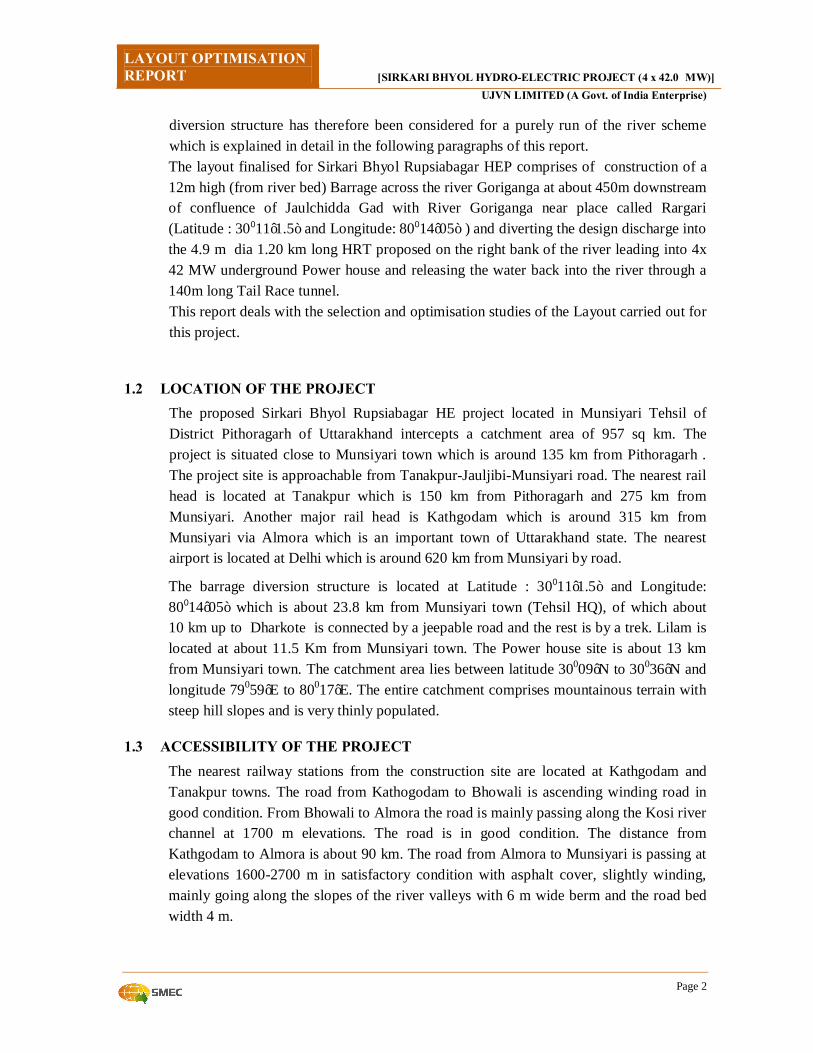
LAYOUT OPTIMISATION REPORT [SIRKARI BHYOL HYDRO-ELECTRIC PROJECT (4 x 42.0 MW)]
UJVN LIMITED (A Govt. of India Enterprise)
Page 2
diversion structure has therefore been considered for a purely run of the river scheme which is explained in detail in the following paragraphs of this report. The layout finalised for Sirkari Bhyol Rupsiabagar HEP comprises of construction of a 12m high (from river bed) Barrage across the river Goriganga at about 450m downstream of confluence of Jaulchidda Gad with River Goriganga near place called Rargari (Latitude : 30011’1.5” and Longitude: 80014’05” ) and diverting the design discharge into the 4.9 m dia 1.20 km long HRT proposed on the right bank of the river leading into 4x 42 MW underground Power house and releasing the water back into the river through a 140m long Tail Race tunnel. This report deals with the selection and optimisation studies of the Layout carried out for this project.
1.2 LOCATION OF THE PROJECT The proposed Sirkari Bhyol Rupsiabagar HE project located in Munsiyari Tehsil of District Pithoragarh of Uttarakhand intercepts a catchment area of 957 sq km. The project is situated close to Munsiyari town which is around 135 km from Pithoragarh . The project site is approachable from Tanakpur-Jauljibi-Munsiyari road. The nearest rail head is located at Tanakpur which is 150 km from Pithoragarh and 275 km from Munsiyari. Another major rail head is Kathgodam which is around 315 km from Munsiyari via Almora which is an important town of Uttarakhand state. The nearest airport is located at Delhi which is around 620 km from Munsiyari by road.
The barrage diversion structure is located at Latitude : 30011’1.5” and Longitude: 80014’05” which is about 23.8 km from Munsiyari town (Tehsil HQ), of which about 10 km up to Dharkote is connected by a jeepable road and the rest is by a trek. Lilam is located at about 11.5 Km from Munsiyari town. The Power house site is about 13 km from Munsiyari town. The catchment area lies between latitude 30009’N to 30036’N and longitude 79059’E to 80017’E. The entire catchment comprises mountainous terrain with steep hill slopes and is very thinly populated.
1.3 ACCESSIBILITY OF THE PROJECT The nearest railway stations from the construction site are located at Kathgodam and Tanakpur towns. The road from Kathogodam to Bhowali is ascending winding road in good condition. From Bhowali to Almora the road is mainly passing along the Kosi river channel at 1700 m elevations. The road is in good condition. The distance from Kathgodam to Almora is about 90 km. The road from Almora to Munsiyari is passing at elevations 1600-2700 m in satisfactory condition with asphalt cover, slightly winding, mainly going along the slopes of the river valleys with 6 m wide berm and the road bed width 4 m.

LAYOUT OPTIMISATION REPORT [SIRKARI BHYOL HYDRO-ELECTRIC PROJECT (4 x 42.0 MW)]
UJVN LIMITED (A Govt. of India Enterprise)
Page 3
To reach Munsiyari (Tehsil) from Pithoragarh district head quarters, two approaches are available i.e. Pithoragarh – Jauljibi – Madkot – Munsiyari route which is around 135 km from Pithoragarh and another route Pithoragarh – Thal- Tejam – Munsiyari which is around 125 km long. Distance of Munsiyari from Almora is around 225 Km. Power House and Barrage sites of the project can be accessed from Madkot-Munsiyari road by taking the available foot/mule track from Dharkote which runs upto the Milam glacier. The nearest locality in the project area is Lilam which is about 10 kms downstream of the Barrage site. The distance from Dharkote to Lilam is 1.5 km. Barrage site and powerhouse sites are further 5 km and 1 km upstream from Lilam respectively. There is a small PWD guest house at Lilam. It is understood from the sources that a permanent motorable road is under construction from Dhapa village upto the Milam glacier. The stretch from Dhapa village upto Bogudiyar is being constructed by M/s GVK Infra Limited and the stretch from Bogudiyar upto Milam Glacier is being constructed by Border Roads Organization (BRO).
1.4 SITE VISIT
Three reconnaissance visits to the project site have been undertaken by SMEC team so far. The details are as follows:
1. 1st Site Visit, July 12-14, 2006
2. 2nd Site Visit, May 11-15, 2007
3. 3rd Site Visit, Dec. 9-15, 2013 The main purpose of these visits for the team was to familiarize with the site conditions, access availability and to confirm the data and concept presented in the Preliminary Feasibility Report (PFR).The third site visit was undertaken primarily to review the suitability of the earlier proposed locations of the project components in view of the change in the topographical conditions of the project site after the devastating flood in Uttarakhand in June 2013. Traverses have been taken in and around the proposed location of project components and all the alternative locations of barrage were assessed in detail. Geo-mechanical data has also been recorded during the traverses along foot tracks and vicinity.
Sirkari Bhyol- Rupsiabagar HEP
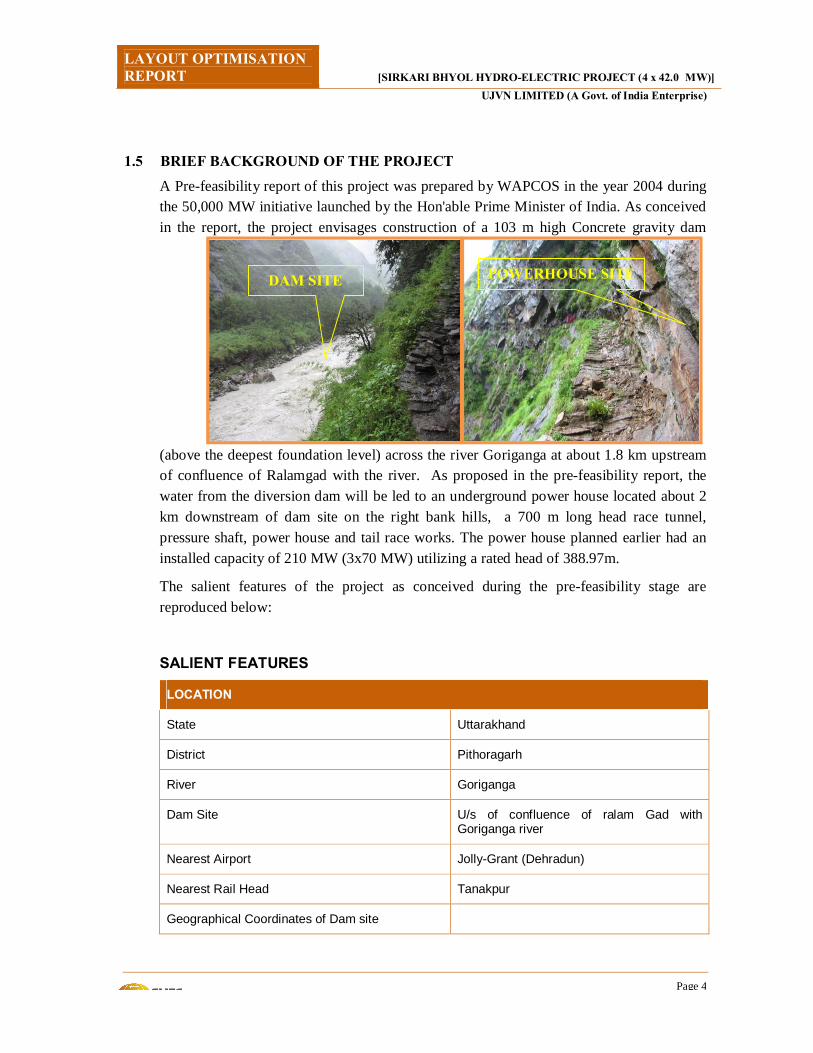
LAYOUT OPTIMISATION REPORT [SIRKARI BHYOL HYDRO-ELECTRIC PROJECT (4 x 42.0 MW)]
UJVN LIMITED (A Govt. of India Enterprise)
Page 4
1.5 BRIEF BACKGROUND OF THE PROJECT A Pre-feasibility report of this project was prepared by WAPCOS in the year 2004 during the 50,000 MW initiative launched by the Hon'able Prime Minister of India. As conceived in the report, the project envisages construction of a 103 m high Concrete gravity dam
(above the deepest foundation level) across the river Goriganga at about 1.8 km upstream of confluence of Ralamgad with the river. As proposed in the pre-feasibility report, the water from the diversion dam will be led to an underground power house located about 2 km downstream of dam site on the right bank hills, a 700 m long head race tunnel, pressure shaft, power house and tail race works. The power house planned earlier had an installed capacity of 210 MW (3x70 MW) utilizing a rated head of 388.97m.
The salient features of the project as conceived during the pre-feasibility stage are reproduced below:
SALIENT FEATURES
LOCATION
State Uttarakhand
District Pithoragarh
River Goriganga
Dam Site U/s of confluence of ralam Gad with Goriganga river
Nearest Airport Jolly-Grant (Dehradun)
Nearest Rail Head Tanakpur
Geographical Coordinates of Dam site
DAM SITE POWERHOUSE SITE
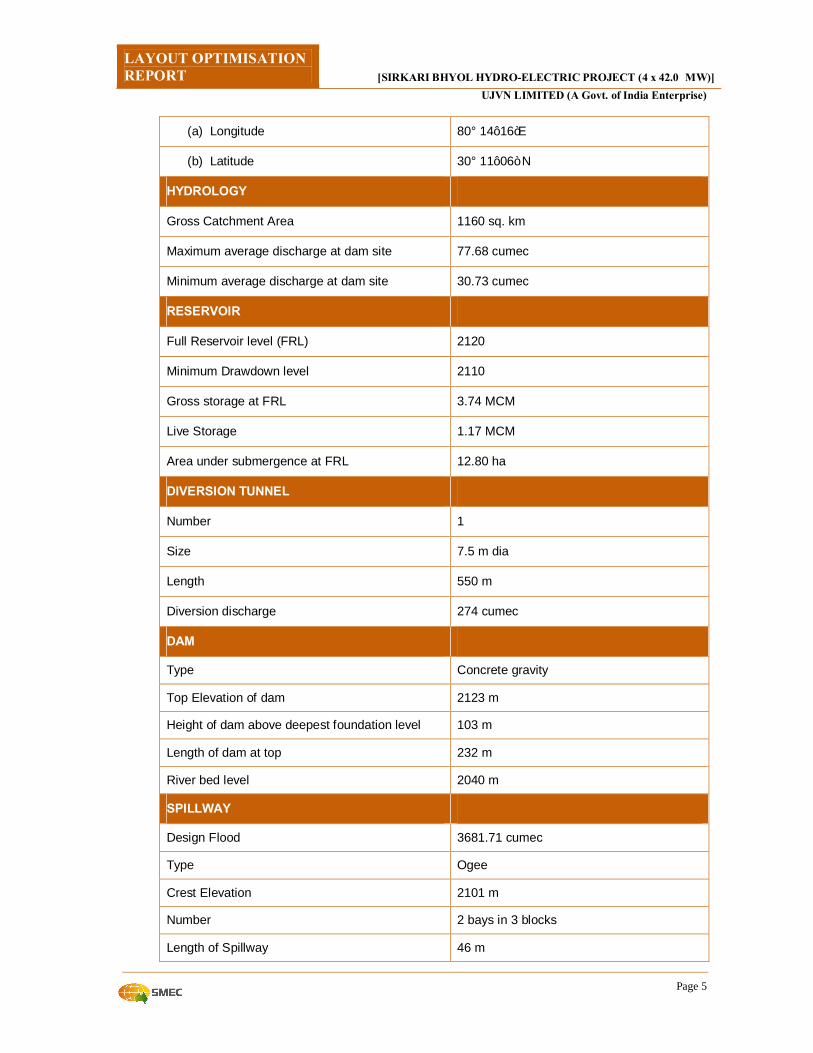
LAYOUT OPTIMISATION REPORT [SIRKARI BHYOL HYDRO-ELECTRIC PROJECT (4 x 42.0 MW)]
UJVN LIMITED (A Govt. of India Enterprise)
Page 5
(a) Longitude 80° 14’ 16”E
(b) Latitude 30° 11’ 06” N
HYDROLOGY
Gross Catchment Area 1160 sq. km
Maximum average discharge at dam site 77.68 cumec
Minimum average discharge at dam site 30.73 cumec
RESERVOIR
Full Reservoir level (FRL) 2120
Minimum Drawdown level 2110
Gross storage at FRL 3.74 MCM
Live Storage 1.17 MCM
Area under submergence at FRL 12.80 ha
DIVERSION TUNNEL
Number 1
Size 7.5 m dia
Length 550 m
Diversion discharge 274 cumec
DAM
Type Concrete gravity
Top Elevation of dam 2123 m
Height of dam above deepest foundation level 103 m
Length of dam at top 232 m
River bed level 2040 m
SPILLWAY
Design Flood 3681.71 cumec
Type Ogee
Crest Elevation 2101 m
Number 2 bays in 3 blocks
Length of Spillway 46 m
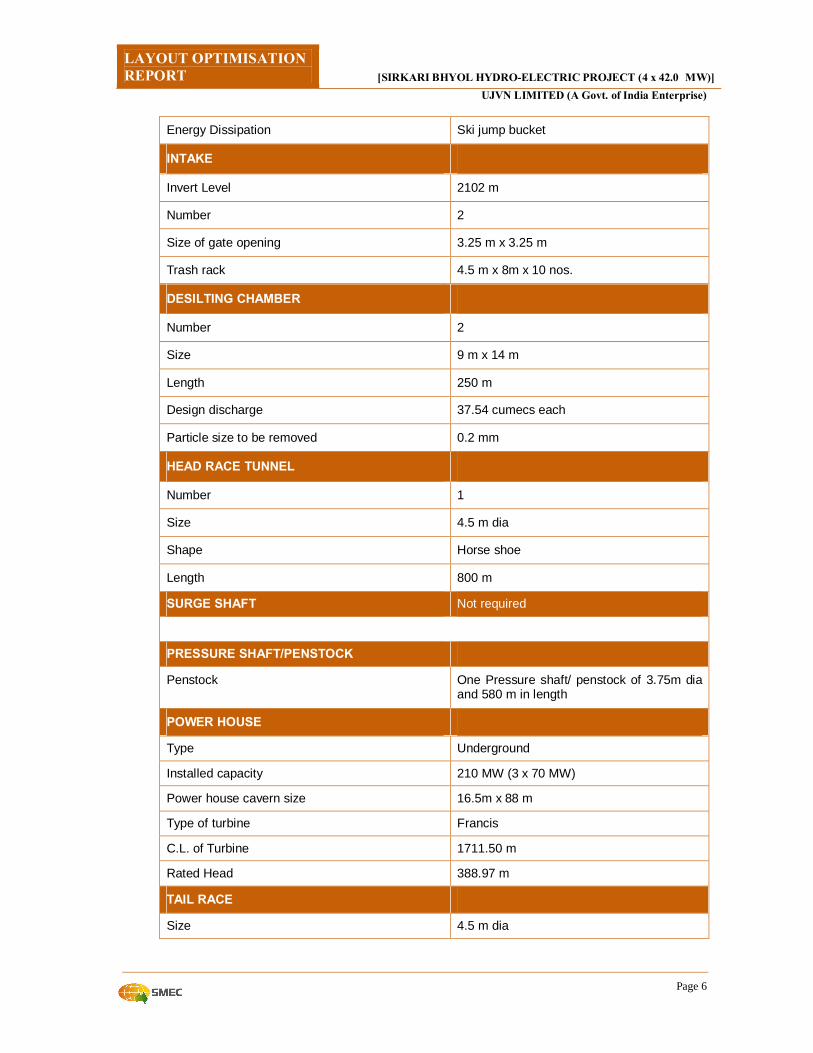
LAYOUT OPTIMISATION REPORT [SIRKARI BHYOL HYDRO-ELECTRIC PROJECT (4 x 42.0 MW)]
UJVN LIMITED (A Govt. of India Enterprise)
Page 6
Energy Dissipation Ski jump bucket
INTAKE
Invert Level 2102 m
Number 2
Size of gate opening 3.25 m x 3.25 m
Trash rack 4.5 m x 8m x 10 nos.
DESILTING CHAMBER
Number 2
Size 9 m x 14 m
Length 250 m
Design discharge 37.54 cumecs each
Particle size to be removed 0.2 mm
HEAD RACE TUNNEL
Number 1
Size 4.5 m dia
Shape Horse shoe
Length 800 m
SURGE SHAFT Not required
PRESSURE SHAFT/PENSTOCK
Penstock One Pressure shaft/ penstock of 3.75m dia and 580 m in length
POWER HOUSE
Type Underground
Installed capacity 210 MW (3 x 70 MW)
Power house cavern size 16.5m x 88 m
Type of turbine Francis
C.L. of Turbine 1711.50 m
Rated Head 388.97 m
TAIL RACE
Size 4.5 m dia

LAYOUT OPTIMISATION REPORT [SIRKARI BHYOL HYDRO-ELECTRIC PROJECT (4 x 42.0 MW)]
UJVN LIMITED (A Govt. of India Enterprise)
Page 7
Type Tunnel
Length 370 m
Design Discharge 60.06 cumec
River Bed level 1716 m
Normal TWL 1720 m
SWITCHYARD
Size GIS on the floor above the transformers in transformer cavern of 16m x 58m
COST ESTIMATE & FINANCIAL ASPECT (Rs. Crores)
Civil works Rs. 561.01 crores
Electro - mechanical works Rs. 191.55 crores
Sub total Rs. 752.56 crores
Interest during construction Rs. 141.07 crores
Total Rs. 893.63 crores
Transmission cost Rs. 6.00 crores
Grand Total Rs.899.63 crores
Tariff 1st year Rs. 1.55 per kwh
Levelised Tariff Rs. 1.25 per kwh
CONSTRUCTION PERIOD 5.75 years
1.6 PRESENT STATUS OF THE PROJECT UJVN Limited has carried out the Topographic Surveys in the Project area through Survey of India (SoI), Dehradun. This survey has further been verified through another company, ABM Engg. & Surveyors Limited-Gurgaon. Drilling and Drifting works as per the recommendations of UJVN Limited are currently in progress in the Project area by M/s Rawel Singh & Company, Ropar. Around 600m of core drilling have been completed so far
Details of the investigations which have been completed/ under progress as per the Pre-Feasibility Stage Layout are as follows
S. No.
Hole No.
Location Hole
Inclination
Ground Elevation
(m)
Drilled depth (m)
Bed Rock intercepted Depth (m)
Drilling Works
1 DH-1 Dam Site, centre Vertical --- 60.00 42.00

LAYOUT OPTIMISATION REPORT [SIRKARI BHYOL HYDRO-ELECTRIC PROJECT (4 x 42.0 MW)]
UJVN LIMITED (A Govt. of India Enterprise)
Page 8
of river Goriganga
2 DC-1 Desilting Chamber hill slope
Vertical 2140.90 99.60 12.00
3 PS-1 Pressure Shaft, hill slope
450 1961.00 150.50 0.00
4 PH-1 Power house, hill slope
Vertical 1925.00 188.10 9.00
5 TRT-1 Tailrace Tunnel, hill slope
Vertical 1828.79 103.00 0.00
6 HRT Headrace Tunnel, hill slope
Vertical --- 100.00 ---
Drifting Works (Under Progress)
1 PH-1 Acess tunnel at Power house
Horizontal 1728.458 111.50 ----
G&D site had been established on Goriganga river at Rargari near the PFR dam site which was washed away during the floods in June 2013. IMD Delhi has also been requested for site specific storm studies of the project area.
1.7 CLIMATE OF THE PROJECT AREA Uttarakhand can be grouped into three distinct geographical regions: the High mountain region, the Mid-mountain region and the Terai region. Uttarakhand lies on the south slope of the mighty Himalaya range, and the climate and vegetation vary greatly with elevation, from glaciers at the highest elevations to tropical forests at the lower elevations. At 7,817 m above sea level, Nanda Devi in the district of Chamoli is the highest point in the state. The highest elevations are covered by ice and bare rock. The Western Himalayan Alpine Shrub and Meadows eco-region lies between 3000-3500 and 5000 meters elevation; tundra and alpine meadows cover the highest elevations, transitioning to Rhododendron-dominated shrub lands below. The Western Himalayan sub-alpine conifer forests lie just below the tree line; at 3000-2600 meters elevation they transition to the Western Himalayan broadleaf forests, which lie in a belt from 2,600 to 1,500 meters elevation. Below 1500 meters elevation lies western end of the drier Terai-Duar savanna and grasslands belt, and the Upper Gangetic Plains moist deciduous forests. This belt is locally known as Bhabhar. These lowland forests have mostly been cleared for agriculture, but a few pockets remain. The temperature ranges between -2.70 C in Mukteshwar during winter to 41.50C in Dehradun during summer. The average rainfall is 1,397 mm. The state has two distinct climatic regions: the predominant hilly terrain and the small plain region. The climatic condition of the plains is very similar to
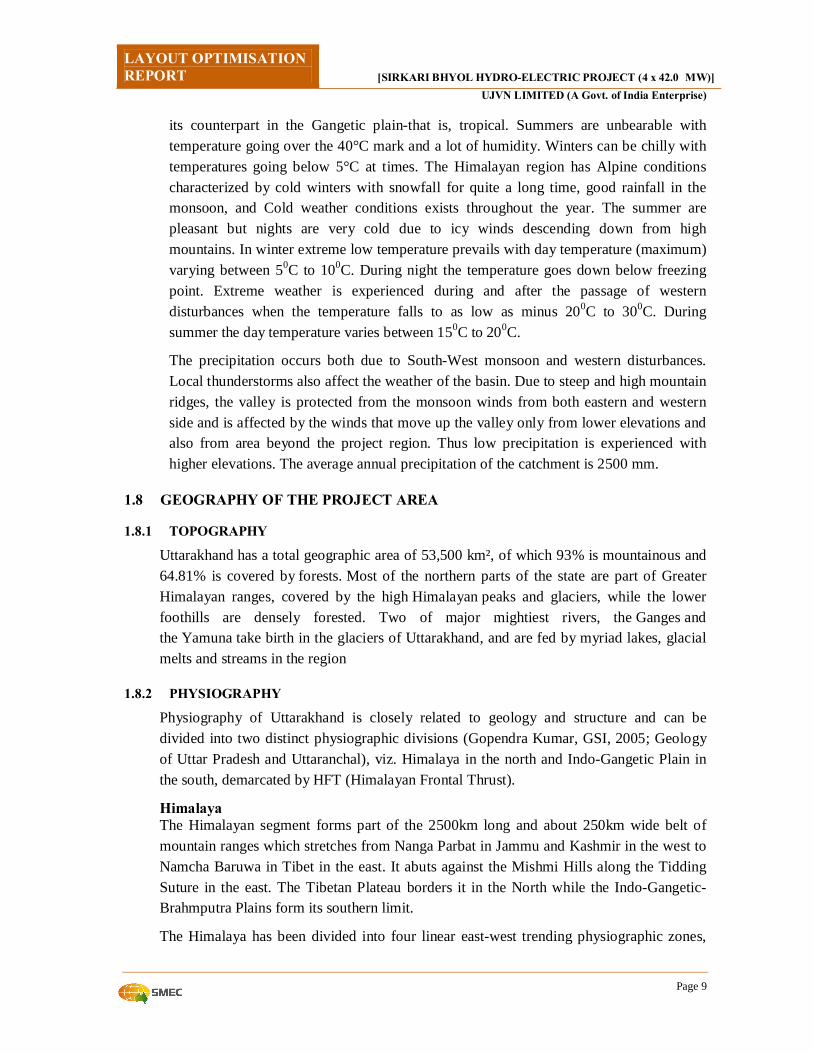
LAYOUT OPTIMISATION REPORT [SIRKARI BHYOL HYDRO-ELECTRIC PROJECT (4 x 42.0 MW)]
UJVN LIMITED (A Govt. of India Enterprise)
Page 9
its counterpart in the Gangetic plain-that is, tropical. Summers are unbearable with temperature going over the 40°C mark and a lot of humidity. Winters can be chilly with temperatures going below 5°C at times. The Himalayan region has Alpine conditions characterized by cold winters with snowfall for quite a long time, good rainfall in the monsoon, and Cold weather conditions exists throughout the year. The summer are pleasant but nights are very cold due to icy winds descending down from high mountains. In winter extreme low temperature prevails with day temperature (maximum) varying between 50C to 100C. During night the temperature goes down below freezing point. Extreme weather is experienced during and after the passage of western disturbances when the temperature falls to as low as minus 200C to 300C. During summer the day temperature varies between 150C to 200C.
The precipitation occurs both due to South-West monsoon and western disturbances. Local thunderstorms also affect the weather of the basin. Due to steep and high mountain ridges, the valley is protected from the monsoon winds from both eastern and western side and is affected by the winds that move up the valley only from lower elevations and also from area beyond the project region. Thus low precipitation is experienced with higher elevations. The average annual precipitation of the catchment is 2500 mm.
1.8 GEOGRAPHY OF THE PROJECT AREA
1.8.1 TOPOGRAPHY
Uttarakhand has a total geographic area of 53,500 km², of which 93% is mountainous and 64.81% is covered by forests. Most of the northern parts of the state are part of Greater Himalayan ranges, covered by the high Himalayan peaks and glaciers, while the lower foothills are densely forested. Two of major mightiest rivers, the Ganges and the Yamuna take birth in the glaciers of Uttarakhand, and are fed by myriad lakes, glacial melts and streams in the region
1.8.2 PHYSIOGRAPHY
Physiography of Uttarakhand is closely related to geology and structure and can be divided into two distinct physiographic divisions (Gopendra Kumar, GSI, 2005; Geology of Uttar Pradesh and Uttaranchal), viz. Himalaya in the north and Indo-Gangetic Plain in the south, demarcated by HFT (Himalayan Frontal Thrust).
Himalaya The Himalayan segment forms part of the 2500km long and about 250km wide belt of mountain ranges which stretches from Nanga Parbat in Jammu and Kashmir in the west to Namcha Baruwa in Tibet in the east. It abuts against the Mishmi Hills along the Tidding Suture in the east. The Tibetan Plateau borders it in the North while the Indo-Gangetic-Brahmputra Plains form its southern limit.
The Himalaya has been divided into four linear east-west trending physiographic zones,

LAYOUT OPTIMISATION REPORT [SIRKARI BHYOL HYDRO-ELECTRIC PROJECT (4 x 42.0 MW)]
UJVN LIMITED (A Govt. of India Enterprise)
Page 10
viz. the Outer or Sub-Himalaya, Lesser Himalaya, The Great Himalaya, and the Tethys (Tibetan) Himalaya.
Sub-Himalaya is the southernmost geomorphic zone comprising chiefly of Cenozoic sediments- the Siwalik Supergroup, and is also called as Siwalik Range. It rises abruptly against the Indo-Gangetic Plain along the Foot Hill Fault / Thrust (FHF) and is tectonically limited by Lesser Himalaya along MBT in North and attains heights up to 1200m. The Dehra Dun Valley which is hosts synclinal intermontane basin the Duns, for the deposition of Quaternary sediments located in Siwaliks and is one of the largest duns, extending from Kalsi in the west to Ganga valley in the east.
Lesser Himalaya is a broad zone that lies between the Sub-Himalaya in the south and the Great Himalaya in the north, and comprises mainly of thick Proterozoic sequences, excepting a narrow zone of early Cambrian succession along its southern part close to the Sub-Himalayan zone. This attains heights between 1200m to 3000m. The MBT and MCT define its southern and northern limits.
The Great Himalaya is a narrow zone that lies between the Lesser Himalaya in the south and the Tethys Himalaya in the North. It is chiefly made up of Archean - Palaeoproterozoic sequences constituting the Central Crystalline and Mesoproterozoic – the Dar Formation, which forms the basement for the Phanerozoic succession of the Tethys Himalaya. This is limited by MCT in south while in the north, it imperceptibly passes into the Tethys Himalaya, though at places a tectonic plane. The main relief varies between 4800m to 6000m. This zone is characterized by highly rugged topography with snow bound high peaks. It hosts a number of glaciers and remains snow bound.
Tethys Himalaya is the northernmost subdivision of the Himalaya that imperceptibly passes from the Great Himalaya that lies to its south. The ITSZ (Indo-Tsangpo Suture Zone) separates it from the Trans-Himalayan zone in the north. It is chiefly made up of Phanerozoic rocks and is characterized by anticlinal ridges and synclinal valleys. It attains heights of 3500m to 4800m.
Indo-Gangetic Plain Indo-Gangetic plain is the largest alluvial plain in the world occupying an area of 700,000 km2, of which about 223,000 km2 lies in Uttar Pradesh, Bihar and West Bengal and rest of it in Uttarakhand, and is referred to as the Ganga Plain. The plain forms a featureless undulatory surface with an average gradient of about 34cm/km towards southeast. It lies between the Himalaya in the north and the peninsular upland in the south. In Uttar Pradesh, it is limited by the Yamuna river in the west and continues eastwards through Bihar to west Bengal. This is very limited in Uttarakhand and is found towards the southern end of the state.
Morpho-stratigraphically, there are two units or surfaces, viz. and older upland or interfluves area free from floods-the Bangar, and younger lowland-the Khadar, a flood prone area. Latter is also known as the flood plain defined by palaeo banks of the River.
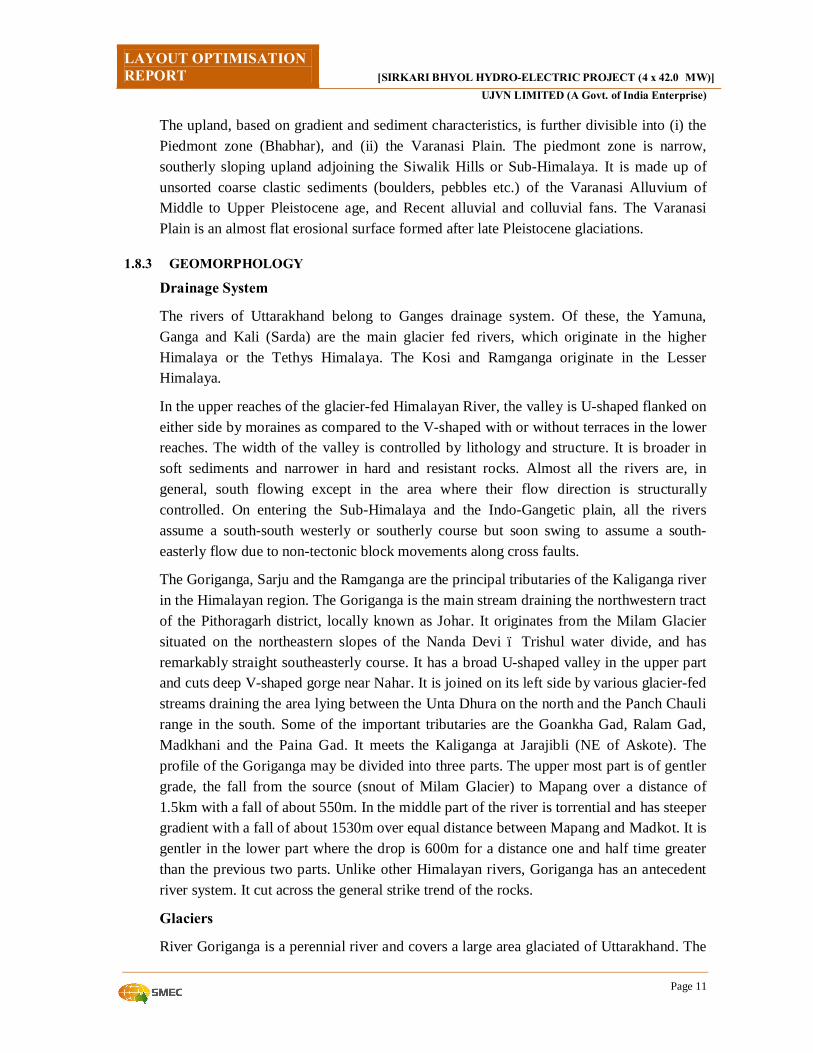
LAYOUT OPTIMISATION REPORT [SIRKARI BHYOL HYDRO-ELECTRIC PROJECT (4 x 42.0 MW)]
UJVN LIMITED (A Govt. of India Enterprise)
Page 11
The upland, based on gradient and sediment characteristics, is further divisible into (i) the Piedmont zone (Bhabhar), and (ii) the Varanasi Plain. The piedmont zone is narrow, southerly sloping upland adjoining the Siwalik Hills or Sub-Himalaya. It is made up of unsorted coarse clastic sediments (boulders, pebbles etc.) of the Varanasi Alluvium of Middle to Upper Pleistocene age, and Recent alluvial and colluvial fans. The Varanasi Plain is an almost flat erosional surface formed after late Pleistocene glaciations.
1.8.3 GEOMORPHOLOGY
Drainage System
The rivers of Uttarakhand belong to Ganges drainage system. Of these, the Yamuna, Ganga and Kali (Sarda) are the main glacier fed rivers, which originate in the higher Himalaya or the Tethys Himalaya. The Kosi and Ramganga originate in the Lesser Himalaya.
In the upper reaches of the glacier-fed Himalayan River, the valley is U-shaped flanked on either side by moraines as compared to the V-shaped with or without terraces in the lower reaches. The width of the valley is controlled by lithology and structure. It is broader in soft sediments and narrower in hard and resistant rocks. Almost all the rivers are, in general, south flowing except in the area where their flow direction is structurally controlled. On entering the Sub-Himalaya and the Indo-Gangetic plain, all the rivers assume a south-south westerly or southerly course but soon swing to assume a south-easterly flow due to non-tectonic block movements along cross faults.
The Goriganga, Sarju and the Ramganga are the principal tributaries of the Kaliganga river in the Himalayan region. The Goriganga is the main stream draining the northwestern tract of the Pithoragarh district, locally known as Johar. It originates from the Milam Glacier situated on the northeastern slopes of the Nanda Devi – Trishul water divide, and has remarkably straight southeasterly course. It has a broad U-shaped valley in the upper part and cuts deep V-shaped gorge near Nahar. It is joined on its left side by various glacier-fed streams draining the area lying between the Unta Dhura on the north and the Panch Chauli range in the south. Some of the important tributaries are the Goankha Gad, Ralam Gad, Madkhani and the Paina Gad. It meets the Kaliganga at Jarajibli (NE of Askote). The profile of the Goriganga may be divided into three parts. The upper most part is of gentler grade, the fall from the source (snout of Milam Glacier) to Mapang over a distance of 1.5km with a fall of about 550m. In the middle part of the river is torrential and has steeper gradient with a fall of about 1530m over equal distance between Mapang and Madkot. It is gentler in the lower part where the drop is 600m for a distance one and half time greater than the previous two parts. Unlike other Himalayan rivers, Goriganga has an antecedent river system. It cut across the general strike trend of the rocks.
Glaciers
River Goriganga is a perennial river and covers a large area glaciated of Uttarakhand. The
LAYOUT OPTIMISATION REPORT [SIRKARI BHYOL HYDRO-ELECTRIC PROJECT (4 x 42.0 MW)]
UJVN LIMITED (A Govt. of India Enterprise)
Page 12
Milam glacier, from which the Goriganga originates, is famous for its scenic beauty and is a tourist hub. The glacier got his name from the nearby village Milam (3km from south of Milam glacier) at an altitude of 3872m. The Milam glacier originates in the region of Hardeol and Trisuli peaks. It is about 16km long and has a south easterly course (Gopendra Kumar, GSI, 2005; Geology of Uttar Pradesh and Uttaranchal). It had eight tributary glaciers at right angles to the main glacier; all of them have now receded. Of these, the five glaciers, viz. the Pachhmi, Bamchu, Mangraon, Dhulan, Suraj Kund and an unnamed glacier, brought the major share of ice from the eastern slopes of the Nanda Devi-Hardeo-Trishuli ridge. The other three originate from the western slope of the Nanda Gond ridge – the water divide between the Goriganga and the Gaoankha Gad valleys. The Trishuli-Nanda Gond ridge serves as the main accumulation area for the Milam Glacier. It has well developed lateral moraines at two levels and has only one step west of Iklualari camping ground. The studies carried out show that the Milam glacier had retreated 618m between 1906 and 1957 (at the rate 12m/year), 157m between 1957 and 1963 (at the rate of 22m/year) and 23m in nine months, between September 1963 and June 1964 (at the rate of 30m/year).
Lakes
All rivers along with its tributaries and other rivulets in the project catchment area originate from glaciers only. Some of these glaciers are receding. The Milam glacier, from which the Goriganga originates, had been receding on an average @12.5m a year between 1849 and 1954 according to one study. A glacial lake is generally formed in the area glacial retract and the moraines bounded by ice which holds the lake water. Under adverse hot climatic conditions or of its own hydraulic pressure such lakes may breach resulting in floods along with huge debris material. Fortunately, all such lakes in this basin are reported to be safe.
Sangas Kund and Suraj Kund are the two lakes that were formed in depressions on the lee side of the lateral moraine of the Milam glacier by a talus fan of a small stream. The lake is partly fed by this stream. The Gangpani Lake, north of Unta Dhura is an example of synclinal valley lake in Tethys Himalayan zone. It is located in the trough of the Bamlas syncline.
Hot Springs
There are numerous hot springs in Uttarakhand. Most of them are aligned along the Main Central Thrust and other major thrusts. Some springs has also been reported in the lower reaches of the Goriganga valley. One hot spring has been identified within the project area, 180m downstream of the PFR dam axis on right bank and it is suggested to monitor its temperature. Its location will be marked on the layout during the course of the geological mapping to know if it encounters the excavation of HRT .

LAYOUT OPTIMISATION REPORT [SIRKARI BHYOL HYDRO-ELECTRIC PROJECT (4 x 42.0 MW)]
UJVN LIMITED (A Govt. of India Enterprise)
Page 13
1.8.4 REGIONAL GEOLOGY
The Himalayan region which lies to the north of the Indo-Gangetic Plain, have been divided into four different zones from north to south, viz. Tethys Himalaya, Higher Himalaya, Lesser Himalaya and Sub-Himalaya (Gopendra Kumar, GSI, 2005; Geology of Uttar Pradesh and Uttaranchal). The Tethys Himalayan zone belongs to sedimentary rock sequence of Phanerozoic age and has an unconformable and partly tectonic contact with Higher Himalayan Zone. Higher Himalayas are mostly crystalline rocks (high grade metamorphic rocks) and have been designated as Central crystalline, and belongs to Archean age. These are limited tectonically towards south by MCT (Main central thrust) which demarcates the boundary with Lesser Himalaya. Lesser Himalayan zone is considered to range in age from Precambrian to Late Paleozoic (Heim and Gansser, 1939; Gansser, 1964). These comprise mostly low to medium grade metamorphic rocks.
Central Crystalline
The project falls in the Archean of the Himalaya, made up of regionally metamorphosed high grade metasediments, migmatites with Palaeoproterozoic intrusive granite gneisses and younger granites. These metasediments underlying the Haimanta were grouped under the Vaikrita System by Greisbach (1891). Heim and Gansser (1939) later referred to this sequence as the Central Crystalline zone and assigned to Archean forming the oldest basement. They named the tectonic contact with the Garhwal Group in the south as MCT. In Goriganga valley, these are overlain by Tethys Himalayan sequence belonging to Martoli Group, the contact being occupied by the granites. While in Girthi valley, at Malari, it is completely cut off by the Dar-Martoli Fault.
The Central Crystalline Group is exposed in a linear zone continuously from the Yamuna valley in the west to the Kali valley in the east and beyond in the Nepal Himalaya. It possibly forms the oldest crystalline basement of the Himalaya. Although, it has witnessed different Precambrian orogenies prior to the strong Himalayan orogeny, much of the original character is preserved. The gneisses, migmatites, crystalline schist, thick quartzite with a conspicuous horizon of calc-sillicates with psammitic gneisses in the upper part form bulk of the metasediments which may be compared with Bundelkhand Gneissic Complex (BGC). Regionally, the Central Crystalline rocks have been classified into five formations, viz. Ragsi, Bhimgora Quartzite, Numsiari (Joshimath), Pandukeshwar and Badrinath. The generalized litho-stratigraphy in Alaknanda valley is given in Table.1.
Table.1: Litho-stratigraphy of Central Crytallines in Alaknanda Valley (Gopendra Kumar, GSI, 2005; Geology of Uttar Pradesh and Uttaranchal).
Age Group Formation Lithology Metamorphic Grade
Neoproterozoic Martoli Group
Rilkot Kyanite, sillimanite, staurolite, biotite schist, banded cal-silicates

LAYOUT OPTIMISATION REPORT [SIRKARI BHYOL HYDRO-ELECTRIC PROJECT (4 x 42.0 MW)]
UJVN LIMITED (A Govt. of India Enterprise)
Page 14
Unconformity
Archean Central Crystalline
Badrinath
Garnet, sillimanite, muscovite and kyanite bearing gneiss, mica schist, migmatites, calc-silicates, leucogranite, pegmatite and garnet amphibolite
Sillimanite zone
Pandukeshwar
Banded quartzite gneiss and interbedded quartz mica schist, para-amphibolite
Kyanite zone
Munsiari (Joshimath)
Garnet mica gneiss, staurolite and kyanite gneisses, two-mica gneiss, garnet amphibolite
Kyanite and staurolite zone
Bhimgora Quartzite
White quartzite with gneiss and schist
Ragsi Mica schist, gneiss, para amphibolite
Kyanite zone
Main Central Thrust (MCT) Palaeoproterozoic
Garhwal Group
Lesser Himalaya
Ragsi Formation
It is the oldest litho-unit of the Central Crystalline Group named after a prominent peak SW of Tungnath (Between Alaknanda and Mandakini valleys) and described as the Ragsi Schist and Gneiss Member of the Tungnath Formation by Gopendra Kumar and Agarwal (1975). It consists of crumbling green to silvery white kyanite-paragonite + muscovite schist and gneisses well exposed 1.5 km NNE of Kalsir in the Nagol Gad. It is profusely intruded by tourmaline granite around Ragsi. In the Pindar, Ramganga, Goriganga and the Kali valleys, the Ragsi Formation along with the overlying Bhimgora Quartzite is cut off by MCT. Here, the Joshimath Formation comes in contact with the Garhwal Group along MCT (Munsiari Thrust, Valdiya, 1980a).
Bhimgora Quartzite Formation
It occurs as a conspicuous horizon conformable underlying the Joshimath Formation. It is traceable from Bhimgora in the Nagol Gad to north of Helang in the Alaknanda valley and outcrops again near Tapoban in Dhauliganga section, upstream of Joshimath. It is white in colour and is made up of recrsytallized mosaic of fine grained quartz with flakes of

LAYOUT OPTIMISATION REPORT [SIRKARI BHYOL HYDRO-ELECTRIC PROJECT (4 x 42.0 MW)]
UJVN LIMITED (A Govt. of India Enterprise)
Page 15
sericite. It contains abundant sub-rounded zircon, sphene and iron ore. In the Ramganga and the Goriganga valleys, the Ragsi Formation and Bhimgora quartzite Formations are not exposed and get eliminated along MCT. Here the overlying Joshimath Formation comes in direct contact with Garhwal Group along MCT.
Munsiari (Joshimath) Formation
The Joshimath formation conformably overlies the Bhimgora Quartzite in the south and is overlain by the Pandukeshwar Formation in the north. Valdiya (1980a), however, considered the latter contact to be a tectonic plane referred to as the Vaikrita Thrust. It is well exposed from south of Joshimath to south of Pandukeshwar. It corresponds to Munsiari Formation against the Garhwal Group along the MCT in the south. It comprises regionally metamorphosed banded psammitic and pelitic sediments represented by inter-bedded sequence of garnet mica schist, staurolite-kyanite schist, sericite quartzite, quartz porphyry, amphibolites and associated coarse grained biotite augen gneiss. In the Senar gad section (Goriganga valley); the banded para-gneiss contains relicts of conglomerate containing pebble to boulder-size clasts of quartzite.
Pandukeshwar Formation
It was named by Agarwal and Mukhopadhyay (1983) after the township of that name in the Alaknanda valley, north of Joshimath from where it was first mapped by Heim and Gansser (1939) as the psammitic series of Alaknanda at Pandukeshwar. It consists of regularly bedded quartzites/banded quartzitic gneisses in which sedimentary structures such as current bedding are preserved. Inter-bedded with quartzitic gneisses is garnet biotite schist. These rocks are also mapped in the Dhauliganga at Suraithota and in Goriganga valley at Rupsia Bagar and North of Dhuniganag between Pilthi Gad and Ralam Gad where current bedding and convolute bedding are also seen. The rocks of Project area is located in the Pandukeshwar Formations.
Badrinath Formation
It is the youngest formation of the Central Crystalline group, well exposed between Hanuman Chatti and Badrinath in the Alaknanda valley. It consists of garnet, sillimanite, muscovite and kyanite bearing gneiss, mica schist, migmatites, calc-silicates, and garnet amphibolites intruded by leucogranite and pegmatite. In Dhauliganga, the Badrinath Formation is well exposed around Kosa. Calc-silicates are seen north of Pongti Gad and to about 1.6km east of Kosa where they are associated with quartzitic gneisses. Granular calc-silicate rocks are also reported in Goriganga and the present Ralam Gad between Besani and Sarpu.
Martoli Group
The Martoli Group is a siliciclastic succession which shows its maximum development in the Goriganga section between Rilkot and Samgong where it is more than 4543m thick. It is intruded by tourmaline leucogranite, aplite and pegmatite. The lower limit of the
LAYOUT OPTIMISATION REPORT [SIRKARI BHYOL HYDRO-ELECTRIC PROJECT (4 x 42.0 MW)]
UJVN LIMITED (A Govt. of India Enterprise)
Page 16
sequence is considered a fault, viz. Dar Martoli fault, separating it from the Central Crystalline. These have been divided into three segments and are discussed separately in succeeding paragraphs.
Rilkot (Dar) Formation
It is the basal formation of Martoli Group in the Gori valley and is exposed between Lapsa Gad and north of Rilkot resting over the Central Crystalline, the contact being occupied by the granites. It is overlain by Bilju Formation. It is 677m thick in Goriganga valley section. Tongues and apophyses of granite and aplites are quite common in the basal part. In the Girthi valley, at Malari, it is completely cut off by the Dar Martoli fault.
Bilju Formation
It comprises of dark grey to carbonaceous, grey to greenish phyllite with arenite bands, and quartzite, well exposed around Bilju in the Goriganga valley. The carbonaceous phyllite is seen 0.4km NW of Buria in the Ralam Gad, and 0.5km NW of Sumdo in the Goriganga valley.
Milam Formation
It is 2490m thick topmost formation of the group, well exposed in the Bilju-Samgong section along the Goriganga valley. It is unconformably overlain by the Ralam Formation. The basal beds comprising laminated phyllite-quartzite are best exposed in Ralam Gad close to snout of the Shunkalpa glacier.
The project is located in two major formations of Central Crystalline, viz. Pandukeshwar Formation which occupies an area between Pilthi Gad and Ralam Gad, i.e. at Rupsiyabagar and north of Dhunigang; and Badrinath Formation in the upstream reaches of the project area comprising granular cal-silicate rocks at the present Ralam Gad between Besani and Sarpu.
1.8.5 STRUCTURES AND TECTONICS
The Himalayas in Uttarakhand have been divided into two linear WNW-ESE trending tectonic belts, viz. Main Himalayan Belt (MHB) and Frontal Folded belt (FFB), separated by Muree Thrust (MBF-1). The former belt, comprising formations ranging in age from Archean to early middle Paleogene, has a complex geotectonic evolution as compared to FFB. The FFB is made up of late middle Paleogene to early Pleistocene successions constituting the Muree and Siwaliks Groups.
MHB comprising all the sequences, has been subjected to different orogenic movements, and therefore, has complicated structures. It forms its southern boundary with FFB. The belt is further sub-divided into two broad zones, I and II separated by major tectonic lineament, viz. MCT. The former includes the Tethys and Higher Himalaya and the latter include the Lesser Himalaya. These two zones are more conspicuous in Kumaon and in the easterly areas. In the central sector, in parts of Kumaon and adjoining parts of Nepal,

LAYOUT OPTIMISATION REPORT [SIRKARI BHYOL HYDRO-ELECTRIC PROJECT (4 x 42.0 MW)]
UJVN LIMITED (A Govt. of India Enterprise)
Page 17
there are two major tectonic planes, the Dar Martoli Fault in Zone I and the North Almora Thrust (NAT) in Zone II, which further sub-divide them into two sub-zones.
FFB is limited in north by MHB via Muree Thrust and by Foot Hill Fault (MBF-3) in the south. The structure of this belt is generally simple to the MHB and has been subjected to the last phase of the tectonic deformation related to the Himalayan orogeny.
These two blocks have a number of tectonic lineaments. MCT and Dar Martoli Fault are the two major tectonic features which are close to the project site.
Main Central Thrust
Main central Thrust (MCT) is a major tectonic feature in the MHB. This separates High Himalayan zone from the Lesser Himalayan zone. It is steep north dipping major tectonic plane in Kumaon that defines the northern tectonic limit of sedimentation of the Garhwal Group with the Central Crystalline. It marks the position of the MCT north of Dharchula in the Kaliganga, north of Munsiyari in the Goriganga, north of Loharkhet in the Sarju valley and traced to Helang in the Alaknanda Valley. It is a reverse fault with 200-250 northerly dips. Near the contact, the rocks of both the units are highly sheared, crushed, pulverized, recrystallised and mylonised. Truncation of lithounits and consequent reduction in thickness of Berinag Quartzite is also notice near Madkot and beyond.
MCT lies approximately 12km south of the project site. Vaikrita thrust
A tectonic plane is marked near Lilam along which the high grade crystalline rock (Baugdiyar Formation by J.S. Jamwal & A. K. Kacker./Pandukeshwar Formation by Gopendra Kumar) have been thrust upon the low grade crystalline rocks (Munsiari Formation) which is known as the Vaikrita thrust (Valdiya 1973). It separates the Munsiari Formation from the Baugdiyar/Pandukeshwar Formation. The thrust plane is evidenced by sudden break in the grade of metamorphism, sudden change in the lithology severe folding near the contact, fracturing of thin band of white quartzite and its elimination, occurrence of basic body along the contact and presence of hot spring in the vicinity.
Dar Martoli Fault
It is a major plane of dislocation mapped in the Kali valley at Dar separating the Dar Formation from the central crystalline. It was traced to south of Martoli, and named accordingly. It is traceable to the Dhauliganga valley at Matoli where it is off-set by Matoli Fault.
Dar Martoli Fault is located about 5-6km towards the NE of the project site. It shows shearing, crushing and occurrence of igneous body at the contact and is well exposed near Lapsa Gad.
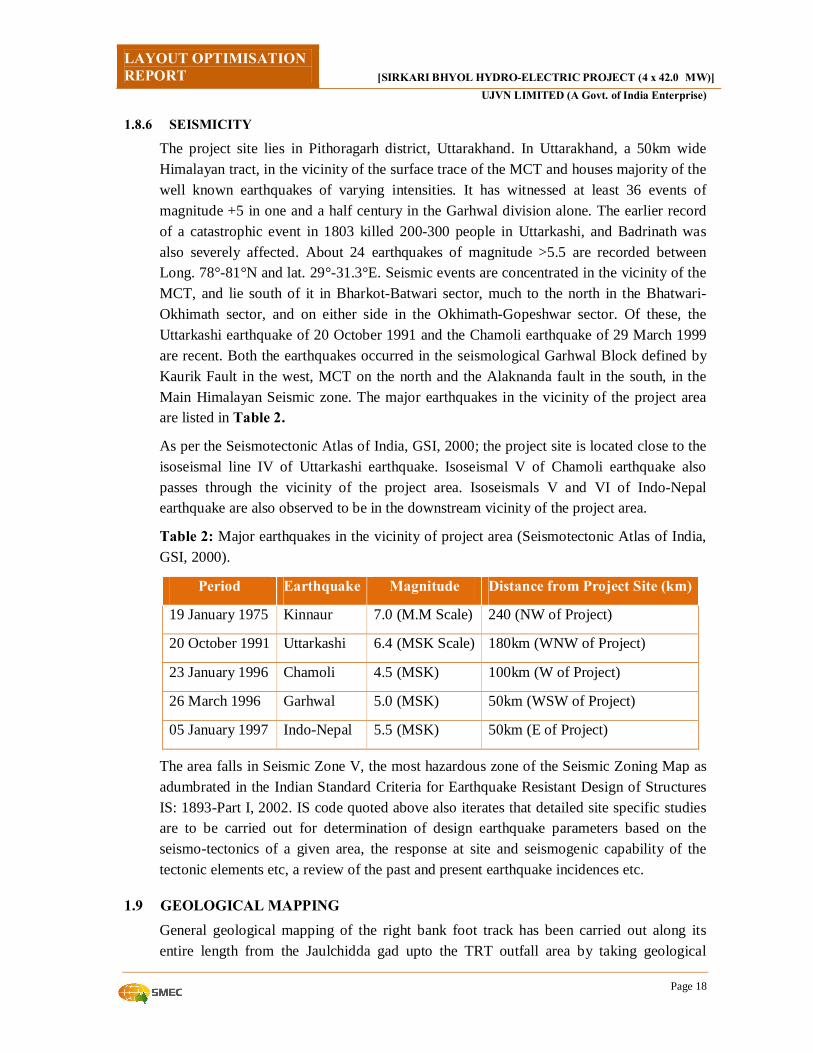
LAYOUT OPTIMISATION REPORT [SIRKARI BHYOL HYDRO-ELECTRIC PROJECT (4 x 42.0 MW)]
UJVN LIMITED (A Govt. of India Enterprise)
Page 18
1.8.6 SEISMICITY
The project site lies in Pithoragarh district, Uttarakhand. In Uttarakhand, a 50km wide Himalayan tract, in the vicinity of the surface trace of the MCT and houses majority of the well known earthquakes of varying intensities. It has witnessed at least 36 events of magnitude +5 in one and a half century in the Garhwal division alone. The earlier record of a catastrophic event in 1803 killed 200-300 people in Uttarkashi, and Badrinath was also severely affected. About 24 earthquakes of magnitude >5.5 are recorded between Long. 78°-81°N and lat. 29°-31.3°E. Seismic events are concentrated in the vicinity of the MCT, and lie south of it in Bharkot-Batwari sector, much to the north in the Bhatwari-Okhimath sector, and on either side in the Okhimath-Gopeshwar sector. Of these, the Uttarkashi earthquake of 20 October 1991 and the Chamoli earthquake of 29 March 1999 are recent. Both the earthquakes occurred in the seismological Garhwal Block defined by Kaurik Fault in the west, MCT on the north and the Alaknanda fault in the south, in the Main Himalayan Seismic zone. The major earthquakes in the vicinity of the project area are listed in Table 2.
As per the Seismotectonic Atlas of India, GSI, 2000; the project site is located close to the isoseismal line IV of Uttarkashi earthquake. Isoseismal V of Chamoli earthquake also passes through the vicinity of the project area. Isoseismals V and VI of Indo-Nepal earthquake are also observed to be in the downstream vicinity of the project area.
Table 2: Major earthquakes in the vicinity of project area (Seismotectonic Atlas of India, GSI, 2000).
Period Earthquake Magnitude Distance from Project Site (km)
19 January 1975 Kinnaur 7.0 (M.M Scale) 240 (NW of Project)
20 October 1991 Uttarkashi 6.4 (MSK Scale) 180km (WNW of Project)
23 January 1996 Chamoli 4.5 (MSK) 100km (W of Project)
26 March 1996 Garhwal 5.0 (MSK) 50km (WSW of Project)
05 January 1997 Indo-Nepal 5.5 (MSK) 50km (E of Project)
The area falls in Seismic Zone V, the most hazardous zone of the Seismic Zoning Map as adumbrated in the Indian Standard Criteria for Earthquake Resistant Design of Structures IS: 1893-Part I, 2002. IS code quoted above also iterates that detailed site specific studies are to be carried out for determination of design earthquake parameters based on the seismo-tectonics of a given area, the response at site and seismogenic capability of the tectonic elements etc, a review of the past and present earthquake incidences etc.
1.9 GEOLOGICAL MAPPING General geological mapping of the right bank foot track has been carried out along its entire length from the Jaulchidda gad upto the TRT outfall area by taking geological

LAYOUT OPTIMISATION REPORT [SIRKARI BHYOL HYDRO-ELECTRIC PROJECT (4 x 42.0 MW)]
UJVN LIMITED (A Govt. of India Enterprise)
Page 19
traverses. In addition, traverses have also been taken along existing old footpaths above the powerhouse area, Mensingh top (El 2850m), the right bank of the barrage and reservoir area. The mapped length of the road is about 8 km. All the rocky outcrops along the foot path have been plotted along with their structural attitudes including foliation dips and major joint sets.
Engineering geological mapping of the entire project area between the reservoir lip and the powerhouse site has been carried out on 1:4000 scale. In addition to this, geological maps of barrage and powerhouse sites have been developed separately on scale 1:1500. The plotted geological details in different maps vary because of the scale of the map. No major structural disturbances have been found.
1.9.1 LITHOLOGY
1.9.1.1 BED ROCK
The rocks of Pandukeshwar formation (Gopendra Kumar, GSI, 2005; Geology of Uttar Pradesh and Uttaranchal)/Bougdiyar Formation (J.S. Jamwal & A.K. Kacker, GSI 1990) have been mapped in the project area that occupies from upstream part of reservoir to downstream of tailrace outfall area. It is largely composed of streaky gneiss, quartzose gneiss, porphyroblastic gneiss, garnetiferous mica schist, migmatite gneiss, micaceous quartzite and calc silicate rocks. Gneisses rocks are dominantly exposed in and around the project area whereas, the thickness of garnetiferous mica schist bands rarely goes up to 1.5m to 3.0m.
Based on the geological traverses, intercalated sequence of the rock has been kept into the Pandukeshwar litho-formation based on major rock type as found along the mule track and old foot hill path. The rocks have been found to have moderate northerly foliation dips and the litho-stratigraphic succession is nearly uniform without any perceptible repetition of beds. The litho-stratigraphic succession in project area is summarized in Table 3.
Table 3: Litho-stratigraphic succession in project area.
Group Formation Lithological Assemblage ---------------------------------------------------Tethyan Fault (TF) -------------------------------------------------
Central Crystalline
Pandukeshwar/Baugdiyar Formation
Interstratified dark grey garnetiferous biotite schist, biotite gneiss, augen gneiss, massive quartzite with quartzo-feldspathic veins intrusions Dark grey garnetiferous biotite schist Dark grey quartzose gneiss, biotite schist, biotite gneiss, garnetiferous biotite schist and migmatite gneiss
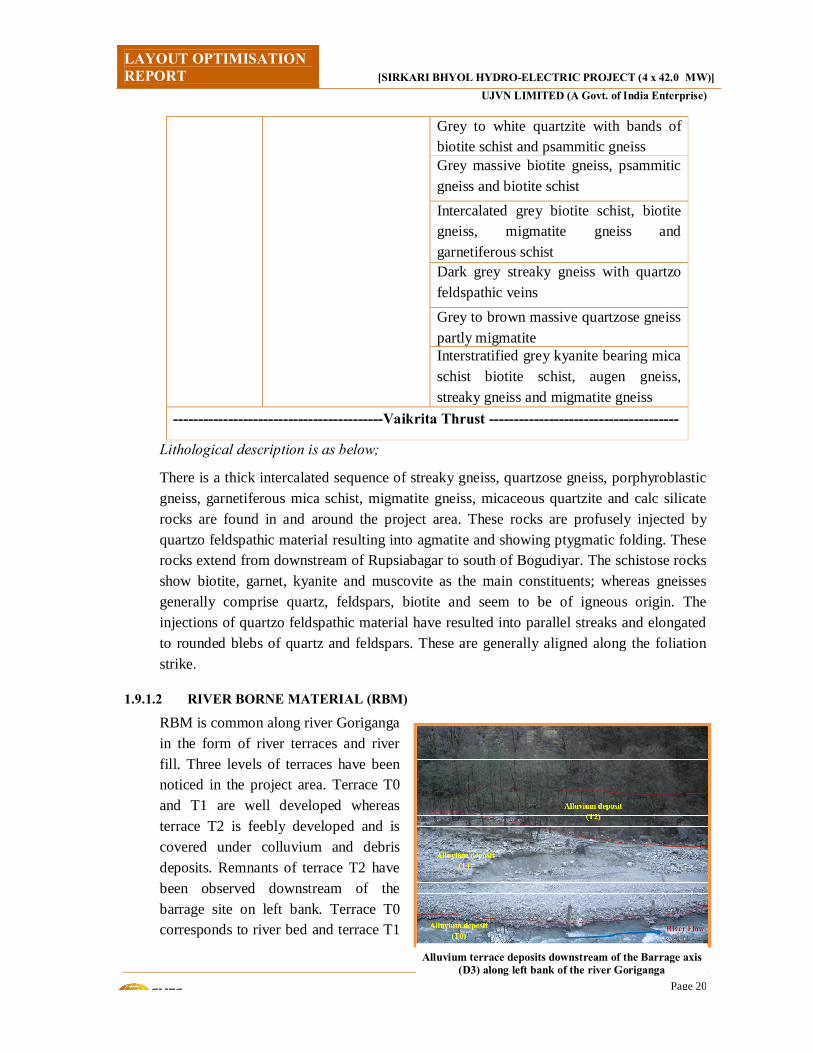
LAYOUT OPTIMISATION REPORT [SIRKARI BHYOL HYDRO-ELECTRIC PROJECT (4 x 42.0 MW)]
UJVN LIMITED (A Govt. of India Enterprise)
Page 20
Grey to white quartzite with bands of biotite schist and psammitic gneiss Grey massive biotite gneiss, psammitic gneiss and biotite schist Intercalated grey biotite schist, biotite gneiss, migmatite gneiss and garnetiferous schist Dark grey streaky gneiss with quartzo feldspathic veins Grey to brown massive quartzose gneiss partly migmatite Interstratified grey kyanite bearing mica schist biotite schist, augen gneiss, streaky gneiss and migmatite gneiss
------------------------------------------Vaikrita Thrust --------------------------------------
Lithological description is as below;
There is a thick intercalated sequence of streaky gneiss, quartzose gneiss, porphyroblastic gneiss, garnetiferous mica schist, migmatite gneiss, micaceous quartzite and calc silicate rocks are found in and around the project area. These rocks are profusely injected by quartzo feldspathic material resulting into agmatite and showing ptygmatic folding. These rocks extend from downstream of Rupsiabagar to south of Bogudiyar. The schistose rocks show biotite, garnet, kyanite and muscovite as the main constituents; whereas gneisses generally comprise quartz, feldspars, biotite and seem to be of igneous origin. The injections of quartzo feldspathic material have resulted into parallel streaks and elongated to rounded blebs of quartz and feldspars. These are generally aligned along the foliation strike.
1.9.1.2 RIVER BORNE MATERIAL (RBM)
RBM is common along river Goriganga in the form of river terraces and river fill. Three levels of terraces have been noticed in the project area. Terrace T0 and T1 are well developed whereas terrace T2 is feebly developed and is covered under colluvium and debris deposits. Remnants of terrace T2 have been observed downstream of the barrage site on left bank. Terrace T0 corresponds to river bed and terrace T1
Alluvium terrace deposits downstream of the Barrage axis (D3) along left bank of the river Goriganga

LAYOUT OPTIMISATION REPORT [SIRKARI BHYOL HYDRO-ELECTRIC PROJECT (4 x 42.0 MW)]
UJVN LIMITED (A Govt. of India Enterprise)
Page 21
is about 1-2m higher than T0. River borne material is represented by semi-consolidated sand and silt with cobbles and boulders. The size of the cobbles and boulders are found to vary between 0.1 m & 3.0 m. However, exceptional boulders of >3m in size have also been found along the river course. They appear to have fell from the side slopes as the blocks are found to be poorly rounded. Lithologically, these boulders are of gneisses.
1.9.1.3 COLLUVIUM
Colluvium deposits occur in pockets in the project area and are found to be unconsolidated to semi-consolidated. They are angular rock fragments scattered in sandy silty matrix. Big rock blocks have been found in the matrix depending upon the type of the bedrock in the area. Colluvium is more pronounced along the hill slopes; however, the deposits are sporadic. In general, thickness is interpreted to be up to 1m to 5m, but, may go up to 8-10m in isolated pockets.
1.9.1.4 SLIDE DEBRIS
Two major slide debris deposits' and one rock slide deposit have been found in project area. Two of these major landslides and one rock mass slide are located just upstream of PFR dam axis (D1) respectively at the left bank and right bank of the river Goriganga. Left bank landslide deposits have been interpreted to be due to the freezing & thawing activities and valley side dipping joint sets.
The hill slopes in the area around the landslide on the left bank of river are moderately steep (550 to 650) and are covered by slope wash debris in general. The slopes wash covered slopes support vegetation comprising trees and bushes. Some of the tress, in certain patches, is tilted indicating that surface creep is present in certain patches on these overburden covered slopes.
Geological map of the area around the landslides indicate that the big slide extends right from river bed level at around El. 2045m to about 120m above at El. 2165m. The slide scar is about
Two major landslides along left bank of the river upstream of the PFR dam axis (D1).
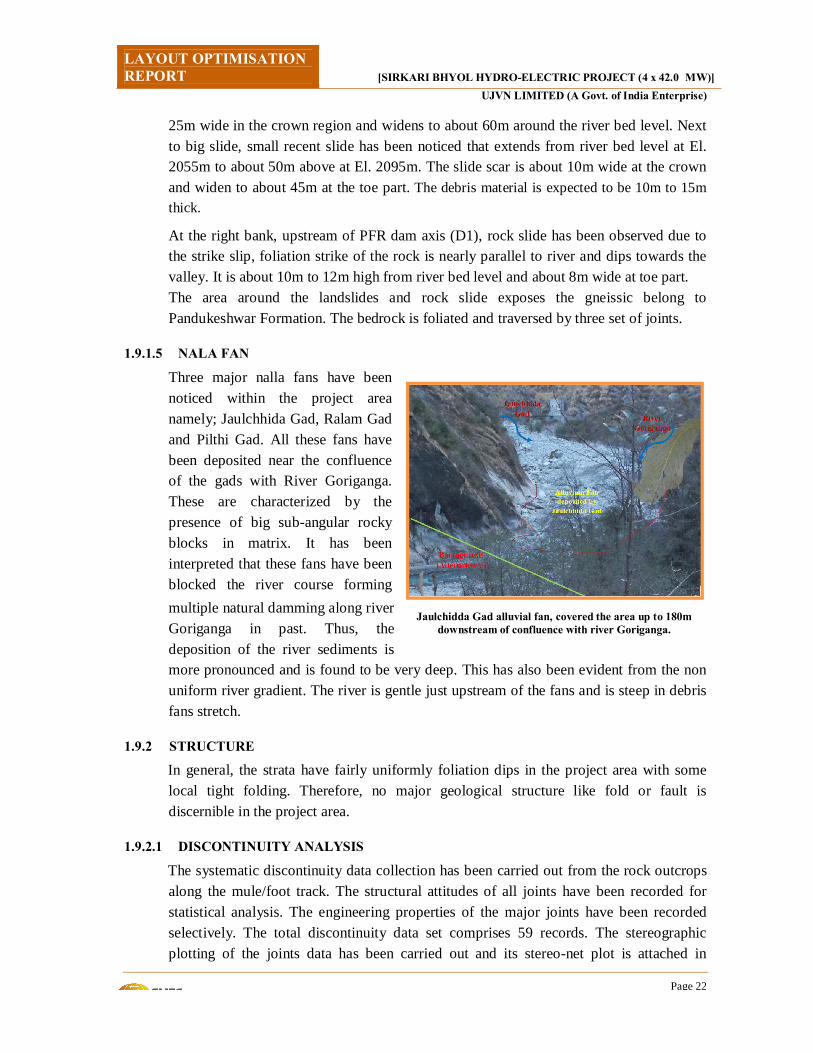
LAYOUT OPTIMISATION REPORT [SIRKARI BHYOL HYDRO-ELECTRIC PROJECT (4 x 42.0 MW)]
UJVN LIMITED (A Govt. of India Enterprise)
Page 22
25m wide in the crown region and widens to about 60m around the river bed level. Next to big slide, small recent slide has been noticed that extends from river bed level at El. 2055m to about 50m above at El. 2095m. The slide scar is about 10m wide at the crown and widen to about 45m at the toe part. The debris material is expected to be 10m to 15m thick.
At the right bank, upstream of PFR dam axis (D1), rock slide has been observed due to the strike slip, foliation strike of the rock is nearly parallel to river and dips towards the valley. It is about 10m to 12m high from river bed level and about 8m wide at toe part. The area around the landslides and rock slide exposes the gneissic belong to Pandukeshwar Formation. The bedrock is foliated and traversed by three set of joints.
1.9.1.5 NALA FAN
Three major nalla fans have been noticed within the project area namely; Jaulchhida Gad, Ralam Gad and Pilthi Gad. All these fans have been deposited near the confluence of the gads with River Goriganga. These are characterized by the presence of big sub-angular rocky blocks in matrix. It has been interpreted that these fans have been blocked the river course forming multiple natural damming along river Goriganga in past. Thus, the deposition of the river sediments is more pronounced and is found to be very deep. This has also been evident from the non uniform river gradient. The river is gentle just upstream of the fans and is steep in debris fans stretch.
1.9.2 STRUCTURE
In general, the strata have fairly uniformly foliation dips in the project area with some local tight folding. Therefore, no major geological structure like fold or fault is discernible in the project area.
1.9.2.1 DISCONTINUITY ANALYSIS
The systematic discontinuity data collection has been carried out from the rock outcrops along the mule/foot track. The structural attitudes of all joints have been recorded for statistical analysis. The engineering properties of the major joints have been recorded selectively. The total discontinuity data set comprises 59 records. The stereographic plotting of the joints data has been carried out and its stereo-net plot is attached in
Jaulchidda Gad alluvial fan, covered the area up to 180m downstream of confluence with river Goriganga.

LAYOUT OPTIMISATION REPORT [SIRKARI BHYOL HYDRO-ELECTRIC PROJECT (4 x 42.0 MW)]
UJVN LIMITED (A Govt. of India Enterprise)
Page 23
Figure 1 and the joint sets with their properties are given in Table 4.
1.9.2.2 SHEAR ZONES
Minor shear zones of thickness less than 50cm could be expected to be encountered during underground excavations. No thick shear zone has been noticed during geological traverses.
Table 4: Joint Sets and their Engineering Properties in Project area.
Set No.
Dip Dir./Amt.
Feature Persistence
(m) Joint
Roughness Aperture
(mm) Filling
Spacing (cm)
J1 N3500/500 Foliation 15-20 Rough, Undulating
Tight to 1-2 Unfilled 10-250
J2 N1700/650 Joint 20-25 Rough, Planar Tight to 2-3 Unfilled 20-200
J3 N1100/600 Joint 10-15 Rough, Planar Tight to 2-5 Unfilled 15-250
J4 N2250/550 Joint 3-5 Rough, Planar 1-3 Partially filled 20-300
Figure 1: Stereo plot of discontinuities in project area.
1.9.3 HYDROGEOLOGY
The rainfall in the project area is very high. Snowfall is occasional and moderate. The snowfall period spans from December to January. The project area is barren on steep rocky cliff and moderately vegetated on the right bank of the barrage site up to higher reaches. It lies in a high relief terrain at altitudes of more than El 3500m above msl. In general, the surface run-off and ground water recharge are expected in fair proportion. Perched water tables are expected. The springs with a low discharges have been found
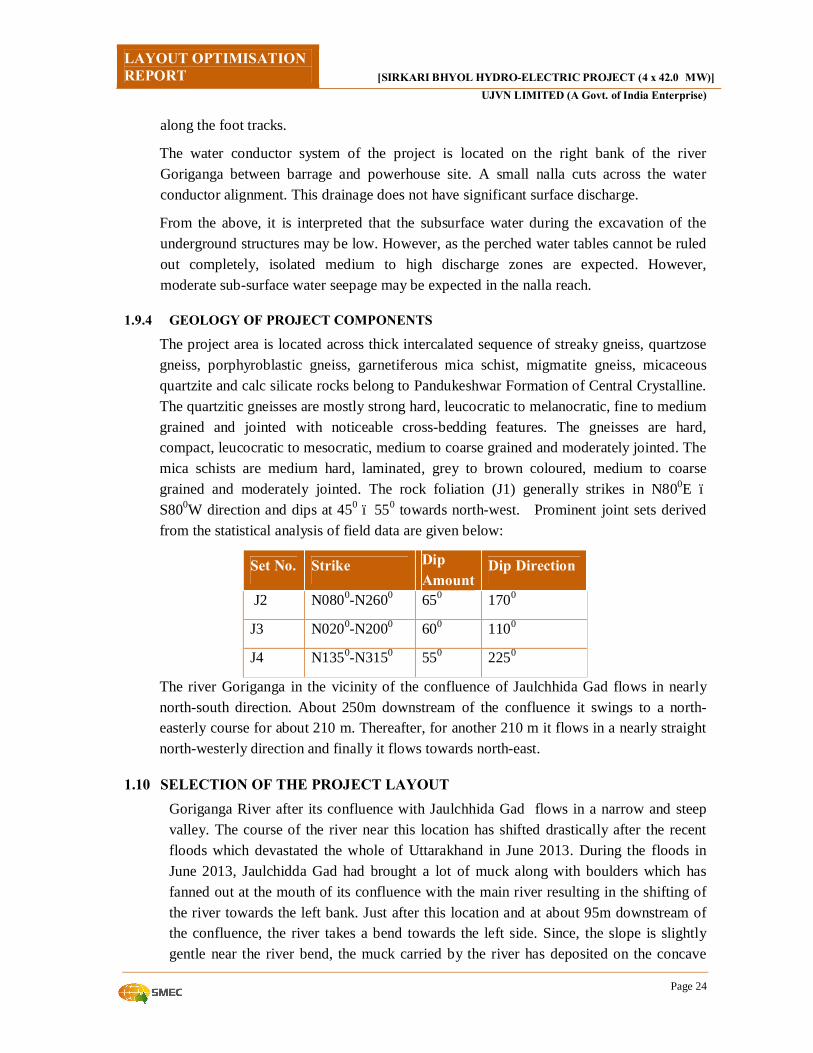
LAYOUT OPTIMISATION REPORT [SIRKARI BHYOL HYDRO-ELECTRIC PROJECT (4 x 42.0 MW)]
UJVN LIMITED (A Govt. of India Enterprise)
Page 24
along the foot tracks.
The water conductor system of the project is located on the right bank of the river Goriganga between barrage and powerhouse site. A small nalla cuts across the water conductor alignment. This drainage does not have significant surface discharge.
From the above, it is interpreted that the subsurface water during the excavation of the underground structures may be low. However, as the perched water tables cannot be ruled out completely, isolated medium to high discharge zones are expected. However, moderate sub-surface water seepage may be expected in the nalla reach.
1.9.4 GEOLOGY OF PROJECT COMPONENTS
The project area is located across thick intercalated sequence of streaky gneiss, quartzose gneiss, porphyroblastic gneiss, garnetiferous mica schist, migmatite gneiss, micaceous quartzite and calc silicate rocks belong to Pandukeshwar Formation of Central Crystalline. The quartzitic gneisses are mostly strong hard, leucocratic to melanocratic, fine to medium grained and jointed with noticeable cross-bedding features. The gneisses are hard, compact, leucocratic to mesocratic, medium to coarse grained and moderately jointed. The mica schists are medium hard, laminated, grey to brown coloured, medium to coarse grained and moderately jointed. The rock foliation (J1) generally strikes in N800E – S800W direction and dips at 450 – 550 towards north-west. Prominent joint sets derived from the statistical analysis of field data are given below:
Set No. Strike Dip Amount
Dip Direction
J2 N0800-N2600 650 1700
J3 N0200-N2000 600 1100
J4 N1350-N3150 550 2250
The river Goriganga in the vicinity of the confluence of Jaulchhida Gad flows in nearly north-south direction. About 250m downstream of the confluence it swings to a north-easterly course for about 210 m. Thereafter, for another 210 m it flows in a nearly straight north-westerly direction and finally it flows towards north-east.
1.10 SELECTION OF THE PROJECT LAYOUT Goriganga River after its confluence with Jaulchhida Gad flows in a narrow and steep valley. The course of the river near this location has shifted drastically after the recent floods which devastated the whole of Uttarakhand in June 2013. During the floods in June 2013, Jaulchidda Gad had brought a lot of muck along with boulders which has fanned out at the mouth of its confluence with the main river resulting in the shifting of the river towards the left bank. Just after this location and at about 95m downstream of the confluence, the river takes a bend towards the left side. Since, the slope is slightly gentle near the river bend, the muck carried by the river has deposited on the concave
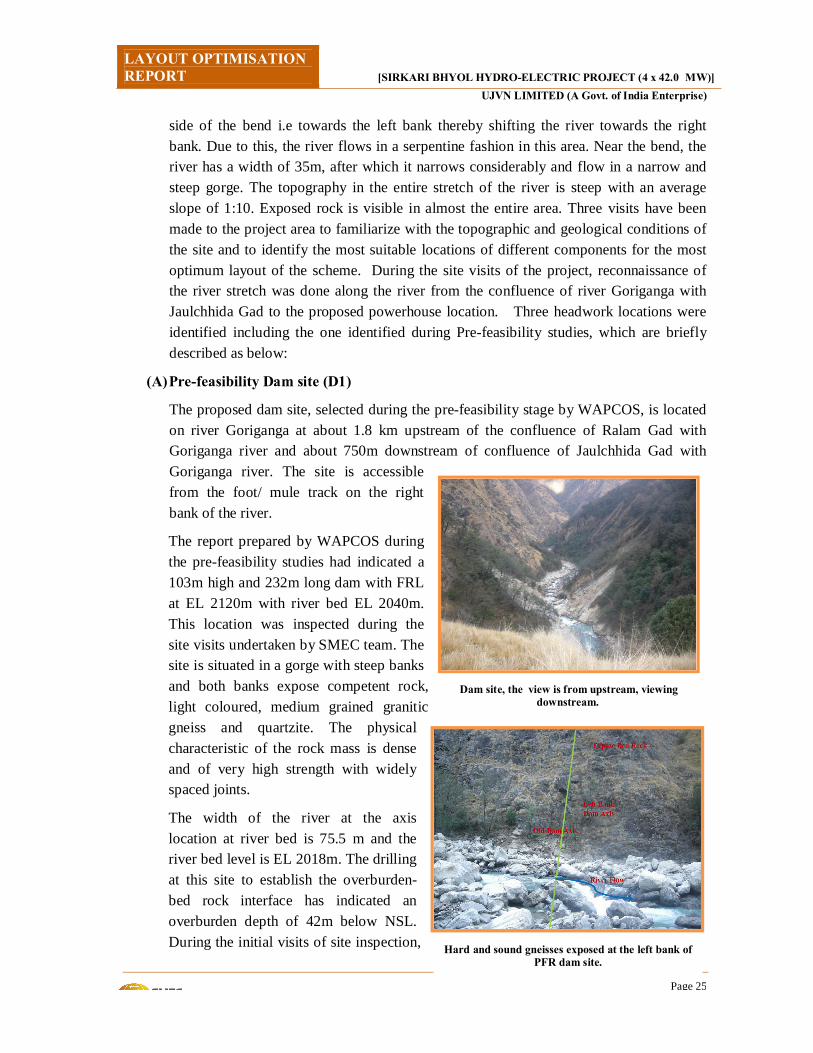
LAYOUT OPTIMISATION REPORT [SIRKARI BHYOL HYDRO-ELECTRIC PROJECT (4 x 42.0 MW)]
UJVN LIMITED (A Govt. of India Enterprise)
Page 25
side of the bend i.e towards the left bank thereby shifting the river towards the right bank. Due to this, the river flows in a serpentine fashion in this area. Near the bend, the river has a width of 35m, after which it narrows considerably and flow in a narrow and steep gorge. The topography in the entire stretch of the river is steep with an average slope of 1:10. Exposed rock is visible in almost the entire area. Three visits have been made to the project area to familiarize with the topographic and geological conditions of the site and to identify the most suitable locations of different components for the most optimum layout of the scheme. During the site visits of the project, reconnaissance of the river stretch was done along the river from the confluence of river Goriganga with Jaulchhida Gad to the proposed powerhouse location. Three headwork locations were identified including the one identified during Pre-feasibility studies, which are briefly described as below:
(A) Pre-feasibility Dam site (D1)
The proposed dam site, selected during the pre-feasibility stage by WAPCOS, is located on river Goriganga at about 1.8 km upstream of the confluence of Ralam Gad with Goriganga river and about 750m downstream of confluence of Jaulchhida Gad with Goriganga river. The site is accessible from the foot/ mule track on the right bank of the river.
The report prepared by WAPCOS during the pre-feasibility studies had indicated a 103m high and 232m long dam with FRL at EL 2120m with river bed EL 2040m. This location was inspected during the site visits undertaken by SMEC team. The site is situated in a gorge with steep banks and both banks expose competent rock, light coloured, medium grained granitic gneiss and quartzite. The physical characteristic of the rock mass is dense and of very high strength with widely spaced joints.
The width of the river at the axis location at river bed is 75.5 m and the river bed level is EL 2018m. The drilling at this site to establish the overburden-bed rock interface has indicated an overburden depth of 42m below NSL. During the initial visits of site inspection,
Dam site, the view is from upstream, viewing downstream.
Hard and sound gneisses exposed at the left bank of PFR dam site.
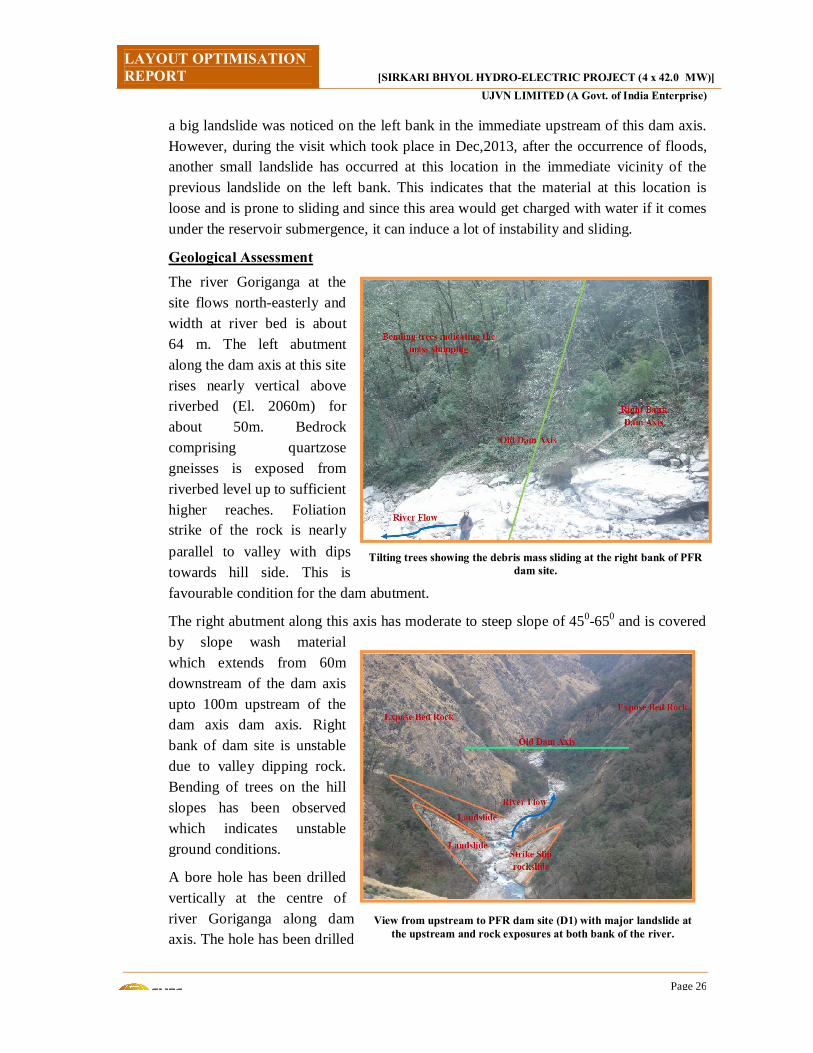
LAYOUT OPTIMISATION REPORT [SIRKARI BHYOL HYDRO-ELECTRIC PROJECT (4 x 42.0 MW)]
UJVN LIMITED (A Govt. of India Enterprise)
Page 26
a big landslide was noticed on the left bank in the immediate upstream of this dam axis. However, during the visit which took place in Dec,2013, after the occurrence of floods, another small landslide has occurred at this location in the immediate vicinity of the previous landslide on the left bank. This indicates that the material at this location is loose and is prone to sliding and since this area would get charged with water if it comes under the reservoir submergence, it can induce a lot of instability and sliding.
Geological Assessment The river Goriganga at the site flows north-easterly and width at river bed is about 64 m. The left abutment along the dam axis at this site rises nearly vertical above riverbed (El. 2060m) for about 50m. Bedrock comprising quartzose gneisses is exposed from riverbed level up to sufficient higher reaches. Foliation strike of the rock is nearly parallel to valley with dips towards hill side. This is favourable condition for the dam abutment.
The right abutment along this axis has moderate to steep slope of 450-650 and is covered by slope wash material which extends from 60m downstream of the dam axis upto 100m upstream of the dam axis dam axis. Right bank of dam site is unstable due to valley dipping rock. Bending of trees on the hill slopes has been observed which indicates unstable ground conditions.
A bore hole has been drilled vertically at the centre of river Goriganga along dam axis. The hole has been drilled
View from upstream to PFR dam site (D1) with major landslide at the upstream and rock exposures at both bank of the river.
Tilting trees showing the debris mass sliding at the right bank of PFR dam site.

LAYOUT OPTIMISATION REPORT [SIRKARI BHYOL HYDRO-ELECTRIC PROJECT (4 x 42.0 MW)]
UJVN LIMITED (A Govt. of India Enterprise)
Page 27
up to depth of 60.00m, in which bed rock has been encountered at a depth of 42.00m. Due to non-availability of bore hole log, detail interpretations of bore hole lithology are not possible.
About 60 m upstream of dam axis at left bank of river Goriganga, two active landslides have been noticed. The landslides are adjacent to each other, and it could be possible that in future they could merge to form a single huge landslide. Landslided debris fan have extended about 60 m downstream, reaching just upstream of dam axis. However, about 15m above the crest of the landslide hard, competent bed rock is noticed. Similar is the situation at upstream and downstream side of the landslide. This shows that the thickness of the landslides materials would be about 15 to 20m, which shall be confirmed by drilling at least two bore holes.
Thick overburden at the river (42m) indicates the huge excavation shall be required for dam foundation up to the fresh rock. About 42m deep excavation in such high gradient river valley may be risky and difficult. Sufficient quantities debris materials need to be removed at the right bank to abut the dam and house intake portal. It may also be required to provide sufficient treatments by way of long rock bolts, shotcrete and drainage holes to stabilize the right hill slopes. The major problem for dam location is existing upstream landslide. During monsoon, the landslide materials will roll down and accumulate in the reservoir of the dam. Protection measures for landslide would be too expensive and time consuming. In addition, the material of landslide would fill up the dam rapidly after construction. Thus it is strongly recommended to drop the proposal of constructing a high dam.
In view of the above cited considerations, this location was rejected for the location of the headworks (dam/barrage). The major considerations for rejecting this site are summarised below:
1. River bed slope at the dam site is very steep, in the range of 1 in 10 . The height of the dam at this location with FRL 2084.0m would be around 108m with a length of 193m at the top. Further, the rock has been encountered at 42m below the natural surface level. If the dam is built up at this location, it would roughly cost Rs 310 crores. The usable live storage between FRL and MDDL would not be more than 0.07 MCM. Even this live storage is expected to get encroached upon quickly during the initial few years of operation due to steep river slope. So the techno-economic considerations disfavour the selection of dam at this location as envisaged during the pre-feasibility studies.
2. A barrage at this location would result in considerable head loss since the bed level at this location is EL 2018 and even with a 25m high barrage, it would result in a head loss of 47m which is not desirable.
3. In the upstream of the dam axis, there are two prominent landslides on the left bank
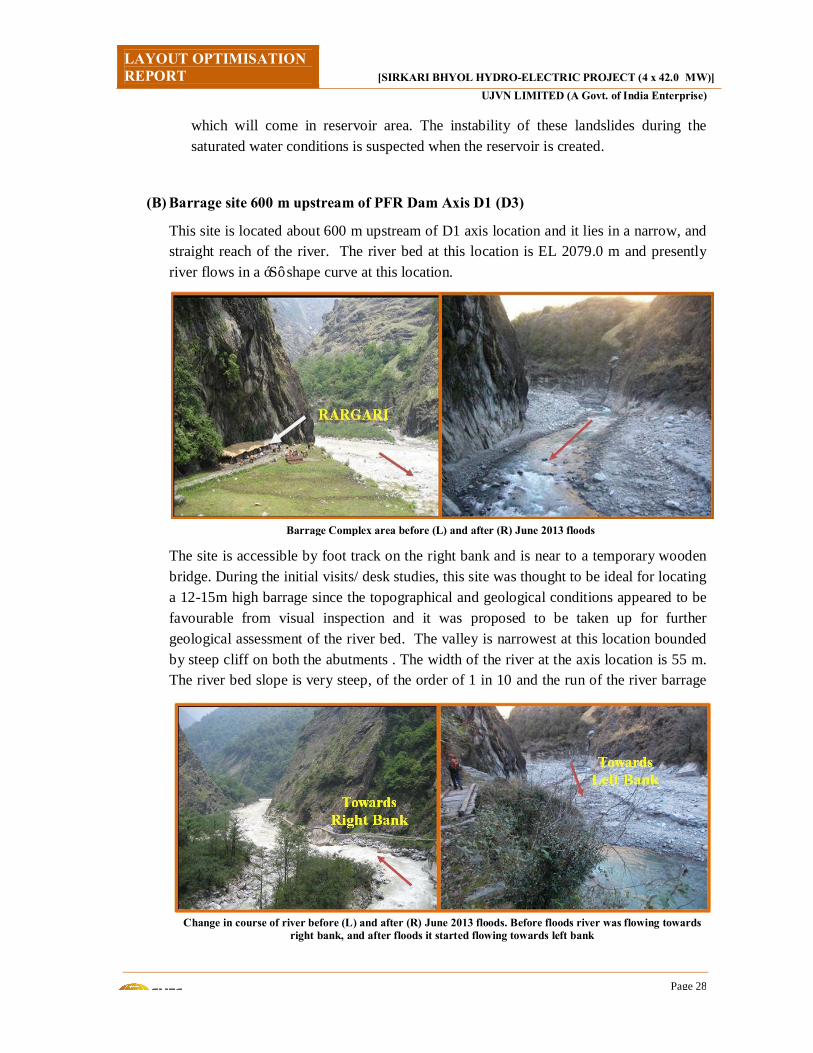
LAYOUT OPTIMISATION REPORT [SIRKARI BHYOL HYDRO-ELECTRIC PROJECT (4 x 42.0 MW)]
UJVN LIMITED (A Govt. of India Enterprise)
Page 28
which will come in reservoir area. The instability of these landslides during the saturated water conditions is suspected when the reservoir is created.
(B) Barrage site 600 m upstream of PFR Dam Axis D1 (D3)
This site is located about 600 m upstream of D1 axis location and it lies in a narrow, and straight reach of the river. The river bed at this location is EL 2079.0 m and presently river flows in a ‘S’ shape curve at this location.
The site is accessible by foot track on the right bank and is near to a temporary wooden bridge. During the initial visits/ desk studies, this site was thought to be ideal for locating a 12-15m high barrage since the topographical and geological conditions appeared to be favourable from visual inspection and it was proposed to be taken up for further geological assessment of the river bed. The valley is narrowest at this location bounded by steep cliff on both the abutments . The width of the river at the axis location is 55 m. The river bed slope is very steep, of the order of 1 in 10 and the run of the river barrage
Barrage Complex area before (L) and after (R) June 2013 floods
Change in course of river before (L) and after (R) June 2013 floods. Before floods river was flowing towards right bank, and after floods it started flowing towards left bank
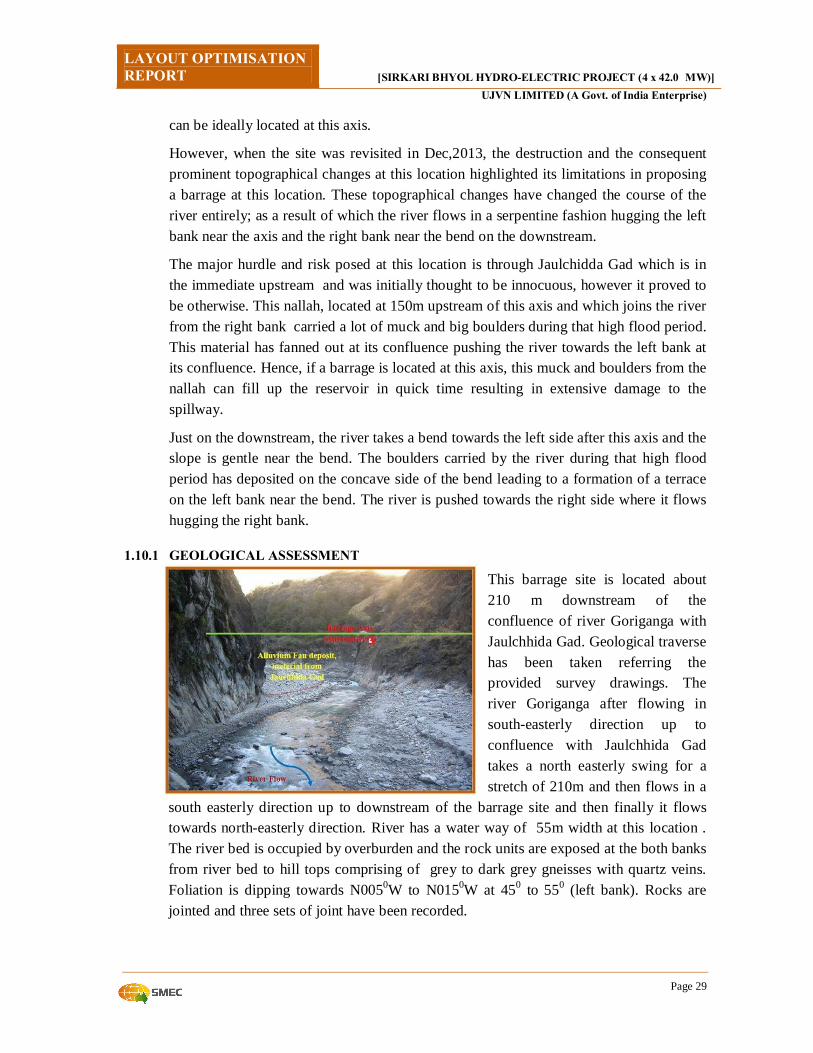
LAYOUT OPTIMISATION REPORT [SIRKARI BHYOL HYDRO-ELECTRIC PROJECT (4 x 42.0 MW)]
UJVN LIMITED (A Govt. of India Enterprise)
Page 29
can be ideally located at this axis.
However, when the site was revisited in Dec,2013, the destruction and the consequent prominent topographical changes at this location highlighted its limitations in proposing a barrage at this location. These topographical changes have changed the course of the river entirely; as a result of which the river flows in a serpentine fashion hugging the left bank near the axis and the right bank near the bend on the downstream.
The major hurdle and risk posed at this location is through Jaulchidda Gad which is in the immediate upstream and was initially thought to be innocuous, however it proved to be otherwise. This nallah, located at 150m upstream of this axis and which joins the river from the right bank carried a lot of muck and big boulders during that high flood period. This material has fanned out at its confluence pushing the river towards the left bank at its confluence. Hence, if a barrage is located at this axis, this muck and boulders from the nallah can fill up the reservoir in quick time resulting in extensive damage to the spillway.
Just on the downstream, the river takes a bend towards the left side after this axis and the slope is gentle near the bend. The boulders carried by the river during that high flood period has deposited on the concave side of the bend leading to a formation of a terrace on the left bank near the bend. The river is pushed towards the right side where it flows hugging the right bank.
1.10.1 GEOLOGICAL ASSESSMENT
This barrage site is located about 210 m downstream of the confluence of river Goriganga with Jaulchhida Gad. Geological traverse has been taken referring the provided survey drawings. The river Goriganga after flowing in south-easterly direction up to confluence with Jaulchhida Gad takes a north easterly swing for a stretch of 210m and then flows in a
south easterly direction up to downstream of the barrage site and then finally it flows towards north-easterly direction. River has a water way of 55m width at this location . The river bed is occupied by overburden and the rock units are exposed at the both banks from river bed to hill tops comprising of grey to dark grey gneisses with quartz veins. Foliation is dipping towards N0050W to N0150W at 450 to 550 (left bank). Rocks are jointed and three sets of joint have been recorded.

LAYOUT OPTIMISATION REPORT [SIRKARI BHYOL HYDRO-ELECTRIC PROJECT (4 x 42.0 MW)]
UJVN LIMITED (A Govt. of India Enterprise)
Page 30
From river bed up to the higher reaches of hill, bed rock is exposed. On both sides of the valley, it is hard and compact; and the foliation strike is oblique to barrage axis with dips towards upstream. However, there is an alluvial fan of Jaulchhida Gad extending to about 180m downstream of its confluence with Goriganga river. This site which is about 210m downstream of the above confluence
is not recommended as the fan may add to the delta formation after the barrage construction.
Hence, this axis was rejected for locating the barrage in view of the risks associated with the muck and debris carried by the Jaulchidda nallah situated in the immediate upstream of the axis.
(C) Barrage site 360 m upstream of D1 Location (D2)
This axis though located in the straight reach of the river at about 360 m upstream of D1 location, was initially not preferred since it is located between the bend which comes on the upstream and the landslide on the left bank on the immediate downstream. This axis is also accessible by the same foot track on the right bank. Presently, this area has not been explored by any geological exploration. However, since this location lies in close proximity to D1, the geological conditions are not expected to vary considerably. The river bed at this location is at EL 2075.0 m.
Earlier, it was apprehended that the flow emerging from the stilling basin could charge up the landslide making it prone to instability. Some hydraulic problems were also anticipated in the operation of the spillway since this axis is located in the vicinity of the river bend. Moreover, due to the steepness of the river slopes and the narrowing river width after the barrage axis, huge cutting would be required for accommodating the stilling basin.
However, during the re-evaluation of this axis after the other options were closed,
Confluence of Jaulchidda Gad with Goriganga river
Barrage Axis (D2)

LAYOUT OPTIMISATION REPORT [SIRKARI BHYOL HYDRO-ELECTRIC PROJECT (4 x 42.0 MW)]
UJVN LIMITED (A Govt. of India Enterprise)
Page 31
optimisation studies were carried out by orienting the barrage axis so as to make the flow conditions uniform in the upstream of the barrage axis. The barrage axis has been fixed oblique to the river flow so that flows are symmetrical in all spillway bays. Further, improvisation studies were carried out for the design of barrage so that it is confined much ahead of the landslide zone and flows emerging from the stilling basin does not interfere with the landslide during the normal monsoon flows.
Though this location cannot be categorised as an ideal location, however this is the best available compromise which can be made in the current site topographical limitations. The scheme would be operated as purely run of the river plant, though endeavor has been to provide a 2m live storage for flexibility of operation. Due to steep river gradient, there is a storage constraint for providing the normal conventional peaking of 3 hours during the lean period. During the construction of barrage, water can be diverted through a two stage coffering in the river channel.
Geological Assessment The proposed barrage site (D2) on River Goriganga is located about 450m downstream of the confluence of river Goriganga with Jaulchhida Gad. The river at the bed portion is overlain by overburden and the rock is exposed at both banks from riverbed up to hill top comprising of grey to dark grey gneisses with quartz veins. Foliation is dipping towards N0050W to N0150W at 450 to 550 (left bank). Rocks are moderately jointed and three joint sets are present in the gneisses.
In spite of sound rock exposures along both banks of river to abut barrage with rock, the foliation strike of the rock is nearly parallel to river flow and the dips of rock is dipping into the left hill side which is favourable but for the right bank it becomes unfavourable due to valley dipping. During traverse along right bank hill side, bending of trees was noticed due to ground movement which may be due to
Barrage D2 and D3 locations with alluvium terrace deposits.
Barrage D2 location with alluvium terrace deposits and landslides on the left bank.
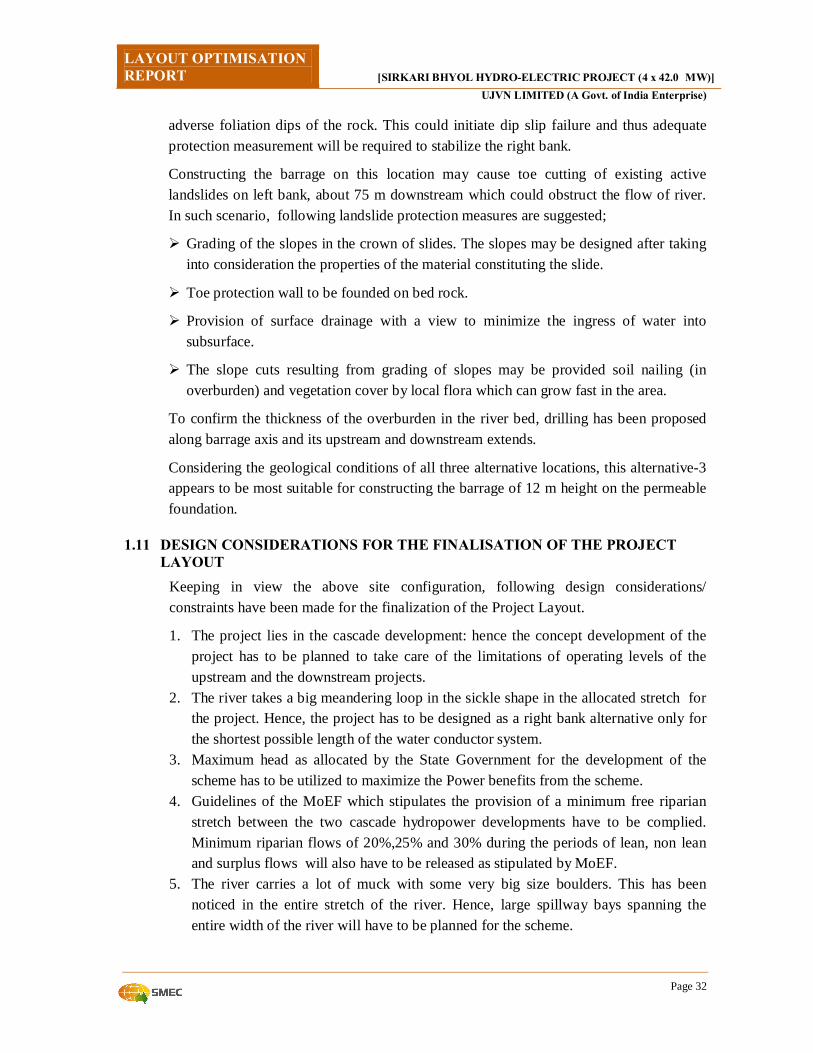
LAYOUT OPTIMISATION REPORT [SIRKARI BHYOL HYDRO-ELECTRIC PROJECT (4 x 42.0 MW)]
UJVN LIMITED (A Govt. of India Enterprise)
Page 32
adverse foliation dips of the rock. This could initiate dip slip failure and thus adequate protection measurement will be required to stabilize the right bank.
Constructing the barrage on this location may cause toe cutting of existing active landslides on left bank, about 75 m downstream which could obstruct the flow of river. In such scenario, following landslide protection measures are suggested;
Ø Grading of the slopes in the crown of slides. The slopes may be designed after taking into consideration the properties of the material constituting the slide.
Ø Toe protection wall to be founded on bed rock.
Ø Provision of surface drainage with a view to minimize the ingress of water into subsurface.
Ø The slope cuts resulting from grading of slopes may be provided soil nailing (in overburden) and vegetation cover by local flora which can grow fast in the area.
To confirm the thickness of the overburden in the river bed, drilling has been proposed along barrage axis and its upstream and downstream extends.
Considering the geological conditions of all three alternative locations, this alternative-3 appears to be most suitable for constructing the barrage of 12 m height on the permeable foundation.
1.11 DESIGN CONSIDERATIONS FOR THE FINALISATION OF THE PROJECT LAYOUT
Keeping in view the above site configuration, following design considerations/ constraints have been made for the finalization of the Project Layout.
1. The project lies in the cascade development: hence the concept development of the project has to be planned to take care of the limitations of operating levels of the upstream and the downstream projects.
2. The river takes a big meandering loop in the sickle shape in the allocated stretch for the project. Hence, the project has to be designed as a right bank alternative only for the shortest possible length of the water conductor system.
3. Maximum head as allocated by the State Government for the development of the scheme has to be utilized to maximize the Power benefits from the scheme.
4. Guidelines of the MoEF which stipulates the provision of a minimum free riparian stretch between the two cascade hydropower developments have to be complied. Minimum riparian flows of 20%,25% and 30% during the periods of lean, non lean and surplus flows will also have to be released as stipulated by MoEF.
5. The river carries a lot of muck with some very big size boulders. This has been noticed in the entire stretch of the river. Hence, large spillway bays spanning the entire width of the river will have to be planned for the scheme.

LAYOUT OPTIMISATION REPORT [SIRKARI BHYOL HYDRO-ELECTRIC PROJECT (4 x 42.0 MW)]
UJVN LIMITED (A Govt. of India Enterprise)
Page 33
6. Dam has not been considered as low storage in the valley due to very steep slope in the river nullifies the benefits of creating high head works. Further, the presence of rock is not available at shallow depths and the drilling at the site has indicated a minimum overburden depth of 42m.
7. Steep river banks in the entire project area rules out the possibility of a surface power house and an open to sky surge shaft.
8. No R&R issues are expected in the project since the area is very sparsely populated and no habitation exists at or near the river bed.
9. Presence of a big nalla (Jaulchidda gad) in the near vicinity of the head works which carries a lot of muck/ boulders is a big influencing factor in the selection of the diversion site location. The muck carried by the nalla has deposited at its confluence with the river and as a result, the river has diverted towards the left bank at that location. The mouth of the nalla has also widened with the fanning of the deposits after the devastating floods in this river in June, 2013.
10. Two landslides on the right bank have been noticed near the PFR axis of the dam (D1). One of these landslides occurred during the floods in the river in June,2013.
11. The location of the head works has to be identified in the reach available from the PFR Dam axis upto Jaulchidda Gad. MoEF Guidelines restrict any location above the nalla where the river bed EL. 2020m and any location beyond the PFR dam axis is not desirable since there would be a considerable loss of head beyond this location as the river is very steep.
1.12 OPTIMISATION OF THE BARRAGE LOCATION As mentioned above, the finalised barrage location (D2) is constrained on the upstream by the presence of a steep river bend and the downstream extent is limited by two major slides on the left bank. The distance between the bend and the landslide is 75 m and the river narrows considerably as it flows from the bend towards the landslide. The barrage has to be optimised within these reach so that the flow emerging from the stilling basin on the downstream does not directly impinge at the toe of the slide and that the uniform flow conditions are maintained in the upstream during the operation of the spillway. The barrage axis has been proposed to be aligned obliquely to the river flow and has been located slightly downstream of the river bend so that a small horizontal reach is available before it enters the spillway. The barrage height has been selected so that the heading of the water is just sufficient to pass the design flood in the available width of the river. This has been done primarily to reduce the length of the barrage. The design flood has been selected as SPF in view of the recent high floods even though IS: 11223-1985 (Cl. 3.1.2). categorise it a small dam which has to be designed for 100 year flood. The FRL thus proposed is EL 2084.0 and the spillway comprises of 4 bays of 14m (W)X 9m (H) each (including one additional bay for inoperative condition). Alongside, one small spillway of 6m(W) x 9m(H) has also been proposed near the intake side to pass the normal monsoon flows. A flap gate has also been proposed over the radial gate in this bay to regulate the
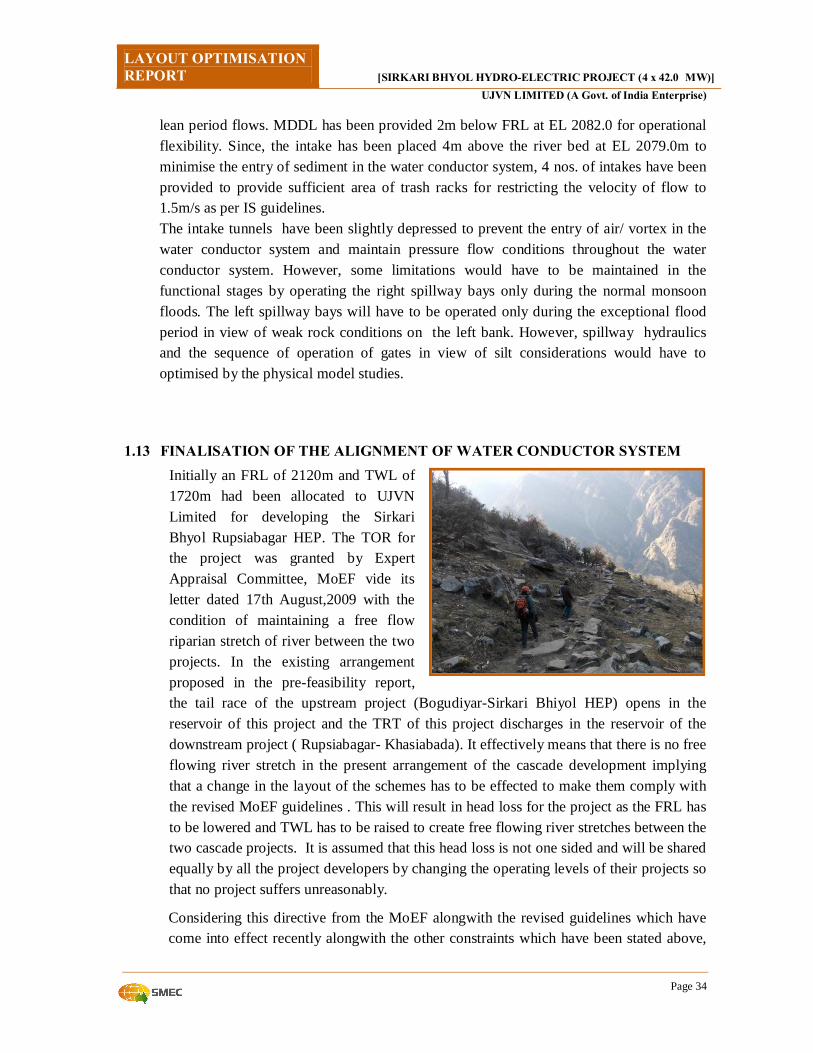
LAYOUT OPTIMISATION REPORT [SIRKARI BHYOL HYDRO-ELECTRIC PROJECT (4 x 42.0 MW)]
UJVN LIMITED (A Govt. of India Enterprise)
Page 34
lean period flows. MDDL has been provided 2m below FRL at EL 2082.0 for operational flexibility. Since, the intake has been placed 4m above the river bed at EL 2079.0m to minimise the entry of sediment in the water conductor system, 4 nos. of intakes have been provided to provide sufficient area of trash racks for restricting the velocity of flow to 1.5m/s as per IS guidelines. The intake tunnels have been slightly depressed to prevent the entry of air/ vortex in the water conductor system and maintain pressure flow conditions throughout the water conductor system. However, some limitations would have to be maintained in the functional stages by operating the right spillway bays only during the normal monsoon floods. The left spillway bays will have to be operated only during the exceptional flood period in view of weak rock conditions on the left bank. However, spillway hydraulics and the sequence of operation of gates in view of silt considerations would have to optimised by the physical model studies.
1.13 FINALISATION OF THE ALIGNMENT OF WATER CONDUCTOR SYSTEM Initially an FRL of 2120m and TWL of 1720m had been allocated to UJVN Limited for developing the Sirkari Bhyol Rupsiabagar HEP. The TOR for the project was granted by Expert Appraisal Committee, MoEF vide its letter dated 17th August,2009 with the condition of maintaining a free flow riparian stretch of river between the two projects. In the existing arrangement proposed in the pre-feasibility report, the tail race of the upstream project (Bogudiyar-Sirkari Bhiyol HEP) opens in the reservoir of this project and the TRT of this project discharges in the reservoir of the downstream project ( Rupsiabagar- Khasiabada). It effectively means that there is no free flowing river stretch in the present arrangement of the cascade development implying that a change in the layout of the schemes has to be effected to make them comply with the revised MoEF guidelines . This will result in head loss for the project as the FRL has to be lowered and TWL has to be raised to create free flowing river stretches between the two cascade projects. It is assumed that this head loss is not one sided and will be shared equally by all the project developers by changing the operating levels of their projects so that no project suffers unreasonably.
Considering this directive from the MoEF alongwith the revised guidelines which have come into effect recently alongwith the other constraints which have been stated above,

LAYOUT OPTIMISATION REPORT [SIRKARI BHYOL HYDRO-ELECTRIC PROJECT (4 x 42.0 MW)]
UJVN LIMITED (A Govt. of India Enterprise)
Page 35
following considerations have been made for finalising the project layout.
A) Reduction of FRL from originally planned EL 2120m to EL 2084.0m to make provision for free river stretch of about 400m. It is assumed that similar action would be taken up by the developer of the upstream project i.e Bogudiyar- Sirkari Bhiyol HEP by raising the TWL to increase the length of free river stretch.
B) No raising of TWL is not required for Sirkari Bhyol Rupsiabagar HEP since the immediate downstream i.e. Rupsiabagar – Khasiyabada HEP which was proposed to be developed by NTPC has been shelved due to wildlife and reserve forest consideration and will not be taken up for development.
Since the river flows in a sickle shape, the alignment of the head race tunnel has been finalised based on the shortest possible length on the right bank. The maximum rock cover comes out to be about 750 m at about 1067 m from the start of HRT which will not pose high pressure problems including squeezing. Overall tunneling media is anticipated to be tolerable.
Geological aspects along water conductor system Four power intakes are proposed at the right bank of the river just abutting the axis of the barrage. Water passing through the intakes enters 4 nos. of intake tunnels which join together to form 2 nos. of feeder tunnels leading to underground desilting chambers. The connecting tunnels after emanating from the desilting chambers join together to form a 4.9m dia. and 1200 m long Head Race tunnel which continues up to the surge shaft. The headrace tunnel starts from the downstream end of the desilting chamber connecting the surge shaft. Intake portals, intake/feeder tunnels and desilting chambers are housed in hard, compact gneissic rock with sufficient vertical and lateral rock cover for underground structures. Orientation of desilting chamber with respect to foliation strike of the rock is making an angle 460 and with other prominent joint sets J2 and J3 are 460 and 700 respectively. Thus the location and orientation of the
underground desilting chambers are geologically favourable.
The proposed head race tunnel alignment passes through a rugged terrain on the right bank of the river Goriganga with high ridges rising up to ±2850m. HRT will encounter
Hard, compact and sound banded quartzitic gneisses at underground powerhouse area.

LAYOUT OPTIMISATION REPORT [SIRKARI BHYOL HYDRO-ELECTRIC PROJECT (4 x 42.0 MW)]
UJVN LIMITED (A Govt. of India Enterprise)
Page 36
the central crystalline group of rocks comprising gneisses, biotitic gneisses with metabasic amphibolite layers in the upstream and gneisses, mica schist, banded quartzitic gneisses in downstream reaches. The terrain, in general, is well vegetated, but, the distribution of colluvium is sporadic. Rock is well exposed all along the tunnel alignment. It is generally dipping towards NNW at 450 to 550. HRT is only about 1200m long, thus there is no need for an intermediate opening. Topographical cover above the HRT alignment varies from 75m to 750m. It is very high between RDs. 800 m to 1200 m. In this reach, problem of higher vertical stresses may be expected but can be managed by adequate support system.
In order to project geology along the tunnel alignment, geological traverse along the river valley and ridge have been carried out to record the possible discontinuities data of bed rock. The tunnel would not pass through any deep valley and sufficient vertical and lateral rock covers are available.
The tunnel is aligned across a local nalla with a very limited or small catchment. Discharge is very less in the nalla. This nalla sometimes brings debris during raining from their catchments. However, rock is found well exposed in the nalla at tunnel alignment and 3D rock cover at the HRT crossing is ensured.
The HRT area is well vegetated at the northern part of the hill and lies in a high relief terrain of altitudes more than El 2750m above msl. In general, the surface run-off and ground water recharge are expected in fair proportion. Overall, the tunnel would be expected to encounter fair to good category of rock but some parts (less percentage) may intercept poorer rock. No major discontinuity plane has been encountered during the traverses.
1.14 SURGE SHAFT AND POWERHOUSE LOCATION The entire area near the power house is very steep and no site is available for locating either an open surge shaft or a surface power house . Hence, an underground surge shaft of 10 m diameter from EL 2100.50 to EL 2066.00 m (34.50m high) has been proposed at the end of the headrace tunnel. A single pressure shaft emanates from the surge shaft which bifurcates to form two branch penstocks. Near the power house, these branch pressure shafts again bifurcate to form 4 nos. of branch penstocks leading to an Underground Power house to
Hard and compact quartzo-biotite gneisses at powerhouse area.
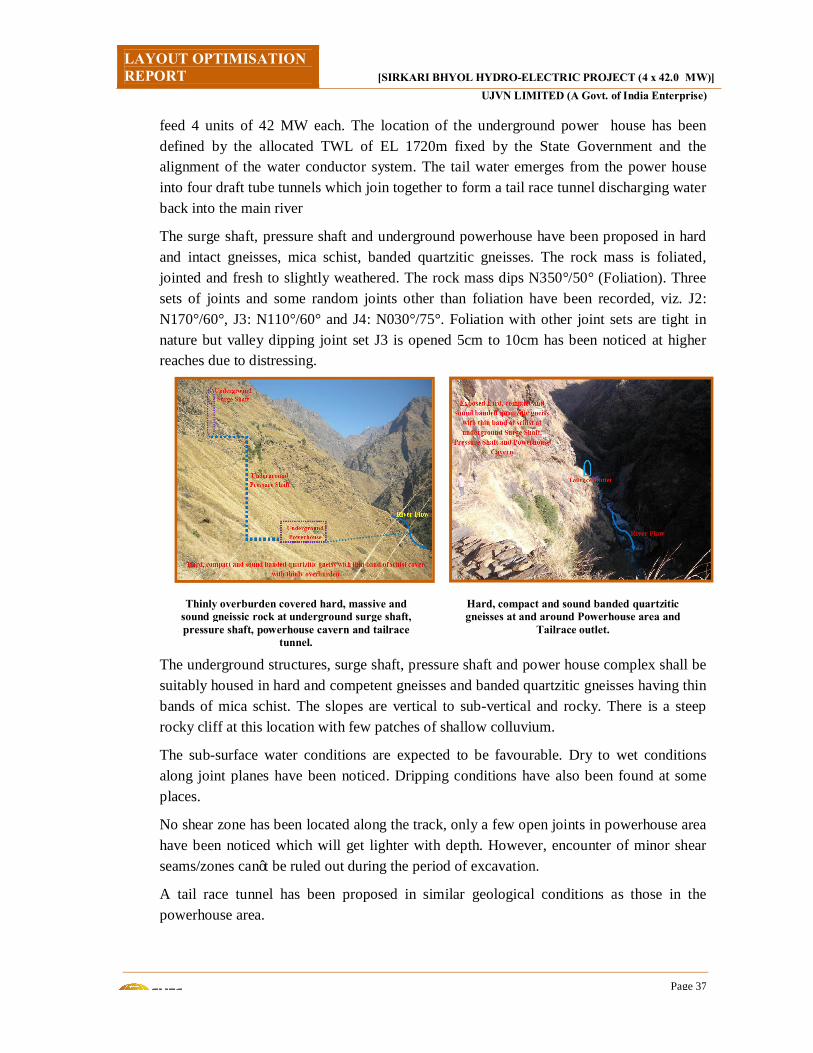
LAYOUT OPTIMISATION REPORT [SIRKARI BHYOL HYDRO-ELECTRIC PROJECT (4 x 42.0 MW)]
UJVN LIMITED (A Govt. of India Enterprise)
Page 37
feed 4 units of 42 MW each. The location of the underground power house has been defined by the allocated TWL of EL 1720m fixed by the State Government and the alignment of the water conductor system. The tail water emerges from the power house into four draft tube tunnels which join together to form a tail race tunnel discharging water back into the main river
The surge shaft, pressure shaft and underground powerhouse have been proposed in hard and intact gneisses, mica schist, banded quartzitic gneisses. The rock mass is foliated, jointed and fresh to slightly weathered. The rock mass dips N350°/50° (Foliation). Three sets of joints and some random joints other than foliation have been recorded, viz. J2: N170°/60°, J3: N110°/60° and J4: N030°/75°. Foliation with other joint sets are tight in nature but valley dipping joint set J3 is opened 5cm to 10cm has been noticed at higher reaches due to distressing.
The underground structures, surge shaft, pressure shaft and power house complex shall be suitably housed in hard and competent gneisses and banded quartzitic gneisses having thin bands of mica schist. The slopes are vertical to sub-vertical and rocky. There is a steep rocky cliff at this location with few patches of shallow colluvium.
The sub-surface water conditions are expected to be favourable. Dry to wet conditions along joint planes have been noticed. Dripping conditions have also been found at some places.
No shear zone has been located along the track, only a few open joints in powerhouse area have been noticed which will get lighter with depth. However, encounter of minor shear seams/zones can’t be ruled out during the period of excavation.
A tail race tunnel has been proposed in similar geological conditions as those in the powerhouse area.
Thinly overburden covered hard, massive and sound gneissic rock at underground surge shaft, pressure shaft, powerhouse cavern and tailrace
tunnel.
Hard, compact and sound banded quartzitic gneisses at and around Powerhouse area and
Tailrace outlet.
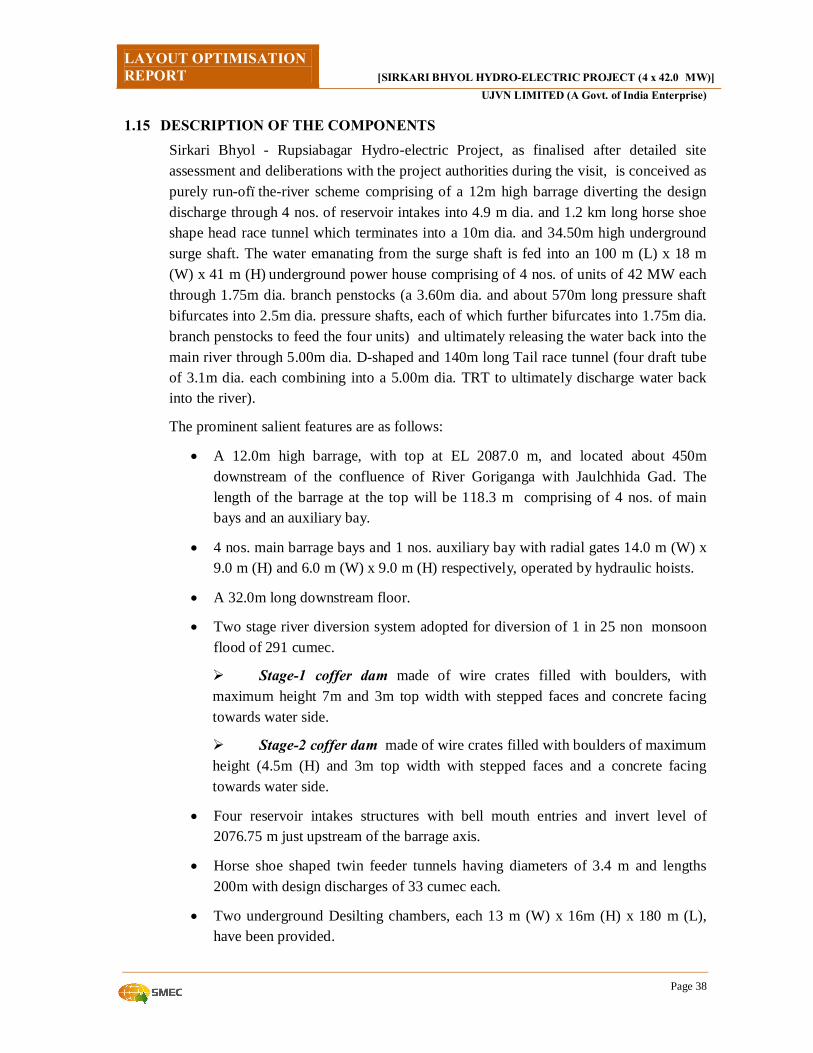
LAYOUT OPTIMISATION REPORT [SIRKARI BHYOL HYDRO-ELECTRIC PROJECT (4 x 42.0 MW)]
UJVN LIMITED (A Govt. of India Enterprise)
Page 38
1.15 DESCRIPTION OF THE COMPONENTS Sirkari Bhyol - Rupsiabagar Hydro-electric Project, as finalised after detailed site assessment and deliberations with the project authorities during the visit, is conceived as purely run-of–the-river scheme comprising of a 12m high barrage diverting the design discharge through 4 nos. of reservoir intakes into 4.9 m dia. and 1.2 km long horse shoe shape head race tunnel which terminates into a 10m dia. and 34.50m high underground surge shaft. The water emanating from the surge shaft is fed into an 100 m (L) x 18 m (W) x 41 m (H) underground power house comprising of 4 nos. of units of 42 MW each through 1.75m dia. branch penstocks (a 3.60m dia. and about 570m long pressure shaft bifurcates into 2.5m dia. pressure shafts, each of which further bifurcates into 1.75m dia. branch penstocks to feed the four units) and ultimately releasing the water back into the main river through 5.00m dia. D-shaped and 140m long Tail race tunnel (four draft tube of 3.1m dia. each combining into a 5.00m dia. TRT to ultimately discharge water back into the river).
The prominent salient features are as follows:
• A 12.0m high barrage, with top at EL 2087.0 m, and located about 450m downstream of the confluence of River Goriganga with Jaulchhida Gad. The length of the barrage at the top will be 118.3 m comprising of 4 nos. of main bays and an auxiliary bay.
• 4 nos. main barrage bays and 1 nos. auxiliary bay with radial gates 14.0 m (W) x 9.0 m (H) and 6.0 m (W) x 9.0 m (H) respectively, operated by hydraulic hoists.
• A 32.0m long downstream floor.
• Two stage river diversion system adopted for diversion of 1 in 25 non monsoon flood of 291 cumec.
Ø Stage-1 coffer dam made of wire crates filled with boulders, with maximum height 7m and 3m top width with stepped faces and concrete facing towards water side.
Ø Stage-2 coffer dam made of wire crates filled with boulders of maximum height (4.5m (H) and 3m top width with stepped faces and a concrete facing towards water side.
• Four reservoir intakes structures with bell mouth entries and invert level of 2076.75 m just upstream of the barrage axis.
• Horse shoe shaped twin feeder tunnels having diameters of 3.4 m and lengths 200m with design discharges of 33 cumec each.
• Two underground Desilting chambers, each 13 m (W) x 16m (H) x 180 m (L), have been provided.
LAYOUT OPTIMISATION REPORT [SIRKARI BHYOL HYDRO-ELECTRIC PROJECT (4 x 42.0 MW)]
UJVN LIMITED (A Govt. of India Enterprise)
Page 39
• 4.9m dia. and 1200m long Horse shoe shape Head race Tunnel. • 10m dia. and 34.50m high underground restricted orifice surge shaft. • A steel lined pressure shaft of 3.6m dia. bifurcating twice into the branch units
to ultimately feed 4 nos. of main units (3.6m dia. bifurcates into 2 nos. of 2.5 m dia. Each of which further bifurcates into 2 nos. of 1.75m dia. branch penstocks).
• Underground Power House complex of 168 MW (4x42 MW) located on right bank, each with vertical shaft Francis turbine. The Normal TWL is at EL 1721.25 m. The overall size of power house cavity is 100 m (L) x 18 m (W) x 41 m (H)and the Transformer hall cavity is 80 m (L) x 16.00 m (W) x 28m (H).
• A tail race tunnel having diameter of 5.0m D-shaped with normal tail water level of EL 1721.25m.
For general layout of the project area and L-section along alignment refer drawing nos. 1130-GEN-03_[A] and 1130-GEN-04_[A] respectively. The components of the project are briefly described below:
1.15.1 RIVER DIVERSION SYSTEM
Owing to the site topography and the presence of landslides on the left bank, it is planned to divert the river flows during construction of barrage works through a two stage coffering of the river section. The width available between the banks at the Barrage axis is about 118.3 m. Presently the river is flowing close to the right bank where intake structure is located. The diversion scheme shall be designed for 291 cumec, which represents the estimated 1 in 25 non monsoon flood.
In the stage-1 of diversion, river is partially blocked by constructing the longitudinal coffer dam and river flows through the left bank channel during which time concrete structures of intake, spillway crest and pier on the right can be built in the dry river bed area. During this stage, it is proposed to construct the extreme 2 right bays of the Barrage (which includes the auxiliary bay) located on the right bank. The river natural course, at present, is following the deep channel section located on the right bank of the river. A diversion channel has to be made initially for diverting the river towards the left bank so as to facilitate the construction of first stage coffer dam. The undisturbed left bank natural slope will act as the left bank of the diversion channel in stage 1 diversion. Seepage in the construction zone can be handled by a scheme of drains and pumping.
A longitudinal coffer dam with stepped cross section of length 254.50 m and maximum 7m height (with varying top) and made up of wire crates filled with boulders is proposed as the stage-1 coffer dam. The top width of the longitudinal cofferdam has been proposed as 3m. During this stage, flow conditions in the river in the affected reach are subcritical with flow velocities generally ranging from 1 to 5 m/sec with certain reaches in critical flow regime and a upper bound velocity of 5.55m/sec.

LAYOUT OPTIMISATION REPORT [SIRKARI BHYOL HYDRO-ELECTRIC PROJECT (4 x 42.0 MW)]
UJVN LIMITED (A Govt. of India Enterprise)
Page 40
In stage-2, river diversion is proposed through the extreme 2 right bays (a main bay and an auxiliary bay) in the spillway structure that have been constructed in the first stage. The construction of the balance section of the barrage comprising of 3 left bays is done during the second stage of river diversion which is protected by the second stage cofferdam in the non-monsoon season.
Stage-1 diversion is expected to be required for one lean season to facilitate construction of two extreme right bays and the intake structure. The need for stage-2 diversion for constructing the balance two number of barrage bays is expected for at least one lean season. However the exact requirement shall depend on the construction schedule.
The stage-2 coffer dam would be a combination of the finished spillway divide wall and stepped boulders filled in wire crates.
For river diversion system plan and sections for 1st and 2nd stage refer drawing nos. 1130-C-01_[A] to1130-C-05_[A].
1.15.2 BARRAGE
A diversion barrage is proposed to be constructed about 450m downstream of the confluence of River Goriganga with Jaulchidda gad near the place called Rargari, with intake structure proposed on the right bank. The width of the river at the diversion structure site is of the order of 77m. The main diversion structure is proposed as a barrage structure of 118.3m width at the top with a ponding level of 2084.0m and a design heading up of 9.0m above the river bed level (RBL 2075.0m). The MDDL of the scheme is proposed as 2082.0m to provide for operational flexibility after allowing for necessary submergence requirements of the power intake. The proposed maximum water level in the reservoir is 2084.9m for the design flood corresponding to Standard Project Flood (SPF). The rest of the river width is proposed to be bridged by compacted earthfill which is demarcated from the barrage structure by the upstream and downstream left training walls. The barrage with a stilling basin arrangement is aligned in the natural course of the river which is flowing towards the right bank so as to avoid the disturbance of the landslides on the left bank. The reservoir formed with this configuration extends to a stretch of about 300 m upstream at FRL and about 240 m at MDDL.
The topography of the area allows for a gross storage of 0.14 MCM at FRL and a live storage of 0.05 MCM between FRL and MDDL. The diversion barrage is proposed as a free flow surface spillway comprising of 4 numbers of main bays of 14(W) m x 9(H) m which includes one bay for inoperative condition alongwith an additional auxiliary bay of 6(W) m x 9(H) m. The auxiliary bay has been provided to pass the normal monsoon flows which would also take care of flushing the deposited silt in front of intake. This auxiliary spillway has also been provided with a flap gate at the top of the spillway gate to regulate the flows during the lean season. A divide wall has also been planned between the bays (main) no. 2 and 3 for facilitating isolated flushing of sediment
LAYOUT OPTIMISATION REPORT [SIRKARI BHYOL HYDRO-ELECTRIC PROJECT (4 x 42.0 MW)]
UJVN LIMITED (A Govt. of India Enterprise)
Page 41
deposited in the near vicinity of the intake and also to channelize the normal monsoon spills towards the right bank.
The upstream floor elevation of the barrage structure is proposed at 2075.0 m same as the crest of the barrage at EL 2075.0. The invert of the Power intake is proposed at an elevation of EL 2076.75 m, with a weir before the bell mouth entrance with its top at EL 2079.0m i.e. 4.0m above the barrage floor level.
The power intake arrangement is proposed to be abutted in perpendicular direction to the barrage axis at the right bank. The power intakes feed four intake tunnels of 2.5m diameter horse- shoe shape.
Design Criteria • To create pondage or heading up upstream with gates closed condition so as to
create a reservoir of adequate hydraulic parameters for diversion of flow in the lean season.
• The barrage structure is designed to cater to a flood of 2742 cumecs (SPF - one bay inoperative) within a minimum permissible afflux.
• To conform safety against sliding, piping and overturning and against upstream flooding.
• To protect the barrage structure safe against possible scouring at both upstream and downstream.
• To conform safety of the barrage structure against surface flow and sub-surface flow for various conditions of flow
Design Assumptions • The barrage structure is proposed to be designed as a gravity structure founded on
permeable foundation.
• The orientation of the barrage axis has been fixed so that the fairly uniform distribution flow both under normal and flood discharge conditions could be achieved throughout all the bays.
• For sub-surface flow, a bed retrogression of 0.3 m for the design flood discharge and 1.5 m for the river stage at Pond level.
• A flood discharge concentration of 20% has been considered
• Downstream slope of glacis has been provided at 3(H) : 1(V)
• A safe exit gradient of 1 in 5 has been considered for determining the impervious floor length in conjunction with downstream cut-off.
• For computing the scour, silt factor 4 has been adopted.
LAYOUT OPTIMISATION REPORT [SIRKARI BHYOL HYDRO-ELECTRIC PROJECT (4 x 42.0 MW)]
UJVN LIMITED (A Govt. of India Enterprise)
Page 42
Design Parameters A design flood discharge of 2,742 cumec based on SPF has been adopted for designing the waterway and superstructure of the barrage. Though as per IS 11223, the proposed barrage is categorised as a Small Dam which has to be designed for 1 in 100 year flood. However, a judicious and well informed decision has been taken knowingly to design it as a Medium dam for SPF due to the heavy floods which occurred in June,2013 and which may have been close to SPF as per our information. It has also been ensured that the PMF (3645 cumec) passes though spillway under all gates operative condition with adequate freeboard. The energy dissipation arrangement has been designed for a flood of 1102 cumec corresponding to the return period of 1 in 100 years.
A rating curve has been prepared with the Manning’s formulas using the latest cross-section of the river. The average slope of the river is 1 in 20 and the value of rugosity coefficient adopted is 0.04 (Recommended by IS 2912 for boulder reaches).
Waterway and Barrage layout The headworks is proposed as a barrage type of structure aligned in the deepest natural river course. The barrage width has been contemplated so as to pass the design inflow flood safely. Four main barrage bays of 14(w) m x 9(h) m including one bay for inoperative condition ) and an auxiliary bay of 6(w) m x 9(h) m have been proposed which are separated by 4m thick piers. Thus the total width of barrage at top is 118.3m. The spillway capacity for the auxiliary bay is 340 cumecs. The coefficient of discharge adopted is 2.0 with due consideration given to drowning effect during design flood condition.
From the cross-sections of the river at the proposed barrage site, it is seen that the deepest bed level of the river is around EL 2075.0 m. The crest level of all spillway bays is proposed to be kept at 2075.0 m i.e., at the river bed level. To facilitate the flushing of the river bed load, if accumulated in front of the intake, two extreme right bays including the auxiliary bay will have to be operated with the objective of flushing through intermittent operation. However, systematic operation of all spillway bays will have to be balanced for the flushing of the silt deposited in the reservoir The spillway bays are provided with 14(w) m x 9(h) m radial lift gates. The upstream floor of the barrage is proposed at an elevation of 2075.0m which is the river bed elevation at the considered section. The height of the structure is proposed as 12.0m with the top elevation of 2084.0m and a freeboard provision of 2.1m above the MWL.
The total floor length of the barrage is proposed as 61.0 m, with 17 m as the upstream floor length, and a 32.0m long stilling basin with a floor elevation of 2072.0m at the glacis toe provided from hydraulic jump considerations. The stilling basin has been tapered slightly with a downward slope and an elevation of EL 2071.15m at the end of basin. This slope has been provided to guide the flow uniformly in view of the steep slope in the river and also to reduce the thickness based on residual seepage head criteria.

LAYOUT OPTIMISATION REPORT [SIRKARI BHYOL HYDRO-ELECTRIC PROJECT (4 x 42.0 MW)]
UJVN LIMITED (A Govt. of India Enterprise)
Page 43
The downstream glacis is provided in a slope of 1(V):3.0(H) and 10/ 6m deep cut-offs have been provided at the upstream and the downstream end of the floor respectively for reducing uplift pressures and exit gradient as well as to provide protection against scour,
The stilling basin has the provision of an end sill with top elevation 2073.20m which is at the natural river bed level at that location. Flexible protection on the upstream and downstream of the barrage is proposed with cast-in-situ concrete blocks and launching apron.
Riparian pipes with flow regulating valves have been provided in the piers to pass the environmental flows as stipulated by the MoEF guidelines.
Guide walls both on the upstream and downstream are proposed to ensure proper hydraulically streamlined flow. The waterway thus provided is as follows:
S.No. Description Magnitude 1. 4 main spillway bays of 14 m each = 56.0 m 2. 1 auxiliary bay of 6 m = 6.0 m 3. 6 Nos. of piers of 4.0m thick each = 24.0 m
Total width between abutments = 86.0 m The looseness factor with above waterway works out to 0.340. For barrage layout plan, L-section and cross sections refer drawing nos. 1130-C 06_[A] to 1130-C 10_[A]. For Barrage complex layout plan refer drawing no. 1130-GEN 05_[A].
1.15.3 INTAKE STRUCTURE
Four numbers of power intake (Intake-1, Intake-2, Intake-3 and Intake-4) with invert elevation of 2076.75 m and gate sizes of 2.5 m (W) x 2.5 m (H) are proposed on the right bank of river just upstream of the barrage to divert water to the power house for generation of power.
In order to avoid deposition of sediments in front of the intakes, intake structure has been located within the influence (zone) of the barrage bays. These are located about 10m upstream of the barrage axis inclined perpendicular to it. The crest level (weir) at intake is EL. 2079.0 m i.e., 4 m above the barrage sill level. The maximum withdrawal of water for power through intake including 10% of overload discharge and 15% flushing discharge is 16.50m3/sec for each intake. The geological section at the intake indicates that intake portal can be located in competent rock within a reasonable reach. The 11.75 m high structure built into the abutment rock will be a framed concrete tower accessible from barrage top at EL 2087.0 m to ensure that the intake structure is always accessible by road.
Trash racks will be provided ahead of the bell mouth entry to prevent floating debris entering the headrace tunnel. Trash removal will be done by a mechanically operated

LAYOUT OPTIMISATION REPORT [SIRKARI BHYOL HYDRO-ELECTRIC PROJECT (4 x 42.0 MW)]
UJVN LIMITED (A Govt. of India Enterprise)
Page 44
TRCM located at the top of the intake structure. Each intake consists of an external structure with steel trash rack having sizes 3.5 m(W) x 4.18 m (H) x 2 openings for each intake supported by R.C.C. piers extending from EL 2079.0m to EL 2087.0. A top slab provided at EL.2087.0m will be used as an operating platform for maintenance and cleaning of trash racks.
Steel trash rack consists of a set of 10mm thick M.S. flats trash bars arranged parallel to each other with a gap of 75mm between two flats. These are supported by a frame of M.S. channels. This will allow only material of 75mm and below size along with water. Maximum 30% clogging of trash rack area as per IS 11388:1995 (varies from 25%-50%) is assumed. The velocity of water through the trash rack at the design discharge assuming a clogging of 30% shall be as follows:
Velocity corresponding to design discharge per intake 16.5 m3/s including 10% of overload discharge and 15% flushing discharge– 1.01 m/s, which is below the maximum permissible velocity of 1.5m/sec.
For power intake layout plan, upstream elevation, L-section refer drawing nos. 1130-C 11_[A] to 1130-C 12_[A] respectively.
On the basis of hydrological studies, it is estimated that in non-monsoon period all the discharge of Goriganga River at the barrage will be diverted to the headrace tunnel. Only aquatic flow shall be released through barrage as mandatory releases. Since the project is planned to operate as a run of the river station, the inflow as coming in the river during non monsoon period shall be diverted through HRT for continuous generation. However, during monsoon period, surplus discharge will be released through the gates, over and above diverting design discharge through intakes (including overload and silt flushing discharge).
Anti Vortex Provisions The minimum submergence depth provided for the intake is 4.0m from the centre of tunnel giving h/D ratio 1.60 which is more than the minimum required h/D of 1.56. This is considered sufficient and no air entraining vortices are likely to be formed at the intake.
Main Features of Intake Structure
PARAMETERS DETAILS Shape Bellmouth
No. 4
Maximum Design Discharge Intake-1 – 16.5 cumec,
Intake-2 – 16.5 cumec,

LAYOUT OPTIMISATION REPORT [SIRKARI BHYOL HYDRO-ELECTRIC PROJECT (4 x 42.0 MW)]
UJVN LIMITED (A Govt. of India Enterprise)
Page 45
Intake Tunnel/ Feeder Tunnel Water passing through the trash rack enters the intake tunnels (4 nos.) through a bell mouth and a transition to rectangular shape size 2.5m x 2.5m in the vicinity of gate. Intake gates of size 2.5m x 2.5m are provided in each intake with provision for stop log gates upstream. These 4 nos. of horse shoe shape intake tunnels merge to form two feeder tunnels of 3.4 m dia. horse shoe shape with lengths 200 m each up to the desilting basin. As per the geological inputs, the entire length of these tunnels is expected to be excavated in gneisses and mica schists.
The tunnel is provided with 200 mm thick cement concrete lining for smooth flow of
Intake-3 – 16.5 cumec,
Intake-4 – 16.5 cumec
(Each considering 10% overload discharge and 15% flushing discharge)
Full Reservoir Level (FRL) 2084.0m
Maximum Water Level (MWL) 2084.90m
Minimum Drawdown Level (MDDL) 2082.00m
Intake Structure Height 11.75m
Top Level of Structure EL.2087.0 m
Invert level of Intake EL.2076.75 m
Trash rack in each intake
Intake -1 - 3.5m (W) x 4.18m (H); 2 openings
Intake -2 - 3.5m (W) x 4.18m (H); 2 openings
Intake -3 - 3.5m (W) x 4.18m (H); 2 openings
Intake -4 - 3.5m (W) x 4.18m (H); 2 openings
Bottom Level of Trash racks EL.2079.0 m
Emergency / Service Gate Opening Size
Intake 1- 2.5m (W) x 2.5m (H)
Intake 2- 2.5m (W) x 2.5m (H)
Intake 3- 2.5m (W) x 2.5m (H)
Intake 4- 2.5m (W) x 2.5m (H)

LAYOUT OPTIMISATION REPORT [SIRKARI BHYOL HYDRO-ELECTRIC PROJECT (4 x 42.0 MW)]
UJVN LIMITED (A Govt. of India Enterprise)
Page 46
water. The design discharge per intake including silt flushing and overloading is 16.5 cumec. Maximum velocity through the 3.4m dia. tunnel is 3.15m/sec ( including silt flushing and overload discharge).
1.15.4 DESILTING BASIN
Desilting chamber has been provided in the water conductor system for eliminating particle size of 0.2 mm and above during monsoon months. A twin desilting chamber layout has been adopted which will enable continuous operation for power generation. During sediment flushing and when one of the chambers is out of service for maintenance at least 50% capacity can be in operation.
Sediment will be continuously flushed under the pressure of the reservoir head and discharged into the river downstream of the dam. The crown of the desilting chamber is at EL 2077.98m which is about 4 m below MDDL and the desilting chamber is always pressurized.
The two underground desilting chambers are 180 m length, 13m wide and 16m high. The design discharge through each chamber is 33.0 m3/sec inclusive of 15% for silt flushing. The velocity through the chamber has been kept about 0.28m/sec and smooth flow without turbulence is considered to obtain over 92% efficiency for removal of silt particles of size 0.2mm and above. Discharge from the two desilting chambers for power generation is collected into one tunnel at the end and it becomes head race tunnel. A gate is provided at the end of each desilting chamber so that individual chambers can be emptied after closing of the gates on either side for maintenance purposes. The gates are operated from a common gate chamber 6.0m (W) x9.0m (H) at EL.2087.98m.
To facilitate flushing of the sediment settled and carry away the silt laden discharge from the desilting chamber, a flushing duct has been provided at the end. The velocity in the flushing duct is kept sufficiently high for satisfactory flushing. To facilitate continuous flushing during monsoon season and intermittent flushing during non monsoon season, flushing gates are provided which can be partially opened or fully closed in each chamber.
The shape of the desilting chamber is provided in such a manner that the sediment can easily pass into the flushing conduit at the bottom by sliding over hopper bottom. Sufficient numbers of holes are provided in the slab at the top of the flushing conduit to pass the settled silt and flushing water into the conduit.
The flushing discharge during monsoon and non monsoon season from the flushing duct of each sediment chamber will be regulated by a bonnet type gate. The silt flushing gates will be operated from EL. 2066.98 m from another gate chamber.
The silt laden water from each flushing duct is collected in one 2.5m D shaped silt flushing tunnel (1.50m x 1.50m finished) with its invert at EL.2025.0 at outfall (15m above the river bed level) to flush the discharge of 7.9m3/sec back to river after
LAYOUT OPTIMISATION REPORT [SIRKARI BHYOL HYDRO-ELECTRIC PROJECT (4 x 42.0 MW)]
UJVN LIMITED (A Govt. of India Enterprise)
Page 47
necessary energy dissipation. The length of the silt flushing tunnel is 450m. The design velocity through the silt flushing tunnel is 3.5 m/sec at a bed slope of about 1 in 15.0. 400m thick high performance abrasion resisting concrete lining throughout the length of silt flushing tunnel is proposed.
Since the length of desilting chambers is more therefore, 6m dia. D shaped top and bottom construction adits of lengths 340m and 230m at EL 2071.98m and EL 2061.98m respectively have been provided to facilitate their construction. Access to the desilting gate chambers and the silt flushing gate chamber will be provided through a 6m dia. D shaped combined access tunnel starting from the approach road on the right bank at the barrage site with portal invert at EL 2088.0m. The combined length of these two access adits is 553m.
For disilting chamber layout plan, L-section and cross sections refer drawing nos. 1130-C 13_[A] to 1130-C 14_[A].
1.15.5 HEAD RACE TUNNEL
The headrace tunnel starts from the downstream end of the desilting chamber connecting the surge shaft. The average slope of the tunnel will be 1:91.26which will facilitate drainage during construction and maintenance work.
Tunneling media shall comprise gneiss, mica schist, quartzite bands and rarely thin marble and basic intrusion of Salkhala group bands.
The tunnel will be plain concrete lined over its entire length to reduce friction and ensure smooth flow and prevent any material/rockfall into the system. A lining thickness of 350 mm with nominal reinforcement in poor reaches has been adopted.
HRT is 1200 m long with 4.9 m diameter horse shoe-shape tunnel. The maximum rock cover comes out to be about 750 m at about 1067 m from the start of HRT which may pose high pressure problems including squeezing but they can be tackled adequately with the support systems. Overall tunnelling media is anticipated to be tolerable..
Design Parameters
1. Design discharge = 52.9 m3/sec
2. Length = 1200 m
4. Full Reservoir Level (FRL) = EL.2084.00m
5. Minimum Draw Down Level (MDDL) = EL.2082.00m
6. Centre line of tunnel at start = EL. 2077.86 m
7. Centre line of tunnel at junction with surge shaft= EL. 2063.45 m 8. Cross sectional Area = 19.91m2
9. Hydraulic radius = 1.24m (A/P =19.91/16)
LAYOUT OPTIMISATION REPORT [SIRKARI BHYOL HYDRO-ELECTRIC PROJECT (4 x 42.0 MW)]
UJVN LIMITED (A Govt. of India Enterprise)
Page 48
11. Average velocity = 52.9/19.91 = 2.65 m/sec
12. Maximum upsurge level at surge shaft = 2097.98m
13. Minimum down surge level at surge shaft = 2070.58m
14. Overt of tunnel at junction with surge shaft = 2065.90 m
15. Average Bed slope of tunnel = 1 in 91.26m
1.15.6 SURGE SHAFT
An underground restricted orifice surge shaft 10 m diameter from EL 2066.0 to EL 2100.50 m ( height 34.5m) has been proposed at the end of the headrace tunnel. To limit the maximum and minimum surge level, a restricted orifice of 2.80 m diameter is provided. Size of the orifice and size of the surge shaft as proposed are based on Thoma’s criterion for incipient stability as per IS 7396 (Part-I). Maximum up surge and down surge levels have been computed which works out to EL. 2097.98m & EL. 2070.58m respectively. The surge shaft has been proposed in hard and intact gneisses, mica schist, banded quartzitic gneisses. The excavation will not pose problem with controlled blasting and timely support. Support elements shall mostly include rock bolting and shotcreting during construction.
Design Objective
- Conversion of kinetic energy on load rejection into potential energy leads to water hammer effect in the penstocks and the pressure wave travels up and down. This pulsation should be absorbed and prevented from entering the Head race tunnel. The flow from the head race tunnel needs to be absorbed in case of load rejection and, supply immediate water demand in case of load acceptance when the tunnel flow is static or during load changes as the case may be, to meet up the very short term changes in water flow variations of the turbine.
Design Criteria
- Surge shaft must have sufficient cross sectional area to prevent unstable water level oscillations caused due load change in turbine,
- Surge shaft should be located within a distance of 5 times the head from the house.
- Surge shaft should be of sufficient height to contain maximum upsurge level unless an overflow spillway is provided.
- Surge shaft bottom should be low enough so that during it should not drain and admit air into the pressure shaft/turbine.
- Provide for or absorb the very short term flow changes resulting from load changes/discharge in the turbine.

LAYOUT OPTIMISATION REPORT [SIRKARI BHYOL HYDRO-ELECTRIC PROJECT (4 x 42.0 MW)]
UJVN LIMITED (A Govt. of India Enterprise)
Page 49
Operating Conditions
Various operating conditions considered for estimation of upsurge and down surge are as follows.
For Maximum up surge level: i) Full load rejection at FRL (110-0-0). ii) Full load acceptance at FRL with 25 seconds intervals for 50% and 100% followed
by full load rejection at maximum positive velocity in HRT (0-50-100-0). For Minimum Surge Level: i) Load acceptance at MDDL (0-100-100) by ramping up load for units one by one @
1 MW/s. ii) Full load rejection at MDDL followed by load acceptance at the instant of maximum
negative velocity in HRT (100-0-100) by ramping up load for units one by one @ 1 MW/s.
Parameters For Design
1. Length of headrace tunnel = 1200 m
2. Diameter of headrace tunnel = 4.9 m
3. Design discharge = 52.9 m3/sec
4. Cross sectional area of HRT = 19.91m2
5. Cross sectional area of Penstock = 9.62 m2
6. Length of Penstock (Up to Bifurcation) = 570.0m
7. Rated head on turbine = 352.08m
8. Installed capacity = 4 x 42 MW
9. Full reservoir level = EL. 2084.00m
10. Tail water level (Normal) = EL. 1721.25 m
11. Diameter of surge shaft orifice = 2.80 m
12. Diameter of surge shaft = 10 m For surge shaft layout plan and sections refer drawing no. 1130-C 15_[A].
1.15.7 PRESSURE SHAFT
One pressure shaft of 3.6 m diameter has been provided from the surge shaft with centre line at EL 2062.80 m leading to an underground Butterfly Valve chamber. The initial stretch of about 30 m of pressure shaft is horizontal. The pressure tunnel is provided with 500mm thick M-20 concrete View of surge shaft and penstock
alignment showing hill slopes.
LAYOUT OPTIMISATION REPORT [SIRKARI BHYOL HYDRO-ELECTRIC PROJECT (4 x 42.0 MW)]
UJVN LIMITED (A Govt. of India Enterprise)
Page 50
backfill between the steel liner and rock. Thereafter, the pressure shaft leads to an underground Butterfly valve chamber (BVC). After the BVC, it takes a 900 bend and becomes vertical . For the ease and the faster construction, the vertical pressure shaft has been split into two parts by introducing a horizontal limb of about 150m at EL 1886.4. The bottom horizontal limb is provided at EL 1715.25m which continues up to the first bifurcation. The entire length of pressure shaft upto the 1st bifurcation is 570m. Each branch pressure shaft (2.5m dia. each) after the 1st bifurcation further bifurcates into two smaller branch penstocks (1.75m dia. each) to feed 4 nos. of units of 42 MW each.
The steel liner thickness varies from 20 mm to 34 mm. The steel liner will be fabricated from ASTM 537 Class II Steel for the upper vertical limb and ASTM 517 Gr.A Steel for the lower vertical limb.
Main Pressure Shaft / Surface Penstock Design Parameters:
1. Penstocks 1 no of 3.6 m dia.
2. Gross head 362.08 m
3. Design net head 352.08 m
4. Combined Turbine-Generator efficiency
92.0%
5. Design discharge per unit 13.225 cumec
6. Rated power of turbine 42 MW
7. Full reservoir level (FRL) 2084.00 m
8. Minimum operating level(MDDL) 2082.00 m
9. Maximum water level (MWL) 2084.90 m (PMF)
10. Grade of steel
ASTM 537 Class II/ ASTM 517 Gr.A
11. Minimum Ultimate strength of steel 5600/8110 kg/cm2
12. Minimum Yield stress 4230/7040 kg/cm2
13. Allowable stress (under normal condition)
1866.67/2650 kg/cm2
14. Joint efficiency 0.9
For L-section along pressure shaft and liner details refer drawing no. 1130-C 16_[A].
1.15.8 BUTTERFLY VALVE HOUSE
Butterfly Valve house is provided for maintenance works in the system located
LAYOUT OPTIMISATION REPORT [SIRKARI BHYOL HYDRO-ELECTRIC PROJECT (4 x 42.0 MW)]
UJVN LIMITED (A Govt. of India Enterprise)
Page 51
downstream of the surge shaft in unforseen conditions when the surge shaft gate cannot be lowered. The size of the valve house is 17.0 m x 11.0 m and total height will be 16.60m. A crane of capacity 10/5 Tons has been provided in the valve house for installation / repair of the valve.
1.15.9 UNDERGROUND POWERHOUSE
The general arrangement of underground powerhouse complex comprises of, machine hall cavern, transformer hall cavern, draft tube chamber and various access & construction tunnels.
The location of Power House complex is decided on the basis of geological mapping ground coverage depth and with respect to pressure shaft, and tailrace setting.
The cross section of the powerhouse cavern is proposed to be 100.00m (L) x 18.00m (W) x 41.00m (H). The units are spaced at 13.0 m centre to centre and 20.0 m long service bay at EL 1728.0 m will be located at one end and 20.0 m long control block at the other end. The centre line of turbine is at EL 1717.0 m, 3.25 m below minimum TWL 1720.25. The deepest level is EL 1708.0 m and highest roof arch level is at EL 1749.0 m. The Power house is provided with four floors, MIV floor at EL 1714.20 m, Turbine floor at EL 1719.50 m Generator floor at EL 1723.50 m and Machine hall floor at EL 1728.0 m same as service Bay. A crane beam is provided at EL 1738.0 for supporting Gantry crane of capacity 150 Tons with auxiliary hooks of capacity 25/5 Tons.
Control block comprises four floors at EL 1723.50 m, EL 1728.00 m, EL 1732.50 m, & EL 1738.00. This houses control room, LT Room, Battery and charger room, Ventilation room and other auxiliaries.
Two numbers of three phase transformers are located in an adjacent cavern about 35 m downstream of Powerhouse cavern. The size of Transformer cavern is 16.0 m (W) x 80.0m (L) x 28.0 m (H). The Transformers will be placed at EL 1734.0 m and connected to Powerhouse by four bus duct galleries (one for each generating unit) of size 5.0m dia. D shape and accommodated in 35m distance from Machine hall floor at EL 1728.0 m. The buses running from the generator to the transformer will be installed in these bus duct tunnels. To contain the smoke and flames in case of fire, fire proof doors will be installed at the main access to the transformer hall and bus bar tunnels. The transformer halls will be separated by concrete firewalls.
The Transformer Cavern will have GIS at EL 1734.0 m. An E.O.T. crane of capacity 10-Tonne will operate to handle GIS units on crane rails supported on crane beam at EL 1754.0m.
The underground Transformer cavern service bay level (EL 1734.0m) is approachable by an 8m D-shaped and 570m long, access Tunnel with portal invert at EL 1763.0m from

LAYOUT OPTIMISATION REPORT [SIRKARI BHYOL HYDRO-ELECTRIC PROJECT (4 x 42.0 MW)]
UJVN LIMITED (A Govt. of India Enterprise)
Page 52
which separate tunnel 8m D-shaped and 264m long would be emanating to facilitate construction of the underground Powerhouse cavern reaching at its service bay level (EL 1728.0m). A 6m D-shaped and 156 m long construction tunnel at EL 1743.0m is planned to reach roof arch of underground Powerhouse cavern emanating from the transformer cavern access tunnel. This tunnel will be later converted into ventilation tunnel. A separate 6m dia. D shape 264m long construction tunnel is provided at EL 1757.0m is planned to reach roof arch of underground transformer cavern. A separate 6m dia. D shape, 390m long adit is provided from MAT which will go down to penstock level at EL 1715.25m for excavation of lower horizontal branch of tunnel, erection of steel liners and bifurcation piece in the tunnel.
Related facilities of power house such as access tunnel for transporting electrical equipment, cable tunnel for connecting cable to overhead pothead yard etc. have been planned to suit the site condition and future construction and operation activities.
For Power house machine hall floor plan, cross section and L-section refer drawing nos. 1130-C 17_[A], 1130-C 18_[A], 1130-C 19_[A] respectively. For Power house complex layout plan refer drawing no. 1130-GEN 06_[A].
1.15.10 TAIL RACE TUNNEL
The tail waters from the 4 main units in the underground Powerhouse discharge into 4 draft tube tunnels of sizes 3.1m dia. D-shape. The length of draft tube tunnel from power house end to gate shaft below transformer cavern is about 50 m where vertical lift gates of sizes 2.90 m (W) x 3.10 m (H) will be installed and operated by Rope drum hoists from the transformer cavern itself. The invert level at gate shaft is EL 1711.50. After gate shaft, the draft tube tunnels combine together to form a 5.0m D shape 140m long TRT to discharge the flow back into the river.
The tail race tunnels are designed as pressure tunnels with invert EL. 1716.40 at the gate location followed by a reverse slope of 1:3 to meet the river bed at EL 1720.0m. A project road has been proposed up to the TRT outfall location to facilitate the construction.
PARAMTER TRT-4
Design discharge 52.9 m3/sec
Length 140m
Flow condition Pressurized
Shape and size 5.0m dia. D shaped
Full reservoir level (FRL) 2084m
Maximum TWL at outfall (PMF) EL 1732.50m
LAYOUT OPTIMISATION REPORT [SIRKARI BHYOL HYDRO-ELECTRIC PROJECT (4 x 42.0 MW)]
UJVN LIMITED (A Govt. of India Enterprise)
Page 53
Maximum TWL at outfall (SPF) EL 1730.25m
Normal TWL EL 1721.25m
Minimum TWL EL 1720.25m
1.16 LAND REQUIREMENT The proposed project will include acquisition of forest land (Unclassified State Forest) on temporary as well as permanent basis. The total land requirement for Sirkari Bhyol-Rupsiabagar HEP works out to approx. 30 hectares.
1.17 POPULATION AFFECTED BY PROJECT In Sirkari Bhyol-Rupsiabagar HEP, the impact is mainly envisaged as loss of customary rights of community over the Un-classed Forests. A total of around 30 hectares of land will be acquired for construction of various components of hydro project. The land to be acquired is identified as Un-classed State Forest (USF) over which the communities enjoy their customary rights.
Since, the height of diversion barrage is not much (12m high), it will result in a submergence of 0.03 ha area with the reservoir extending less than a km upstream of barrage axis which is not affecting any villages. There is no major habitation coming in the submergence area.
Employment Opportunity for the local people would increase both during the construction and after commissioning of the project. This would augment family income for most of the people and expand the scope for expansion of trade and business activities.
1.18 ENVIRONMENTAL ASPECTS The proposed reservoir would lead to submergence of about 0.03 ha of land with FRL at 2084 m in Goriganga river catchment. Most of this area comes under forest land.
The proposed Sirkari Bhyol-Rupsiabagar HE Project is designed as A- category project as per EIA Notification (14th September, 2006 & 01st December, 2009) under Environmental (Protection) Act, 1986 and required to carry out Environmental Impact Assessment (EIA) study, as per approved TOR by Expert Appraisal Committee (EAC) of Ministry of Environment & Forests (MOEF) for obtaining Environmental Clearance.
1.19 INTER-STATE / INTERNATIONAL ASPECTS There are no Inter-state aspects of territory, property etc. coming under submergence, oustees, rehabilitation, compensation, sharing of waters, sharing of benefits and costs involved in this project.

LAYOUT OPTIMISATION REPORT [SIRKARI BHYOL HYDRO-ELECTRIC PROJECT (4 x 42.0 MW)]
UJVN LIMITED (A Govt. of India Enterprise)
Page 54
There are no Inter-national aspects involved with this project. The project has been planned based on the flows observed in India for the periods June 1977 to May 2009.
1.20 DEFENCE ANGLE There is no defence angle involved in this project. The project area does not affect any defence purposes and therefore no such clearances are required.
1.21 COST & BENEFITS The project is estimated to cost Rs. 1233.79 crores including IDC and Financing charges at Feb, 2014 price level. The preliminary cost estimate of the project has been prepared as per guidelines of CEA / CWC. The breakdown of the cost estimates is given below.
Civil works including HM: Rs. 554.04 crores Electro Mechanical works: Rs. 266.88 crores
Total Basic Cost including Direct and Indirect Charges: Rs 833.23 crores Interest during Construction: Rs. 214.03 crores
Escalation: Rs. 177.89 crores
Total Cost including IDC, Escalation and Financing Charges: Rs 1233.79 crores
As indicated above, Sirkari Bhyol-Rupsiabagar HE project, with an estimated cost of Rs. 1233.79 crores (including IDC, escalation and financing charges) and design energy of 662.08 GWh in a 90% dependable year, is proposed to be completed in a period of 54 months (excluding pre-construction and other activities. The pre-construction period is taken as 12 months)
The cost of generation on levellised cost basis over a 35-year period works out to Rs. 4.23 per kwh, at 90% dependable year.
The capital structure of the project is proposed to have 70% Loan Component and 30% Equity Component. Alternative debt-equity ratio will be explored during financing. Financing Costs are taken at 1% of debt. The tariff has been worked out considering a debt-equity ratio of 70:30, and annual interest rate on loan at 12.25%. 12% of energy will be given as free power to Home State with 1% extra for Local Area Development. The levelised tariff for 35 years works out to Rs. 4.23/ kWh & Rs. 3.77 / kWh respectively for 90% dependable year and 50% dependable year respectively.
1.22 CONSTRUCTION PROGRAMME Sirkari Bhyol- Rupsiabagar HE project is proposed to be completed in a period of 54 months (excluding pre-construction and other activities. The pre-construction period is taken as 12 months). The project would afford generation of annual energy of 662.07 GWh at the power house busbars in a 90% dependable year. The basic cost, per MW installed, works out to Rs. 4.96 crores.