sip file
TRANSCRIPT
A
Summer Internship Project
On
MAHINDRA AND MAHINDRA OF “Ratio Analysis ” With Reference of Sidhhivinayak Motors
Pvt. Ltd.
Submitted toGujarat Technological University
Under the Guidance of
Ms. Rutu padhiyar(Professor)
In partial Fulfillment of the Requirement of the award of the degree ofMaster of Business Administration (MBA)
Offered byGujarat Technological University
Ahmedabad
Prepared by:KETAN M. ZALA
MBA (Semester – 2) July- 2015
DECLARATION
I, following Mr. KETAN MAHESHBHAI ZALA , hereby declare that the
summer internship project report titled “RATIO ANALYSIS in is a result of my own
work and Sidhhivinayak Motors Pvt. Ltd. Indebtedness to other work publications,
reference, if any, have been duly acknowledged. If I am found guilty of copying any
other report or published information and showing as my original work, I understand
that I shall be liable and punishable by GTU, which may include ‘Fil in examination,
‘Repeat study & re-submission of the report’ or any other punishment that GTU may
decide.
Enrollment no. Name Signature

PREFACE
Practical training plays an important role in the field of
education. In each and every field of life, practical study is necessary. Theoretical
knowledge isn’t enough.
Education policy adopted practical training been introduced
for the students along with the theoretical study. This helps the students to make their
future better and also gives them a chance to show their skills and abilities.
In today's competitive environment, time plays a critical role.
A famous idiom,” Time once lost cannot be recovered. “So I have prepared this report
on the basis of practical training undertaken a' siddhivinayak motors pvt. Ltd.' Gondal
road, Near Rajkamal Petrol Pump, RAJKOT- 360004.
ACKNOWLEDGEMENT
I am glad to take this practical training
SIDHHIVINAYAK MOTORS PVT. LTD. RAJKOT. Which integral part in our real life
by helping us in improving our knowledge, skill,etc.
I am thankful to prof. RUTU PADHIYAR for
assinging me the project which has created interest to me for management of business
& even thankful to MR. Rajesh Sampat for allowing me to visit his company.
I personally want to thanks my parents and my friends
who have directly or indirectly has helped me in preparing the project report.
TABLE OF CONTENTS
SR No. PARTICULAR PAGE NO.
1
INDUSTRY OVERVIEW
> History > Growth & development
> Performance of industry
> Current Market Scenario
2 COMPANY OVERVIEW
> History
> Growth & development
> Project at glance > Promoters & other information > Mission-vision & Competitors > Product overview
> Awards & Achievements > Detailed department overview > SWOT analysis > Literature review.
3 Research > Research Type. > Research meaning. > Research problem. > Research Methodology.
4 Ratio analysis. > Suggestions.
5 Conclusion6 Limitation of the study.7 Bibliography.
INTRODUCTION
In the year 1769, a French engineer by the name
of Nicolas J. Cognate invented the first automobile to run on the
road. This automobiles, in fact, was a self powered, three wheeled,
military tractor that made the use of a steam engine. Oliver Evans
was the first to design a steam engine driven automobile in U.S.
A Scotsman Robert Anderson was the first to
invent an electric carriage between 1832 and 1839. Development of
roads made travelling comfortable.
According to the history of automobile industry
US, dominated the automobile market around the globe with no
notable competitors. However, after the end of Second World War in
1945, the Automobile Industry of other technologically advanced
nations such as Japan and certain European nations gained
momentum within a very short period beginning in the early 1980s.
The current trends of the global automobile
industry reveal that in the developed countries the Automobiles
Industries are stagnating as a result of the dropping car markets,
whereas the Automobile Industry in the developing nations such as
India and Brazil, have been consistently registering higher growth
rates every passing year for their flourishing domestic automobiles
markets.
GROWTH & DEVELOPMENT
The world automobile Industry is turned to the developing
Market:
With the developed markets almost saturated, the World
Automobile Industry is now focused on the developing markets of
South America and Asia, and Eastern Europe with special emphasis
on BRIC (Brazil, Russia, India and China). As per the reports of the
International Organization of Motor Vehicle Manufacturers or OICA
(the Association of the Company involved in World Automobile
Industry), for the fiscal end in 2010, the automobile manufacturer in
the U.S. has been overtaken by those in Japan.
In keeping with the Automobile Industry Trends, the leading
automobile manufacturers are turning to the Asian markets that
appear set to grow immensely over the next decade. The automobile
markets in the U.S. Europe and Japan have almost matured as a result
of saturation appears set to decline through the next decade.
As a growing percentage of the population in the developed
nations age rapidly, in comparison to the rest of the world these
numbers necessitate automobiles to fit the physiological change in
the world population.
PERFORMANCE OF INDUSTRY
The Indian auto industry ended the year 2011-12 on a positive note.
The total production data for the period shows production growth of
13.83% over the same period last year. In 2011-12, the industry
produced 20,366,432 vehicles of which share of two wheelers,
passenger vehicles, three wheelers and commercial vehicles were
76%, 15%, 4% and 4% respectively.
The growth rate for overall domestic sales for 2011-12 was
12.24 percent amounting to 17,376,624 vehicles. Passenger Cars
grew by 2.19%, Utility Vehicles grew by 16.47% and Vans by
10.01% during this period. For the first time in history car sales
crossed two million in a financial year.
During April to March 2012, the industry exported 2,910,055
automobiles registering a growth of 25.44%. Passenger vehicles
registered growth at 14.18% in this period. Commercial vehicles,
three wheeler and two wheeler segment recorded growth of 25.15%,
34.41% and 27.13% respectively during April to March 2012. For the
first time in history, car exports crossed half a billion in a financial
year.
In March 2012 compared to March 2011, overall automobiles
exports registered a growth of 17.81
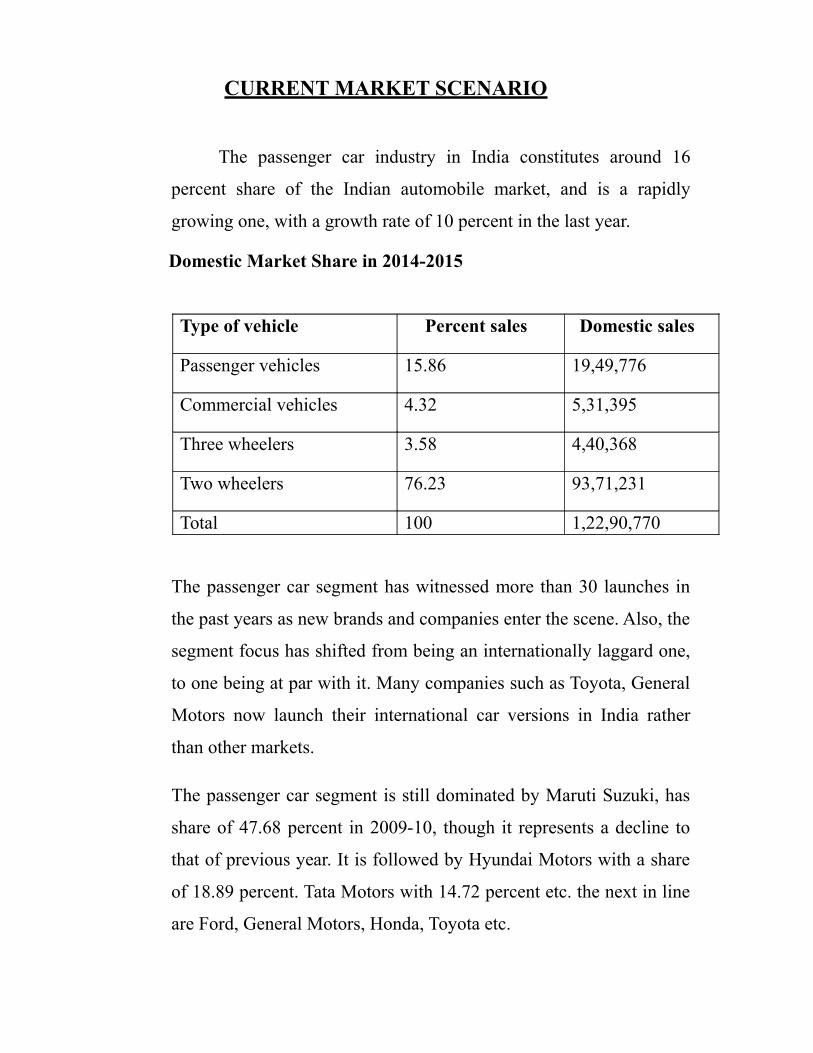
CURRENT MARKET SCENARIO
The passenger car industry in India constitutes around 16
percent share of the Indian automobile market, and is a rapidly
growing one, with a growth rate of 10 percent in the last year.
Domestic Market Share in 2014-2015
Type of vehicle Percent sales Domestic sales
Passenger vehicles 15.86 19,49,776
Commercial vehicles 4.32 5,31,395
Three wheelers 3.58 4,40,368
Two wheelers 76.23 93,71,231
Total 100 1,22,90,770
The passenger car segment has witnessed more than 30 launches in
the past years as new brands and companies enter the scene. Also, the
segment focus has shifted from being an internationally laggard one,
to one being at par with it. Many companies such as Toyota, General
Motors now launch their international car versions in India rather
than other markets.
The passenger car segment is still dominated by Maruti Suzuki, has
share of 47.68 percent in 2009-10, though it represents a decline to
that of previous year. It is followed by Hyundai Motors with a share
of 18.89 percent. Tata Motors with 14.72 percent etc. the next in line
are Ford, General Motors, Honda, Toyota etc.

INDEX
SRNO
PARTICULARS PG.NO.
1 History2 Growth & development3 Project at glance4 Promoters and other information5 Mission-vision & Competitors6 Product overview7 Awards & Achievements8 Detailed department overview9 SWOT analysis
HISTORY
Few groups can identify as closely with
India’s destiny and industrial progress as
the Mahindra group. In fact, Mahindra is
like a microcosm of India. Both were
born around the same time, had the same
aspirations and both experience d the
inevitable troughs and crests in the journey towards their goals. And
both continue to march on the path to progress and global
recognition.
Mahindra & Mahindra was set up as a steel trading company in
1945 in Ludhiana as Mahindra and Mohammed by brother
J.C.Mahindra and J.C.Mahindra. After India gained independence
and Pakistan was formed, Mohammed immigrates to Pakistan. The
company changed its name to Mahindra & Mahindra in 1948.
Swift action followed thought. The Mahindra brothers joined hands
with a distinguished gentleman called Ghulam Mohammad. And, on
October 2nd 1945, Mahindra and Mohammad were set up as a
franchise for assembling jeeps from Willys, USA.
Since then, Mahindra & Mahindra has grown steadily in size
and stature and evolved into a group that occupies a premier position
in almost all key sectors of the economy. In fact, today, its total
turnover is about 6 billion dollars.
In India, soon established as the jeep manufacturers of India, the
company later commenced manufacturing light commercial vehicles
and agricultural tractors. Today Mahindra & Mahindra is key players
in the utility vehicles manufacturing and branding sectors in the
‘Indian Automobile Industry’ with the flagship UV Scorpio and uses
India’s growing global market presence in both automotive and
farming industries to push its product in other countries.
Mahindra Company is a large scale industry according to companies
to act 1956. Today turnover of Mahindra Company is about 6 billion
dollars treated as large scale industries.
In 2012 - Mahindra and Mahindra had acquired Ssangyong Motor
Company, a South Korean SUV maker, almost a year ago and are
now planning to set up a assembly plant and invest Rs 800 crore over
next 3-4 years. Mahindra and Mahindra wins arbitration award and
class action suit against global vehicles.
Mahindra & Mahindra has entered the Kenyan
passenger vehicles market with the launch of their utility
vehicles, XUV500 and Scorpio. Other vehicles include pick-up
range, Genio and Maxximo mini-truck. Mahindra & Mahindra Ltd
said that the company has signed an agreement with Telephonic
Corporation to form a joint venture, named as Mahindra-
Telephonics Integrated System Limited.
Mahindra planned to sell the diesel SUV and pickup trucks starting in
late 2010 in North America through an independent distributor, Global Vehicles
USA, Mahindra announced it will import pickup trucks from India in knock
down kit (kcd) form to circumvent the chicken tax
CKD are complete vehicles that will be assembled in the U.S. from kits of parts shipped in crates. On 18 October 2010, however, it was reported that Mahindra
had indefinitely delayed the launch of vehicles into the North American
market, citing legal issues between it and Global Vehicles after Mahindra
retracted its contract with Global Vehicles earlier in 2010, due to a
decision to sell the vehicles directly to consumers instead of through
Global Vehicles.
However, a November 2010 report quoted John Perez the CEO
of Global Vehicles USA, as estimating that he expects Mahindra’s small
diesel pickups to go on sale in the U.S. by spring 2011, although legal
complications remain, and Perez, while hopeful, admits that arbitration
could take more than a year.
Later reports suggest that the delays may be due to an
Mahindra scrapping the original model of the truck and replacing it with
an upgraded one before selling them to Americans In June 2012, a
Mass tort lawsuit was filed against Mahindra by its American dealers,
alleging the company of conspiracy and fraud.
Mahindra & Mahindra has a controlling stake in Mahindra reva
electric vehicle In 2011, it also gained a controlling stake in South Korea's
SsangYong Motor Company.
Mahindra has launched its relatively heavily published SUV,
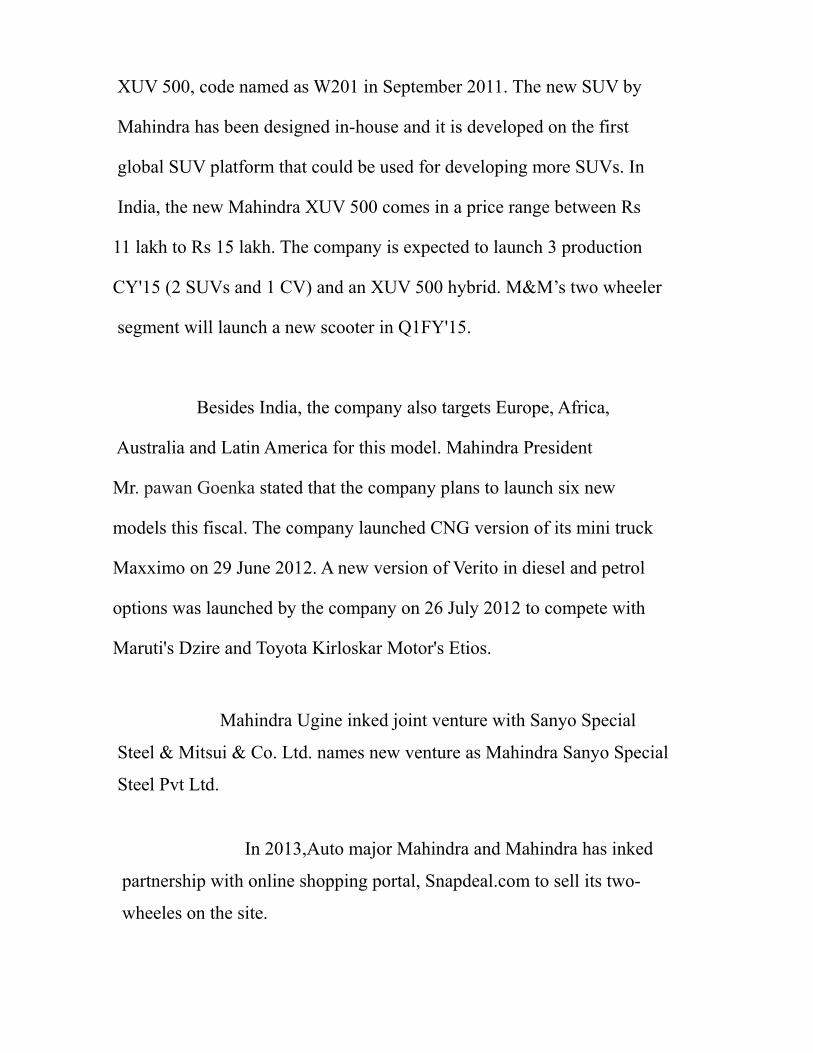
XUV 500, code named as W201 in September 2011. The new SUV by
Mahindra has been designed in-house and it is developed on the first
global SUV platform that could be used for developing more SUVs. In
India, the new Mahindra XUV 500 comes in a price range between Rs
11 lakh to Rs 15 lakh. The company is expected to launch 3 production
CY'15 (2 SUVs and 1 CV) and an XUV 500 hybrid. M&M’s two wheeler
segment will launch a new scooter in Q1FY'15.
Besides India, the company also targets Europe, Africa,
Australia and Latin America for this model. Mahindra President
Mr. pawan Goenka stated that the company plans to launch six new
models this fiscal. The company launched CNG version of its mini truck
Maxximo on 29 June 2012. A new version of Verito in diesel and petrol
options was launched by the company on 26 July 2012 to compete with
Maruti's Dzire and Toyota Kirloskar Motor's Etios.
Mahindra Ugine inked joint venture with Sanyo Special
Steel & Mitsui & Co. Ltd. names new venture as Mahindra Sanyo Special
Steel Pvt Ltd.
In 2013,Auto major Mahindra and Mahindra has inked
partnership with online shopping portal, Snapdeal.com to sell its two-
wheeles on the site.

Mahindra launches MPOWER to train young
transport entrepreneurs at Indian Institute of Management. Mahindra
unveils the new Maxximo Plus Mini-truck in Bengaluru and Chennai.
Mahindra expands dealership network. across India. Mahindra
launches the new Bolero Maxi Truck Plus - The Perfectly Styled
City Pick-up in Ahmedabad.
Mahindra Two Wheelers wins 3 Awards at the
CMO Asia – Manufacturing Excellence Awards 2013.Mahindra 2
Wheelers opens new dealership Zirakpur, Punjab.
In ,2014, Mahindra introduces 'yoga seats' in quanto
compact. Mahindra signs mou with government of bhutan to promote
usage of electric vehicles in the country.
Mahindra defence naval systems inaugurates new
chakan plant. Mahindra integrated business solutions signs mou
with advisory. Mahindra logistics acquires majority stake in lord
freight (India) PVT. LTD. Mahindra to launch new global scooter
called gusto.
GROWTH & DEVELOPMENT
Mahindra and Mahindra limited is an Indian multinational
automobile manufacturing corporation. It is one of the largest vehicle
manufactures by production in India and the largest seller of tractors
across the world.
It is a part of Mahindra Group an Indian conglomerate. It was ranked
as the 10th most trusted brand in India, by the brand trust report, in
2014.
It was ranked 21st in the list of top companies of India in FORTUNE
INDIA 500 in 2011
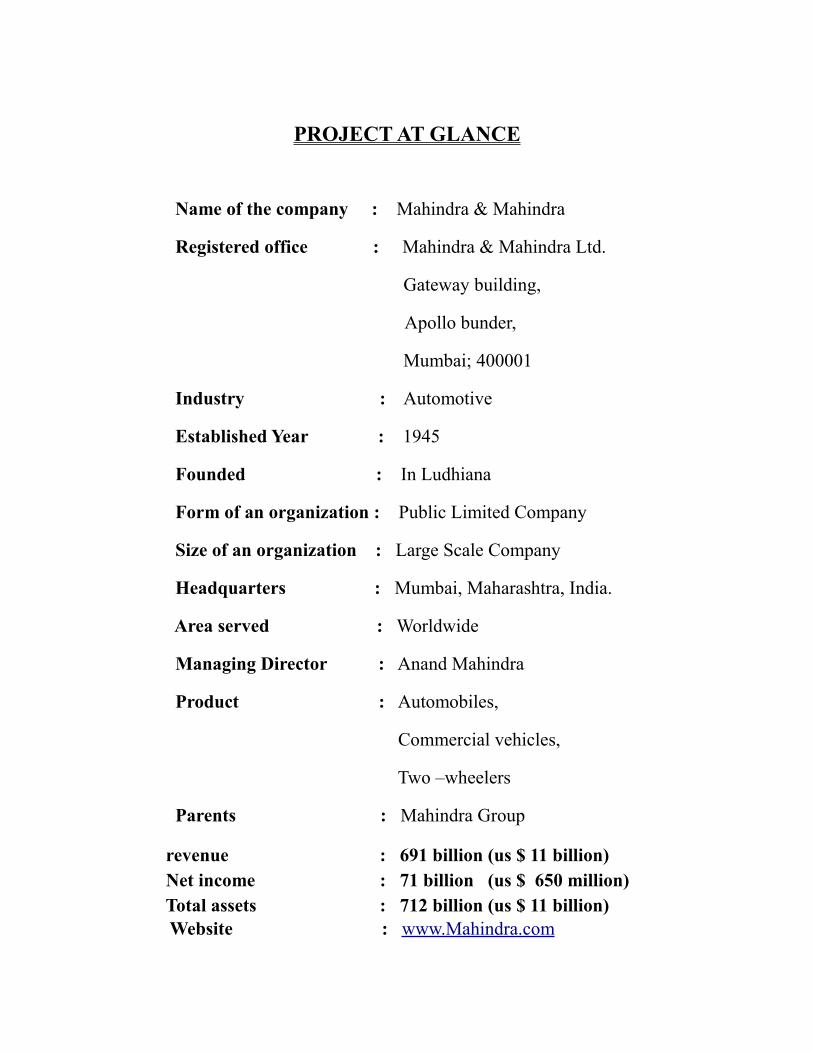
PROJECT AT GLANCE
Name of the company : Mahindra & Mahindra
Registered office : Mahindra & Mahindra Ltd.
Gateway building,
Apollo bunder,
Mumbai; 400001
Industry : Automotive
Established Year : 1945
Founded : In Ludhiana
Form of an organization : Public Limited Company
Size of an organization : Large Scale Company
Headquarters : Mumbai, Maharashtra, India.
Area served : Worldwide
Managing Director : Anand Mahindra
Product : Automobiles,
Commercial vehicles,
Two –wheelers
Parents : Mahindra Group
revenue : 691 billion (us $ 11 billion) Net income : 71 billion (us $ 650 million) Total assets : 712 billion (us $ 11 billion)
Website : www.Mahindra.com
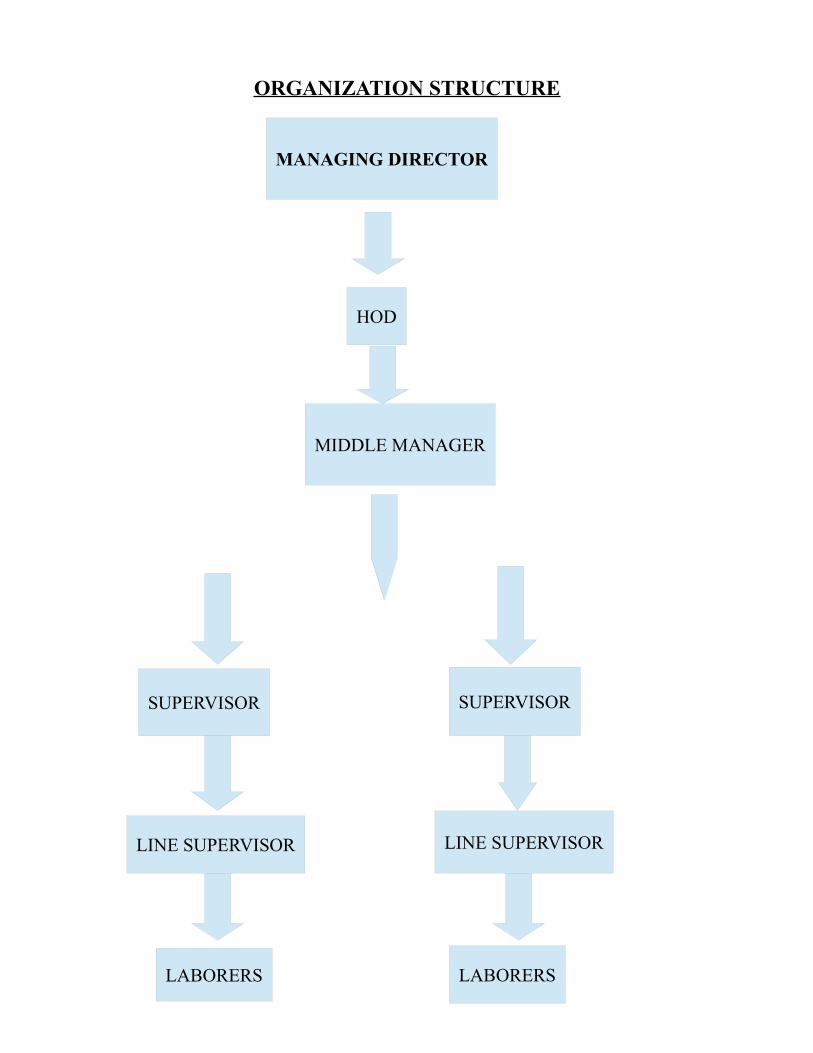
MANAGING DIRECTOR
HOD
MIDDLE MANAGER
SUPERVISOR
LINE SUPERVISOR
LABORERS
SUPERVISOR
LINE SUPERVISOR
LABORERS
ORGANIZATION STRUCTURE
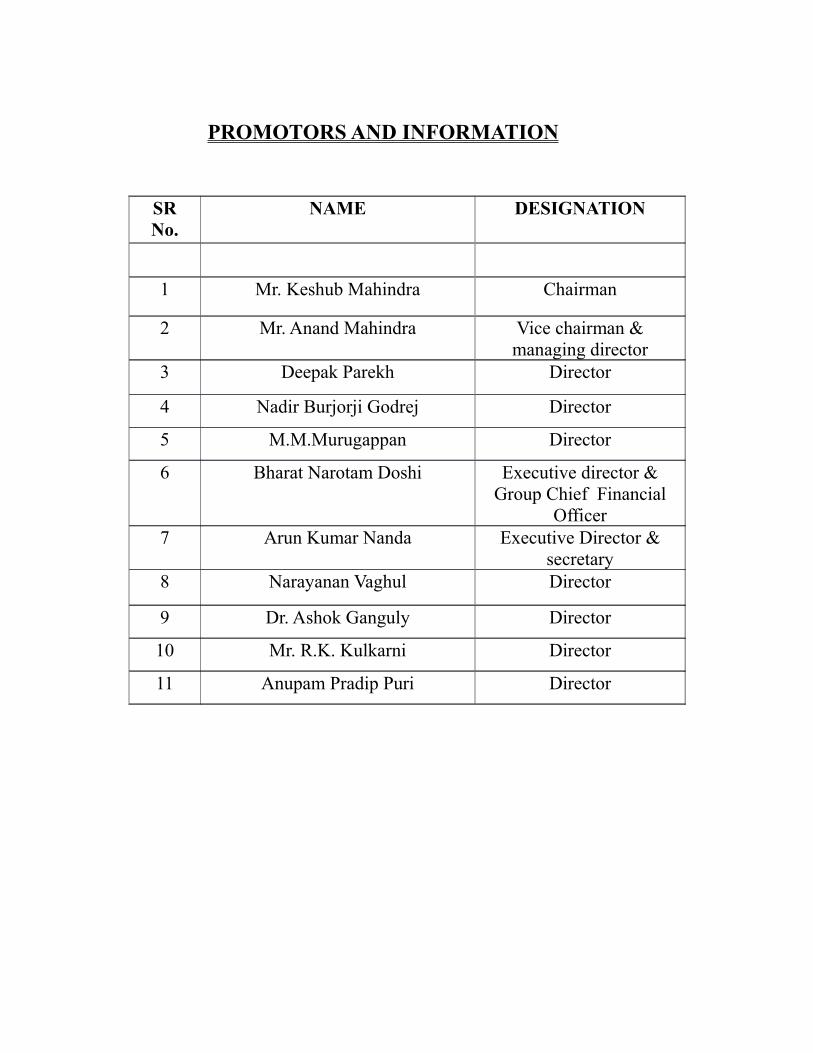
PROMOTORS AND INFORMATION
SRNo.
NAME DESIGNATION
1 Mr. Keshub Mahindra Chairman
2 Mr. Anand Mahindra Vice chairman &managing director
3 Deepak Parekh Director
4 Nadir Burjorji Godrej Director
5 M.M.Murugappan Director
6 Bharat Narotam Doshi Executive director &Group Chief Financial
Officer7 Arun Kumar Nanda Executive Director &
secretary8 Narayanan Vaghul Director
9 Dr. Ashok Ganguly Director
10 Mr. R.K. Kulkarni Director
11 Anupam Pradip Puri Director
MISSION & VISION
* MISSION:
To create India’s largest automobile and automobile-related products
distribution network by providing dealers and customers with the
largest choice of unique world-class products and services.
* VISION:
To create a fully collaborative environment in which suppliers can
deliver exactly what the company needs, when it needs it, and at a
competitive cost.
COMPETITORS
Now a day’s competitors are plays an important role in a market. The
major competitors of Mahindra cars in the Indian market include:
1] Maruti Suzuki 7] Fiat
2] Tata Motors 8] Nissan
3] Ashok Leyland 9] Volkswagen
4] Toyota 10] Honda
5] Hyundai 11] Mercedes-Benz (Merc)
6] Skoda
AUTOMOBILE ASSEMBLY PLANTS
> Bangalore , Karnataka , India.
> Chakan , Maharashtra , India.
> Haridwar, Uttarakhand, India.
> Nasik , Maharastra , India.
Military Defence
The company has built and assembled military vehicles,
commencing in 1947 with the importation of the WILLYS JEEP that had
been widely used in World War II. Its line of military vehicles
include the AXE. It also maintains a joint venture with BAE Systems,
Defence Land Systems India.
Energy
Mahindra & Mahindra entered the energy sector in 2002,
in response to growing demands for increased electric power in India.
Since then, more than 150,000 Mahindra Power of engines and diesel
generator sets (gensets) have been installed in India, offering standard
proper quality power, as do most larger companies, in areas with
arguably less reliable grid electricity. The inverters, batteries, and
gensets are manufactured at three facilities in Pune (Maharastra),
Chennai (Tamil nadu), and Delhi; and 160 service points across India
offer 24-7 support to most key markets. Power of is present in countries
across Latin America, Africa, the Middle East, and Southeast Asia—and
expanding into the United Arab Emirates, Bangladesh, and Nepal.
Mahindra Powerol's energy services consist mostly of
power leasing and telecom infrastructure management. In 2006, it
became a major market leader in the telecom segment (and in 2011,
its market share passed 45 percent). In 2007, it won the Frost and
Sullivan "Voice of the Customer" award for best practices in telecom.
Mahindra Cleantech Ltd focuses in eco-friendly, or
'green' power. In response to growing acceptance of Solar power,, it
formed a subsidiary, Mahindra Solar, in 2010 to offer a range of solar
solutions, both off grid and on grid, alongside Engineering,
Procurement, and Construction (EPC).
Mahindra EPC, is the Engineering Procurement &
Construction arm of the Mahindra group. A portfolio company under
the Cleantech arm of Mahindra Partners, they offer solar solutions
spanning On-Grid solutions, EPC (Engineering, Procurement and
Construction) and Off-Grid Product solutions. The company
commenced its operations in the year 2011 and has successfully
commissioned over 60 MW worth of Solar PV projects.
Meanwhile, its off-grid products include power packs
and rooftop setups for business organisations and public institutions
alongside rural electrification through lanterns and home and street
lighting systems. The company works closely with Mahindra’s farm
equipment division to offer lighting products to some of the more rural
areas in India. It also works with Mahindra Powerol to offer solar power
backup to telecom sites in India. In 2011, Mahindra Solar received a
CRISIL rating of SP1A in 2011, the highest rating for any solar
photovaltaic off-grid company.
Farm equipment
Mahindra began manufacturing tractors for the
Indian market during the early '60s. It is the top tractor company in the
world (by volume) with annual sales totaling more than 200,000
tractors. Since its inception, the company has sold over 2.1 million
tractors. Mahindra & Mahindra’s farm equipment division has over
1,000 dealers servicing approx. 1.45 million customers.
Mahindra tractors are available in 40 countries,
including India, the United States, China, Australia, New Zealand, Africa
(Nigeria, Mali, Chad, Gambia, Angola, Sudan, Ghana, and Morocco),
Latin America (Chile, Argentina, Brazil, Venezuela, Central America,
and the Caribbean), South Asia (Sri Lanka, Bangladesh, and Nepal),
the Middle East (Iran and Syria) and Eastern Europe (Serbia, Turkey,
and Macedonia.
Mahindra Tractors manufactures its products at four
plants in India, two in Mainland China, three in the United States, and
one in Australia. It has three major subsidiaries: Mahindra USA,
Mahindra (China) Tractor Company, and Mahindra Yueda (Yancheng)
Tractor Company (a joint venture with the Jiangsu Yueda Group).
In 2003, the Farm Equipment Sector of Mahindra &
Mahindra won the Deming Appication and in 2007 it received the Japan
Quality Medal for implementing Total Quality Management in its entire
business operations. The company has garnered the highest customer
satisfaction index (CSI) in the industry at 88 percent.It earned a 2008
Golden Peacock Award in the Innovative Product/Services category for its
in-house development of a load car. In its 2009 survey of Asia’s 200
most admired and innovative companies, the Wall Street Journal
named Mahindra & Mahindra one of the 10 most innovative Indian
companies.
In addition to tractors, Mahindra sells other farm
equipment. It has expanded its product-line to include farm-support
services via Mahindra AppliTrac (farm mechanisation products),
Mahindra ShubhLabh (seeds, crop protection, and market linkages
and distribution), and the Samriddhi Initiative (farm counselling and
information services).
• Consumer
• Mahindra e2o
• Mahindra Thar
• Mahindra Bolero
• Mahindra Xylo
• Mahindra Scorpio
• Mahindra Scorpio Getaway
• Mahindra Verito
• Mahindra XUV500
• Mahind
• ra Quanto
• Mahindra Verito Vibe
Employees
As on 31 March 2013, the company had 34,612
employees, out of which 699 were women (2%). It also had around
16,000 temporary employees on the same date.
Company updates
In 2015, it was announced that the company was
to offer Android Auto, a Telematics standard developed by Google,
technology with its in-vehicle infotainment system for its XUV500 and
Scorpio vehicles.
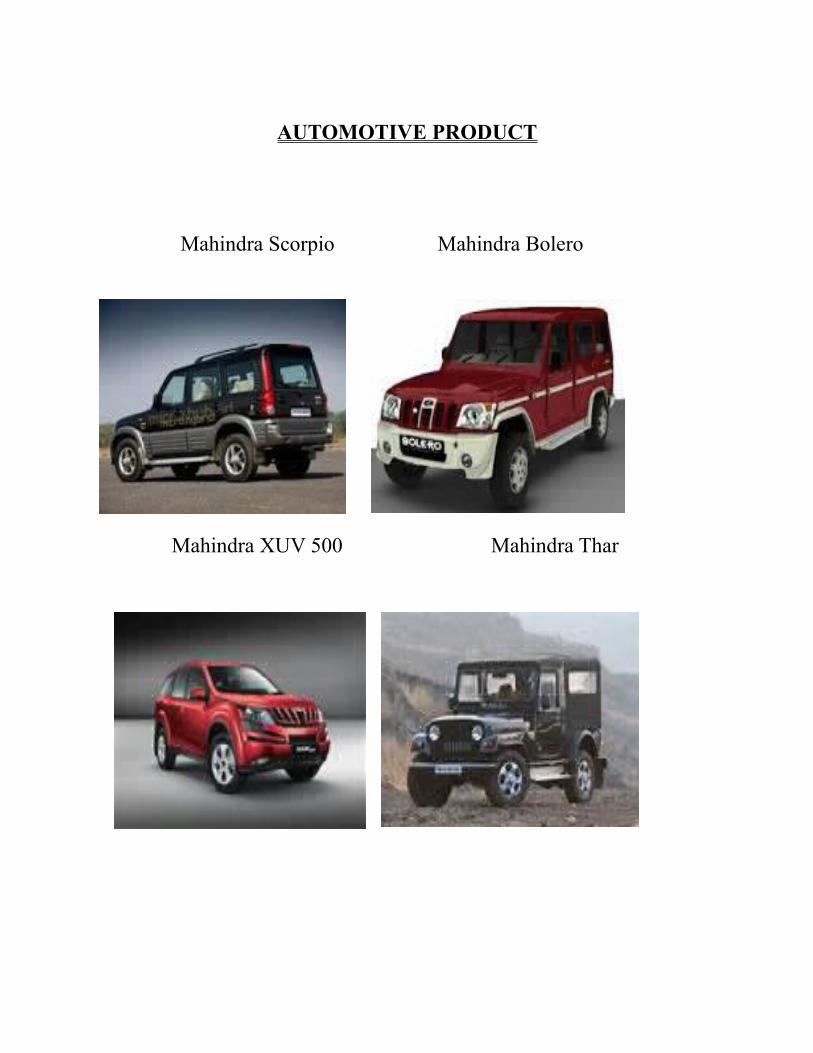
AUTOMOTIVE PRODUCT
Mahindra Scorpio Mahindra Bolero
Mahindra XUV 500 Mahindra Thar

Mahindra Verito Mahindra Quanto
Mahindra Xylo Mahindra Logan
Mahindra Verito Vibe Mahindra e20

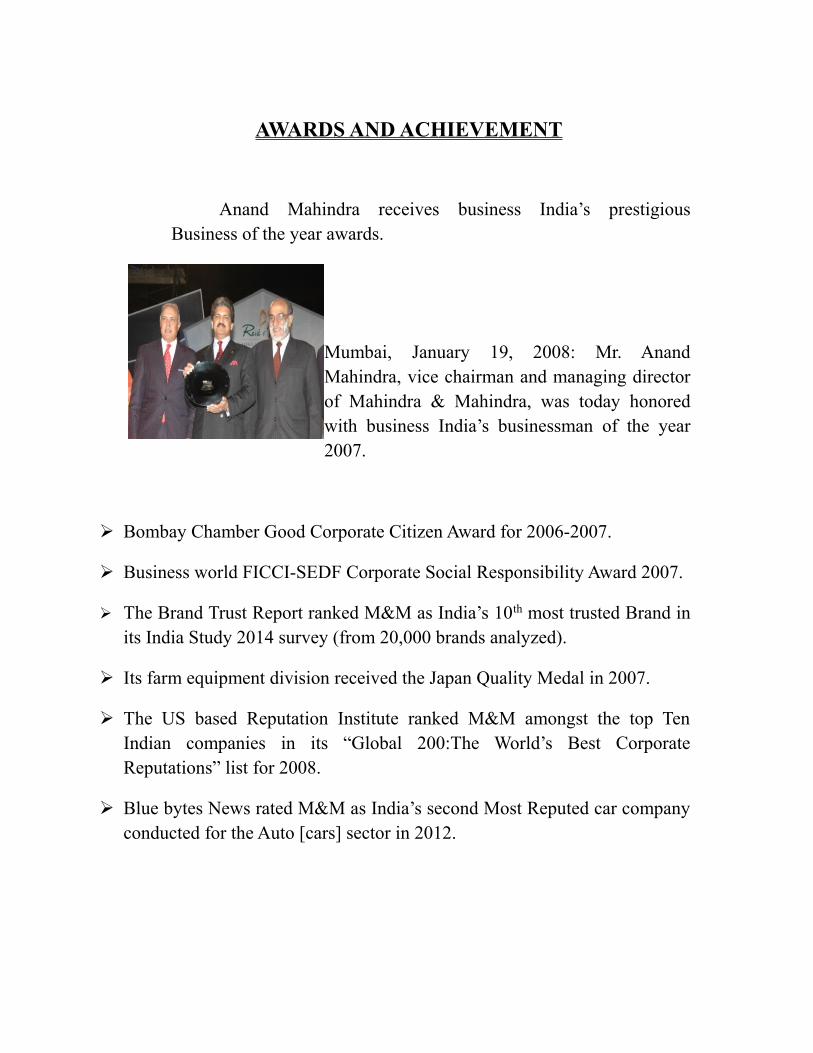
AWARDS AND ACHIEVEMENT
Anand Mahindra receives business India’s prestigiousBusiness of the year awards.
Mumbai, January 19, 2008: Mr. AnandMahindra, vice chairman and managing directorof Mahindra & Mahindra, was today honoredwith business India’s businessman of the year2007.
Bombay Chamber Good Corporate Citizen Award for 2006-2007.
Business world FICCI-SEDF Corporate Social Responsibility Award 2007.
The Brand Trust Report ranked M&M as India’s 10th most trusted Brand inits India Study 2014 survey (from 20,000 brands analyzed).
Its farm equipment division received the Japan Quality Medal in 2007.
The US based Reputation Institute ranked M&M amongst the top TenIndian companies in its “Global 200:The World’s Best CorporateReputations” list for 2008.
Blue bytes News rated M&M as India’s second Most Reputed car companyconducted for the Auto [cars] sector in 2012.

DETAILED DEPARTMENT OVERVIEW
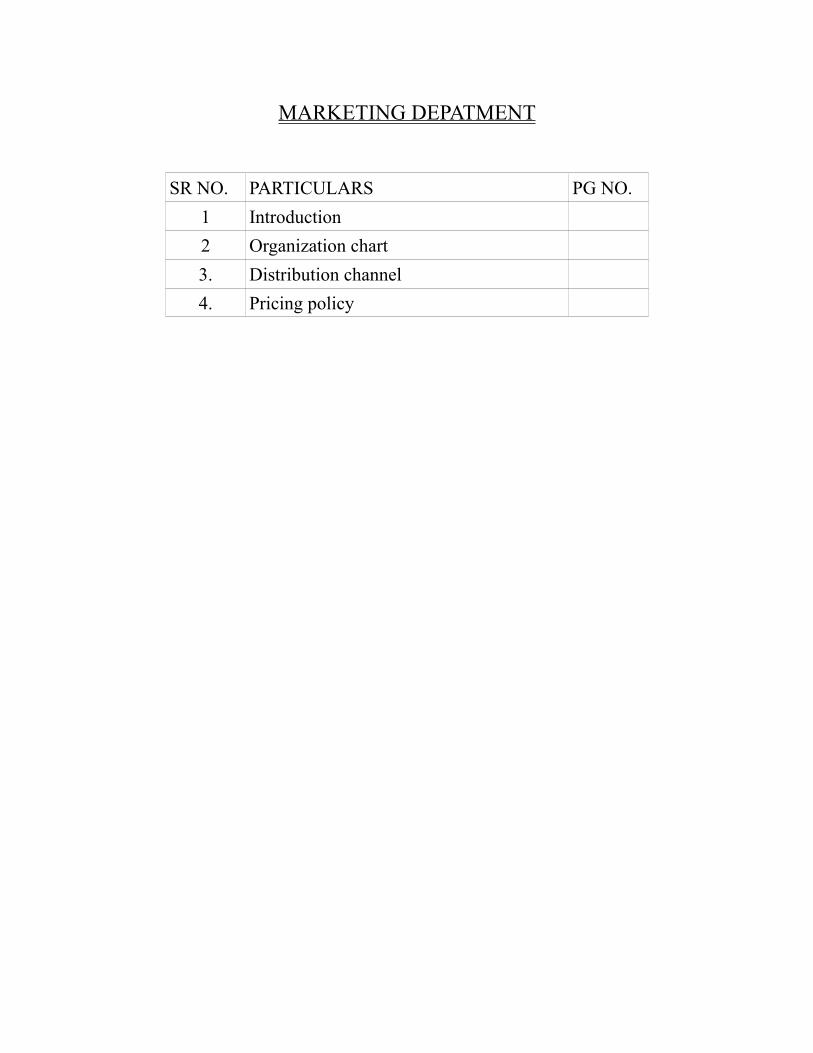
MARKETING DEPATMENT
SR NO. PARTICULARS PG NO.
1 Introduction
2 Organization chart
3. Distribution channel
4. Pricing policy
INTRODUCTION TO MARKETING
Marketing management needs to perform all the activities to satisfy consumer’s needs
and wants.
The marketing philosophy of business assumes that an organization can best serve and
prosper by identifying and satisfying the needs of its customers.
Definition of marketing:
According to Philip Kotler, “marketing is the social and managerial process by
which individual and groups obtain what they need and want through creating, offering
and exchanging products of value of with others.”
Definition of marketing management:
According to Philip Kotler, “marketing management is the art and science of
choosing target markets and getting, keeping and growing customers through creating,
delivering and communicating superior customer value.”
The main characteristic of modern marketing is that you are accepting that,
“consumer is the KING of the market.”
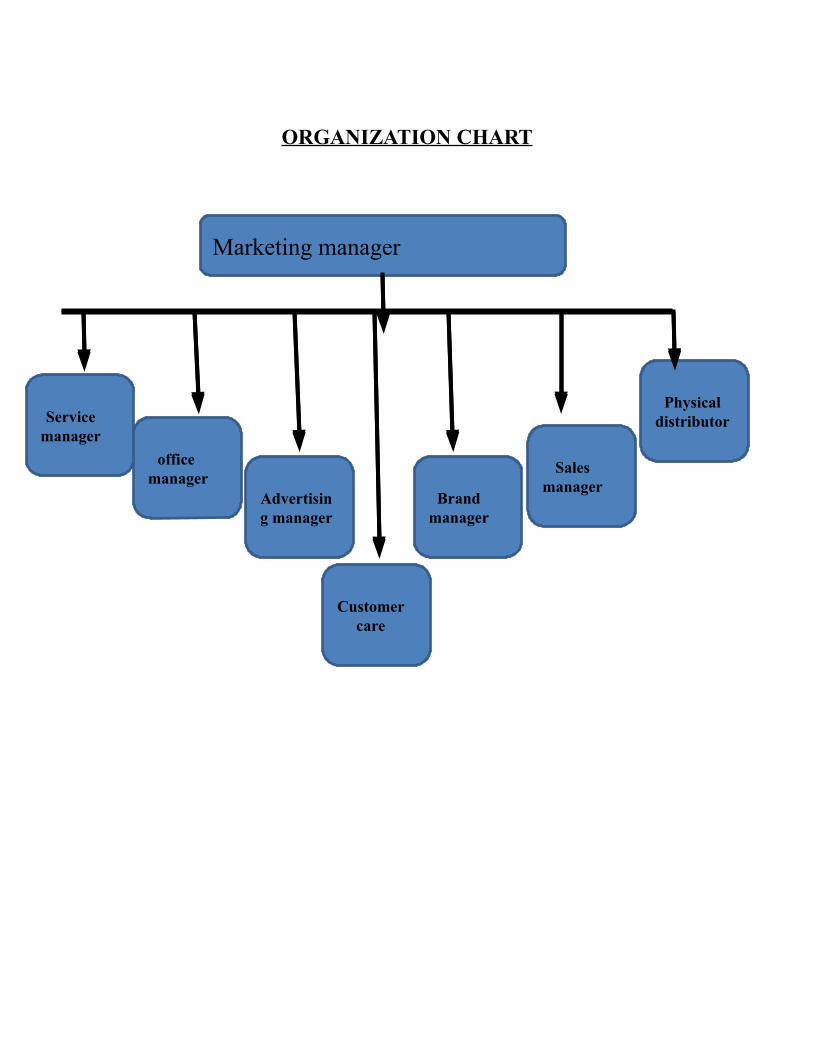
ORGANIZATION CHART
Marketing manager
Service manager
office manager
Advertising manager
Customer care
Brand manager
Sales manager
Physical distributor
DISTRIBUTION CHANNEL
According to Philip Kotler, “Every producer seeks to link together the set of marketing
intermediaries that best fulfill the firm’s objectives. This set of marketing intermediaries
is called the channel also trade of channel of distribution.”
There are various types of distribution channels through which the producers can
move the goods to the end users.
PRICING POLICY
Pricing for the product is a crucial element of marketing mix. On the
one hand it is a complex mechanism and on the other it is simultaneously a strategic
element as it is related to the perception of quality. Without price there can’t be
marketing. Price denotes the value of a product or service expressed in money.
The most important task of any business is to decide about the pricing
policy for its products. There are so many pricing techniques used in today’s business
activities.

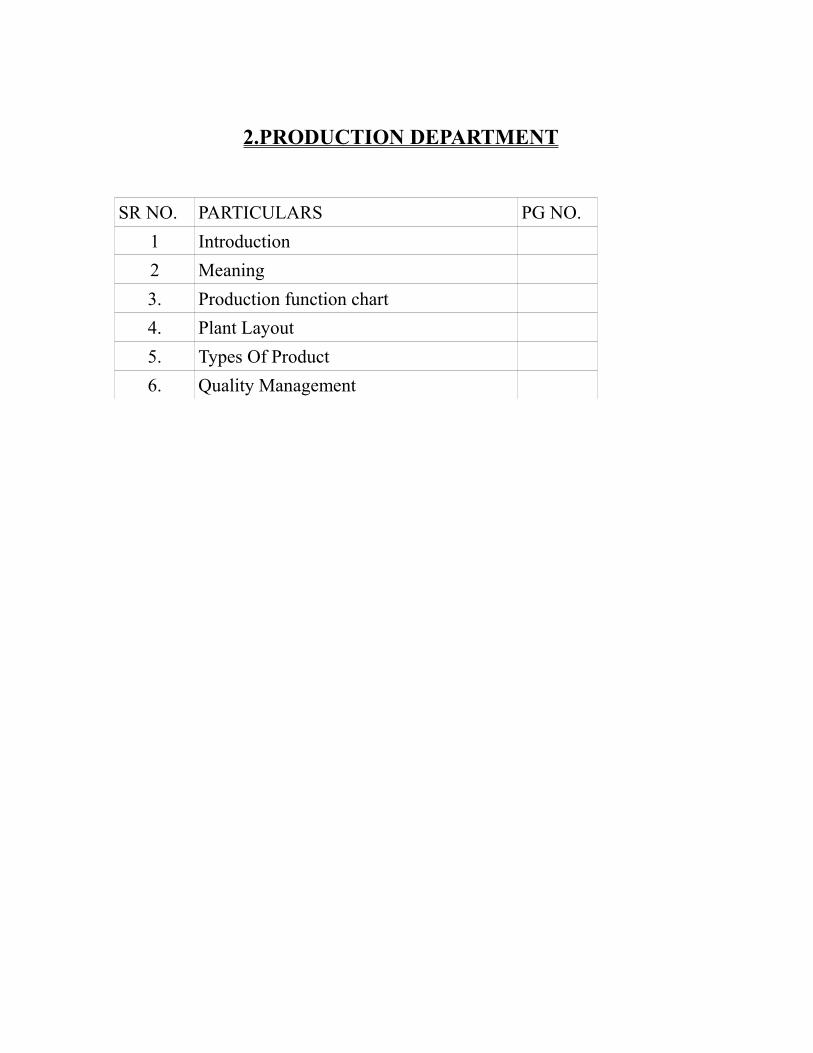
2.PRODUCTION DEPARTMENT
SR NO. PARTICULARS PG NO.
1 Introduction
2 Meaning
3. Production function chart
4. Plant Layout
5. Types Of Product
6. Quality Management
INTRODUCTION:
The production department business is concern with the creation of the
product as service required satisfying the customers needs, wants, and desired.
Production is an organizational activity of converting raw-material
into finished goods by organized utilization of natural resources, men, money,
material, and machines.
According to H.A. Harding, “production management is
concerned with those processes which convert the input into outputs. The inputs are
various resources like raw material, men, machines, method, etc. and the outputs are
goods and services.”
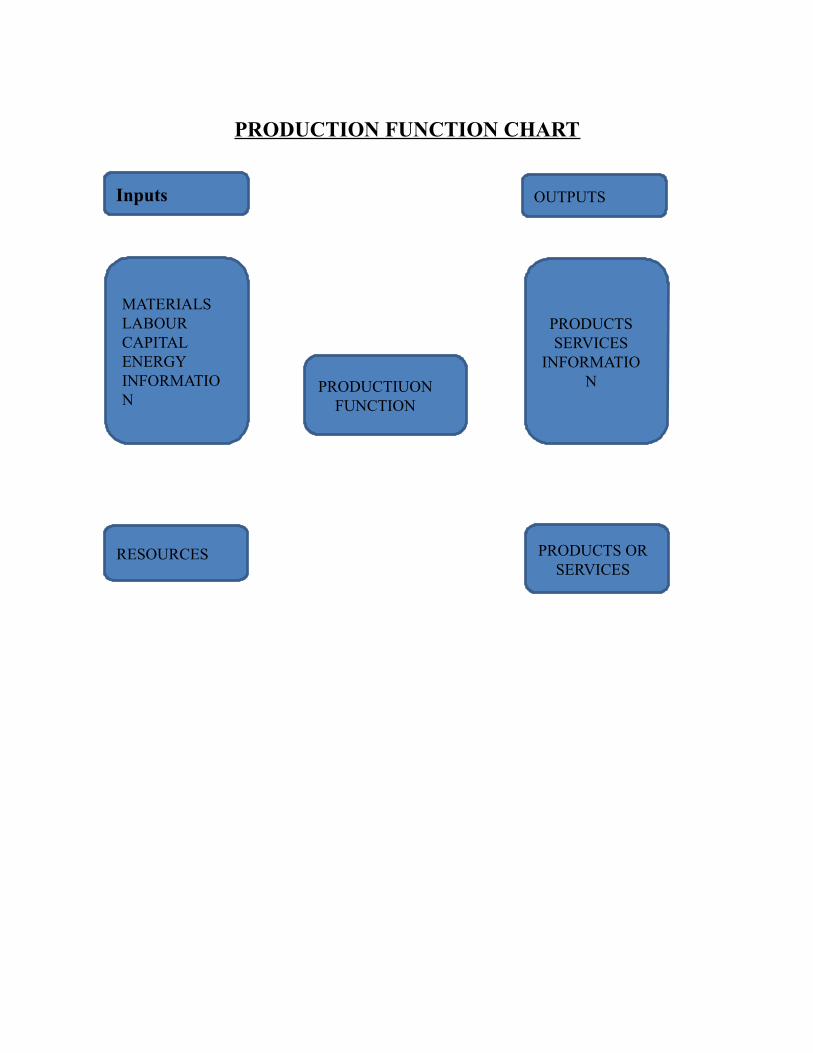
PRODUCTION FUNCTION CHART
Inputs OUTPUTS
RESOURCES PRODUCTS OR SERVICES
PRODUCTIUON FUNCTION
MATERIALSLABOURCAPITALENERGYINFORMATION
PRODUCTSSERVICES
INFORMATION
PLANT LAYOUT:
Plant layout is plan for arranging physical facility and manpower
required.
Plant layout is physical arrangement of equipment facility within the
plant. The plant layout can be indicated on a floor plant showing the
distance between different features of the plant. Plant layout is
optimized this is valid for:
Distance material has to move
Distance equipment has to move
Type of handling equipment needed
M & M has a big building facility with, nice garden. So, they don’t
find much problem and along with their production system is also
nice.
TYPES OF PRODUCT :
* Automobile
* Commercial vehicles
* Two-wheelers
QUALITY MANAGEMENT:
M & M’s quality management system encompasses all current
industry standard method, including process capability analysis
etc.M & M is committed to customer satisfaction through continuous
improvement.

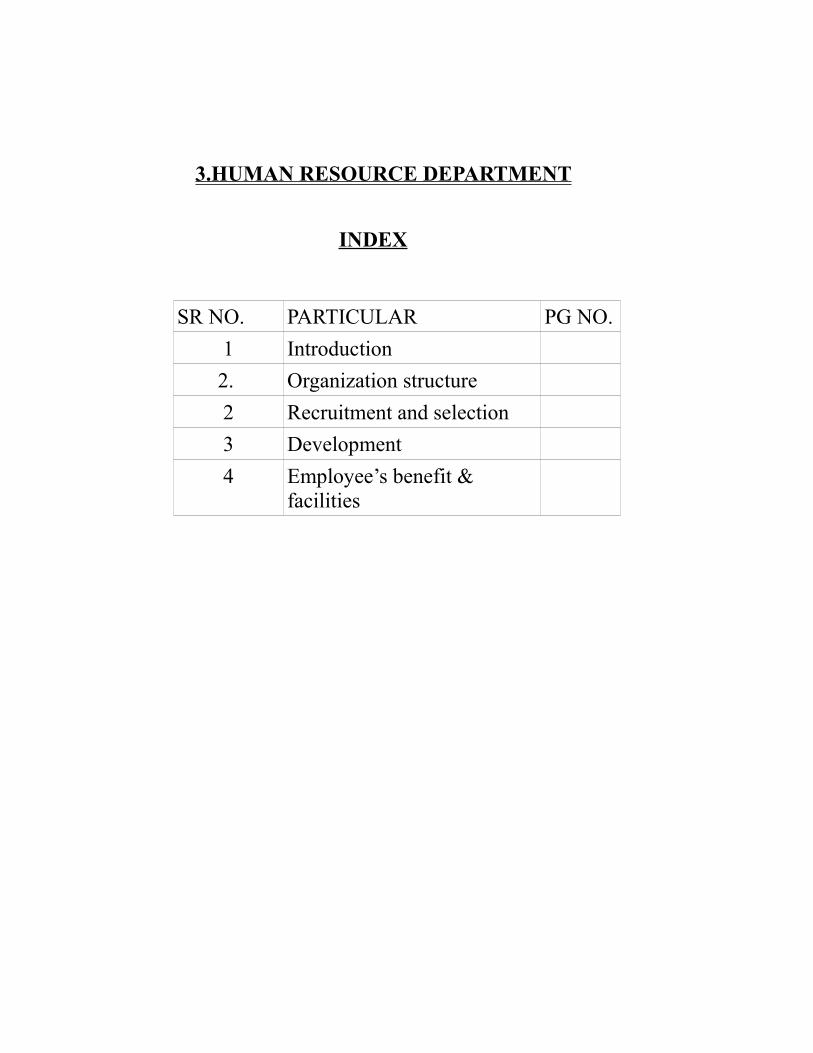
3.HUMAN RESOURCE DEPARTMENT
INDEX
SR NO. PARTICULAR PG NO.
1 Introduction
2. Organization structure
2 Recruitment and selection
3 Development
4 Employee’s benefit &facilities
INTRODUCTION:
Human resource management is concern with people dimension in
management. Since every organization is made up of people accruing
their services, developing their skill, motivating them to higher level
of performance and ensuring that they continue to maintain to their
commitment to the organization.
A Mahindra & Mahindra company is only as good as the people it
keeps. Achievement is attributed to our dedicated and innovative
employees and supportive customers.
M & M’s entire team is committed to providing us with real
competitive advantages with the best concept, optimum performance
and quality, the lowest cost of ownership and enhanced flexibility.
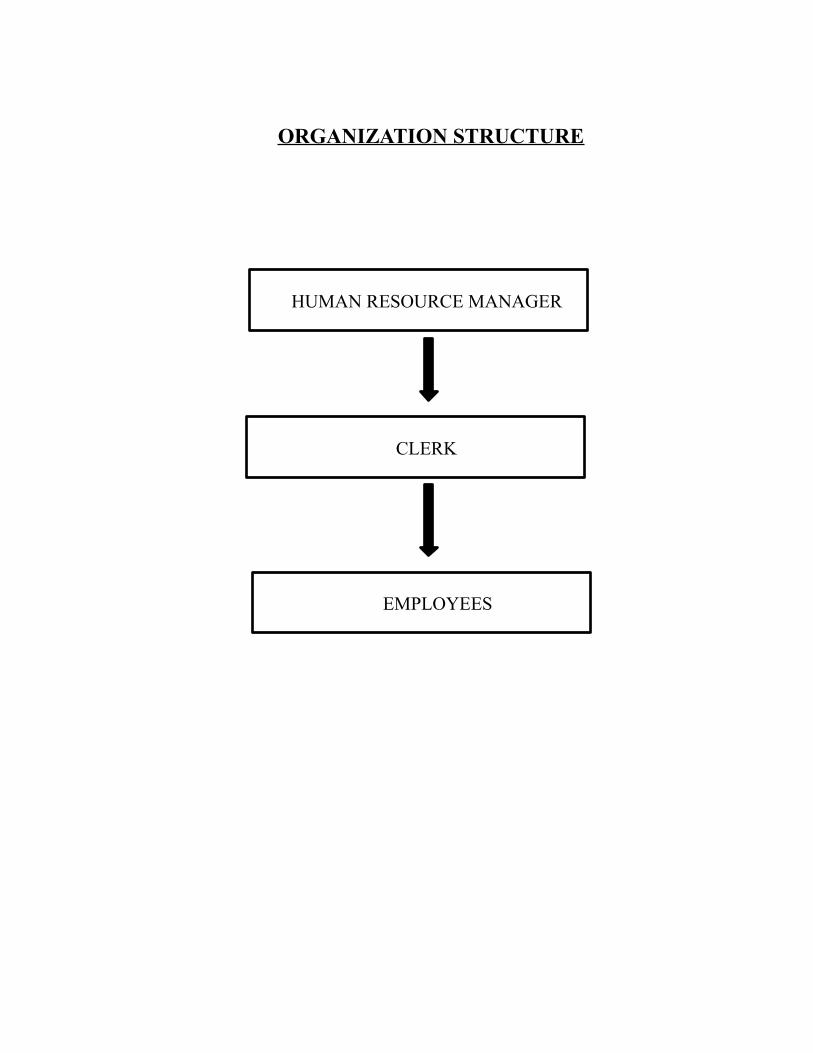
ORGANIZATION STRUCTURE
HUMAN RESOURCE MANAGER
CLERK
EMPLOYEES
RECRUITMENT AND SELECTION:
Recruitment is the process of acquiring at the right time, in the right
position, person with the right qualification.
In M & M Company, recruitment plays an important role and the
internal and external sources of recruitment are as follows:
INTERNAL SOURCES
EXTERNAL SOURCES
M & M mostly follows External sources for the recruitment procedure.
SELECTION
The main object of Selection process is to find out about applicant, so
that ha may be fit with job or not.M& M adopts only one step
employment interview for the selection.
PLACEMENT:
M & M Company after the initial training is over, they normally
decides the final placement on the basis of performance and results
output during the training.
TRAINING:
Training is the act of increasing the knowledge and skill of an
employee during a particular job. There are mainly two types of
training:
On the job training
Off the job training
DEVELOPMENT:
The purpose of such development is the development of their mental
abilities, skill & inherent qualities.
M & M organize special development program for office staff &
workers.
EMPLOYEES BENEFIT & FACILITIES:
M & M provides wealth of service so that employee’s find desirable
and employees are motivated to perform the best of their jobs and try
to increase the efficiency of the organization. An employee is most
valuable assets of any organization.
These workers on ethical basis so it provides lot of facilities to the
workers:
Financial facilities
Canteen facilities
Safety facilities
Provident fund

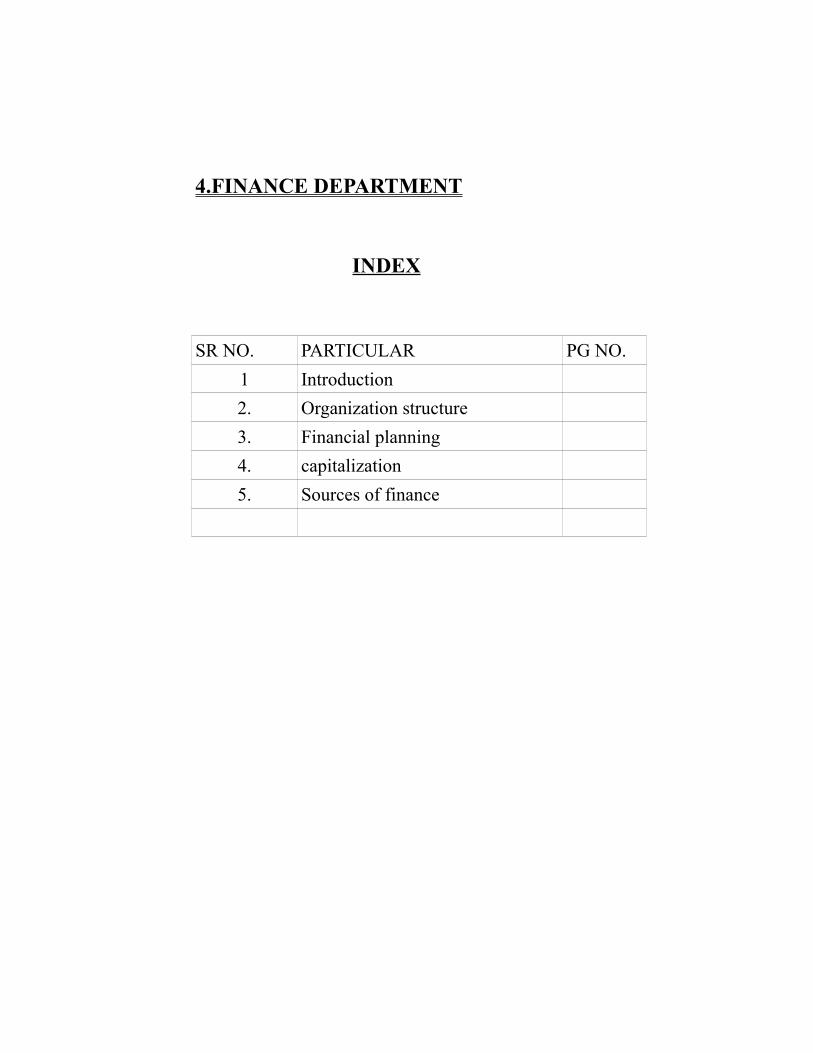
4.FINANCE DEPARTMENT
INDEX
SR NO. PARTICULAR PG NO.
1 Introduction
2. Organization structure
3. Financial planning
4. capitalization
5. Sources of finance
INTRODUCTION:
Finance is life blood of business. We need finance for production of goods
& services as well as distribution. Finance function assumes an important role in
the business system.
Finance is required for production, distribution, and advertising as well as
for purchase machinery to purchase raw-material etc. so everything is brought by
finance and without finance business can’t be survival.
The management of finance department assumes an important role in
the business system and it should be of equal importance with production and marketing
function.
Financial management is that management activity which is concerned
with the planning and controlling of the firm’s financial resources.
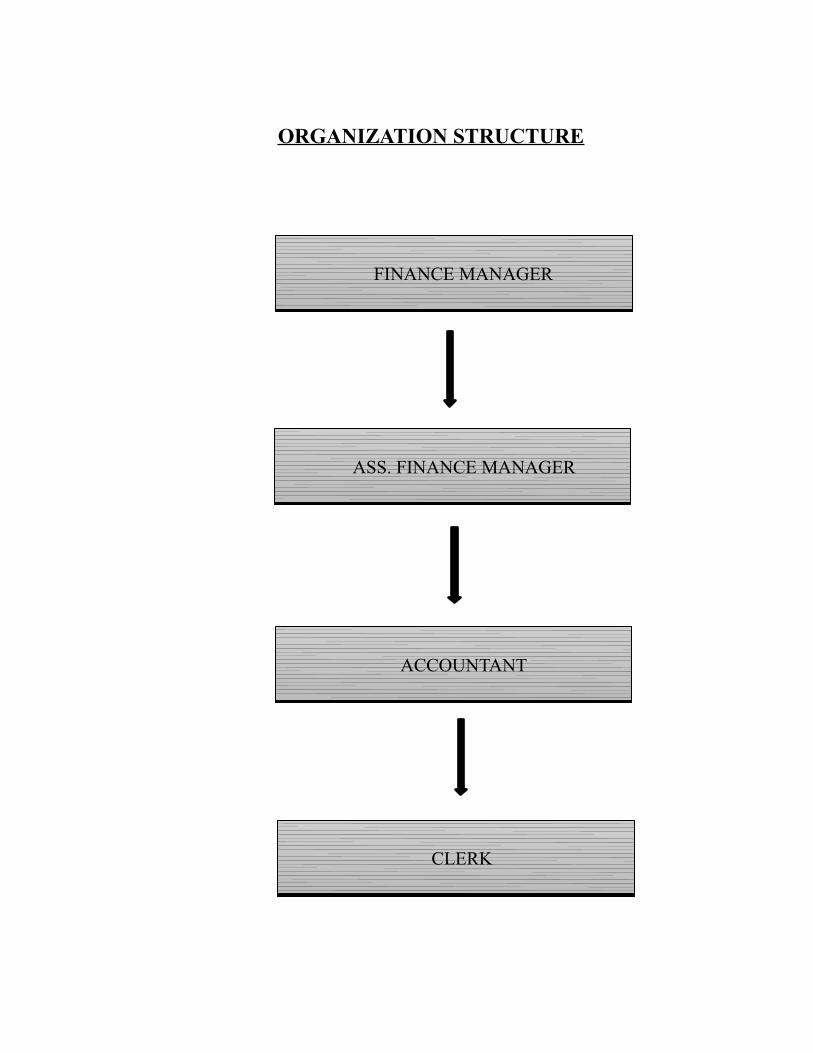
ORGANIZATION STRUCTURE
FINANCE MANAGER FINANCE MANAGER
ASS. FINANCE MANAGER ASS. FINANCE MANAGER
ACCOUNTANT ACCOUNTANT
CLERK CLERK
FINANCIAL PLANNING:
Financial planning naturally deals with function of
financial system of the firm.
Financial planning indicates a firm’s growth, performance,
investments and requirements of funds during a given period of time
usually three to five years. It involves the preparation of projected or
performance profit and loss account, balance sheet and fund flow
statement. Financial planning and profit planning help a firm’s
financial manager to regulate flows of funds which is his primary
concern.
In M & M Company one of the important decisions is to
be taken by financial manager is of financial planning. They do
financial planning to the basis of past data. They compare past data
and likewise prepare financial plan
CAPITALIZATION:
Capitalization includes ownership capital and borrowed capital as
represented by long term indebtedness. Capitalization should be
based on earning power.
There are mainly three types of capitalization
Fair & Proper capitalization
Over capitalization
Under capitalization.

SOURCE OF FINANCE:
There are mainly two types of source for collect money in
market first one is short term finance and second is long term sources
of finance. Long term source of finance is useful for fixed assets and
short term finance useful for day to day activity.
Long term source of finance:
Equity
Loan
Right issue
Short term source of finance:
Bank loan
Working capital
Bank overdraft
Credit
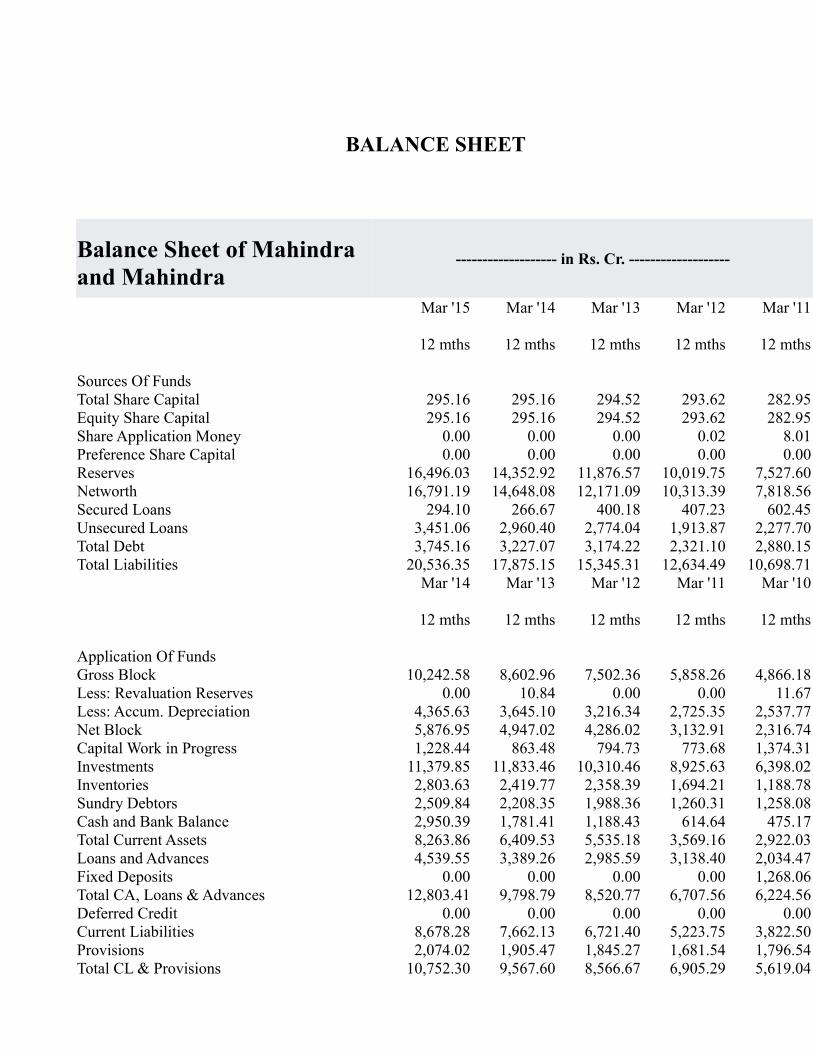
BALANCE SHEET
Balance Sheet of Mahindra and Mahindra
------------------- in Rs. Cr. -------------------
Mar '15 Mar '14 Mar '13 Mar '12 Mar '11
12 mths 12 mths 12 mths 12 mths 12 mths
Sources Of FundsTotal Share Capital 295.16 295.16 294.52 293.62 282.95Equity Share Capital 295.16 295.16 294.52 293.62 282.95Share Application Money 0.00 0.00 0.00 0.02 8.01Preference Share Capital 0.00 0.00 0.00 0.00 0.00Reserves 16,496.03 14,352.92 11,876.57 10,019.75 7,527.60Networth 16,791.19 14,648.08 12,171.09 10,313.39 7,818.56Secured Loans 294.10 266.67 400.18 407.23 602.45Unsecured Loans 3,451.06 2,960.40 2,774.04 1,913.87 2,277.70Total Debt 3,745.16 3,227.07 3,174.22 2,321.10 2,880.15Total Liabilities 20,536.35 17,875.15 15,345.31 12,634.49 10,698.71
Mar '14 Mar '13 Mar '12 Mar '11 Mar '10
12 mths 12 mths 12 mths 12 mths 12 mths
Application Of FundsGross Block 10,242.58 8,602.96 7,502.36 5,858.26 4,866.18Less: Revaluation Reserves 0.00 10.84 0.00 0.00 11.67Less: Accum. Depreciation 4,365.63 3,645.10 3,216.34 2,725.35 2,537.77Net Block 5,876.95 4,947.02 4,286.02 3,132.91 2,316.74Capital Work in Progress 1,228.44 863.48 794.73 773.68 1,374.31Investments 11,379.85 11,833.46 10,310.46 8,925.63 6,398.02Inventories 2,803.63 2,419.77 2,358.39 1,694.21 1,188.78Sundry Debtors 2,509.84 2,208.35 1,988.36 1,260.31 1,258.08Cash and Bank Balance 2,950.39 1,781.41 1,188.43 614.64 475.17Total Current Assets 8,263.86 6,409.53 5,535.18 3,569.16 2,922.03Loans and Advances 4,539.55 3,389.26 2,985.59 3,138.40 2,034.47Fixed Deposits 0.00 0.00 0.00 0.00 1,268.06Total CA, Loans & Advances 12,803.41 9,798.79 8,520.77 6,707.56 6,224.56Deferred Credit 0.00 0.00 0.00 0.00 0.00Current Liabilities 8,678.28 7,662.13 6,721.40 5,223.75 3,822.50Provisions 2,074.02 1,905.47 1,845.27 1,681.54 1,796.54Total CL & Provisions 10,752.30 9,567.60 8,566.67 6,905.29 5,619.04
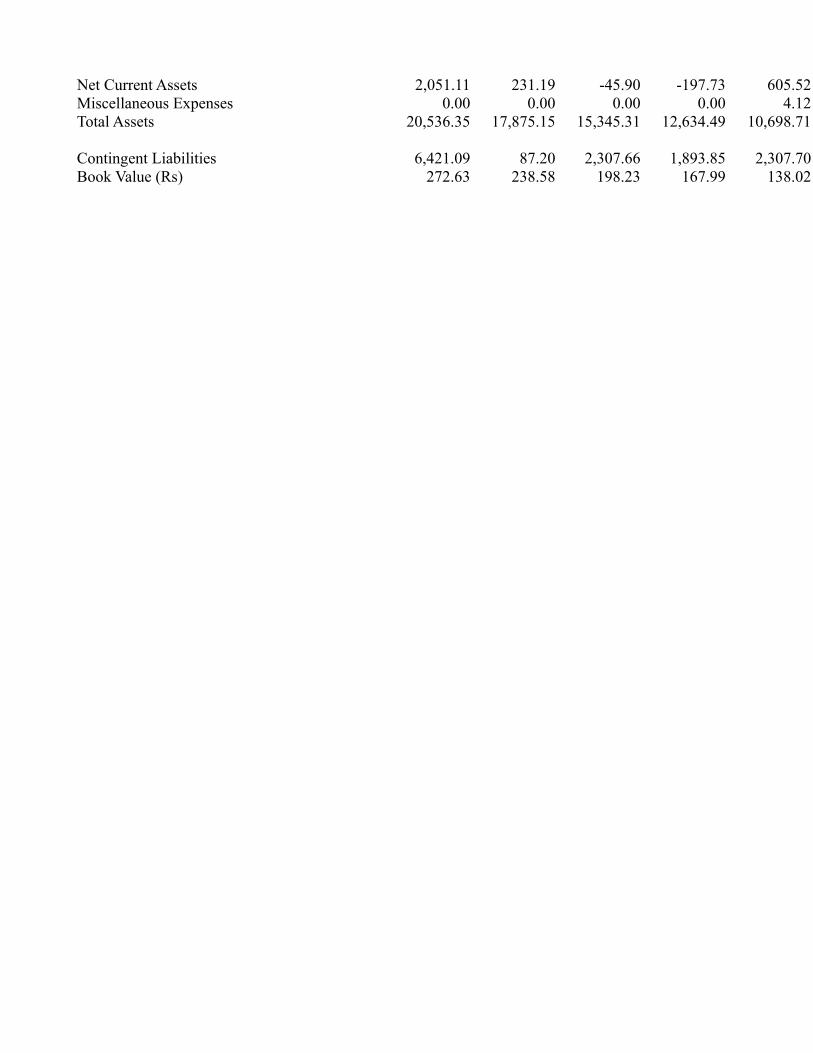
Net Current Assets 2,051.11 231.19 -45.90 -197.73 605.52Miscellaneous Expenses 0.00 0.00 0.00 0.00 4.12Total Assets 20,536.35 17,875.15 15,345.31 12,634.49 10,698.71
Contingent Liabilities 6,421.09 87.20 2,307.66 1,893.85 2,307.70Book Value (Rs) 272.63 238.58 198.23 167.99 138.02
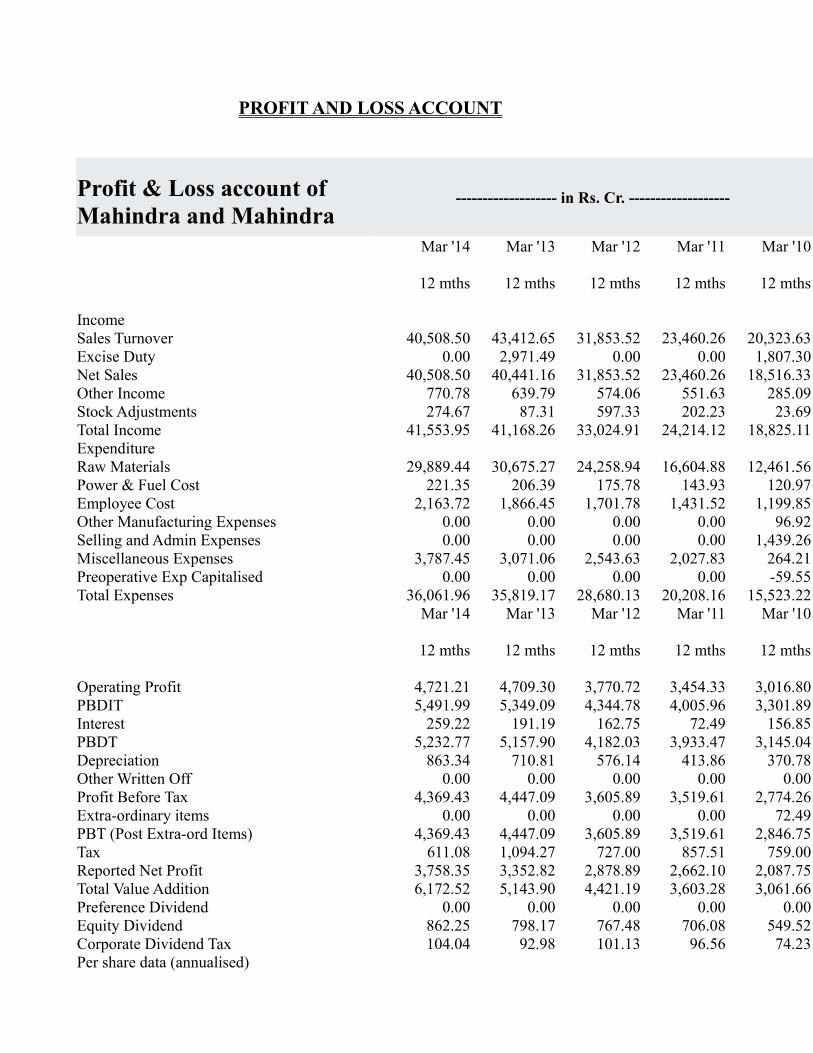
PROFIT AND LOSS ACCOUNT
Profit & Loss account of Mahindra and Mahindra
------------------- in Rs. Cr. -------------------
Mar '14 Mar '13 Mar '12 Mar '11 Mar '10
12 mths 12 mths 12 mths 12 mths 12 mths
IncomeSales Turnover 40,508.50 43,412.65 31,853.52 23,460.26 20,323.63Excise Duty 0.00 2,971.49 0.00 0.00 1,807.30Net Sales 40,508.50 40,441.16 31,853.52 23,460.26 18,516.33Other Income 770.78 639.79 574.06 551.63 285.09Stock Adjustments 274.67 87.31 597.33 202.23 23.69Total Income 41,553.95 41,168.26 33,024.91 24,214.12 18,825.11ExpenditureRaw Materials 29,889.44 30,675.27 24,258.94 16,604.88 12,461.56Power & Fuel Cost 221.35 206.39 175.78 143.93 120.97Employee Cost 2,163.72 1,866.45 1,701.78 1,431.52 1,199.85Other Manufacturing Expenses 0.00 0.00 0.00 0.00 96.92Selling and Admin Expenses 0.00 0.00 0.00 0.00 1,439.26Miscellaneous Expenses 3,787.45 3,071.06 2,543.63 2,027.83 264.21Preoperative Exp Capitalised 0.00 0.00 0.00 0.00 -59.55Total Expenses 36,061.96 35,819.17 28,680.13 20,208.16 15,523.22
Mar '14 Mar '13 Mar '12 Mar '11 Mar '10
12 mths 12 mths 12 mths 12 mths 12 mths
Operating Profit 4,721.21 4,709.30 3,770.72 3,454.33 3,016.80PBDIT 5,491.99 5,349.09 4,344.78 4,005.96 3,301.89Interest 259.22 191.19 162.75 72.49 156.85PBDT 5,232.77 5,157.90 4,182.03 3,933.47 3,145.04Depreciation 863.34 710.81 576.14 413.86 370.78Other Written Off 0.00 0.00 0.00 0.00 0.00Profit Before Tax 4,369.43 4,447.09 3,605.89 3,519.61 2,774.26Extra-ordinary items 0.00 0.00 0.00 0.00 72.49PBT (Post Extra-ord Items) 4,369.43 4,447.09 3,605.89 3,519.61 2,846.75Tax 611.08 1,094.27 727.00 857.51 759.00Reported Net Profit 3,758.35 3,352.82 2,878.89 2,662.10 2,087.75Total Value Addition 6,172.52 5,143.90 4,421.19 3,603.28 3,061.66Preference Dividend 0.00 0.00 0.00 0.00 0.00Equity Dividend 862.25 798.17 767.48 706.08 549.52Corporate Dividend Tax 104.04 92.98 101.13 96.56 74.23Per share data (annualised)
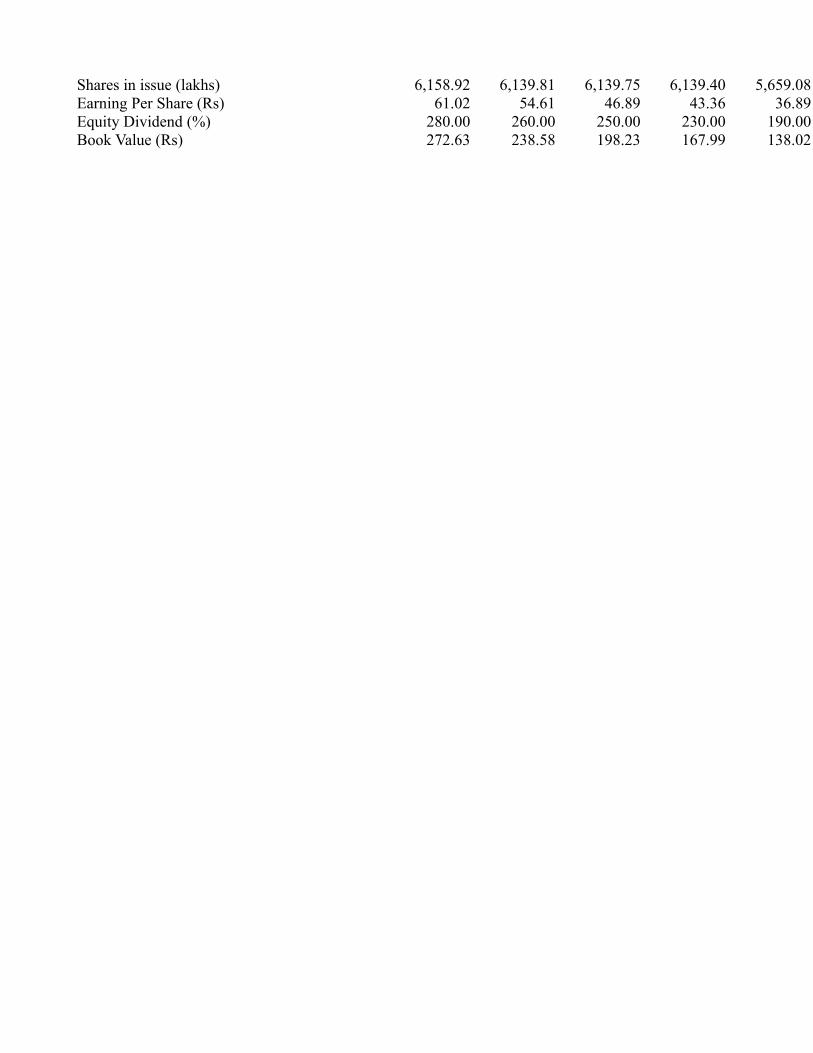
Shares in issue (lakhs) 6,158.92 6,139.81 6,139.75 6,139.40 5,659.08Earning Per Share (Rs) 61.02 54.61 46.89 43.36 36.89Equity Dividend (%) 280.00 260.00 250.00 230.00 190.00Book Value (Rs) 272.63 238.58 198.23 167.99 138.02
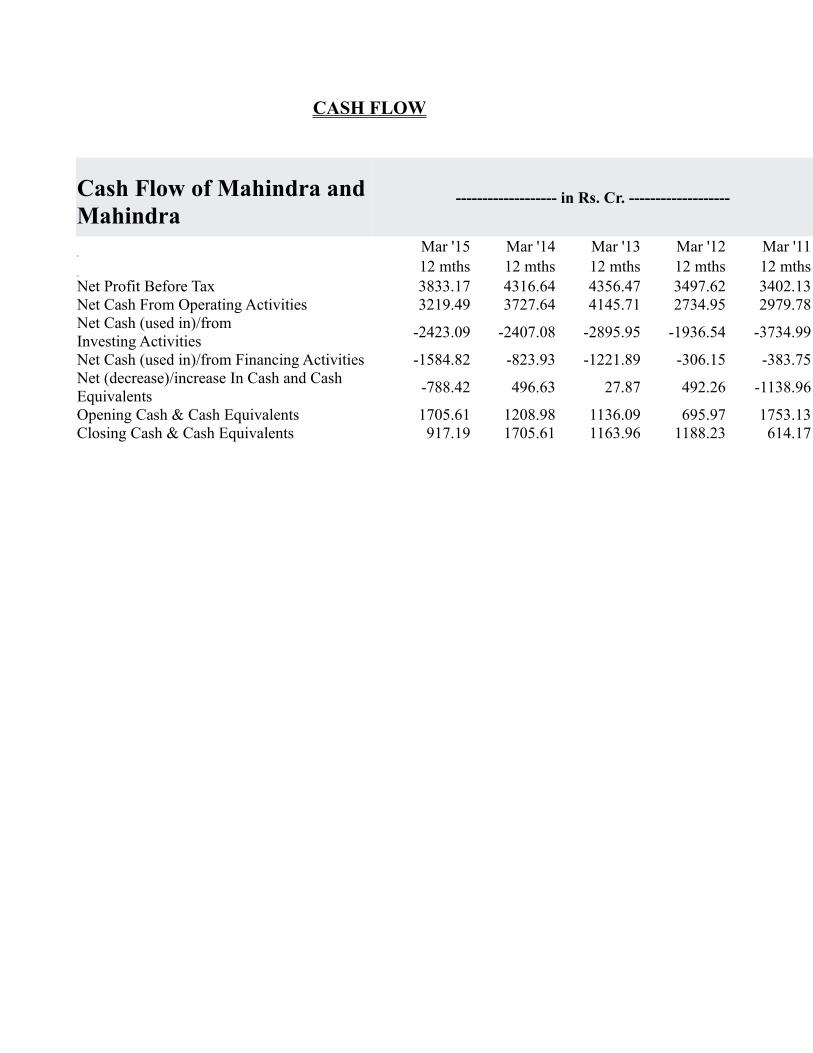
CASH FLOW
Cash Flow of Mahindra andMahindra
------------------- in Rs. Cr. -------------------
Mar '15 Mar '14 Mar '13 Mar '12 Mar '1112 mths 12 mths 12 mths 12 mths 12 mths
Net Profit Before Tax 3833.17 4316.64 4356.47 3497.62 3402.13Net Cash From Operating Activities 3219.49 3727.64 4145.71 2734.95 2979.78Net Cash (used in)/fromInvesting Activities
-2423.09 -2407.08 -2895.95 -1936.54 -3734.99
Net Cash (used in)/from Financing Activities -1584.82 -823.93 -1221.89 -306.15 -383.75Net (decrease)/increase In Cash and Cash Equivalents
-788.42 496.63 27.87 492.26 -1138.96
Opening Cash & Cash Equivalents 1705.61 1208.98 1136.09 695.97 1753.13Closing Cash & Cash Equivalents 917.19 1705.61 1163.96 1188.23 614.17
SWOT ANALYSIS
SWOT analysis means the analysis of,
S-strength
W-Weakness
O-Opportunity
T-Threat
STRENGTH:
Mahindra has been one of the strongest brand in the Indian
automobile market.Excellent branded & advertising and low after
sales service cost.
WEAKNESS:
Mahindra’s partnership with Renault did not live up to
international quality standards through their brand Logan.
OPPORTUNITY:
Developing hybrid cars and fuel efficient cars for the
future.
Tapping emerging market across the world and building a
global brand
Fast growing automobile market.

THREAT:
Government policies for the automobile sector across
the world
Ever increasing fuel prices
Intense competition from global automobile brand
Substitute mode of public transport like buses, metro
trains etc.
CREDIT TERMS
Credit Terms refers to the rules and regulations in the form of an
agreement between the producer and the customers in relation to the
credit facility which the producer gives to their customers. In other
words credit terms are the terms and Conditions which are mutually
agreed upon by the customers and producers and relates to the
benefits which each will provide to other party.
Credit facilities are one of the important decisions it can be taken by
finance manager. Credit facilities must be planned out effectively. So
we can reduce our debtor. Credit facilities help to retain old
consumer and credit new customer by running them away from
competitors.
In Mahindra Pvt. Ltd. Credit facility plays an important role. The
credit terms of Mahindra Limited are fairly straightforward. The
credit period allowed to the dealers is 90 days.
LITERATURE REVIEW
Lev and Sunder (1979) point out, using theoretical deduction, that in order
to control for the size effect, the financial ratios must fulfill very restrictive
proportionality assumptions. It is shown that the choice of the size deflator
(the ratio denominator) is a critical issue. Furthermore, Lev and Sunder bring
up the problems caused in multiple regression models where the explaining
variables are ratios with the same denominator. This is a fact that has been
discussed earlier in statistics oriented literature like in Kuh and Meyer (1955).
Barnes (1982) shows how the non-normality of financial ratios can result from
the underlying relationships of the constituents of the financial ratios.
He is thus able to tie in the ratio format aspects with the distributional
properties of financial ratios. In the discussion on Barnes's paper (Horrigan,
1983, Barnes, 1983), Horrigan puts forward that financial ratio research
should be more interested in the role of the financial ratios themselves than in
"the nature of the ratios' components or to the ratios' incidental role as data
size deflators". To extrapolate from Horrigan's critique, in our own
interpretation the validity of financial ratio analysis should be determined
by its usefulness to the decision making process of the different interested
parties (owners, management, personnel etc.)
Mecimore (1968) In the history of FRA it is common that professional journals
and academic papers do not recognize each other. An early paper on financial
ratio distributions was published in Management Accounting by Mecimore
(1968). It is interesting to recognize that all ingredients of modern distribution
analysis already appear incumbent in Mecimore's paper. Using descriptive
statistical measures (average and relative deviations from the median) he
observes cross-sectional non-normality and positive skewness for twenty ratios
in a sample of randomly selected forty-four Fortune-500 firms.
Bird and McHugh (1977) adopt an efficient small-sample test for the normality
of financial ratios for an Australian sample of five ratios over six years. They
find in their independent study that normality is transient across financial
ratios and time. They also study the adjustment of the financial ratios
towards industry means which is a different area of FRA research.
Bougen and Drury (1980) also suggest non-normality based on a cross-section of
700 UK firms. The results indicating non-normality of financial ratio
distributions have led researchers into looking for methods of restoring
normality to warrant standard parametric statistical analyses. Frecka and
Hopwood(1983) observe that removing outliers and applying transformations in
a large sample covering 1950-79 restored normality in the same financial ratios
as tackled by Deakin (1976).
They point out that if the ratios follow the gamma distribution, the square root
transformation makes the distribution approximately normal. The gamma
distribution is compatible with ratios having a technical lower limit of zero.
While improving the statistical results trimming and transformations can pose a
problem for the theoretical rigor in FRA research. Instead of deleting or
adjusting the observations McLeay (1986a) proposes using a better fitting
distribution with fat tails for making statistical inferences in FRA. He seeks for
a best fitting t-distribution for a cross-section of 1634 UK and Irish firms. Also
his empirical results confirm non-normality.
The best-fitting t-distribution varie across financial ratios (the t-distribution can
be considered a family of distributions defined by its degrees of freedom).
McLeay (1986b) also tackles the choice between equally weighted and value
aggregated financial ratios in terms of ratio distributions on a sample of French
firms.
Typically, many later papers tackle the same basic question of ratio distributions
using different samples and expanding on the methodologies. Buijink and Jegers
(1986) study the financial ratio distributions from year to year from 1977 to
1981 for 11 ratios in Belgian firms collaborating the results of the earlier papers
in the field. Refined industry classification brings less extreme deviation from
normality. They also point to the need of studying the temporal persistence of
cross-sectional financial ratio distributions and suggest a symmetry index for
measuring it.
Salamon (1973) described that the fundamental task of accounting is income
determination and the evaluation of the firm's assets. The measurement of
profitability is intimately linked with both. There is significant body of literature
which considers profitability assessment. In terms of economic theory the
profitability of a firm could be defined as the internal rate of return of the capital
investments constituting the firm, although Salamon (1973) casts doubt of
this view. There is a strong tradition in literature that seeks to estimate the
internal rate of return, either from a time series of the financial statements of the
firm, or, more narrowly, by considering the relationship between the familiar
accounting rate of return (the firm's annual profit in relation to its assets)
and the internal rate of return.
British economists’ present one tradition of tackling the question of the
divergence between the ARR and IRR since Harcourt (1965) put forward his
position that the accountant's rate of return is "extremely misleading". Using four
different cases of accumulation of assets (growth) he asserts that it is not
possible to develop rough rules of thumb to adjust ARR to reflect IRR under
different life spans of investments, the net cash flow patterns generated by
the investments, different growth rates, and different depreciation methods.
He concludes by an explicit warning about profitability comparison between
firms in different industries or different countries if accountants' measurements
are used. It can only be deduced that he implicitly gives very little value for the
financial statements annually prepared by the accounting profession.
Stauffer (1971) presents a generalized analysis of ARR vs IRR relationship using
continuous mathematics under several cash profile assumptions. He
demonstrates that the depreciation schedule affects the relationship. Also he puts
forward that the accounting and the economic measurements (ARR/IRR) are
irreconcilable, and that the situation is aggravated by the introduction of taxation
into the analysis. From the accounting point of view it is interesting that he
points to the task of estimating the real rates of return from historical accounting
data.
Springer (1980) present that Ratio Analysis is an early warning indicator that
enables the business owner and manager to spot trends in a business and to
compare its performance and condition with the average performance of
similar businesses in the same industry. The author relates that Ratio Analysis is
done by comparing the specific company's ratios with the average of similar
businesses and comparing the business's own ratios for several successive
years, watching especially for any unfavorable trends that may be starting. The
paper states that the current ratio measures the ability of the firm to pay is
cu amount needed to pay current obligations.
The Latin American Studies Association (1966) compare and contrasts the
financial performance and position of John Lewis Plc, and Marks & Spencer Plc,
mainly through the process of the ratio analysis of the financial statements of the
two companies. The writer provides a brief introduction of the two
companies under discussion, such as their background information,
similarities and differences and their core business. The writer deals with
calculations of important financial ratios of the two companies and then analyses
these figures. The writer compares and discusses the ratios in detail, discussing
possible causes of changes and fluctuations and coming to various conclusions
about the performance of the two companies.
In addition, the writer looks at certain limitations of the exercise of ratio
analysis, emphasizing the fact, that even though ratio analysis is a great
means of understanding the financial position of a company better, there are still
many other factors which can impact those numbers but are difficult to quantify.
The writer concludes by highlighting the main findings of the report and
presenting a personal opinion on the attractive of two companies from an
investor's viewpoint.

TYPES OF RESEARCH
The research done here is an ANALYTICAL type of research. In
ANALYTICAL RESEARCH the published facts and figures is used. In this type of
research than the information is analyzes to make a critical evaluation of the
material.
There is balance sheet and P & L a/c of the company for last 3
years and through this information it is best choose analytical research.

MEANING OF RESEARCH
Research in common parlance refers to a search for knowledge. One
can also define research as a scientific and systematic for pertinent information on a
specific topic. In fact, research is an art of scientific investigation. The Advanced
Learner’s Dictionary of Current English lays down the meaning of research as a“a
careful investigation or inquiry specially through search for new facts in any branch of
knowledge.”
Research is an academic activity and as such the term should be
used in a technical sense, According to Clifford Woody, “research comprise defining
and redefining problems , formulating hypothesis or suggested solution: collecting ,
organizing and evaluating data ; making deduction and reaching conclusions ; and
at last carefully testing the conclusions to determine whether they fit the formulating
hypothesis.
DATA COLLECTION METHOD
Data collection is the selection of sources of information and
selection of methods and procedures for gathering the data needed for any
research.
“ The search for answers to research questions is called collection
of data.”
“Data are facts and other relevant materials serving a bases for
study& analysis.”
For economy analysis, various types of survey’s data are collected
from ministry of finance. Industry analysis was carried from the various research
report prepared by the government of India. The company analysis is done through
financial statements , which are required for analyzing the ratios, balance sheet and
profit & loss a/c , which is collected from the company Sidhhivinayak Motors Pvt. Ltd.
The task of data collection begins after a research problem has
been defined and research design/plan chalked out.
While deciding about the method of data collection to be
used for the study, the researcher should keep in mind two types of data…
1. Primary data method.
2. Secondary data method.
For my study purpose I have used SECONDARY DATA
METHOD. And the data is collected from the internet (website) and some data
from the company and then calculation & analysis is done.
The basic significance or merits of secondary data are:-
- Readymade availability.
- Available quickly and cheaply.
- Less time is consumed.
- Less effort is required to collect the data.
RESEARCH PROBLEM
There are so many industries contributing to economic development
of the nation and manufacturing industries touch almost every sphere of economic
activity. They have far reaching consequences on economic development of
country. Manufacturing industries is one of the leading factors in economic
development.
Although the manufacturing industry runs successfully, it does have to
face many problems faced by the manufacturing industries is inconsistency in the
profit they earn. While taking major decisions, the manufacturing need to take
into consideration the prevailing in its profit.
Thus, it becomes necessary for every manufacturing industry to know
its current trend of profit earned.
OBJECTIVE OF THE STUDY
The main aim of research is to find out the truth which is hidden and which
has not been discovered yet.
Our main objective is to explore the factors affecting the financial position of the
company through analysis of ratios of the financial ear 2011-2012, 2012-2013,
2013-2014, and 2014-2015
To know the current trend of profits of different suitings firm and
estimate the forecast for the coming year.
To compare and analyze the profitability ratios between the past
records.
TO UNDERSTAND THE nature of the profit in manufacturing industry.
To display the strategies this helped the firm for future success.
To study the effect when all ratio are combined together.
To identify the effect of one thing on another.
To understand the working of all through which financial position is
known.

RATIO ANALYSIS
The financial statements as prepared and presented annually are
of little use for guidance of prospective investors, creditors, and even management.
If relationship between various related items in these financial statement is
established, they can provide useful clues to gauge accurately the financial health
and ability of business to make profit. This relation between two related items of
financial statements is known as Ratio. A ratio is thus, one number expressed in
terms of another.
Ratio analysis is one of the techniques of financial analysis
where ratios are used as a yardstick for evaluating the financial condition and
performance of a firm. Analysis and interpretation of various accounting ratios gives
a skilled and experienced analyst a better understanding of the financial
condition and performance of the firm than he could have obtained only through
a perusal of financial statements.
Ratios are relationship expressed in mathematical terms
figures which are connected with each other in some manner.
Obviously, no purpose will be served by comparing two sets
of figures which are not at all connected with each other.
Ratio analysis simplifies the comprehension of financial
statements. Ratios tell the whole story of changes in the financial condition of the
business. Ratio analysis helps in planning and forecasting. Over a period of time a
firm or industry develops certain norms that may Indicate future success or
failure. If relationships changes in firm’s data over different time periods , the
ratios may provide clues on trends and future problems.
Thus, “ratios can assist management in basic function of
forecasting, planning, coordination, control and communication.”
A ratio is customarily expressed in three different ways
.
1. It may be expressed as “proportion” between two figures,
E.g. 2:1
2. Second is to express it in the form of “percentage”,
E.g. 30%
3. Third is to express it as “rates”,
E.g. 6 times a year
UTILITY OF RATIO ANALYSIS
1. Liquidity position:-
With the help of ratio analysis, conclusion can be drawn
regarding the liquidity position of firm. The liquidity position of a firm
would be satisfactory if it is able to meet its current obligations when they
become due.
2. Long-term solvency:-
This aspect of the financial position of a borrower is of concern
to the long term creditors, security analysis and the present and potential
owners of a business.
3. Operating efficiency:-
It throws light on the degree of efficiency in the management
and utilization of its assets. It would be recalled that the various activity
ratios measure this kind of operational efficiency.
4. Over-all profitability:-
The management is concerned about the ability of the firm to
meet its short-term as well as long term obligations to its creditors, to
ensure a reasonable return to its owners and secure optimum utilization of
the assets of a firm.
5. Inter-firm comparison:-
Ratio analysis is not only throws light on the financial position
of a firm but also serves as a stepping stone to remedial measure. This is made
possible inter-firm comparison/comparison with industrial averages.
6. Trend analysis:-
Whether the financial position of a firm is improving or
deteriorating over the years. This is made possible by the use of a trend analysis.
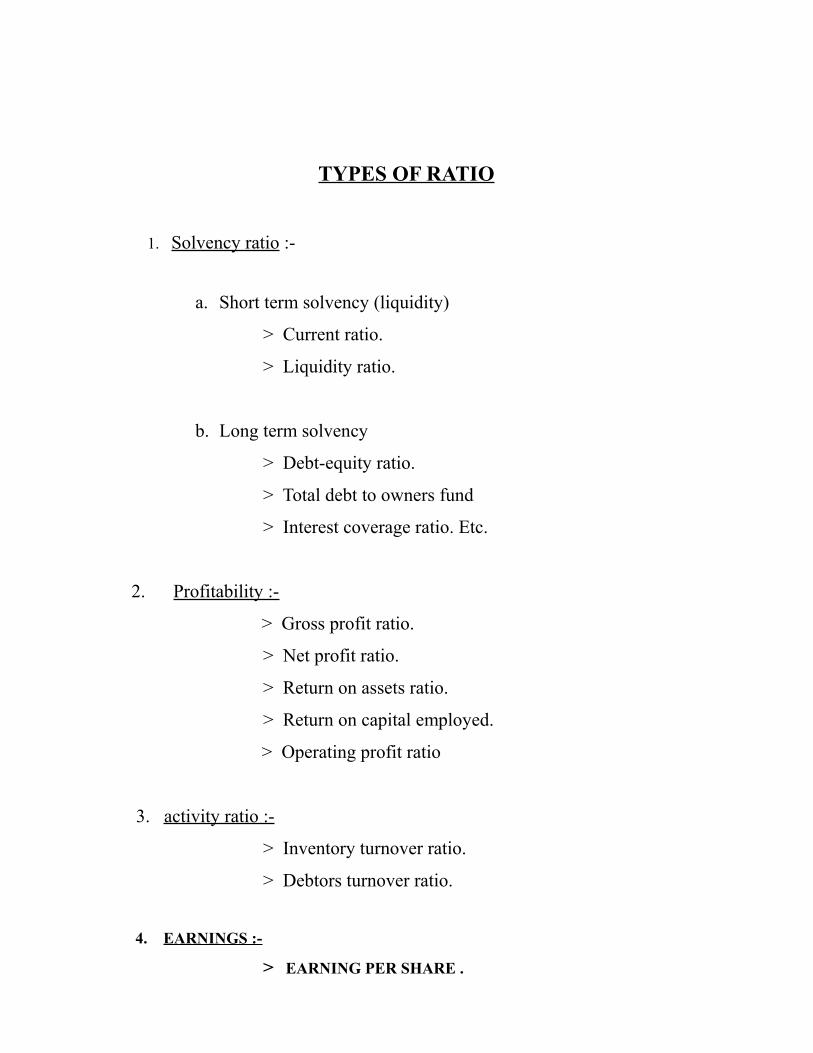
TYPES OF RATIO
1. Solvency ratio :-
a. Short term solvency (liquidity)
> Current ratio.
> Liquidity ratio.
b. Long term solvency
> Debt-equity ratio.
> Total debt to owners fund
> Interest coverage ratio. Etc.
2. Profitability :-
> Gross profit ratio.
> Net profit ratio.
> Return on assets ratio.
> Return on capital employed.
> Operating profit ratio
3. activity ratio :-
> Inventory turnover ratio.
> Debtors turnover ratio.
4. EARNINGS :-
> EARNING PER SHARE .
DATA ANALYSIS & INTERPRETATIONCALCULATION OF RATIO
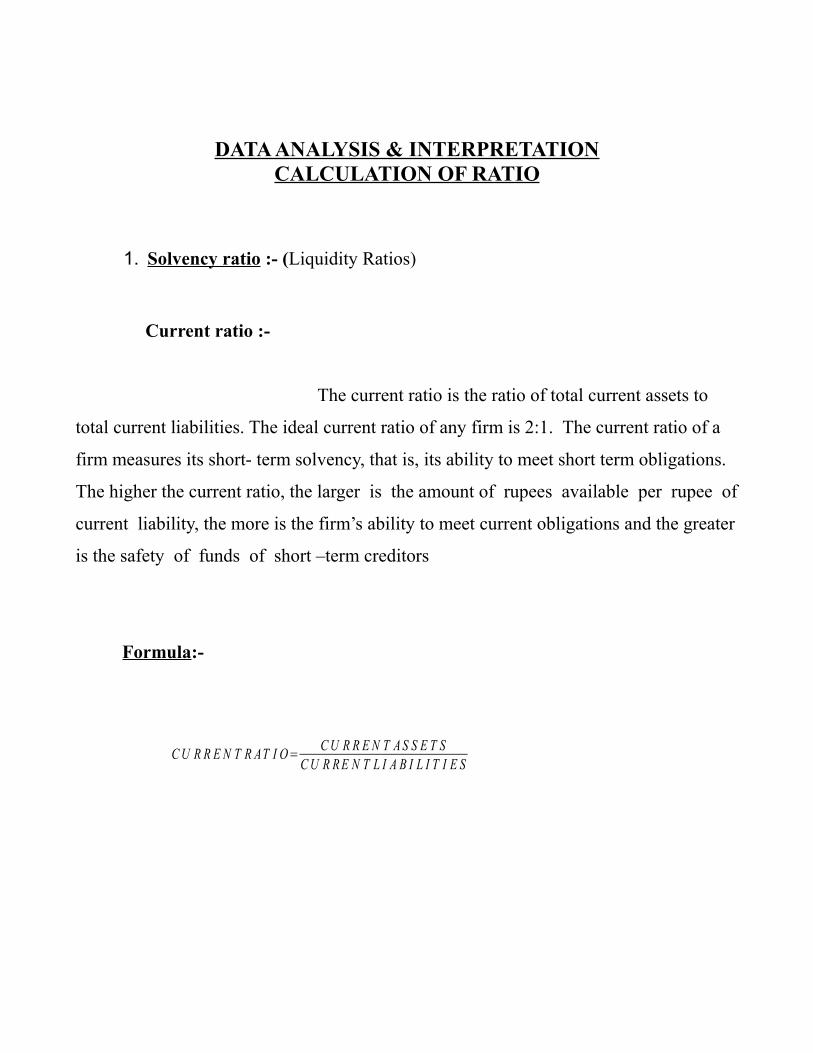
1. Solvency ratio :- (Liquidity Ratios)
Current ratio :-
The current ratio is the ratio of total current assets to
total current liabilities. The ideal current ratio of any firm is 2:1. The current ratio of a
firm measures its short- term solvency, that is, its ability to meet short term obligations.
The higher the current ratio, the larger is the amount of rupees available per rupee of
current liability, the more is the firm’s ability to meet current obligations and the greater
is the safety of funds of short –term creditors
Formula:-
C U R R E N T R AT I O=C U R R E N T A S S E T S
C U R R E N T L I A B I L I T I E S
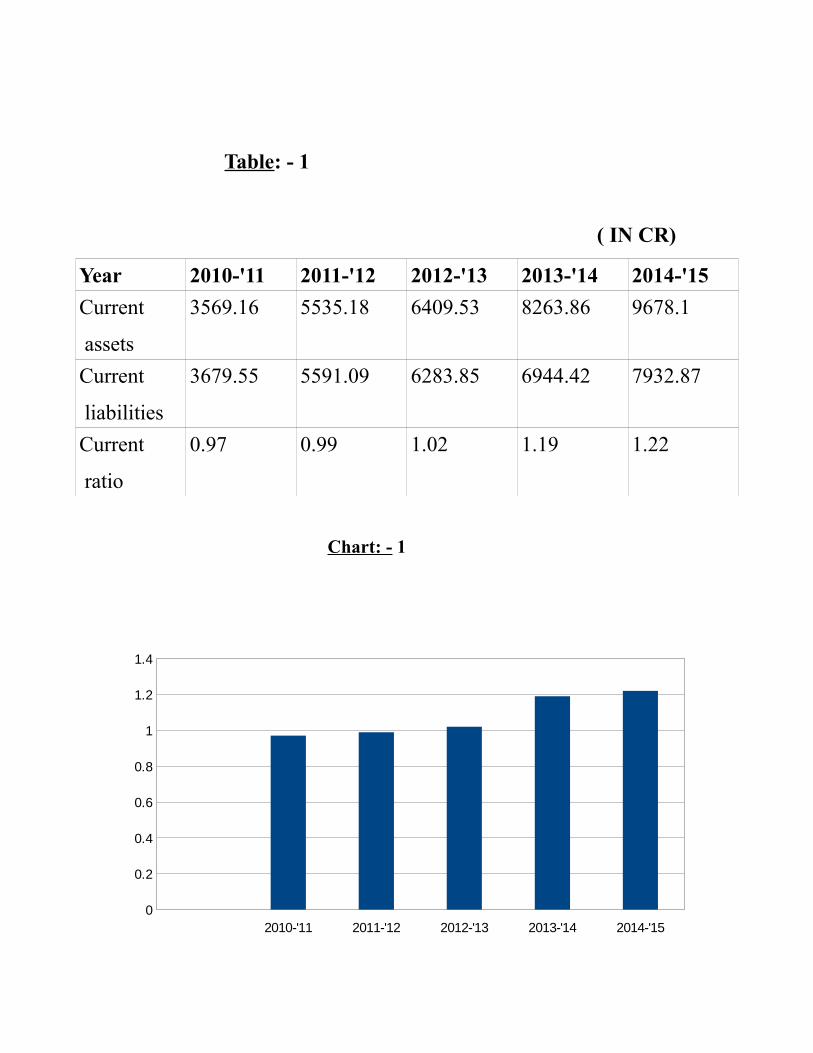
Table: - 1
( IN CR)
Year 2010-'11 2011-'12 2012-'13 2013-'14 2014-'15
Current
assets
3569.16 5535.18 6409.53 8263.86 9678.1
Current
liabilities
3679.55 5591.09 6283.85 6944.42 7932.87
Current
ratio
0.97 0.99 1.02 1.19 1.22
Chart: - 1
2010-'11 2011-'12 2012-'13 2013-'14 2014-'150
0.2
0.4
0.6
0.8
1
1.2
1.4
INTERPRETATION :-
From graphical representation we can observe that
current ratio improve from 2011 to 2015 means firm’s liquidity improved year by
year .Higher ratio is preferable because it shows better short term solvency. But very
high ratio of current asset to current liability is indication of poor credit management
and firm may not make full use of its borrowing capacity.
QUICK RATIO:
This ratio is also called liquid ratio or acid test ratio. It
establishes a relationship between quick assets and quick liabilities. Quick assets
includes all the current assets except stock & prepaid expenses and quick liabilities refer
to liabilities which are repayable within a short period. It refers to current liabilities
excluding bank overdraft & cash credit.
The actual quick ratio has to be compared with the
standard or ideal quick ratio of 1:1. If the actual quick ratio is equal to or more than the
standard quick ratio of 1:1, the conclusion can be that the concern is liquid, and so,
it can pay off its short-term liabilities out of its quickly realizable assets without
any difficulty. On the other hand, if the actual quick ratio is less than the standard ratio
of 1:1, the conclusion can be that the concern is not liquid.
Formula:-
Where,
Quick Assets = current assets-(stock + prepaid expenses)
Quick Liabilities = current liabilities - bank O
Q U I C K A S S E T S=L I Q U I D A S S E T S
L I Q U I D L I A B I L I T I E S
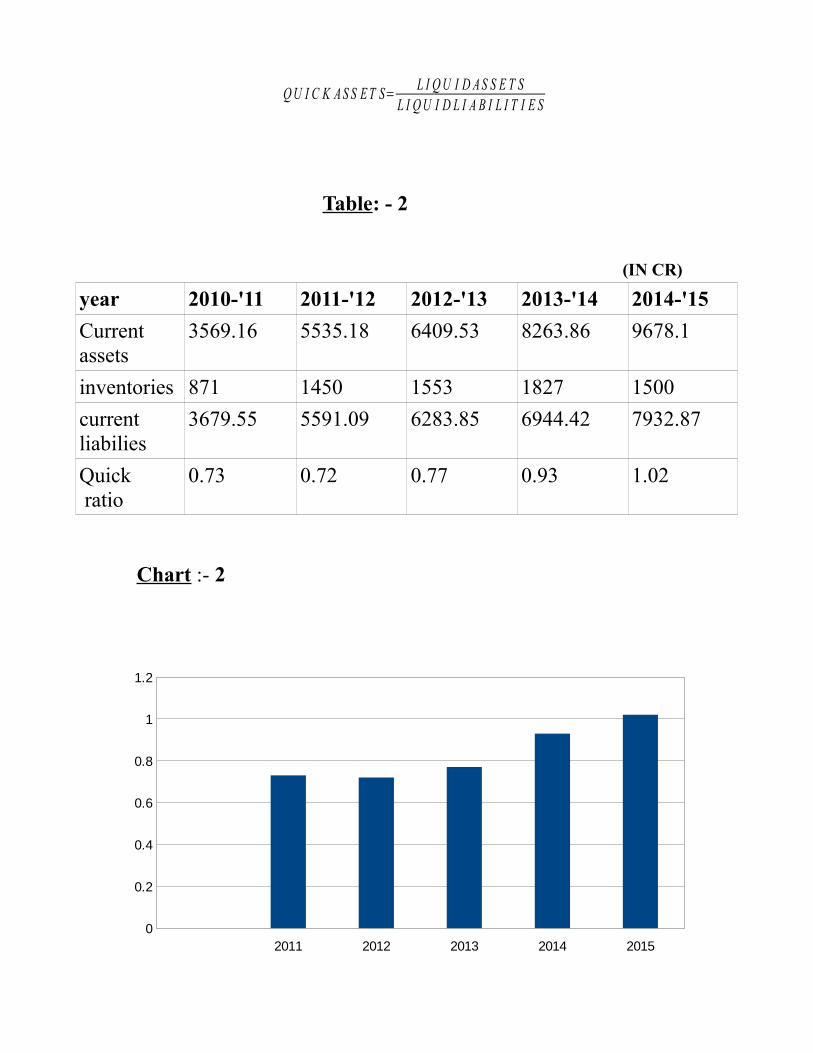
Table: - 2
(IN CR)
year 2010-'11 2011-'12 2012-'13 2013-'14 2014-'15
Currentassets
3569.16 5535.18 6409.53 8263.86 9678.1
inventories 871 1450 1553 1827 1500
current liabilies
3679.55 5591.09 6283.85 6944.42 7932.87
Quick ratio
0.73 0.72 0.77 0.93 1.02
Chart :- 2
2011 2012 2013 2014 20150
0.2
0.4
0.6
0.8
1
1.2
INTERPRETATION:-
Quick ratio shows liquidity of firm. It is same as
current ratio but it’s more stringent than current ratio. Because it exclude inventory and
advance means those current assets which can not easily convert in cash. Liquidity in
terms of ability of firm to meet obligation immediately and that can be current assets and
all those assets which can easily convert into cash.. So from table we can see quick
ratio improved means firm’s liquidity improved. It shows decrease in liquid liabilities.
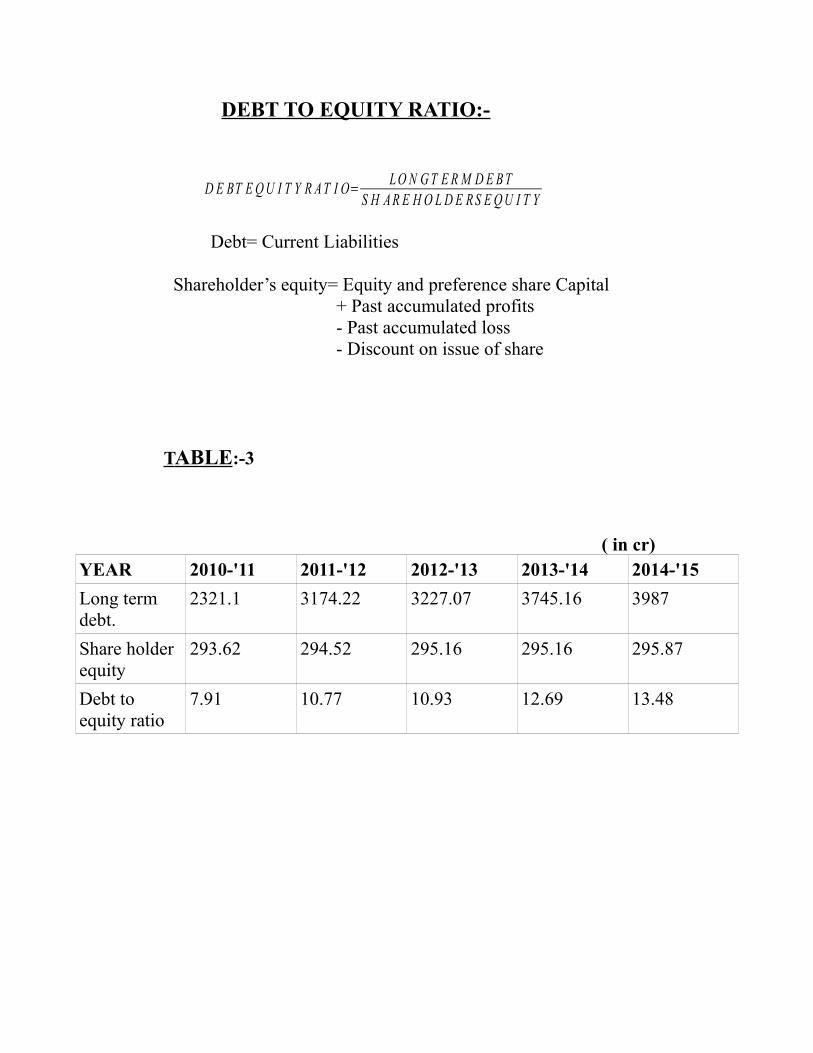
DEBT TO EQUITY RATIO:-
D E BT E Q U I T Y R AT I O=LO N G T E R M D E B T
S H AR E H O L D E R S E Q U I T Y
Debt= Current Liabilities Shareholder’s equity= Equity and preference share Capital + Past accumulated profits - Past accumulated loss - Discount on issue of share
T ABLE:-3
( in cr)YEAR 2010-'11 2011-'12 2012-'13 2013-'14 2014-'15
Long termdebt.
2321.1 3174.22 3227.07 3745.16 3987
Share holderequity
293.62 294.52 295.16 295.16 295.87
Debt to equity ratio
7.91 10.77 10.93 12.69 13.48
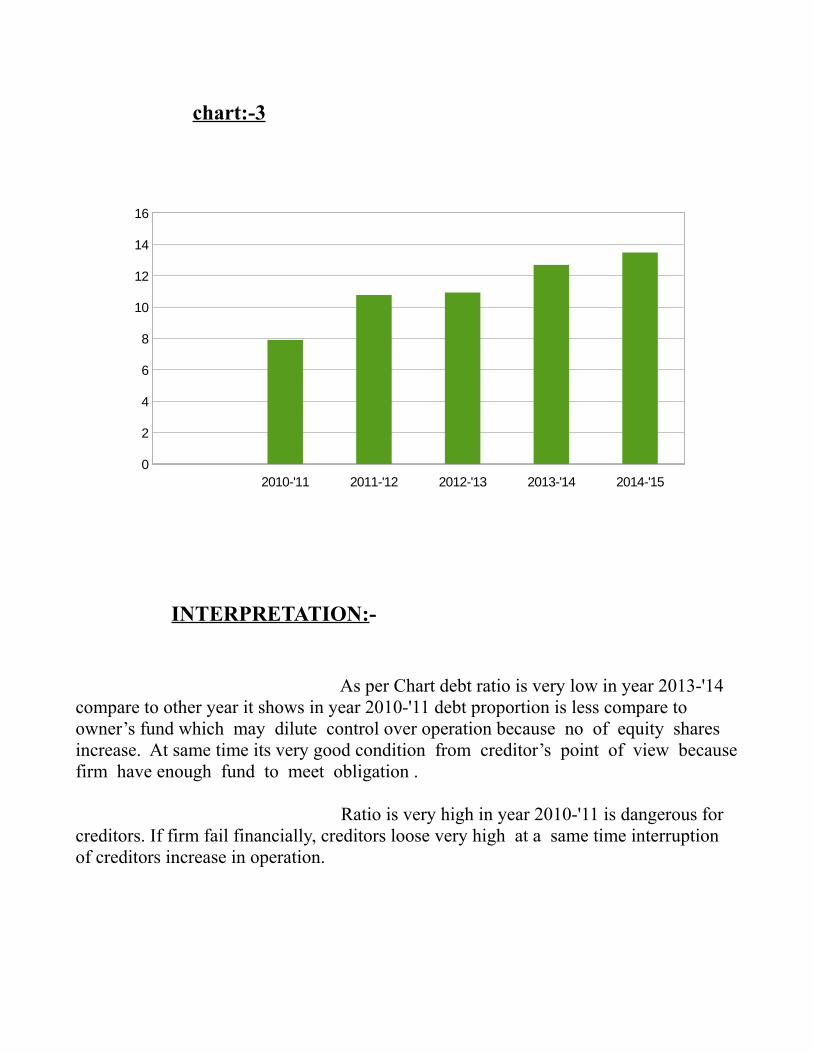
chart:-3
INTERPRETATION:-
As per Chart debt ratio is very low in year 2013-'14 compare to other year it shows in year 2010-'11 debt proportion is less compare to owner’s fund which may dilute control over operation because no of equity shares increase. At same time its very good condition from creditor’s point of view becausefirm have enough fund to meet obligation .
Ratio is very high in year 2010-'11 is dangerous for creditors. If firm fail financially, creditors loose very high at a same time interruption of creditors increase in operation.
2010-'11 2011-'12 2012-'13 2013-'14 2014-'150
2
4
6
8
10
12
14
16
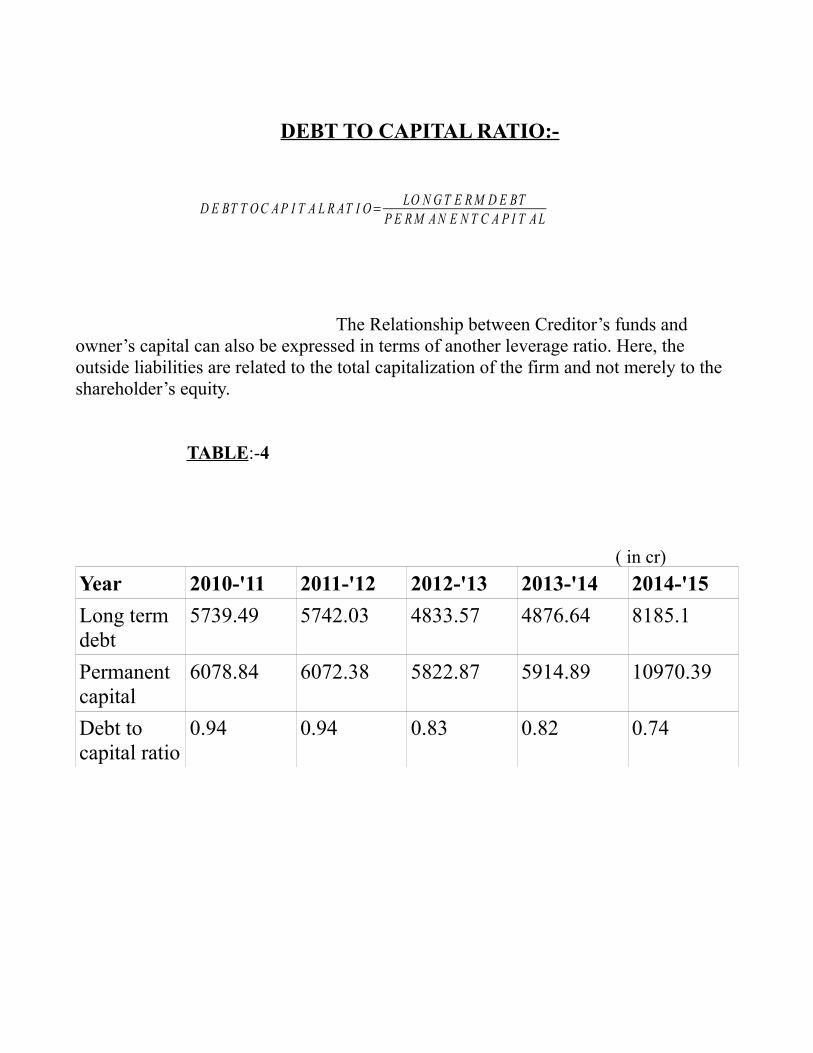
DEBT TO CAPITAL RATIO:-
D E BT T O C A P I T A L R AT I O=LO N G T E R M D E BT
P E RM AN E N T C A P I T A L
The Relationship between Creditor’s funds and owner’s capital can also be expressed in terms of another leverage ratio. Here, the outside liabilities are related to the total capitalization of the firm and not merely to the shareholder’s equity.
TABLE:-4
( in cr)
Year 2010-'11 2011-'12 2012-'13 2013-'14 2014-'15
Long term debt
5739.49 5742.03 4833.57 4876.64 8185.1
Permanentcapital
6078.84 6072.38 5822.87 5914.89 10970.39
Debt to capital ratio
0.94 0.94 0.83 0.82 0.74
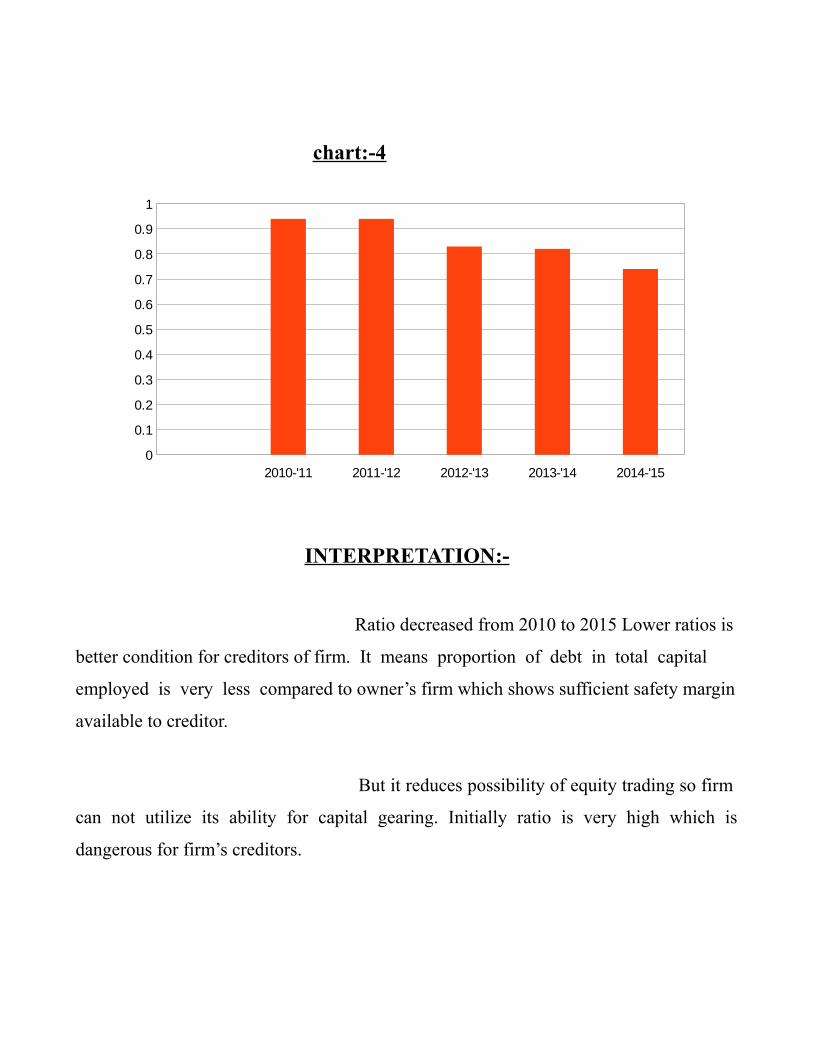
chart:-4
INTERPRETATION:-
Ratio decreased from 2010 to 2015 Lower ratios is
better condition for creditors of firm. It means proportion of debt in total capital
employed is very less compared to owner’s firm which shows sufficient safety margin
available to creditor.
But it reduces possibility of equity trading so firm
can not utilize its ability for capital gearing. Initially ratio is very high which is
dangerous for firm’s creditors.
2010-'11 2011-'12 2012-'13 2013-'14 2014-'150
0.1
0.2
0.3
0.4
0.5
0.6
0.7
0.8
0.9
1
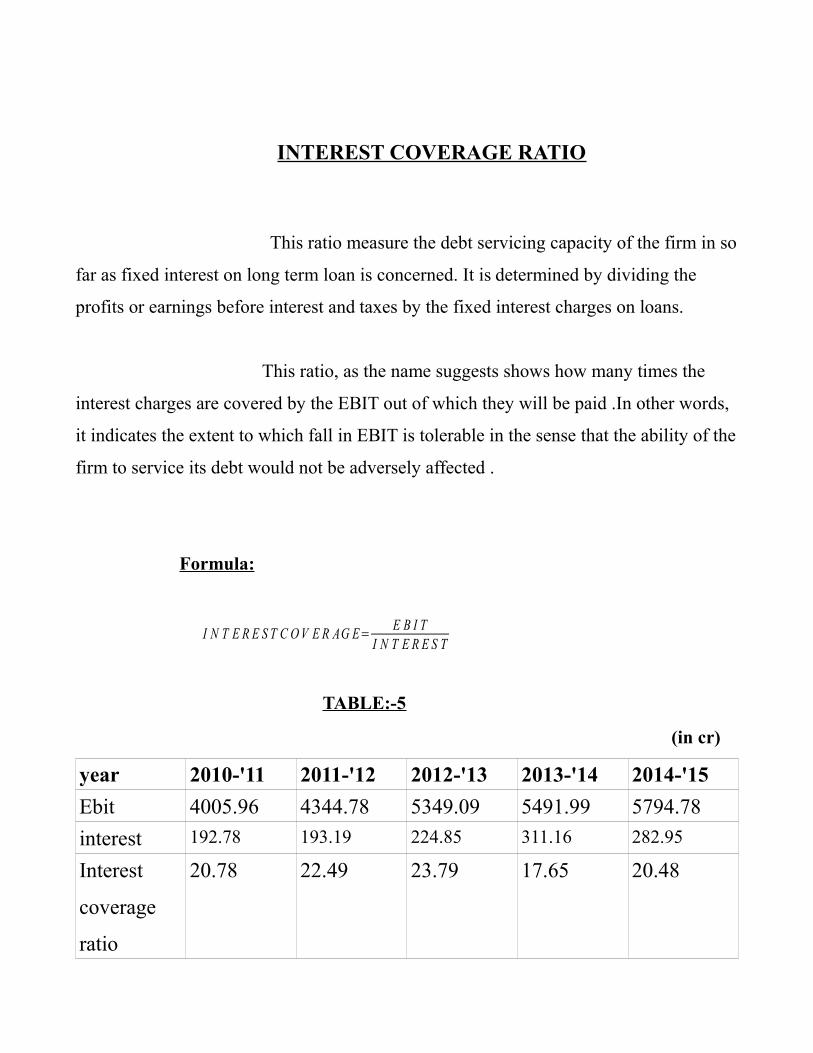
INTEREST COVERAGE RATIO
This ratio measure the debt servicing capacity of the firm in so
far as fixed interest on long term loan is concerned. It is determined by dividing the
profits or earnings before interest and taxes by the fixed interest charges on loans.
This ratio, as the name suggests shows how many times the
interest charges are covered by the EBIT out of which they will be paid .In other words,
it indicates the extent to which fall in EBIT is tolerable in the sense that the ability of the
firm to service its debt would not be adversely affected .
Formula:
I N T E R E S T C O V E R AG E=E B I T
I N T E R E S T
TABLE:-5
(in cr)
year 2010-'11 2011-'12 2012-'13 2013-'14 2014-'15
Ebit 4005.96 4344.78 5349.09 5491.99 5794.78
interest 192.78 193.19 224.85 311.16 282.95
Interest
coverage
ratio
20.78 22.49 23.79 17.65 20.48
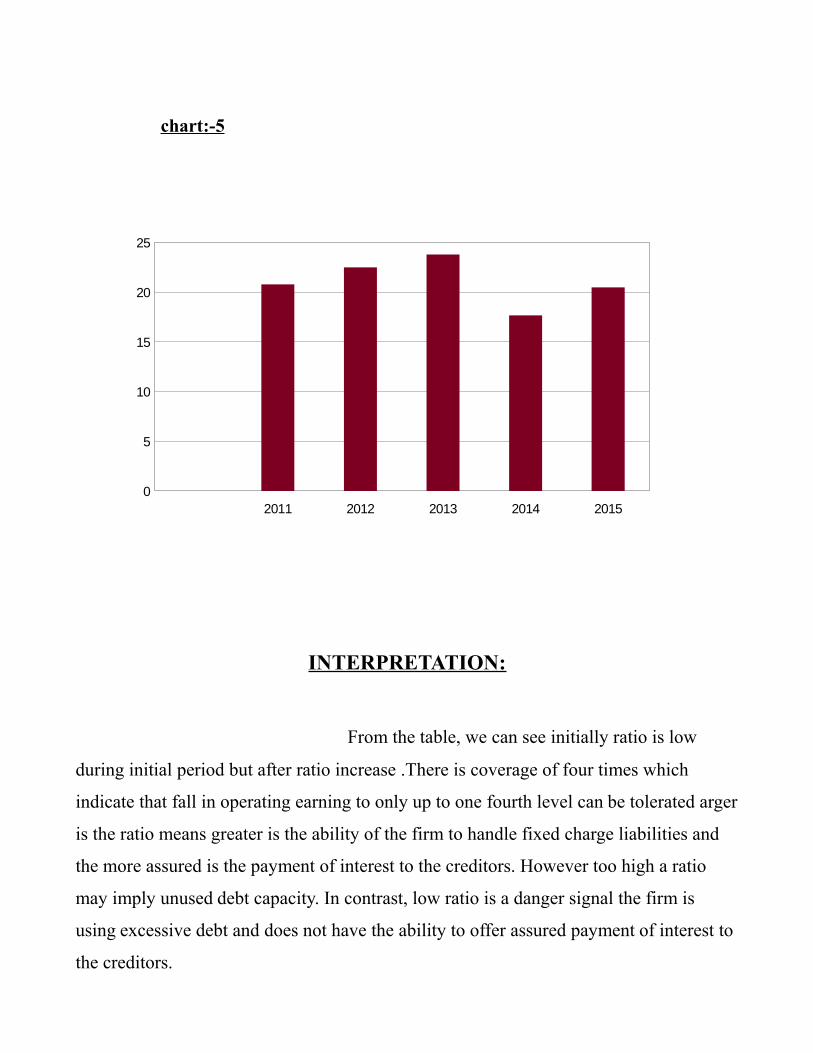
chart:-5
INTERPRETATION:
From the table, we can see initially ratio is low
during initial period but after ratio increase .There is coverage of four times which
indicate that fall in operating earning to only up to one fourth level can be tolerated arger
is the ratio means greater is the ability of the firm to handle fixed charge liabilities and
the more assured is the payment of interest to the creditors. However too high a ratio
may imply unused debt capacity. In contrast, low ratio is a danger signal the firm is
using excessive debt and does not have the ability to offer assured payment of interest to
the creditors.
2011 2012 2013 2014 20150
5
10
15
20
25
PROFITABILITY RATIO
A company should earn profit to survive and grow
over a long time. Profits are essential, but it would be wrong to assume that every
initiated by management of a company should be aimed maximizing profit fact that
sufficient profit must be earned to sustain the operations of the bus in be able to obtain
funds from investors for expansion and growth and to can towards the social overhead
for the welfare of the society.
Profit is ultimate output of a company, and it will have
no future fails to make sufficient profit. Therefore, the financial manager should
continue valuate the efficiency of its company in term of profit. The profitability ratio
calculated to measure the operating efficiency of the company. Besides management of
the company, creditors and owners are also interested in the profitability firm.
Generally, two major types of profitability ratios are calculated:
# Profitability in relation to sales
# Profitability in relation to investment
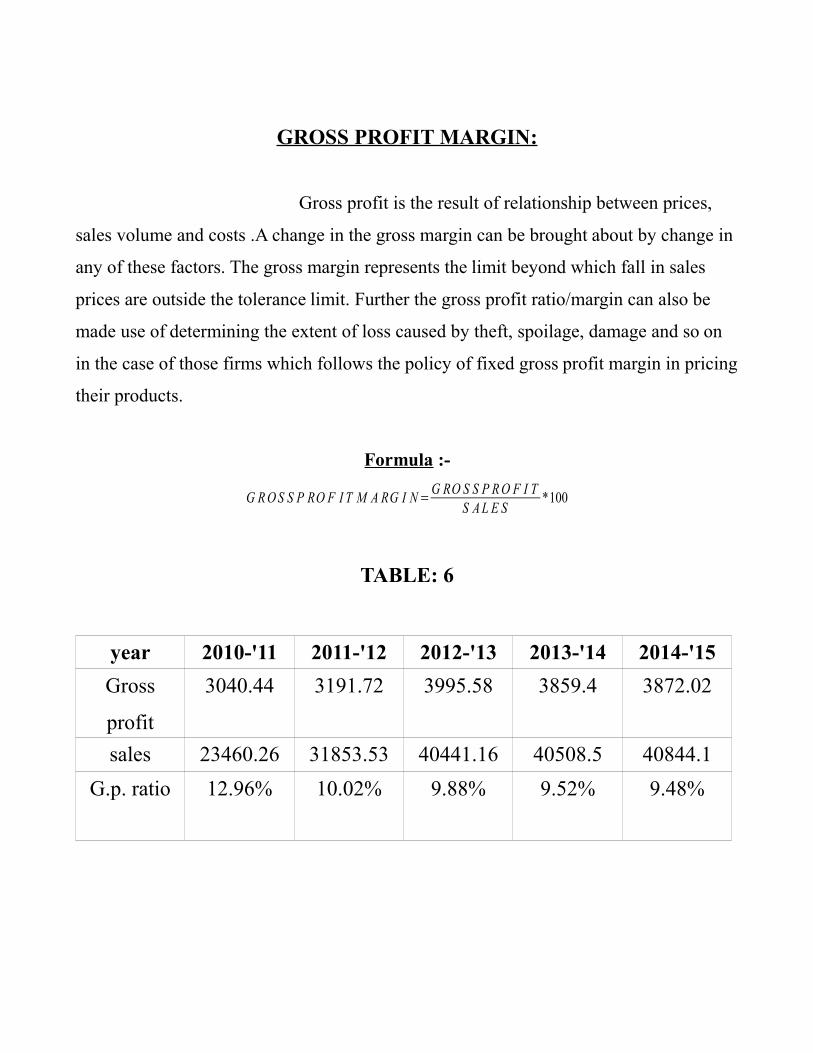
GROSS PROFIT MARGIN:
Gross profit is the result of relationship between prices,
sales volume and costs .A change in the gross margin can be brought about by change in
any of these factors. The gross margin represents the limit beyond which fall in sales
prices are outside the tolerance limit. Further the gross profit ratio/margin can also be
made use of determining the extent of loss caused by theft, spoilage, damage and so on
in the case of those firms which follows the policy of fixed gross profit margin in pricing
their products.
Formula :-
G R O S S P RO F I T M A RG I N=G RO S S P R O F I T
S A L E S*100
TABLE: 6
year 2010-'11 2011-'12 2012-'13 2013-'14 2014-'15
Gross
profit
3040.44 3191.72 3995.58 3859.4 3872.02
sales 23460.26 31853.53 40441.16 40508.5 40844.1
G.p. ratio 12.96% 10.02% 9.88% 9.52% 9.48%
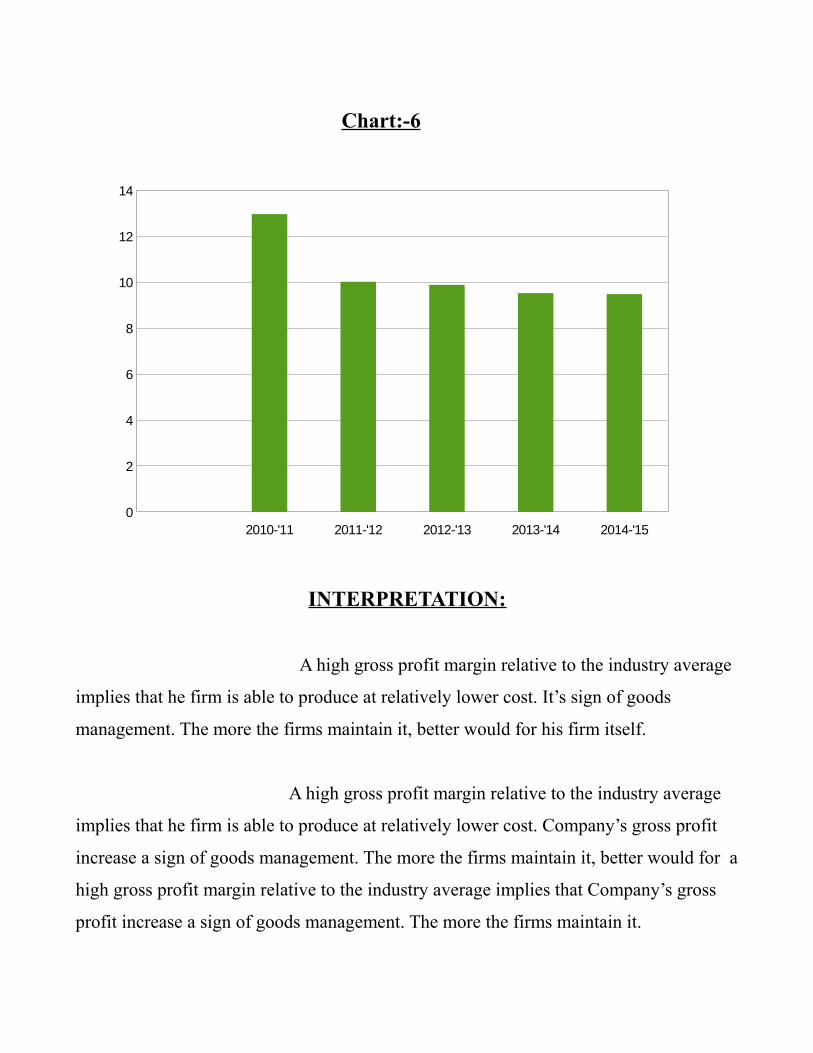
Chart:-6
INTERPRETATION:
A high gross profit margin relative to the industry average
implies that he firm is able to produce at relatively lower cost. It’s sign of goods
management. The more the firms maintain it, better would for his firm itself.
A high gross profit margin relative to the industry average
implies that he firm is able to produce at relatively lower cost. Company’s gross profit
increase a sign of goods management. The more the firms maintain it, better would for a
high gross profit margin relative to the industry average implies that Company’s gross
profit increase a sign of goods management. The more the firms maintain it.
2010-'11 2011-'12 2012-'13 2013-'14 2014-'150
2
4
6
8
10
12
14
NET PROFIT:-
N E T P R O F I T R AT I O=N E T P RO F I T
S A L E S*100
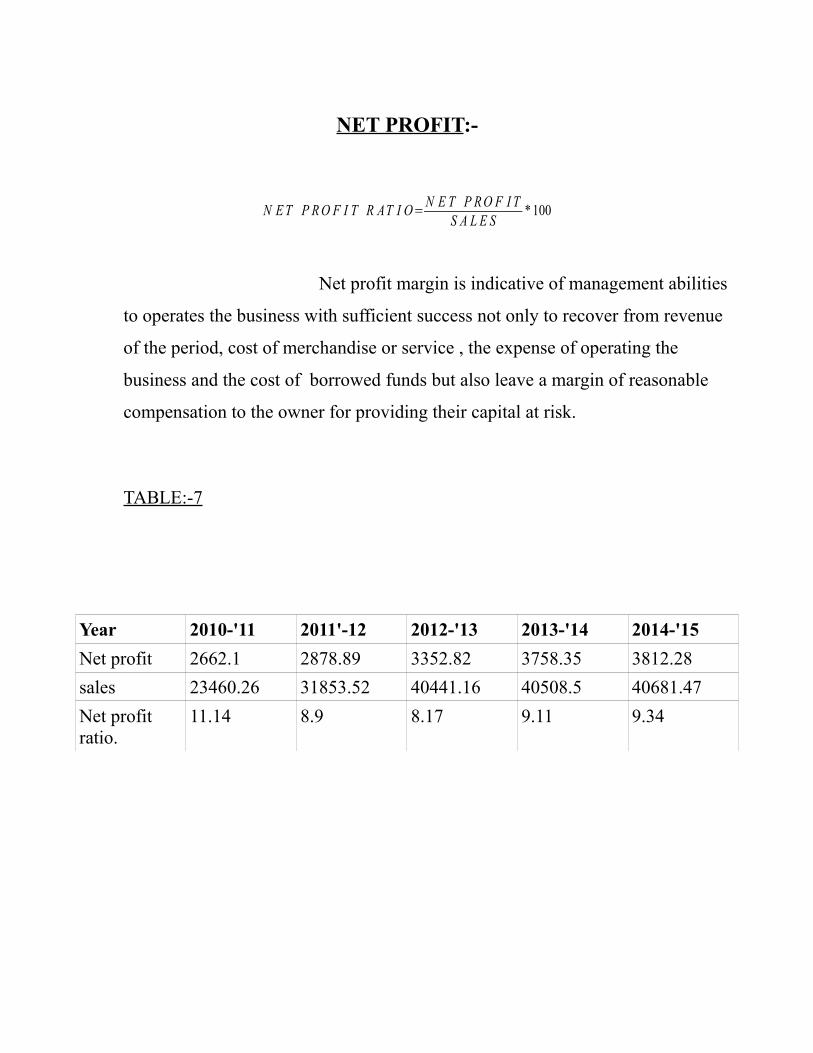
Net profit margin is indicative of management abilities
to operates the business with sufficient success not only to recover from revenue
of the period, cost of merchandise or service , the expense of operating the
business and the cost of borrowed funds but also leave a margin of reasonable
compensation to the owner for providing their capital at risk.
TABLE:-7
Year 2010-'11 2011'-12 2012-'13 2013-'14 2014-'15
Net profit 2662.1 2878.89 3352.82 3758.35 3812.28
sales 23460.26 31853.52 40441.16 40508.5 40681.47
Net profit ratio.
11.14 8.9 8.17 9.11 9.34
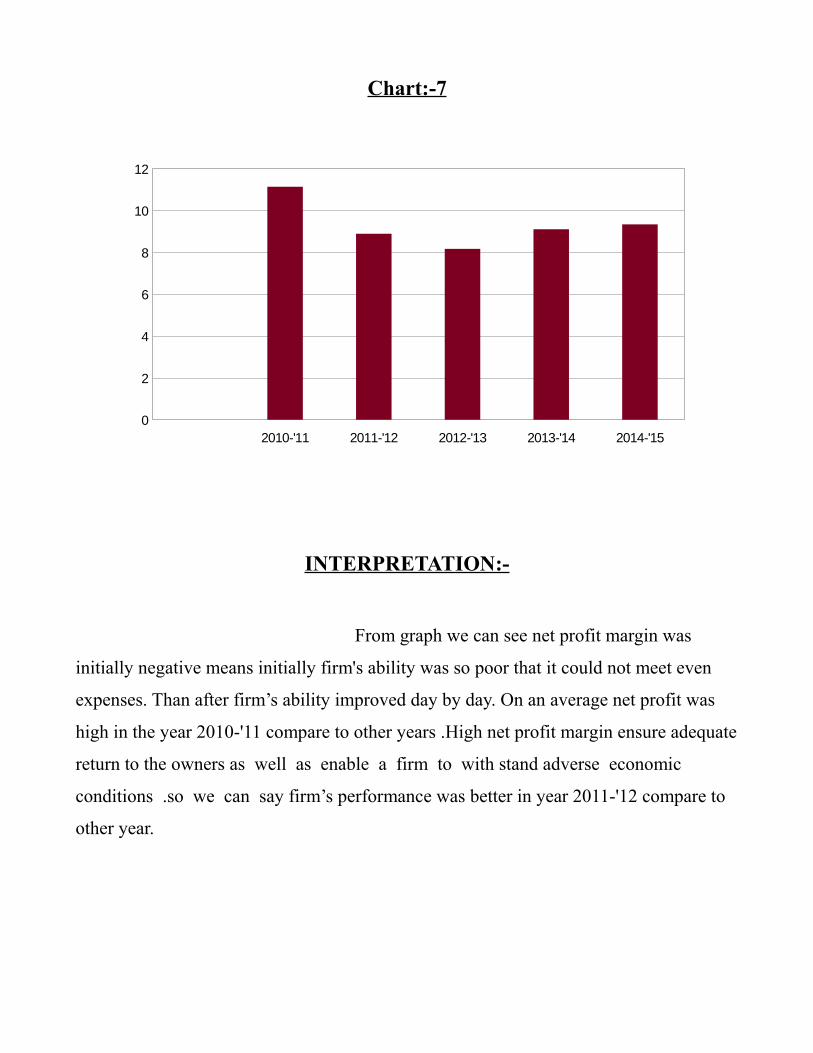
Chart:-7
INTERPRETATION:-
From graph we can see net profit margin was
initially negative means initially firm's ability was so poor that it could not meet even
expenses. Than after firm’s ability improved day by day. On an average net profit was
high in the year 2010-'11 compare to other years .High net profit margin ensure adequate
return to the owners as well as enable a firm to with stand adverse economic
conditions .so we can say firm’s performance was better in year 2011-'12 compare to
other year.
2010-'11 2011-'12 2012-'13 2013-'14 2014-'150
2
4
6
8
10
12
RETURN ON CAPITAL EMPLOYED:-
E B I T R E T U R N O N C A P . E M P LO Y E D=E B I T
S H A R E C A P I T A L+R E S E R V E S+LO N G T E R M LO A N
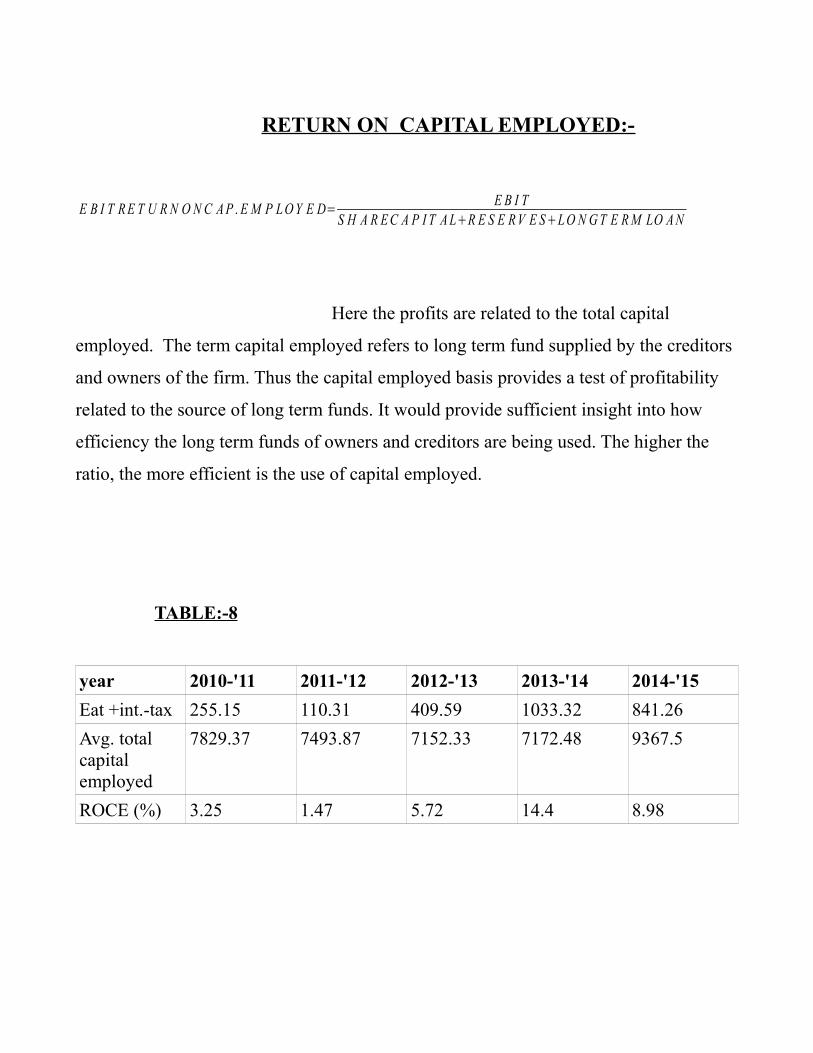
Here the profits are related to the total capital
employed. The term capital employed refers to long term fund supplied by the creditors
and owners of the firm. Thus the capital employed basis provides a test of profitability
related to the source of long term funds. It would provide sufficient insight into how
efficiency the long term funds of owners and creditors are being used. The higher the
ratio, the more efficient is the use of capital employed.
TABLE:-8
year 2010-'11 2011-'12 2012-'13 2013-'14 2014-'15
Eat +int.-tax 255.15 110.31 409.59 1033.32 841.26
Avg. totalcapital employed
7829.37 7493.87 7152.33 7172.48 9367.5
ROCE (%) 3.25 1.47 5.72 14.4 8.98
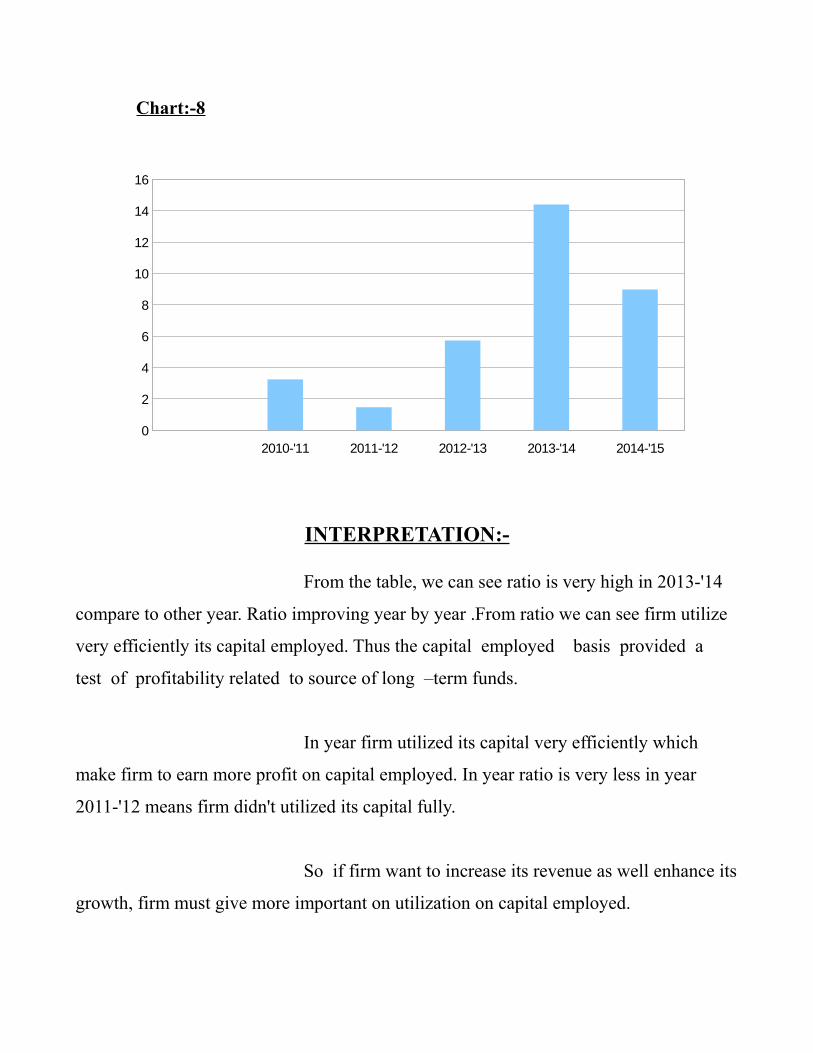
Chart:-8
INTERPRETATION:-
From the table, we can see ratio is very high in 2013-'14
compare to other year. Ratio improving year by year .From ratio we can see firm utilize
very efficiently its capital employed. Thus the capital employed basis provided a
test of profitability related to source of long –term funds.
In year firm utilized its capital very efficiently which
make firm to earn more profit on capital employed. In year ratio is very less in year
2011-'12 means firm didn't utilized its capital fully.
So if firm want to increase its revenue as well enhance its
growth, firm must give more important on utilization on capital employed.
2010-'11 2011-'12 2012-'13 2013-'14 2014-'150
2
4
6
8
10
12
14
16
RETURN ON ASSET:-
R et u r nO n A s se t s=E AT ( N et P r o f i t A f t e r T a x )
A v er a g eT o t a l A s se t s*100
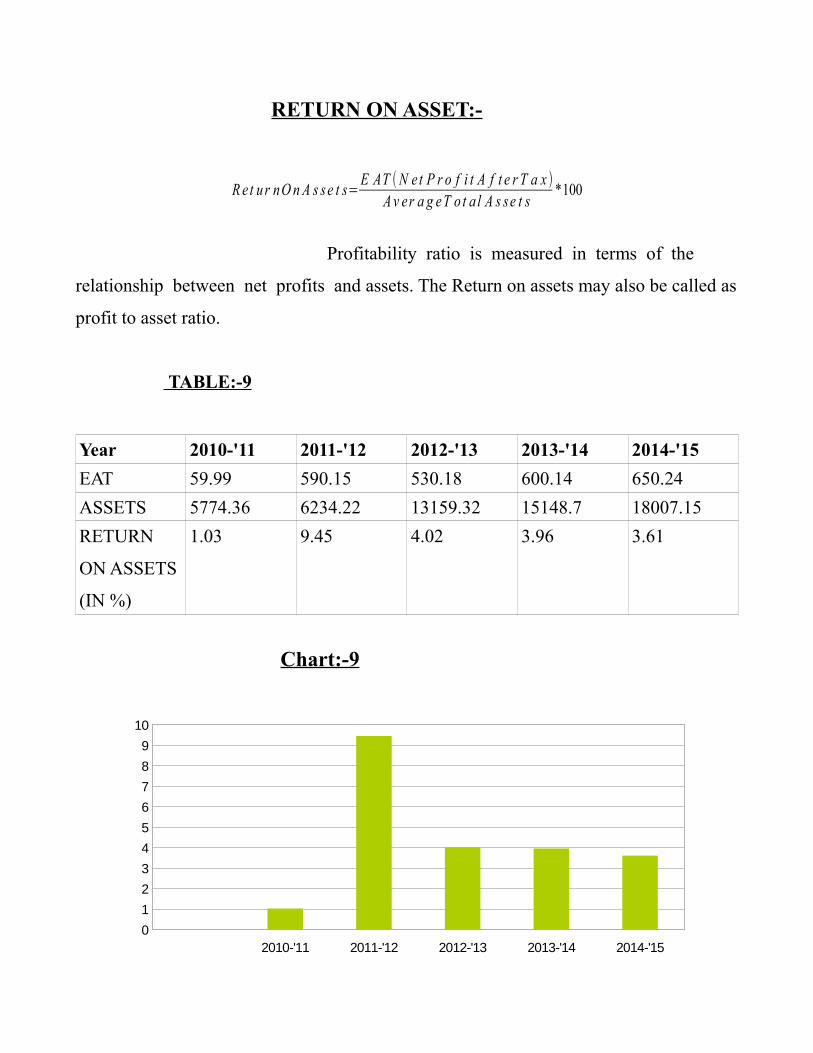
Profitability ratio is measured in terms of the
relationship between net profits and assets. The Return on assets may also be called as
profit to asset ratio.
TABLE:-9
Year 2010-'11 2011-'12 2012-'13 2013-'14 2014-'15
EAT 59.99 590.15 530.18 600.14 650.24
ASSETS 5774.36 6234.22 13159.32 15148.7 18007.15
RETURN
ON ASSETS
(IN %)
1.03 9.45 4.02 3.96 3.61
Chart:-9
2010-'11 2011-'12 2012-'13 2013-'14 2014-'150
1
2
3
4
5
6
7
8
9
10
INTERPRETATION:-
This ratio gives the relationship between profit and
asset. From table we can see ratio is negative in year 2011and it increase from 2011 to
2015. So we can see firm was able to earn higher profit in year 2010 on asset.
The Return on assets measures the profitability of the
total funds /investments of a firm .so we can say year by year firm’s ability to earn.
OPERATING PROFIT RATIO:-
O pe r a t i n g R a t i o=C o st o f g oo d s o l d +o p er a t i n g e x pe n se
S a l e s* 100
O pe r a t i n g P r o f i tS a l e s
*100
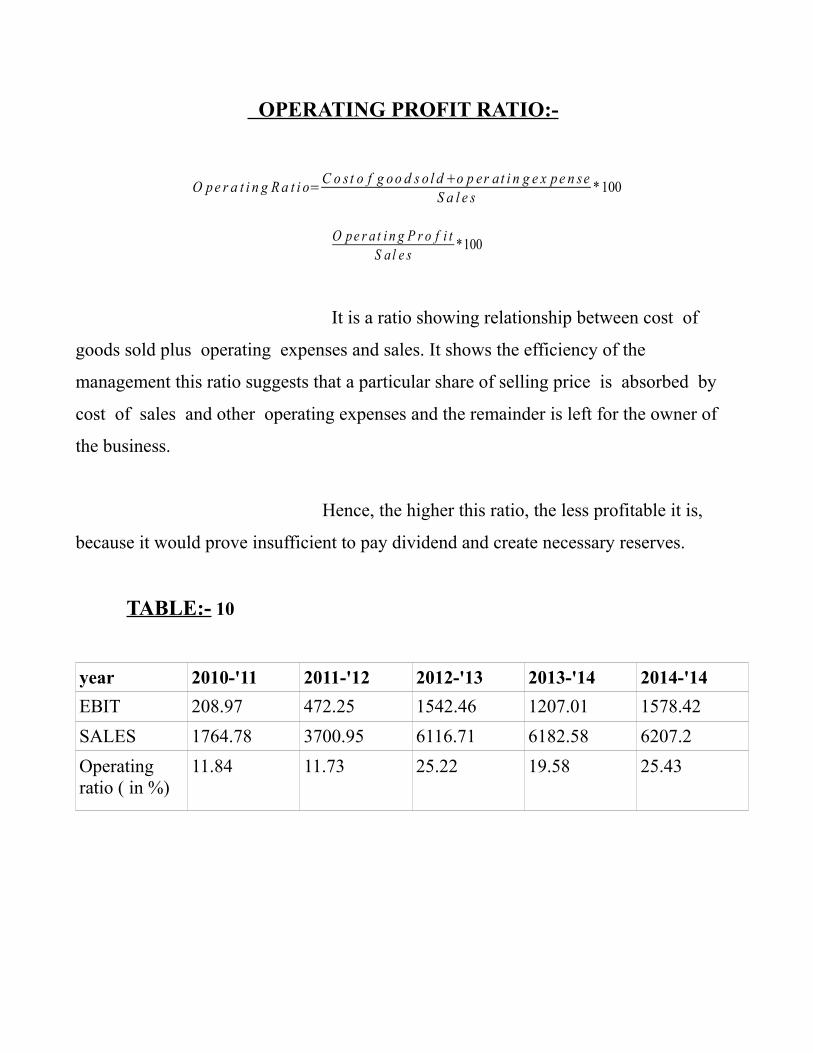
It is a ratio showing relationship between cost of
goods sold plus operating expenses and sales. It shows the efficiency of the
management this ratio suggests that a particular share of selling price is absorbed by
cost of sales and other operating expenses and the remainder is left for the owner of
the business.
Hence, the higher this ratio, the less profitable it is,
because it would prove insufficient to pay dividend and create necessary reserves.
TABLE:- 10
year 2010-'11 2011-'12 2012-'13 2013-'14 2014-'14
EBIT 208.97 472.25 1542.46 1207.01 1578.42
SALES 1764.78 3700.95 6116.71 6182.58 6207.2
Operating ratio ( in %)
11.84 11.73 25.22 19.58 25.43
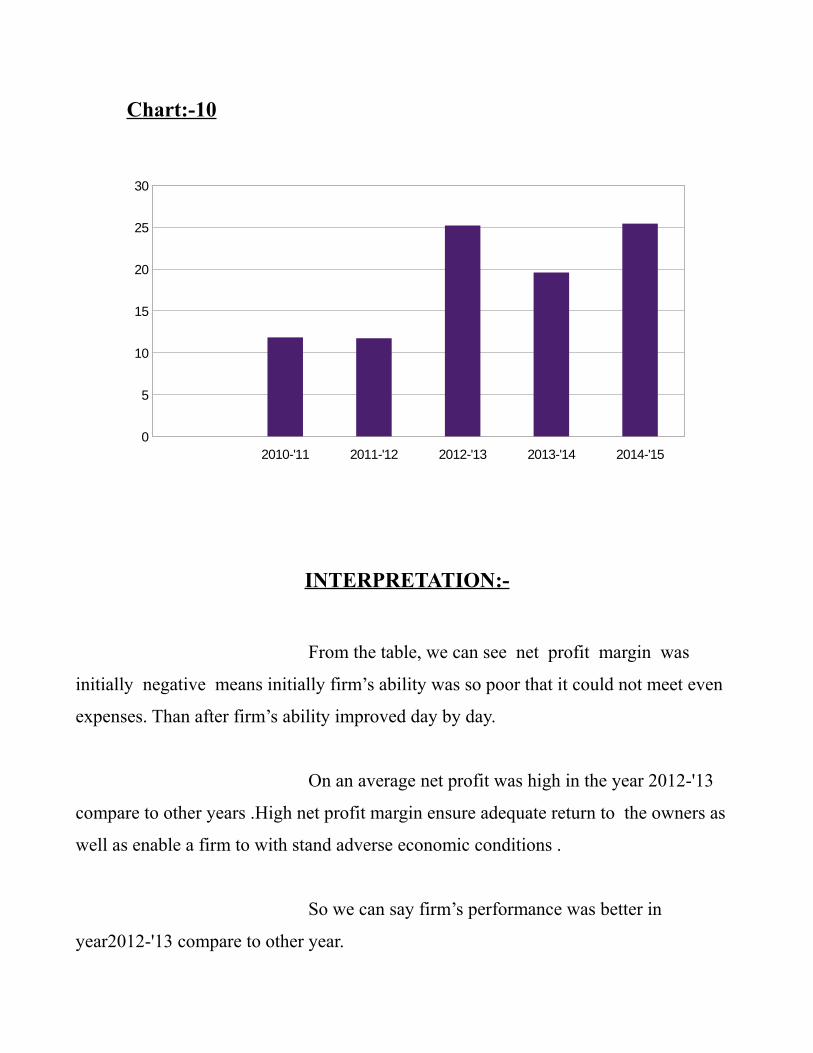
Chart:-10
INTERPRETATION:-
From the table, we can see net profit margin was
initially negative means initially firm’s ability was so poor that it could not meet even
expenses. Than after firm’s ability improved day by day.
On an average net profit was high in the year 2012-'13
compare to other years .High net profit margin ensure adequate return to the owners as
well as enable a firm to with stand adverse economic conditions .
So we can say firm’s performance was better in
year2012-'13 compare to other year.
2010-'11 2011-'12 2012-'13 2013-'14 2014-'150
5
10
15
20
25
30
Activity ratio:-
INVENTORY TURNOVER RATIO
formula:-
I n ve n t or yT u r no ve r Ra t i o=C o st o f G oo d s S o d
A v e r a g eS t oc k
The number of times the average stock is turned over
during year is known as inventory turnover. It is computed by dividing the cost of goods
sold by the average stock in the business. The ideal value of this ratio is 8 to 12 times.
The ratio is very important in judging the ability of management with which it can move
the stock. The higher the turnover, the more profitable the business would be. A low
turnover indicates accumulation of slow –moving, obsolete and low- quality goods,
which is a danger signal to the management.
Low figure are generally poor as they indicate
excessively high low moving stocks. At the end of the scale, and apart from advertising
agencies and other service industries, ready mixed concrete companies probably have
one of the better inventory figures
.
Measure the number of times a company converts its
stock into sales during the year. When examining this ratio it should be born in that
different companies will have varying levels of stock turnover depending on what they
produce and the industry they operate in.
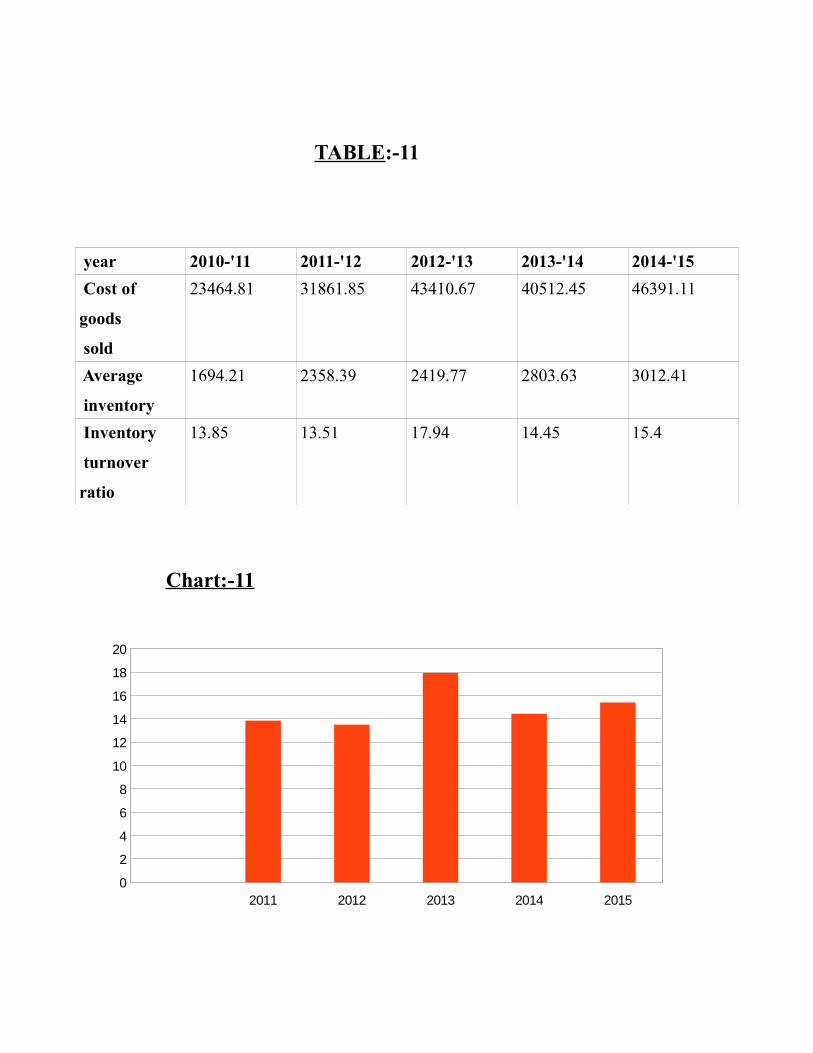
TABLE:-11
year 2010-'11 2011-'12 2012-'13 2013-'14 2014-'15
Cost of
goods
sold
23464.81 31861.85 43410.67 40512.45 46391.11
Average
inventory
1694.21 2358.39 2419.77 2803.63 3012.41
Inventory
turnover
ratio
13.85 13.51 17.94 14.45 15.4
Chart:-11
2011 2012 2013 2014 20150
2
4
6
8
10
12
14
16
18
20
INTERPRETATION:-
This ratio show mainly how fast inventories is sold .In year
ratio is highest it means inventory sold at very rapid rate which increase liquidity
position of firm.
From graph we can see on an average ratio remain constant.
But ratio is not so high so firm is not so much efficient to convert into cash .Most of
its inventory remain idle in storage.
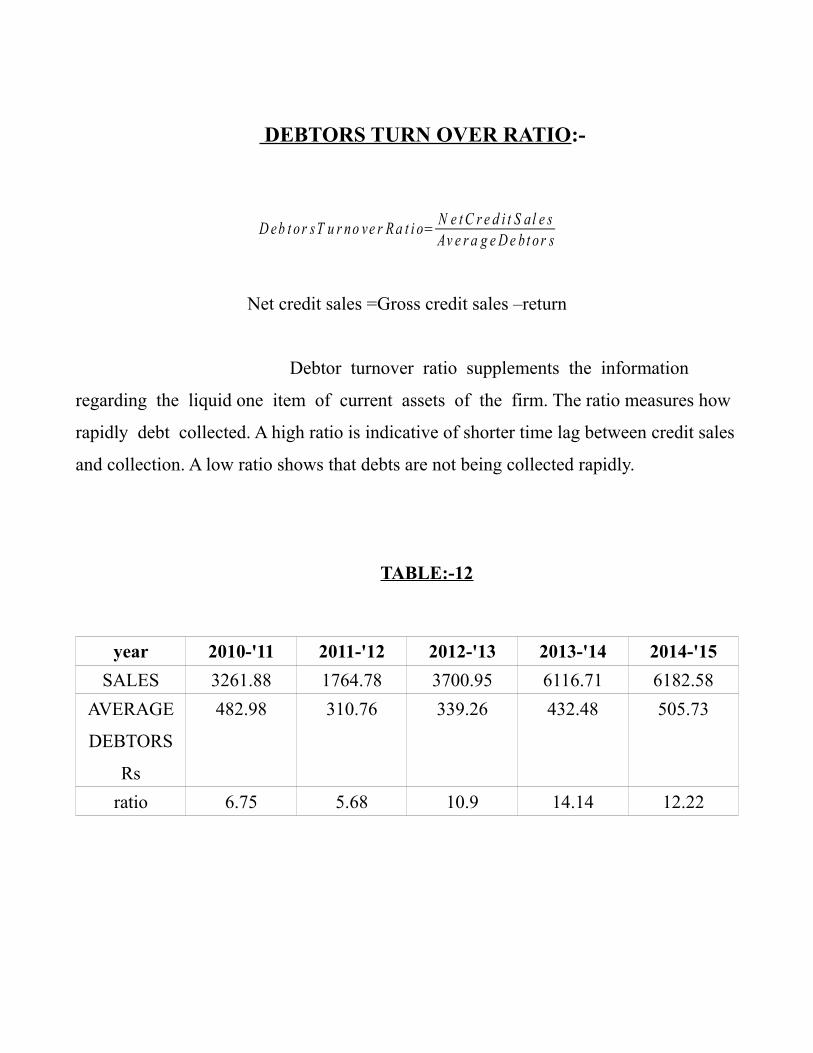
DEBTORS TURN OVER RATIO:-
D eb t o r sT u r no ve r R a t i o=N e t C r e d i t S a l e sAv e r a g e D e b t o r s
Net credit sales =Gross credit sales –return
Debtor turnover ratio supplements the information
regarding the liquid one item of current assets of the firm. The ratio measures how
rapidly debt collected. A high ratio is indicative of shorter time lag between credit sales
and collection. A low ratio shows that debts are not being collected rapidly.
TABLE:-12
year 2010-'11 2011-'12 2012-'13 2013-'14 2014-'15
SALES 3261.88 1764.78 3700.95 6116.71 6182.58
AVERAGE
DEBTORS
Rs
482.98 310.76 339.26 432.48 505.73
ratio 6.75 5.68 10.9 14.14 12.22
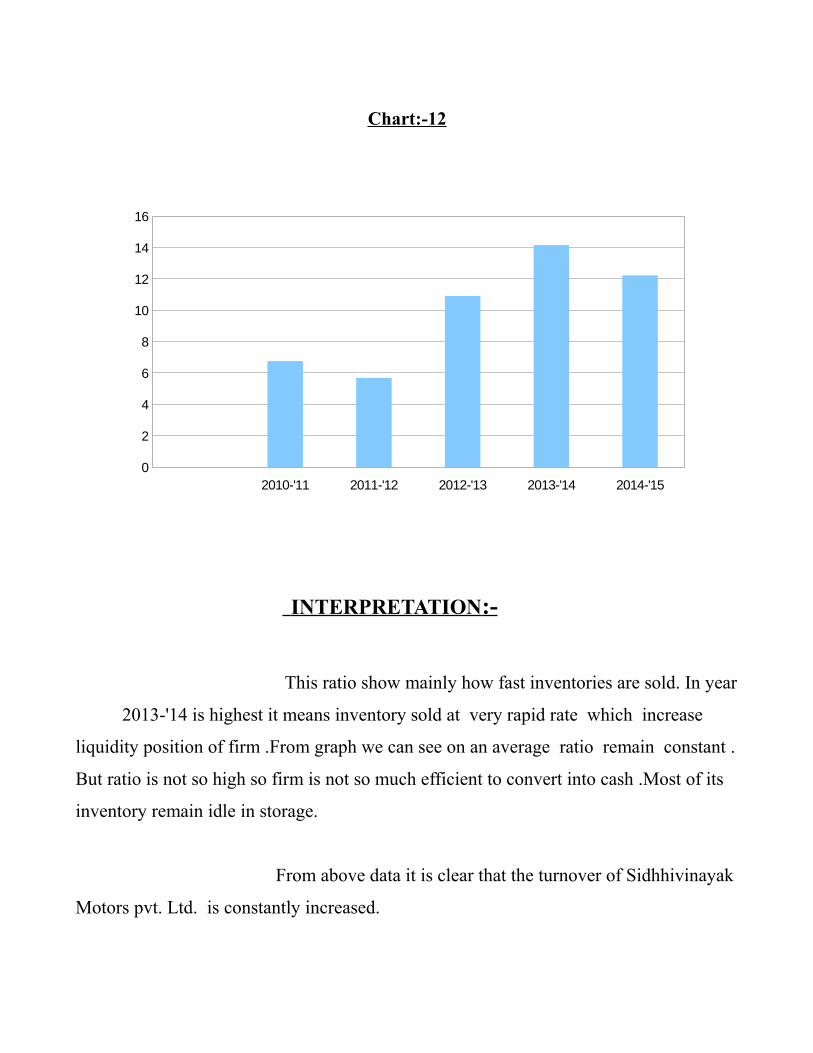
Chart:-12
INTERPRETATION :-
This ratio show mainly how fast inventories are sold. In year
2013-'14 is highest it means inventory sold at very rapid rate which increase
liquidity position of firm .From graph we can see on an average ratio remain constant .
But ratio is not so high so firm is not so much efficient to convert into cash .Most of its
inventory remain idle in storage.
From above data it is clear that the turnover of Sidhhivinayak
Motors pvt. Ltd. is constantly increased.
2010-'11 2011-'12 2012-'13 2013-'14 2014-'150
2
4
6
8
10
12
14
16
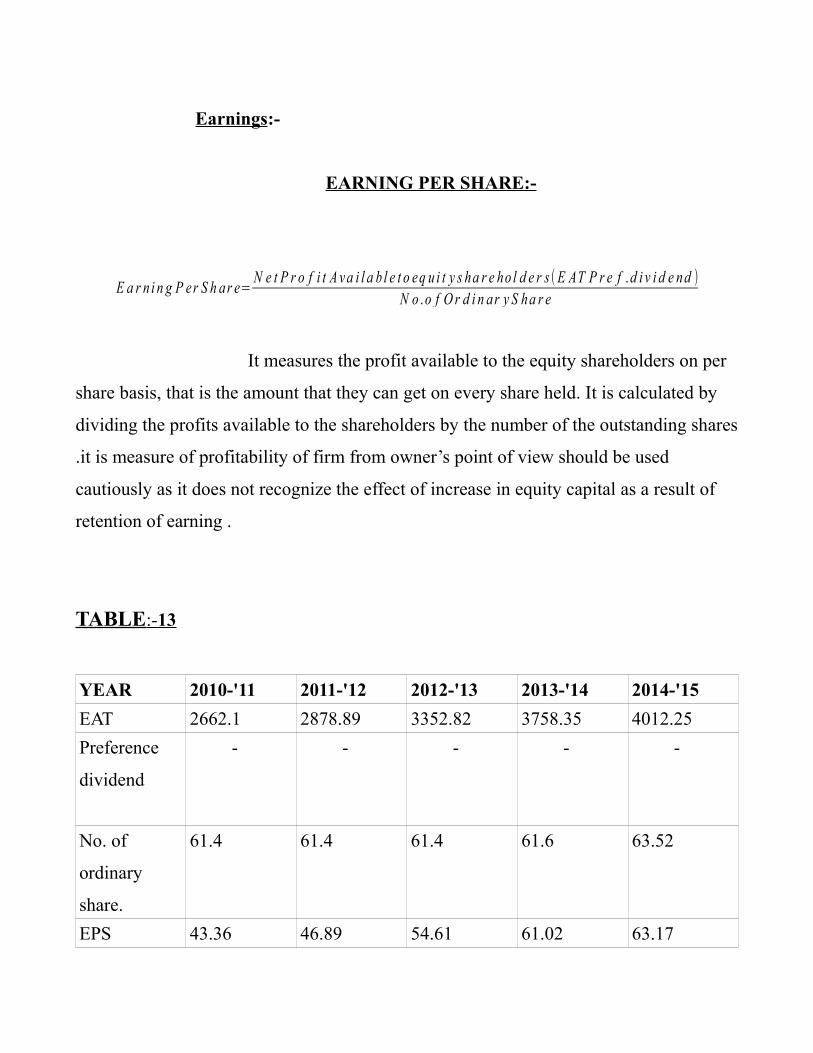
Earnings:-
EARNING PER SHARE:-
E a r n i n g P er S h ar e=N e t P r o f i t A va i l a b l e t o eq u i t y s ha r e ho l d e r s (E AT P r e f .d i v i d e nd )
N o .o f O r d i n ar y S ha r e
It measures the profit available to the equity shareholders on per
share basis, that is the amount that they can get on every share held. It is calculated by
dividing the profits available to the shareholders by the number of the outstanding shares
.it is measure of profitability of firm from owner’s point of view should be used
cautiously as it does not recognize the effect of increase in equity capital as a result of
retention of earning .
TABLE :- 13
YEAR 2010-'11 2011-'12 2012-'13 2013-'14 2014-'15
EAT 2662.1 2878.89 3352.82 3758.35 4012.25
Preference
dividend
- - - - -
No. of
ordinary
share.
61.4 61.4 61.4 61.6 63.52
EPS 43.36 46.89 54.61 61.02 63.17
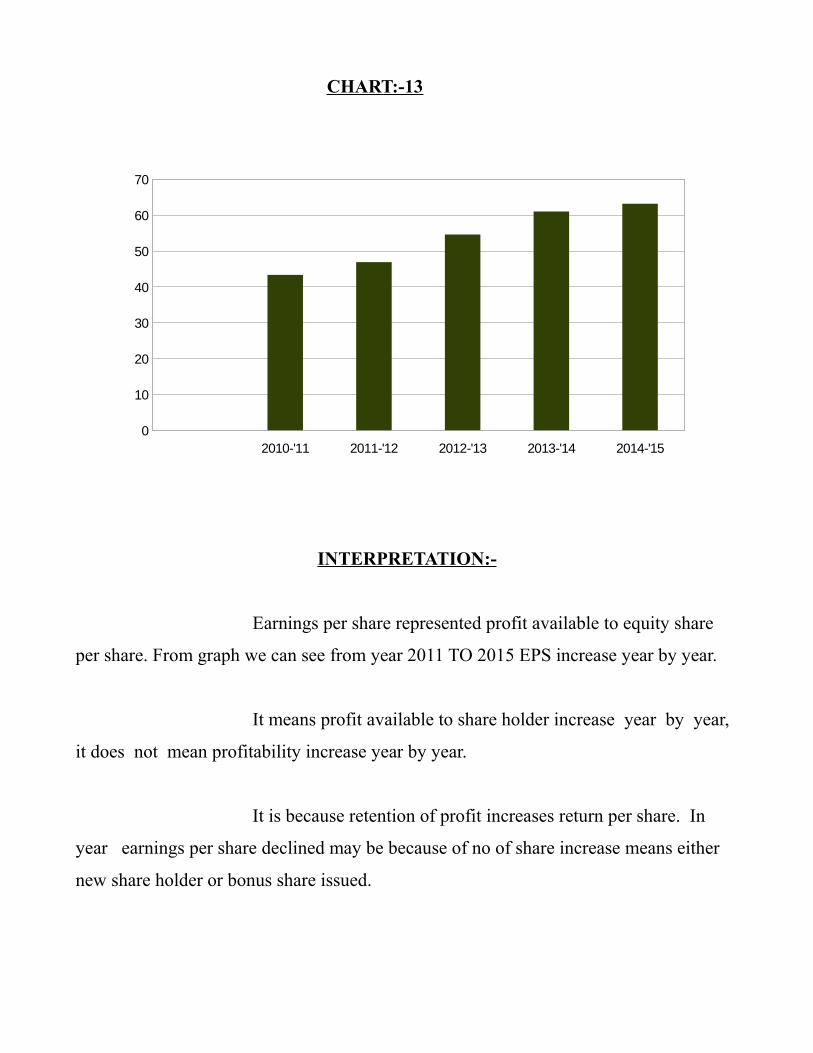
CHART:-13
INTERPRETATION:-
Earnings per share represented profit available to equity share
per share. From graph we can see from year 2011 TO 2015 EPS increase year by year.
It means profit available to share holder increase year by year,
it does not mean profitability increase year by year.
It is because retention of profit increases return per share. In
year earnings per share declined may be because of no of share increase means either
new share holder or bonus share issued.
2010-'11 2011-'12 2012-'13 2013-'14 2014-'150
10
20
30
40
50
60
70
CONCLUSION
Viewing MAHINDRA INTERNATIONAL from every angle, it can
be conclude that the entire unit is progressing well because kinetic has
provided excellent quality of product due to sophisticated technology and
highly qualified technical & management staff. By this way, they can able
to create a good demand for their product and satisfy the consumer.
In the report presented, an attempt has been made to focus on the
ratio analysis through SHIDDHIVINAYAK MOTORS OF MAHINDRA
INTERNATIONAL at Rajkot. It was an excellent opportunity and I am
glad that I was provided an opportunity to make an internship report on
such a famous company.
It can be said that credit of success of the company goes to the
management as well as workers and employee that MAHINDRA INTER-
NATIONAL has bring bright future.
In Short, Its grip on every aspect of the business is right which helps it in
fight every uncertainty. It is continues to do well, sure its future will be full
of success. Again, I am thanking to all who directly or indirectly helped
me.
SUGGESTIONS:-
After analyzing the ratio and watching the whole condition
of the business. I would like to give suggestions as bellow.
The operating expenses are very high .such as a raw material
research &extension, packaging, power & fuel etc. In this expense raw material
consumption is the most and company can never controlled. Such expenses, because
SIDDHIVINAYAK MOTORS PVT. LTD. Is expanding its network year by year. So
plant machinery consumption, operation expenses and other expenses will be increase in
future.
So the firm should more focus to increase in sales, because
selling is being increased more and more company can achieve such an expenses. So
increasing the selling of the products is necessary.
In the globalization world when cutthroat competition is
prevailing in all developed or developing country so to survive in the market, high
qualified persons are more necessary for every firm. Due to, lack of salary and other
Facilities qualified person cannot stay in the particular firm. So, for SIDDHIVINAYAK
MOTORS PVT. LTD manufacturing ltd. should take necessary steps for this. Firm
should increase extra facility or high salary.
In the marketing field, to increase the market of new
products, Firm should use more and more distribution channels like
SIDDHIVINAYAK MOTORS PVT. LTD retailer, and direct selling and media like
more advertisement in television, news-paper posters, board and many more.
BIBLIOGRAPHY
Reference Book:
Financial Management.
- By Khan & Jain.
Websites:
www.Mahindra.com
www.Mahindragroup.com
www.Mahindra & Mahindra ltd.com
www.Mahindraworld.com