single-phase ac power circuits - lab-volt · 2017. 11. 28. · electricity and new energy...
TRANSCRIPT

Electricity and New Energy
Single-Phase AC Power Circuits
Student Manual 86358-00

Order no.: 86358-00 Revision level: 01/2015
By the staff of Festo Didactic
© Festo Didactic Ltée/Ltd, Quebec, Canada 2010 Internet: www.festo-didactic.com e-mail: [email protected]
Printed in Canada All rights reserved ISBN 978-2-89640-399-8 (Printed version) ISBN 978-2-89640-710-1 (CD-ROM) Legal Deposit – Bibliothèque et Archives nationales du Québec, 2010 Legal Deposit – Library and Archives Canada, 2010
The purchaser shall receive a single right of use which is non-exclusive, non-time-limited and limited geographically to use at the purchaser's site/location as follows.
The purchaser shall be entitled to use the work to train his/her staff at the purchaser's site/location and shall also be entitled to use parts of the copyright material as the basis for the production of his/her own training documentation for the training of his/her staff at the purchaser's site/location with acknowledgement of source and to make copies for this purpose. In the case of schools/technical colleges, training centers, and universities, the right of use shall also include use by school and college students and trainees at the purchaser's site/location for teaching purposes.
The right of use shall in all cases exclude the right to publish the copyright material or to make this available for use on intranet, Internet and LMS platforms and databases such as Moodle, which allow access by a wide variety of users, including those outside of the purchaser's site/location.
Entitlement to other rights relating to reproductions, copies, adaptations, translations, microfilming and transfer to and storage and processing in electronic systems, no matter whether in whole or in part, shall require the prior consent of Festo Didactic GmbH & Co. KG.
Information in this document is subject to change without notice and does not represent a commitment on the part of Festo Didactic. The Festo materials described in this document are furnished under a license agreement or a nondisclosure agreement.
Festo Didactic recognizes product names as trademarks or registered trademarks of their respective holders.
All other trademarks are the property of their respective owners. Other trademarks and trade names may be used in this document to refer to either the entity claiming the marks and names or their products. Festo Didactic disclaims any proprietary interest in trademarks and trade names other than its own.

© Festo Didactic 86358-00 III
Safety and Common Symbols
The following safety and common symbols may be used in this manual and on the equipment:
Symbol Description
DANGER indicates a hazard with a high level of risk which, if not avoided, will result in death or serious injury.
WARNING indicates a hazard with a medium level of risk which, if not avoided, could result in death or serious injury.
CAUTION indicates a hazard with a low level of risk which, if not avoided, could result in minor or moderate injury.
CAUTION used without the Caution, risk of danger sign , indicates a hazard with a potentially hazardous situation which, if not avoided, may result in property damage.
Caution, risk of electric shock
Caution, hot surface
Caution, risk of danger
Caution, lifting hazard
Caution, hand entanglement hazard
Notice, non-ionizing radiation
Direct current
Alternating current
Both direct and alternating current
Three-phase alternating current
Earth (ground) terminal

Safety and Common Symbols
IV © Festo Didactic 86358-00
Symbol Description
Protective conductor terminal
Frame or chassis terminal
Equipotentiality
On (supply)
Off (supply)
Equipment protected throughout by double insulation or reinforced insulation
In position of a bi-stable push control
Out position of a bi-stable push control

© Festo Didactic 86358-00 V
Table of Contents
Preface .................................................................................................................. IX
About This Manual ................................................................................................ XI
Unit 1 Alternating Current ........................................................................ 1
DISCUSSION OF FUNDAMENTALS ......................................................... 1DC circuits versus ac circuits .................................................... 1Alternating current (ac) and ac voltage ..................................... 2Alternating current and ac voltage supplied by public power distribution utilities .......................................................... 2Safety rules ................................................................................ 3
Ex. 1-1 The Sine Wave ................................................................................ 5
DISCUSSION ....................................................................................... 5Relationship between a rotating phasor and a sine wave ......... 5Period and frequency of a sinusoidal voltage or current ........... 8Amplitude and instantaneous value of a sinusoidal voltage or current ................................................................................... 8Effective or root-mean-square (rms) value and heating capacity ................................................................................... 10Effective (rms) value of a sinusoidal voltage or current .......... 10
PROCEDURE .................................................................................... 11Setup and connections ............................................................ 11Measuring voltage, current, and frequency in an ac circuit ..... 14Relationship between frequency and period ........................... 16Measuring voltage, current, and frequency in a series ac circuit ....................................................................................... 17
Ex. 1-2 Phase Angle and Phase Shift ..................................................... 21
DISCUSSION ..................................................................................... 21Phase angle ............................................................................. 21Phase shift ............................................................................... 23
PROCEDURE .................................................................................... 25Setup and connections ............................................................ 25Measuring the phase shift between two voltage sine waves in a resistor-inductor (RL) circuit .................................. 27Measuring the phase shift between two voltage sine waves in a resistor-capacitor (RC) circuit ................................ 29
Ex. 1-3 Instantaneous Power and Average Power ................................ 35
DISCUSSION ..................................................................................... 35Instantaneous power ............................................................... 35Average power ........................................................................ 36Rationale behind rms values ................................................... 37

Table of Contents
VI © Festo Didactic 86358-00
PROCEDURE .................................................................................... 38Setup and connections ............................................................ 38Average power measurements ............................................... 39Rationale behind rms values ................................................... 41
Unit 2 Resistance, Reactance, and Impedance .................................... 47
DISCUSSION OF FUNDAMENTALS ....................................................... 47Introduction to inductors and capacitors.................................. 47Distinction between resistance, reactance, and impedance ... 49
Ex. 2-1 Inductive Reactance .................................................................... 51
DISCUSSION ..................................................................................... 51Inductors and inductive reactance ........................................... 51Inductive phase shift ................................................................ 52
PROCEDURE .................................................................................... 52Setup and connections ............................................................ 52Inductance and inductive reactance ........................................ 54Effect of frequency on the inductive reactance ....................... 56Measuring the inductive phase shift ........................................ 57
Ex. 2-2 Capacitive reactance ................................................................... 61
DISCUSSION ..................................................................................... 61Capacitors and capacitive reactance ...................................... 61Capacitive phase shift ............................................................. 62
PROCEDURE .................................................................................... 62Setup and connections ............................................................ 62Capacitance and capacitive reactance.................................... 64Effect of the frequency on the capacitive reactance ............... 66Measuring the capacitive phase shift ...................................... 67
Ex. 2-3 Impedance .................................................................................... 71
DISCUSSION ..................................................................................... 71Phasor diagrams related to resistors, inductors, and capacitors ................................................................................ 71
Phasor diagram related to a resistor .......................................... 71Phasor diagram related to an inductor ....................................... 72Phasor diagram related to a capacitor ........................................ 73
Equivalent reactance of series-connected reactive components ............................................................................. 73Impedance of resistors, inductors, and capacitors connected in series .................................................................. 75Impedance of resistors, inductors, and capacitors connected in parallel ................................................................ 77

Table of Contents
© Festo Didactic 86358-00 VII
PROCEDURE .................................................................................... 78Setup and connections ............................................................ 79Equivalent reactance of a series LC circuit ............................. 81Impedance of a series RL circuit ............................................. 83Impedance of a series RC circuit ............................................ 85Impedance of a series RLC circuit .......................................... 86Impedance of a parallel RL circuit ........................................... 87Impedance of a parallel RC circuit .......................................... 89
Unit 3 Power in AC Circuits ................................................................... 95
DISCUSSION OF FUNDAMENTALS ....................................................... 95Introduction to active, reactive, and apparent power .............. 95
Ex. 3-1 Active and Reactive Power ......................................................... 97
DISCUSSION ..................................................................................... 97Active power in a resistor ........................................................ 97Reactive power in an inductor ................................................. 98Reactive power in a capacitor ................................................. 99Power Meter .......................................................................... 100
PROCEDURE .................................................................................. 101Setup and connections .......................................................... 101Active power in a resistor ...................................................... 103Reactive power in an inductor ............................................... 105Reactive power in a capacitor ............................................... 107
Ex. 3-2 Apparent Power and the Power Triangle ................................. 111
DISCUSSION ................................................................................... 111Phasor diagrams related to active and reactive power ......... 111
Phasor diagram related to the active power in a resistor ......... 111Phasor diagram related to the reactive power in an inductor ... 112Phasor diagram related to the reactive power in a capacitor ... 113
Apparent power ..................................................................... 114Power triangle ........................................................................ 115Power factor .......................................................................... 115
PROCEDURE .................................................................................. 116Setup and connections .......................................................... 116Total reactive power in a circuit ............................................. 118Apparent power, power factor, and power triangle ............... 120
Unit 4 AC Circuits Analysis .................................................................. 129
DISCUSSION OF FUNDAMENTALS ..................................................... 129Introduction to circuit analysis ............................................... 129Circuit analysis methods ....................................................... 129
Table of Contents
VIII © Festo Didactic 86358-00
Ex. 4-1 Solving Simple AC Circuits Using Circuit Impedance Calculation .................................................................................. 131
DISCUSSION ................................................................................... 131Solving simple parallel circuits .............................................. 131
Example ................................................................................... 132Solving simple series circuits ................................................ 133
Example ................................................................................... 134
PROCEDURE .................................................................................. 135Setup and connections .......................................................... 135Solving a simple parallel ac circuit ........................................ 136Solving a simple series ac circuit .......................................... 138
Ex. 4-2 Solving AC Circuits Using the Power Triangle Method ......... 143
DISCUSSION ................................................................................... 143Solving ac circuits using the power triangle method ............. 143
Example ................................................................................... 145
PROCEDURE .................................................................................. 147Setup and connections .......................................................... 147Solving an ac circuit using the power triangle method .......... 149
Appendix A Equipment Utilization Chart ...................................................... 157
Appendix B Glossary of New Terms ............................................................. 159
Appendix C Impedance Table for the Load Modules .................................. 163
Appendix D Vectorial Calculations ............................................................... 165Vectorial division .................................................................... 166Vectorial multiplication ........................................................... 167
Appendix E Circuit Diagram Symbols .......................................................... 169
Index of New Terms ........................................................................................... 175
Bibliography ....................................................................................................... 177

© Festo Didactic 86358-00 IX
Preface
The production of energy using renewable natural resources such as wind, sunlight, rain, tides, geothermal heat, etc., has gained much importance in recent years as it is an effective means of reducing greenhouse gas (GHG) emissions. The need for innovative technologies to make the grid smarter has recently emerged as a major trend, as the increase in electrical power demand observed worldwide makes it harder for the actual grid in many countries to keep up with demand. Furthermore, electric vehicles (from bicycles to cars) are developed and marketed with more and more success in many countries all over the world.
To answer the increasingly diversified needs for training in the wide field of electrical energy, the Electric Power Technology Training Program was developed as a modular study program for technical institutes, colleges, and universities. The program is shown below as a flow chart, with each box in the flow chart representing a course.
The Electric Power Technology Training Program.

Preface
X © Festo Didactic 86358-00
The program starts with a variety of courses providing in-depth coverage of basic topics related to the field of electrical energy such as ac and dc power circuits, power transformers, rotating machines, ac power transmission lines, and power electronics. The program then builds on the knowledge gained by the student through these basic courses to provide training in more advanced subjects such as home energy production from renewable resources (wind and sunlight), large-scale electricity production from hydropower, large-scale electricity production from wind power (doubly-fed induction generator [DFIG], synchronous generator, and asynchronous generator technologies), smart-grid technologies (SVC, STATCOM, HVDC transmission, etc.), storage of electrical energy in batteries, and drive systems for small electric vehicles and cars.
Do you have suggestions or criticism regarding this manual?
If so, send us an e-mail at [email protected].
The authors and Festo Didactic look forward to your comments.

© Festo Didactic 86358-00 XI
About This Manual
Alternating-current (ac) power systems began to develop quickly in the late 19th
century, following key developments in the field of electricity, mainly the invention of the polyphase system of electrical distribution by scientist Nikola Tesla, and the development of mathematical analysis of electricity by Charles Steinmetz, James Clerk Maxwell, and William Thomson (Lord Kelvin).
The main advantage of ac power systems is that high amounts of power can be transmitted efficiently over long transmission lines. Step-up transformers are used at the ac power generating point to increase the voltage and decrease the current. The power lost as heat in the resistance of a transmission line increases by the square of the current. Therefore, ac power is transmitted at very high voltages and low currents to reduce power losses in the line resistance to a minimum. At the receiving end of the line, step-down transformers reduce the voltage and increase the current to levels compatible with residential or industrial equipment.
Today ac power systems are used throughout the world for driving motors and powering electric equipment in transport, heating, lighting, communications, and computation.
This course, Single-Phase AC Power Circuit, introduces students to the fundamentals of alternating current, such as the sine wave, period and frequency, phase angle and phase shift, instantaneous and average power, etc. Students then become familiar with the inductor and capacitor. The course continues with more advanced topics such as the impedance, active power, reactive power, apparent power, and power triangle. The course concludes by teaching students how to solve ac power circuits using the impedance calculation method or the power triangle method.
Most lighting in urban centers is powered using single-phase alternative current.

About This Manual
XII © Festo Didactic 86358-00
Safety considerations
Safety symbols that may be used in this manual and on the equipment are listed in the Safety Symbols table at the beginning of the manual.
Safety procedures related to the tasks that you will be asked to perform are indicated in each exercise.
Make sure that you are wearing appropriate protective equipment when performing the tasks. You should never perform a task if you have any reason to think that a manipulation could be dangerous for you or your teammates.
Prerequisite
As a prerequisite to this course, you should have read the manual titled Trainer DC Power Circuits, p.n. 86350.
Systems of units
Units are expressed using the International System of Units (SI) followed by the units expressed in the U.S. customary system of units (between parentheses).

© Festo Didactic 86358-00 1
When you have completed this unit, you will be familiar with alternating current (ac). You will be able to define, calculate, and measure the various parameters of voltage and current sine waves: amplitude, effective or root-mean-square (rms) value, instantaneous value, period, and frequency. You will know how to measure the average power dissipated in a resistive load connected to an ac power source.
The Discussion of Fundamentals covers the following points:
DC circuits versus ac circuits Alternating current (ac) and ac voltage Alternating current and ac voltage supplied by public power distribution
utilities Safety rules
DC circuits versus ac circuits
In a direct-current (dc) circuit, the current flows only in one direction: from the positive (+) terminal of the dc source to the negative (–) terminal (conventional current direction). This is shown in Figure 1-1a.
In an alternating-current (ac) circuit, the current continuously switches direction because the voltage at the ac source terminals continuously changes polarity with time, alternating between positive and negative. This is shown in Figure 1-1b.
Figure 1-1. DC circuit versus ac circuit.
Alternating Current
Unit 1
UNIT OBJECTIVE
DISCUSSION OUTLINE
DISCUSSION OF FUNDAMENTALS
DC source AC source
(a) DC circuit (b) AC circuit

Unit 1 – Alternating Current Discussion of Fundamentals
2 © Festo Didactic 86358-00
Alternating current (ac) and ac voltage
Alternating current (ac) changes direction many times each second. Similarly, alternating-current voltage changes polarity many times each second. Figure 1-2 shows three different ac waveforms: a sine wave, a rectangular wave, and a triangular wave.
Figure 1-2. Alternating-current (ac) waveforms.
Alternating current and ac voltage supplied by public power distribution utilities
Alternating current is the type of current supplied by public power utilities to houses and factories. Alternating current is produced by rotating machines such as alternators and ac generators. The alternating current and ac voltage produced by alternators and ac generators are both sinusoidal. Figure 1-3 shows a sinusoidal voltage or current graphed over time. The figure illustrates the following characteristics:
The voltage or current periodically changes from one polarity to the other.
The value of the voltage or current continuously changes with time. This value passes from a positive maximum to a negative maximum, then to another positive maximum, and so on. The value of the voltage or current changes rapidly near zero values and slowly at the positive and negative maxima.
The portion of the wave during which the voltage or current is of positive (+) polarity is called the positive half-wave. The portion of the wave during which the voltage or current is of negative (–) polarity is called the negative half-wave.
The duration of a positive half-wave, plus the duration of the subsequent negative half-wave form a complete cycle of the waveform.
Sinusoidal Rectangular Triangular
Time (s) Time (s) Time (s)
+
–
+
– –
+
0 0 0

Unit 1 – Alternating Current Discussion of Fundamentals
© Festo Didactic 86358-00 3
Figure 1-3. Typical sine wave of voltage or current graphed over time.
The number of times that a cycle repeats every second is called the frequency . The frequency is expressed in hertz (Hz). In North America, the frequency of the current supplied by public power distribution utilities is 60 Hz. In Europe, Asia, Africa, Russia, the Middle-East, and Australia, this frequency is usually 50 Hz. In South America and Japan, this frequency can be either 50 Hz or 60 Hz.
As mentioned earlier, ac waves can have shapes other than sinusoidal, for instance rectangular or triangular. However, theory and practice have shown that sine waves are best suited for powering electrical machinery. Sine waves provide the highest efficiency from transformers, motors, and generators, and also result in a quieter operation. Sine waves also simplify voltage and current calculations in electrical circuits. For example, the value of a sinusoidal current or voltage at any instant of the cycle can be calculated by using the sine mathematical function.
Safety rules
Observe the following safety rules when using electrical equipment:
1. Always make sure that the ac power source is disabled when connecting or disconnecting leads or components.
2. Never leave any electrical lead unconnected. Touching the unconnected end of a lead while the ac power source is enabled could give you an electric shock. A short circuit could also occur if the unconnected end of a lead touches a conducting surface.
3. When connecting an electrical circuit, make sure that the contact terminals are free of dirt, oil, and water. Dirt and oil are insulators and impair the connection between two components. Water is a conductor and might make a connection where it is not wanted.
+
–
0
Maximum (positive)
Maximum (negative) One complete cycle
Positive half-wave
Negative half-wave
Time (s)
Vol
tage
() o
r cur
rent
()


© Festo Didactic 86358-00 5
When you have completed this exercise, you will be familiar with the notion of a sine wave and how it can be expressed as a phasor rotating around the center of a circle. You will also be familiar with the different parameters of a sine wave, such as its period, frequency, amplitude, and instantaneous values. You will see how to express current and voltage in ac power circuits as sine waves. You will be introduced to the concept of rms (effective) values and know how to calculate the rms value from the amplitude of a voltage or current sine wave.
a The hands-on exercises in this manual require you to be familiar with the computer-based instruments. Refer to the user guides titled “Data Acquisition and Control System” (86716-E0) and “Computer-Based Instruments for EMS” (86718-E0) to become familiar with the operation and use of the computer-based instruments.
The Discussion of this exercise covers the following points:
Relationship between a rotating phasor and a sine wave Period and frequency of a sinusoidal voltage or current Amplitude and instantaneous value of a sinusoidal voltage or current Effective or root-mean-square (rms) value and heating capacity Effective (rms) value of a sinusoidal voltage or current
Relationship between a rotating phasor and a sine wave
A direct relationship exists between circular motion and a sine wave. Thus, a sinusoidal voltage or current can be graphed using the vertical-axis deflection as a function of the angular position of a rotating phasor. A phasor is a vector having its origin at the center (0, 0) of a cartesian plane. Each cycle of a sinusoidal signal corresponds to one complete revolution (one turn) of the phasor around the circle, which is equal to 360° or 2 radians. Figure 1-4 shows a sine wave graphed using the vertical-axis deflection as a function of the angular position of a rotating phasor.
The Sine Wave
Exercise 1-1
EXERCISE OBJECTIVE
DISCUSSION OUTLINE
DISCUSSION

Ex. 1-1 – The Sine Wave Discussion
6 © Festo Didactic 86358-00
Figure 1-4. Sine wave graphed using the vertical-axis deflection as a function of the angular position of a rotating phasor.
Figure 1-5 shows an example in which a phasor is rotating counterclockwise around the center of a circle at a constant velocity. As the phasor is rotating, the vertical distance between the tip of the phasor and the horizontal axis of the circle continuously varies. A graphical projection of the distance value , on the XY-plane as a function of the angular position gives a sine wave. The following can be observed in Figure 1-5:
Initially, the phasor is at 0° (horizontal position), so the vertical distance between the phasor and the horizontal axis is null.
As the phasor is rotating from 0° to 90°, the vertical distance between the tip of the phasor and the horizontal axis gradually increases from zero to a maximum positive (peak) value.
As the phasor is rotating from 90° to 180°, the vertical distance between the tip of the phasor and the horizontal axis gradually decreases from the maximum positive value to zero.
As the phasor is rotating from 180° to 270°, the vertical distance between the tip of the phasor and the horizontal axis increases from zero to a maximum negative (peak) value.
As the phasor is rotating from 270° to 360°, the vertical distance between the tip of the phasor and the horizontal axis decreases from the maximum negative value to zero.
One complete revolution of the phasor (i.e., 360°) corresponds to one complete cycle of the sine wave.
One complete cycle (2 radians or 360°)
Vol
tage
V
or c
urre
nt
(A)
+
–
0Angular position (°)
rad (180°) 2 rad (360°) 0°
(90°)
(270°)
45 90 135 180 225 270 315 360
225°

Ex. 1-1 – The Sine Wave Discussion
© Festo Didactic 86358-00 7
Figure 1-5. Relationship between a rotating phasor and a sine wave.
Period

Ex. 1-1 – The Sine Wave Discussion
8 © Festo Didactic 86358-00
Period and frequency of a sinusoidal voltage or current
The time required for one complete cycle of a sine wave to occur is called the period . The number of cycles that occur in one second is called the frequency of the sine wave. Frequency is measured in hertz (Hz), 1 Hz being equal to 1 cycle per second.
The equation used for calculating the frequency is:
(1-1)
where is the frequency of the sine wave, expressed in hertz (Hz) or cycles per second (c/s).
is the period of the sine wave, expressed in seconds (s).
The period is the reciprocal of the frequency:
(1-2)
In a 60 Hz ac power system, the cycle of the sinusoidal voltage and current repeats itself 60 times per second. Therefore, the period of one cycle is 1/60 s 16.7 ms.
In a 50 Hz ac power system, the cycle of the sinusoidal voltage and current repeats itself 50 times per second. Therefore, the period of one cycle is 1/50 s 20 ms.
Amplitude and instantaneous value of a sinusoidal voltage or current
The equation of a sine wave is:
(1-3)
where is the instantaneous value of the sine wave at a given instant . is the amplitude of the sine wave. is the angular position of the sine wave at a given instant ,
expressed in degrees (°). is the angular velocity, expressed in radians per second (rad/s) of
the rotating phasor. . is the time, expressed in seconds (s).
The amplitude is the maximum value reached by the sine wave during its cycle. The maximum value is the same for both the positive and negative half-waves of the cycle, except for the polarity which changes from positive (+) to negative (–).

Ex. 1-1 – The Sine Wave Discussion
© Festo Didactic 86358-00 9
The general equation of a sine wave can be used to describe a sinusoidal voltage mathematically:
(1-4)
where is the instantaneous value of the voltage at a given instant
of the cycle, expressed in volts (V). is the amplitude of the sinusoidal voltage, expressed in
volts (V).
For example, if the amplitude (maximum voltage) of the voltage is 100 V, the instantaneous value of the voltage at angular position is:
Figure 1-6 shows the voltage sine wave graph resulting from Equation (1-4).
Figure 1-6. Voltage sine wave.
Similarly, the general equation of a sine wave can be used to describe a sinusoidal current mathematically:
(1-5)
where is the instantaneous value of the current at a given instant of
the cycle, expressed in amperes (A). is the amplitude of the sinusoidal current, expressed in
amperes (A).
Angular position ( )
+
–
Vol
tage
(V
)
045 90 135 180 225
270
315
360

Ex. 1-1 – The Sine Wave Discussion
10 © Festo Didactic 86358-00
Effective or root-mean-square (rms) value and heating capacity
The effective (rms) value of an ac voltage is related to the heat produced by a resistive element when supplied with this voltage. For example, consider an ac voltage having an amplitude applied across a load resistor. The applied voltage causes current to flow through the resistor, which has the effect of increasing the resistor’s temperature until it stabilizes to a certain level (equilibrium temperature). The rms or effective value of this ac voltage can be found by applying a dc voltage across the load resistor, and adjusting the dc voltage until the resistor stabilizes to the equilibrium temperature previously reached with the ac voltage. The value of this dc voltage corresponds to the rms or effective value of the ac voltage.
Effective (rms) value of a sinusoidal voltage or current
The effective (rms) value of a sinusoidal voltage is calculated as follows:
(1-6)
Similarly, the effective (rms) value of a sinusoidal current is calculated as follows:
(1-7)
For example, the effective (rms) value of a sinusoidal voltage having an amplitude of 100 V is 70.7 V (0.707·100 V). This means that a sine-wave voltage having an amplitude of 100 V has the same heating capacity as a dc voltage of 70.7 V.
Figure 1-7 shows the rms value of a voltage sine wave in comparison to its amplitude value.

Ex. 1-1 – The Sine Wave Procedure Outline
© Festo Didactic 86358-00 11
Figure 1-7. Effective, or root-mean-square (rms), value of a sinusoidal voltage.
Standard instruments used to measure ac voltage and current normally indicate the effective (rms) value directly on their display. The rms values of voltage and current are used to calculate electrical power in ac power circuits. The reasoning behind rms values will be explained in more detail in Exercise 1-3.
The Procedure is divided into the following sections:
Setup and connections Measuring voltage, current, and frequency in an ac circuit Relationship between frequency and period Measuring voltage, current, and frequency in a series ac circuit
High voltages are present in this laboratory exercise. Do not make or modify anybanana jack connections with the power on unless otherwise specified.
Setup and connections
In this section, you will connect an ac circuit containing a resistor and set up the equipment to measure the circuit current and voltage using the LVDAC-EMS software. You will also determine the relationship between the frequency of a sine wave and its period .
1. Refer to the Equipment Utilization Chart in Appendix A to obtain the list of equipment required to perform this exercise.
Install the required equipment in the Workstation.
PROCEDURE OUTLINE
PROCEDURE
Time (s)
Vol
tage
(V
)
+
–

Ex. 1-1 – The Sine Wave Procedure
12 © Festo Didactic 86358-00
2. Make sure that the main power switch on the Four-Quadrant Dynamometer/ Power Supply is set to the O (off) position, then connect its Power Input to an ac power outlet.
Connect the Power Input of the Data Acquisition and Control Interface to a 24 V ac power supply. Turn the 24 V ac power supply on.
3. Connect the USB port of the Data Acquisition and Control Interface to a USB port of the host computer.
Connect the USB port of the Four-Quadrant Dynamometer/Power Supply to a USB port of the host computer.
4. Turn the Four-Quadrant Dynamometer/Power Supply on, then set the Operating Mode switch to Power Supply. This setting allows the Four-Quadrant Dynamometer/Power Supply to operate as a power supply.
5. Turn the host computer on, then start the LVDAC-EMS software.
In the LVDAC-EMS Start-Up window, make sure that the Data Acquisition and Control Interface and the Four-Quadrant Dynamometer/Power Supply are detected. Make sure that the Computer-Based Instrumentation function for the Data Acquisition and Control Interface is available. Select the network voltage and frequency that correspond to the voltage and frequency of your local ac power network, then click the OK button to close the LVDAC-EMS Start-Up window.
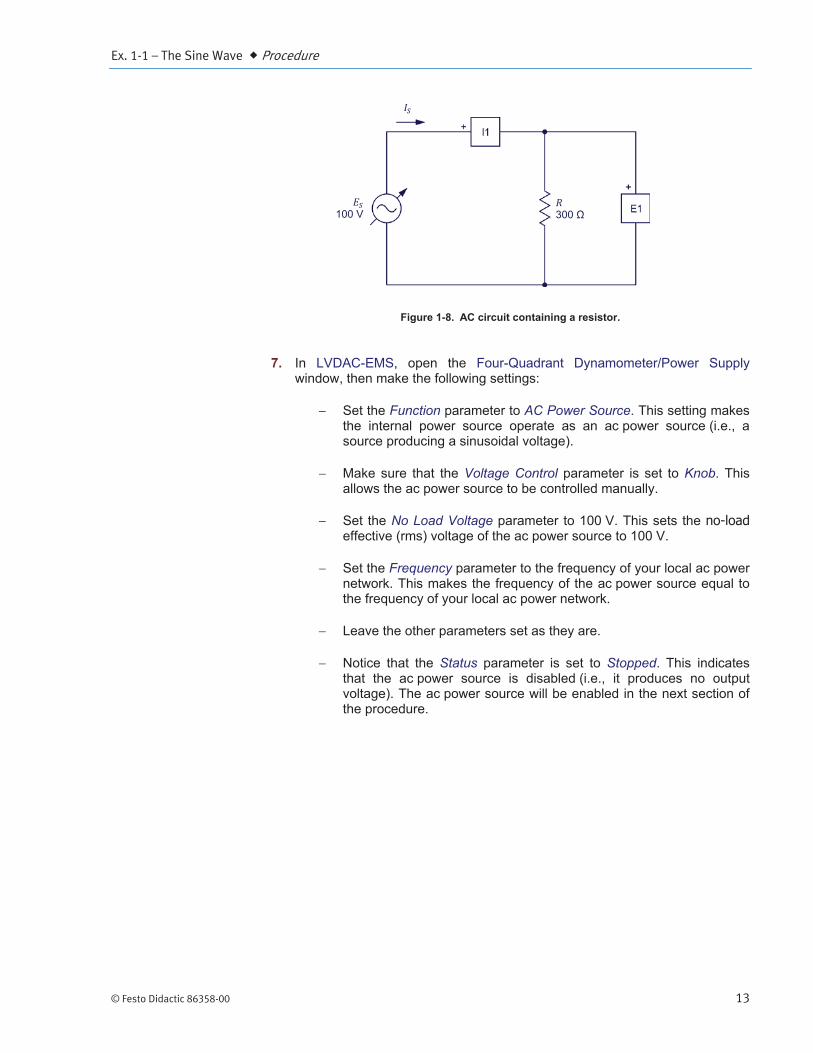
6. Set up the circuit shown in Figure 1-8. Note the symbol used to indicate a variable-voltage ac source in this circuit. In order to obtain the resistance value indicated next to the resistor in Figure 1-8, make the necessary switch settings on the Resistive Load.
a Throughout this manual, keep in mind that the resistance values shown in the figures are equivalent resistances. To obtain a given resistance value with the Resistive Load, you may need to connect two or more resistors of a resistor section in parallel as well as to interconnect resistor sections in parallel. Appendix C lists the switch settings to implement on the Resistive Load in order to obtain various resistance values.
Use inputs I1 and E1 of the Data Acquisition and Control Interface to measure the source current , and the voltage across the resistor .
Ex. 1-1 – The Sine Wave Procedure
© Festo Didactic 86358-00 13
Figure 1-8. AC circuit containing a resistor.
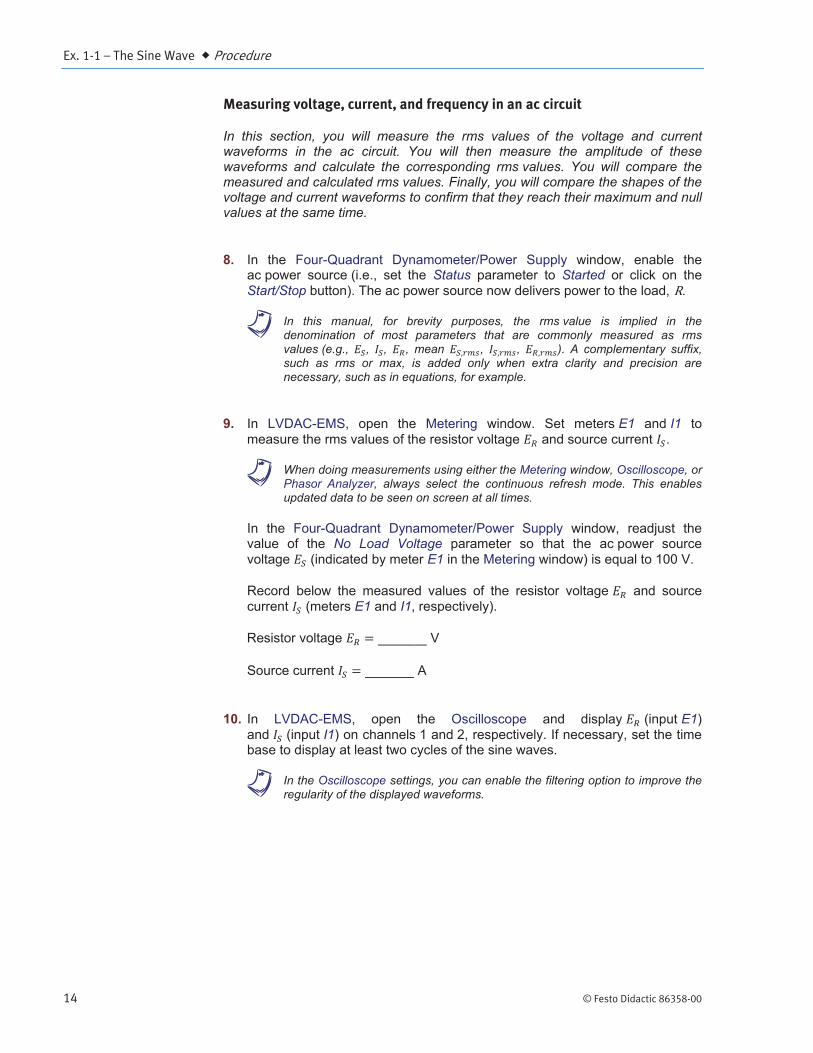
7. In LVDAC-EMS, open the Four-Quadrant Dynamometer/Power Supply window, then make the following settings:
Set the Function parameter to AC Power Source. This setting makes the internal power source operate as an ac power source (i.e., a source producing a sinusoidal voltage).
Make sure that the Voltage Control parameter is set to Knob. This allows the ac power source to be controlled manually.
Set the No Load Voltage parameter to 100 V. This sets the no-load effective (rms) voltage of the ac power source to 100 V.
Set the Frequency parameter to the frequency of your local ac power network. This makes the frequency of the ac power source equal to the frequency of your local ac power network.
Leave the other parameters set as they are.
Notice that the Status parameter is set to Stopped. This indicates that the ac power source is disabled (i.e., it produces no output voltage). The ac power source will be enabled in the next section of the procedure.
300
100 V
Ex. 1-1 – The Sine Wave Procedure
14 © Festo Didactic 86358-00
Measuring voltage, current, and frequency in an ac circuit
In this section, you will measure the rms values of the voltage and current waveforms in the ac circuit. You will then measure the amplitude of these waveforms and calculate the corresponding rms values. You will compare the measured and calculated rms values. Finally, you will compare the shapes of the voltage and current waveforms to confirm that they reach their maximum and null values at the same time.
8. In the Four-Quadrant Dynamometer/Power Supply window, enable the ac power source (i.e., set the Status parameter to Started or click on the Start/Stop button). The ac power source now delivers power to the load, .
a In this manual, for brevity purposes, the rms value is implied in the denomination of most parameters that are commonly measured as rms values (e.g., , , , mean , , ). A complementary suffix, such as rms or max, is added only when extra clarity and precision are necessary, such as in equations, for example.
9. In LVDAC-EMS, open the Metering window. Set meters E1 and I1 to measure the rms values of the resistor voltage and source current .
a When doing measurements using either the Metering window, Oscilloscope, or Phasor Analyzer, always select the continuous refresh mode. This enables updated data to be seen on screen at all times.
In the Four-Quadrant Dynamometer/Power Supply window, readjust the value of the No Load Voltage parameter so that the ac power source voltage (indicated by meter E1 in the Metering window) is equal to 100 V.
Record below the measured values of the resistor voltage and source current (meters E1 and I1, respectively).
Resistor voltage V
Source current A
10. In LVDAC-EMS, open the Oscilloscope and display (input E1) and (input I1) on channels 1 and 2, respectively. If necessary, set the time base to display at least two cycles of the sine waves.
a In the Oscilloscope settings, you can enable the filtering option to improve the regularity of the displayed waveforms.
Ex. 1-1 – The Sine Wave Procedure
© Festo Didactic 86358-00 15
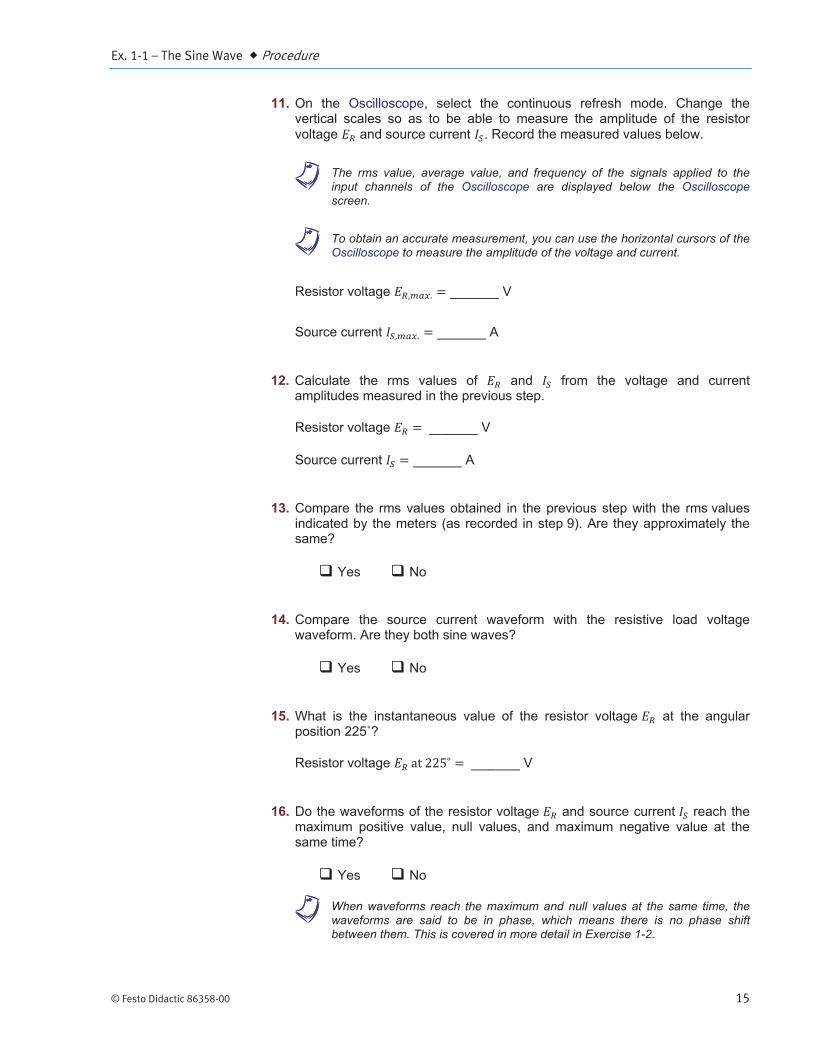
11. On the Oscilloscope, select the continuous refresh mode. Change the vertical scales so as to be able to measure the amplitude of the resistor voltage and source current . Record the measured values below.
a The rms value, average value, and frequency of the signals applied to the input channels of the Oscilloscope are displayed below the Oscilloscope screen.
a To obtain an accurate measurement, you can use the horizontal cursors of the Oscilloscope to measure the amplitude of the voltage and current.
Resistor voltage V
Source current A
12. Calculate the rms values of and from the voltage and current amplitudes measured in the previous step.
Resistor voltage V
Source current A
13. Compare the rms values obtained in the previous step with the rms values indicated by the meters (as recorded in step 9). Are they approximately the same?
Yes No
14. Compare the source current waveform with the resistive load voltage waveform. Are they both sine waves?
Yes No
15. What is the instantaneous value of the resistor voltage at the angular position 225 ?
Resistor voltage V
16. Do the waveforms of the resistor voltage and source current reach the maximum positive value, null values, and maximum negative value at the same time?
Yes No
a When waveforms reach the maximum and null values at the same time, the waveforms are said to be in phase, which means there is no phase shift between them. This is covered in more detail in Exercise 1-2.

Ex. 1-1 – The Sine Wave Procedure
16 © Festo Didactic 86358-00
Relationship between frequency and period
In this section, you will determine the relationship between the frequency and the period of a sine wave. You will do so by setting the frequency of the ac power source to various values and measuring each time the period of the voltage waveform. You will then calculate the frequency from each measured period and compare it with the ac power source frequency.
17. In the Four-Quadrant Dynamometer/Power Supply window, set the Frequency parameter to 40 Hz. This changes the frequency of the ac power source to 40 Hz.
18. Using the Oscilloscope, measure the period of the waveform of the resistor voltage . Record the period value in the corresponding cell of Table 1-1 below.
a To obtain an accurate measurement, use the vertical cursors of the Oscilloscope to measure the time interval between two points on a waveform.
Table 1-1. Relationship between the frequency and period .
Source frequency (Hz)
Period (ms)
Calculated source frequency
(Hz)
40
50
60
70
19. Repeat steps 17 and 18 for each ac power source frequency indicated in Table 1-1. Record your results in the corresponding cells.
20. Based on the measured period values in Table 1-1, calculate the resulting frequencies. Record your calculated source frequency values in the corresponding row of Table 1-1.
21. Compare the ac power source frequency values to your calculated source frequency values. Are they the same?
Yes No
22. Does this confirm the relationship ( ) between the frequency and period?
Yes No

Ex. 1-1 – The Sine Wave Procedure
© Festo Didactic 86358-00 17
Measuring voltage, current, and frequency in a series ac circuit
In this section, you will calculate the voltage and current rms values in a circuit containing two resistors in series. You will confirm that Ohm’s law applies to ac power circuits by measuring the voltage and current rms values and comparing them with those you calculated. You will also confirm Kirchhoff’s law by verifying that . Finally, you will verify that both the current and voltage waveforms are in phase with each other.
23. In the Four-Quadrant Dynamometer/Power Supply window, disable the ac power source (i.e., set the Status parameter to Stopped or click on the Start/Stop button).
24. Set up the circuit shown in Figure 1-9. To obtain the resistor arrangement of Figure 1-9, make the necessary connections and switch settings on the Resistive Load (refer to Appendix C if necessary). Use inputs I1, E1, E2, and E3 of the Data Acquisition and Control Interface to measure the source current , voltage , voltage , and source voltage respectively.
Figure 1-9. AC circuit containing two resistors connected in series.
25. Calculate the equivalent resistance of the circuit resistors. Using Ohm’s law, you will then be able to calculate the rms source current .
Equivalent resistance
Source current A
26. Calculate the resistor voltages and across each resistor by using the source current value obtained in the previous step.
Resistor voltage = V
Resistor voltage = V
100 V
171
300

Ex. 1-1 – The Sine Wave Procedure
18 © Festo Didactic 86358-00
27. In the Four-Quadrant Dynamometer/Power Supply window, set the Frequency parameter back to the frequency of your local ac power network, then enable the ac power source.
In the Four-Quadrant Dynamometer/Power Supply window, readjust the value of the No Load Voltage parameter so that the ac power source voltage (indicated by meter E3 in the Metering window) is equal to 100 V.
28. In the Metering window, set meter E2 to measure the rms value of the resistor voltage . Record voltages and and the source current .
Resistor voltage V
Resistor voltage V
Source current A
29. Compare voltages and measured in the previous step with the voltages calculated in step 26. Are they approximately the same?
Yes No
Is the sum of the voltages across the resistors ( equal to the source voltage ?
Yes No
30. Compare the source current measured in step 28 with the source current calculated in step 25. Are they approximately the same?
Yes No
31. Calculate and compare the ratio of the voltages measured across the resistors with the ratio of the resistor values. Are they approximately the same?
Yes No
32. From the results obtained in the previous steps, can ac circuits be solved by using the same fundamental rules as those used with dc circuits, which are Ohm’s law, Kirchhoff’s voltage and current laws, and the formulas used to calculate the equivalent resistance?
Yes No
Ex. 1-1 – The Sine Wave Conclusion
© Festo Didactic 86358-00 19
33. On the Oscilloscope, display the voltage (input E1), voltage (input E2), and source current (input I1) on channels 1, 2, and 3, respectively. Make sure the time base is set so as to display as least two cycles of the sine waves.
34. Compare the waveforms displayed on the Oscilloscope. Do the source current waveform and resistor voltage waveforms reach the maximum positive value, null values, and maximum negative value at the same time, indicating that they are in phase?
Yes No
35. In the Four-Quadrant Dynamometer/Power Supply window, disable the ac power source.
36. Close LVDAC-EMS, then turn off all the equipment. Disconnect all leads and return them to their storage location.
In this exercise, you were introduced to the sine wave and the way to express a sine wave using a phasor rotating around the center of a circle. You learned how to calculate the different parameters of a sine wave, such as the period, the frequency, the amplitude, and the instantaneous value. You were introduced to the concept of rms value and learned how to calculate the rms value from the amplitude of a sine wave.
1. A voltage sine wave has an amplitude of 200 V. Calculate its rms value.
2. The period of a sine wave is 0.02 s. Calculate its frequency.
3. What is the effect on the cycle of a sine wave of increasing the frequency?
CONCLUSION
REVIEW QUESTIONS

Ex. 1-1 – The Sine Wave Review Questions
20 © Festo Didactic 86358-00
4. Which angular position (in degrees as well as in radians) on a circle corresponds to the positive maximum value of a voltage sine wave whose cycle begins at the origin?
5. What is the difference between the amplitude and rms value of a voltage sine wave?

© Festo Didactic 86358-00 21
When you have completed this exercise, you will know what a phase angle is and how the phase angle modifies the initial displacement of a sine wave. You will be able to determine the phase shift between two sine waves, either by comparing their phase angles or by determining their separation in time. You will also know how to distinguish a leading phase shift from a lagging phase shift.
The Discussion of this exercise covers the following points:
Phase angle Phase shift
Phase angle
As you have seen in Exercise 1-1, the graphical representation of a sine wave can be expressed by the following equation:
(1-8)
where is the instantaneous value of the sine wave at a given instant . is the amplitude of the sine wave. is the angular velocity, expressed in radians per second (rad/s). is the time, expressed in seconds (s).
This equation assumes that the sine wave cycle begins at the exact moment when 0 (as is shown in Figure 1-10). As you will see later, this is not always the case. To represent the initial position of the sine wave, the notion of phase angle is introduced in the equation below:
(1-9)
where is the phase angle of the sine wave, expressed in degrees (°) or
radians (rad).
From Equation (1-9), it is easy to observe that the initial value (i.e., the value at 0) of the sine wave depends entirely on the phase angle because the term equals 0 at 0. In other words, the phase angle determines by how much the value of a sine wave differs from 0 at time 0, and thus, the position in time of the sine wave.
Phase Angle and Phase Shift
Exercise 1-2
EXERCISE OBJECTIVE
DISCUSSION OUTLINE
DISCUSSION

Ex. 1-2 – Phase Angle and Phase Shift Discussion
22 © Festo Didactic 86358-00
Figure 1-10 shows a sine wave with a phase angle of 0°. The initial value of this sine wave is 0 because . This sine wave is identical to those seen in Exercise 1-1, as a phase angle value of 0° was implied by the absence of in the equations given in Exercise 1-1.
Figure 1-10. Sine wave with a phase angle of 0°.
Figure 1-11 shows a sine wave with a phase angle of 45°. As you can see from the figure, a positive phase angle (0° to 180°) results in the sine wave having a positive instantaneous value when 0. In other words, a positive phase angle shifts the sine wave toward the left, i.e., advances the sine wave in time.
Figure 1-11. Sine wave with a phase angle of 45°.
Figure 1-12 shows a sine wave with a phase angle of -60°. A negative phase angle (0° to -180°) results in the sine wave having a negative instantaneous value when 0. In other words, a negative phase angle shifts the sine wave toward the right, i.e., delays the sine wave in time.
Figure 1-12. Sine wave with a phase angle of -60°.
0
0
0
0°
45°
-60°
Ex. 1-2 – Phase Angle and Phase Shift Discussion
© Festo Didactic 86358-00 23
Figure 1-10 to Figure 1-12 also show the phasor representations of the sine waves at time 0. Notice that, in each figure, the vertical distance between the tip of the rotating phasor representing the sine wave matches the instantaneous value of the sine wave at 0.
Phase shift
When comparing two sine waves having the same frequency, the difference between their respective phase angles is called the phase shift and is expressed in degrees (°) or radians (rad). The magnitude of the phase shift indicates the extent of separation in time between the two sine waves, while the polarity of the phase shift (positive or negative) indicates the relationship in time between the two sine waves (leading or lagging).The sine wave amplitude value has no effect on the phase shift, as it does not change the period nor the frequency of the sine wave. Sine waves with different frequencies and, as an extension, different periods, cannot be compared by using their phase angles as their cycles do not correspond.
The phase shift between two sine waves is expressed as an angle representing a portion of a complete cycle of the sine waves. One of the two sine waves is used as the reference for phase shift measurements. The phase shift is calculated by subtracting the phase angle of the reference sine wave from the phase angle of the sine wave of interest. This is written as an equation below.
Phase shift (1-10)
where is the phase angle of the sine wave of interest, expressed in
degrees (°) or radians (rad). is the phase angle of the reference sine wave, expressed in
degrees (°) or radians (rad).
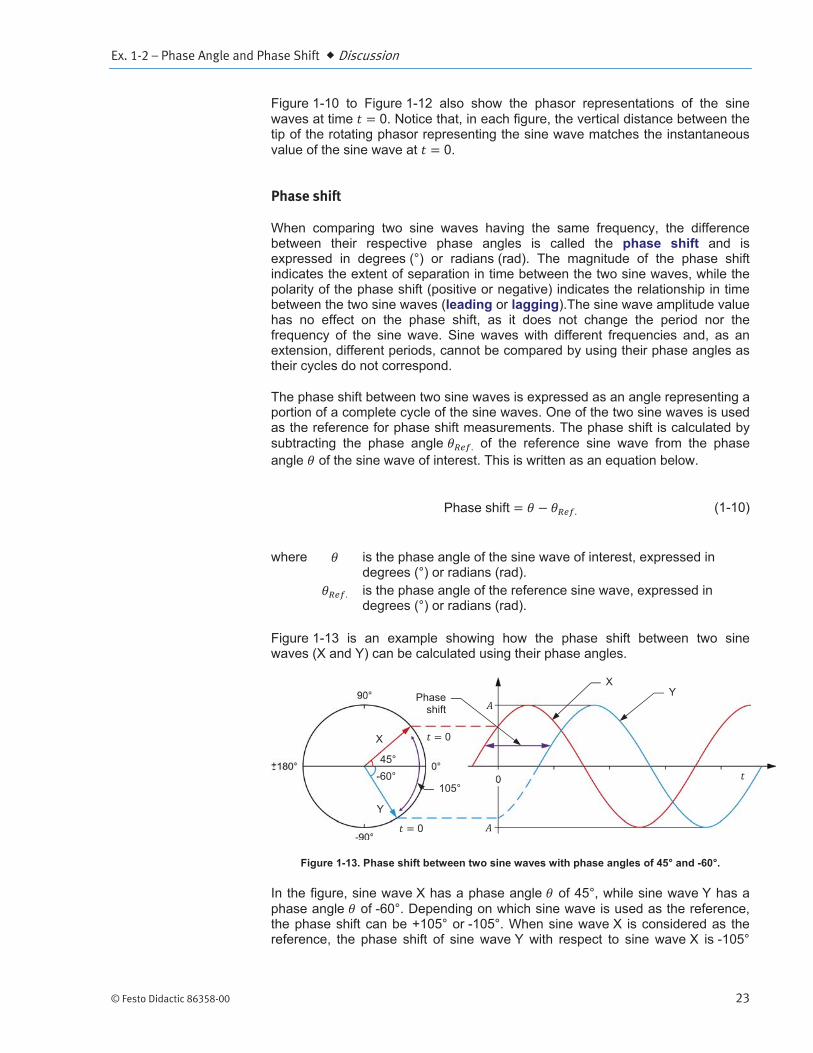
Figure 1-13 is an example showing how the phase shift between two sine waves (X and Y) can be calculated using their phase angles.
Figure 1-13. Phase shift between two sine waves with phase angles of 45° and -60°.
In the figure, sine wave X has a phase angle of 45°, while sine wave Y has a phase angle of -60°. Depending on which sine wave is used as the reference, the phase shift can be +105° or -105°. When sine wave X is considered as the reference, the phase shift of sine wave Y with respect to sine wave X is -105°
0
45° -60°
X Y Phase
shift
X
Y
105°
0

Ex. 1-2 – Phase Angle and Phase Shift Discussion
24 © Festo Didactic 86358-00
(-60° - 45° = -105°). The minus sign in this phase shift value indicates that sine wave Y lags reference sine wave X. For this reason, this phase shift value can also be expressed as 105° lagging. Conversely, when sine wave Y is considered as the reference, the phase shift of sine wave X with respect to sine wave Y is +105° (45° - (-60)° = +105°). The plus sign in this phase shift value indicates that sine wave X leads reference sine wave Y. For this reason, this phase shift value can also be expressed as 105° leading. Note that whenever two sine waves have different phase angles, the phase shift value is not zero, and thus, these sine waves are said to be out of phase.
It is possible to determine the phase shift between two sine waves of the same frequency without knowing their respective phase angles . The following equation is used:
Phase shift rad (1-11)
where is the time interval between a given reference point on each of the two sine waves, expressed in seconds (s).
is the period of the sine waves, expressed in seconds (s).
This equation shows in a concrete way why it is not possible to calculate the phase shift between two sine waves having different frequencies , as a common period ( ) is needed for the equation to be valid.
Consider, for example, the sine waves shown in Figure 1-14. Using Equation (1-11), the phase shift between the two sine waves is equal to:
°
° °
When sine wave 1 is used as the reference, the phase shift is lagging because sine wave 2 is delayed with respect to sine wave 1. Conversely, when sine wave 2 is considered as the reference, the phase shift is leading because sine wave 1 is in advance with respect to sine wave 2.

Ex. 1-2 – Phase Angle and Phase Shift Procedure Outline
© Festo Didactic 86358-00 25
Figure 1-14. Phase shift between two sine waves having the same frequency.
The Procedure is divided into the following sections:
Setup and connections Measuring the phase shift between two voltage sine waves in a resistor-
inductor (RL) circuit Measuring the phase shift between two voltage sine waves in a resistor-
capacitor (RC) circuit
High voltages are present in this laboratory exercise. Do not make or modify anybanana jack connections with the power on unless otherwise specified.
Setup and connections
In this section, you will connect an ac circuit containing an inductor and a resistor in series and set up the equipment to measure the source voltage , as well as the voltage across the resistor .
1. Refer to the Equipment Utilization Chart in Appendix A to obtain the list of equipment required to perform this exercise.
Install the required equipment in the Workstation.
PROCEDURE OUTLINE
PROCEDURE
20.0 ms
3.33 ms
Sine wave 1
Sine wave 2

Ex. 1-2 – Phase Angle and Phase Shift Procedure
26 © Festo Didactic 86358-00
2. Make sure that the main power switch on the Four-Quadrant Dynamometer/ Power Supply is set to the O (off) position, then connect its Power Input to an ac power outlet.
Connect the Power Input of the Data Acquisition and Control Interface to a 24 V ac power supply. Turn the 24 V ac power supply on.
3. Connect the USB port of the Data Acquisition and Control Interface to a USB port of the host computer.
Connect the USB port of the Four-Quadrant Dynamometer/Power Supply to a USB port of the host computer.
4. Turn the Four-Quadrant Dynamometer/Power Supply on, then set the Operating Mode switch to Power Supply.
5. Turn the host computer on, then start the LVDAC-EMS software.
In the LVDAC-EMS Start-Up window, make sure that the Data Acquisition and Control Interface and the Four-Quadrant Dynamometer/Power Supply are detected. Make sure that the Computer-Based Instrumentation function for the Data Acquisition and Control Interface is available. Select the network voltage and frequency that correspond to the voltage and frequency of your local ac power network, then click the OK button to close the LVDAC-EMS Start-Up window.
6. Set up the circuit shown in Figure 1-15. This circuit contains a resistor and an inductor . Inductors are studied in the next unit of this manual.
Figure 1-15. AC circuit with a resistor and an inductor.
The value of inductor in the circuit of Figure 1-15 is referred to as the inductance and is expressed in henries (H). The inductance value to be used depends on the frequency of the ac power source as is indicated in Table 1-2.
300
100 V

Ex. 1-2 – Phase Angle and Phase Shift Procedure
© Festo Didactic 86358-00 27
a As indicated in Appendix A, use the Inductive Load, Model 8321, to obtain the required inductance when the ac power network frequency is 60 Hz. Use the Inductive and Capacitive Loads, Model 8333, to obtain the required inductance when the ac power network frequency is 50 Hz.
Table 1-2. Inductance values for 50 and 60 Hz frequencies.
Power source frequency (Hz)
Inductance (H)
50 0.96
60 0.8
Make the necessary switch settings on the Resistive Load and Inductive Load (or on the Inductive and Capacitive Loads) in order to obtain the resistance and inductance values required.
a Appendix C of this manual lists the switch settings to implement on the Resistive Load and Inductive Load in order to obtain various resistance and inductive values.
Use inputs E1 and E2 of the Data Acquisition and Control Interface to measure the source voltage and the voltage across the resistor , respectively.
7. In LVDAC-EMS, open the Four-Quadrant Dynamometer/Power Supply window, then make the following settings:
Set the Function parameter to AC Power Source.
Make sure that the Voltage Control parameter is set to Knob. This allows the ac power source to be controlled manually.
Set the No Load Voltage parameter to 100 V.
Set the Frequency parameter to the frequency of your local ac power network.
Leave the other parameters set as they are.
Measuring the phase shift between two voltage sine waves in a resistor-inductor (RL) circuit
In this section, you will observe the waveforms (sine waves) of the source voltage and the resistor voltage , using the Oscilloscope to determine the phase shift between the two sine wave voltages. Then, using the Phasor Analyzer, you will measure the phase shift between the source voltage phasor and the resistor voltage phasor and compare it to the phase shift determined from the voltage waveforms.
a As you will see later, due to the presence of an inductor in the circuit, the circuit current lags behind the source voltage. As a result, the voltage measured across the resistor is out of phase with respect to the source voltage .

Ex. 1-2 – Phase Angle and Phase Shift Procedure
28 © Festo Didactic 86358-00
8. In LVDAC-EMS, open the Metering window. Set meters E1 and E2 to measure the rms values of the source voltage and voltage across the resistor , respectively.
In the Four-Quadrant Dynamometer/Power Supply window, enable the ac power source. Readjust the value of the No Load Voltage parameter so that the ac power source voltage (indicated by meter E1 in the Metering window) is equal to 100 V.
9. In LVDAC-EMS, open the Oscilloscope and display (input E1) and (input E2) on channels 1 and 2, respectively. If necessary, set the time base so as to display at least two cycles of the sine waves. Place the traces of the two channels at the same vertical position.
10. Measure the period of the source voltage using the Oscilloscope then record the value below.
a To obtain an accurate measurement, you can use the vertical cursors of the Oscilloscope to measure the period or any other time interval.
Period ms
11. Measure the period of the resistor voltage using the Oscilloscope then record the value below.
Period ms
12. Compare the period of the resistor voltage measured in the previous step with the period of the source voltage recorded in step 10. Are the values close to each other?
Yes No
13. Measure the time interval between the waveforms of the source voltage and resistor voltage by using the Oscilloscope.
Time interval ms
14. Using Equation (1-11), calculate the phase shift between the source voltage and the resistor voltage . Consider the source voltage waveform as the reference.
Phase shift °

Ex. 1-2 – Phase Angle and Phase Shift Procedure
© Festo Didactic 86358-00 29
15. Is the resistor voltage leading or lagging the source voltage ?
16. In LVDAC-EMS, open the Phasor Analyzer and display the source voltage (input E1) and resistor voltage (input E2). Set the Reference Phasor parameter to E1. Measure the phase angles and of the voltage phasors.
Phase angle °
Phase angle °
From these values, calculate the phase shift between the phasors of the source voltage and resistor voltage , using the source voltage phasor as the reference.
Phase shift °
17. Compare the phase shift you determined from the voltage sine waves to the phase shift you measured from the corresponding voltage phasors. Are both values close to each other?
Yes No
Measuring the phase shift between two voltage sine waves in a resistor-capacitor (RC) circuit
In this section, you will replace the inductor used in the previous section by a capacitor. Using the Oscilloscope, you will determine the phase shift between the two voltage sine waves. Then, using the Phasor Analyzer, you will measure the phase shift between the source voltage phasor and the resistor voltage phasor and compare it to the phase shift you determined from the voltage waveforms.
a As you will see later, due to the presence of a capacitor in the circuit, the circuit current leads the source voltage. As a result, the resistor voltage is out of phase with respect to the source voltage .
18. In the Four-Quadrant Dynamometer/Power Supply window, disable the ac power source.
Ex. 1-2 – Phase Angle and Phase Shift Procedure
30 © Festo Didactic 86358-00
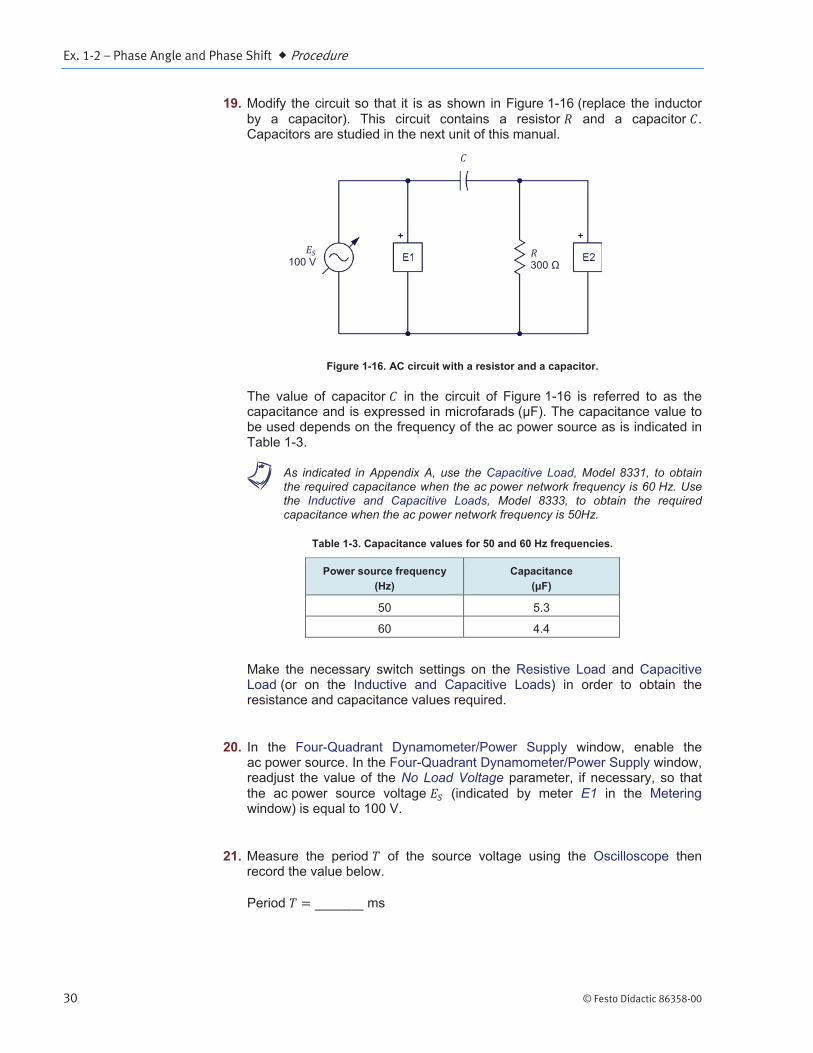
19. Modify the circuit so that it is as shown in Figure 1-16 (replace the inductor by a capacitor). This circuit contains a resistor and a capacitor . Capacitors are studied in the next unit of this manual.
Figure 1-16. AC circuit with a resistor and a capacitor.
The value of capacitor in the circuit of Figure 1-16 is referred to as the capacitance and is expressed in microfarads ( F). The capacitance value to be used depends on the frequency of the ac power source as is indicated in Table 1-3.
a As indicated in Appendix A, use the Capacitive Load, Model 8331, to obtain the required capacitance when the ac power network frequency is 60 Hz. Use the Inductive and Capacitive Loads, Model 8333, to obtain the required capacitance when the ac power network frequency is 50Hz.
Table 1-3. Capacitance values for 50 and 60 Hz frequencies.
Power source frequency (Hz)
Capacitance ( F)
50 5.3
60 4.4
Make the necessary switch settings on the Resistive Load and Capacitive Load (or on the Inductive and Capacitive Loads) in order to obtain the resistance and capacitance values required.
20. In the Four-Quadrant Dynamometer/Power Supply window, enable the ac power source. In the Four-Quadrant Dynamometer/Power Supply window, readjust the value of the No Load Voltage parameter, if necessary, so that the ac power source voltage (indicated by meter E1 in the Metering window) is equal to 100 V.
21. Measure the period of the source voltage using the Oscilloscope then record the value below.
Period ms
100 V
300

Ex. 1-2 – Phase Angle and Phase Shift Procedure
© Festo Didactic 86358-00 31
22. Measure the period of the resistor voltage using the Oscilloscope then record the value below.
Period ms
23. Compare the period of the resistor voltage measured in the previous step with the period of the source voltage recorded in step 21. Are the values close to each other?
Yes No
24. Measure the time interval between the waveforms of the source voltage and resistor voltage .
Time interval ms
25. Using Equation (1-11), calculate the phase shift between the source voltage and the resistor voltage . Consider the source voltage waveform as the reference.
Phase shift = °
26. Is the resistor voltage leading or lagging the source voltage ?
27. In the Phasor Analyzer, measure the phase angles and of the voltage phasors.
Phase angle °
Phase angle °
From these values, calculate the phase shift between the phasors of the source voltage and resistor voltage , using the source voltage phasor as the reference.
Phase shift °
28. Compare the phase shift you determined from the voltage sine waves to the phase shift you measured from the corresponding voltage phasors. Are both values close to each other?
Yes No
29. In the Four-Quadrant Dynamometer/Power Supply window, disable the ac power source.

Ex. 1-2 – Phase Angle and Phase Shift Conclusion
32 © Festo Didactic 86358-00
30. Close LVDAC-EMS, then turn off all the equipment. Disconnect all leads and return them to their storage location.
In this exercise, you saw how the phase angle modifies the value of a sine wave at time 0, and thus, the position in time of the sine wave. You observed the effects of positive and negative phase angles on the relative position in time of a sine wave. You were introduced to the notion of phase shift. You learned how to calculate and measure the phase shift between two sine waves and to differentiate between a lagging and a leading phase shift.
1. What is the effect of the phase angle on the graphical representation of a sine wave?
2. A sine wave has a phase angle of 72°. Will this sine wave reach its maximum value before, after or at the same time as a second waveform having a phase angle of -18°?
3. Given the following two sine wave equations:
78°
Calculate the phase shift between these two sine waves, considering the first sine wave as the reference. Indicate also whether the second sine wave is lagging or leading the reference sine wave.
CONCLUSION
REVIEW QUESTIONS

Ex. 1-2 – Phase Angle and Phase Shift Review Questions
© Festo Didactic 86358-00 33
4. When calculating the phase shift between two sine waves, which of the following parameters do the two sine waves need to have in common: phase angle, amplitude, frequency, or period? Why?
5. Consider two sine waves with the same frequency. They both have a period of 50 ms. The second sine wave reaches its maximum positive value 8 ms after the first. Calculate the phase shift between the two sine waves, considering the first one as the reference.


© Festo Didactic 86358-00 35
When you have completed this exercise, you will know the difference between instantaneous power and average power, and how to calculate them. You will be able to explain and demonstrate the concept of instantaneous power in ac circuits. You will also be able to determine the average power dissipated in a resistor when it is connected to an ac power source. You will be able to demonstrate the relationship between rms values and average power in resistive ac circuits.
The Discussion of this exercise covers the following points:
Instantaneous power Average power Rationale behind rms values
Instantaneous power
When electrical power is supplied to a dc motor, a fraction of the power is converted into mechanical energy and the remainder is converted into heat. When power is supplied to a storage battery during charge, some of the power is converted in chemical energy, while the rest is converted in heat. However, when power is supplied to a resistor, all power is converted into heat. This conversion of electrical power into heat is a very efficient process, and we make use of it every day in electric toasters, stoves, and electrically-heated homes.
In dc circuits, power is the product of the voltage and the current . The same is true for ac circuits. However, in the case of ac circuits, it is important to know the difference between instantaneous power and average power. From what has been seen so far, it should be clear that the power supplied to a load connected to an ac source varies with time, since the circuit voltage and current are sine waves. Instantaneous power is equal to the product calculated at each instant of the sine wave cycle. Figure 1-17 shows an example of a power waveform in relation to the voltage and current sine waves. As you can see, in the first half of their cycle, both the voltage and current sine waves have positive values, while in the second half, they both have negative values. Thus, the product (i.e., the power waveform) is always positive, whether or not the voltage and current sine waves are in the positive or negative half of the cycle. As a result, the net power delivered to the load is equal to the power delivered during the positive half-wave plus the power delivered during the negative half-wave.
Instantaneous Power and Average Power
Exercise 1-3
EXERCISE OBJECTIVE
DISCUSSION OUTLINE
DISCUSSION
Ex. 1-3 – Instantaneous Power and Average Power Discussion
36 © Festo Didactic 86358-00
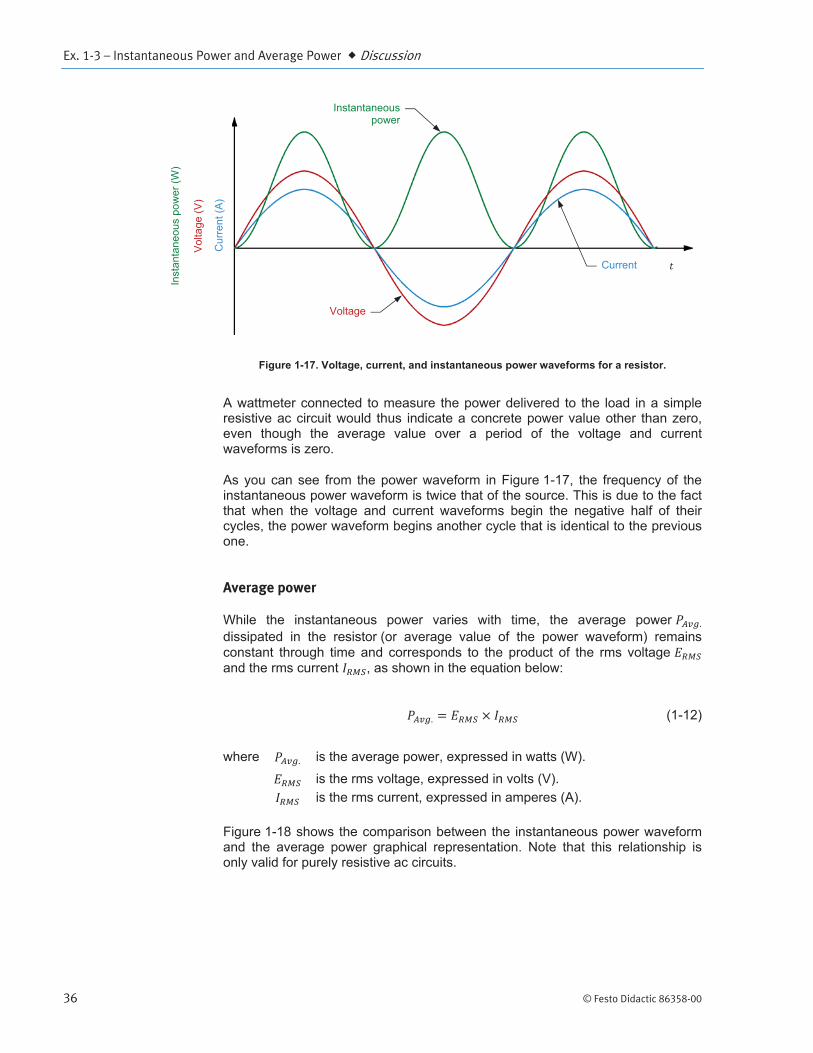
Figure 1-17. Voltage, current, and instantaneous power waveforms for a resistor.
A wattmeter connected to measure the power delivered to the load in a simple resistive ac circuit would thus indicate a concrete power value other than zero, even though the average value over a period of the voltage and current waveforms is zero.
As you can see from the power waveform in Figure 1-17, the frequency of the instantaneous power waveform is twice that of the source. This is due to the fact that when the voltage and current waveforms begin the negative half of their cycles, the power waveform begins another cycle that is identical to the previous one.
Average power
While the instantaneous power varies with time, the average power dissipated in the resistor (or average value of the power waveform) remains constant through time and corresponds to the product of the rms voltage and the rms current , as shown in the equation below:
(1-12)
where is the average power, expressed in watts (W). is the rms voltage, expressed in volts (V). is the rms current, expressed in amperes (A).
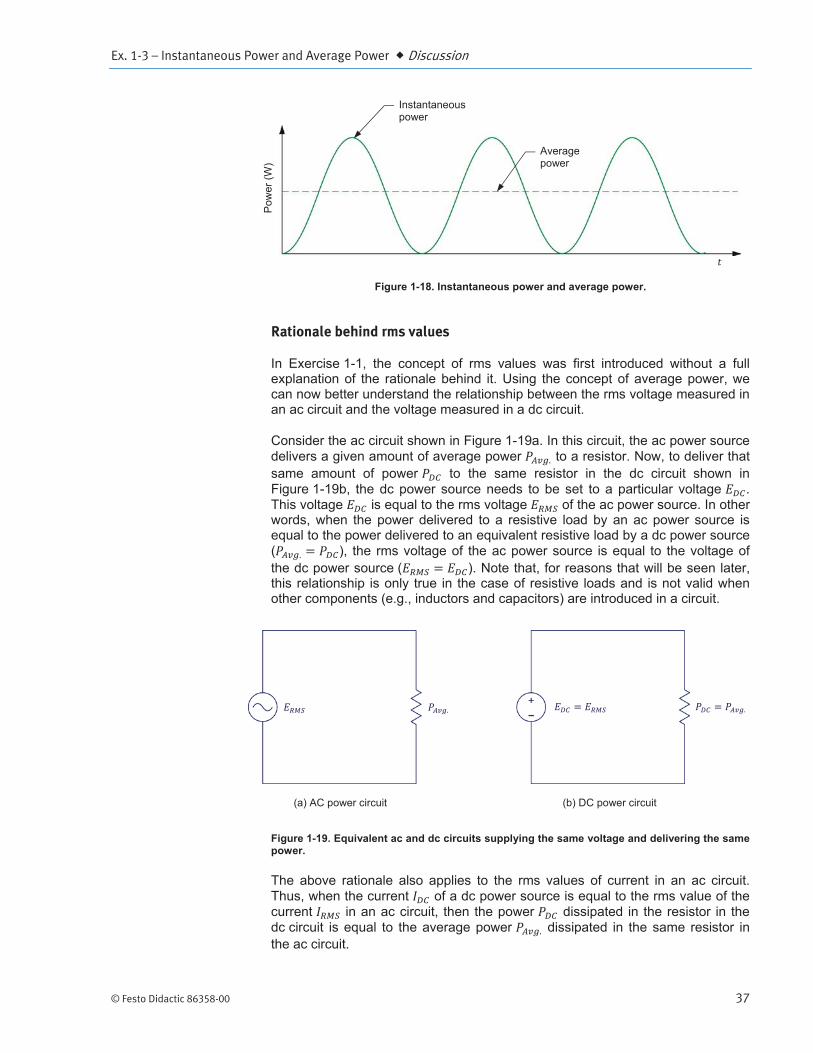
Figure 1-18 shows the comparison between the instantaneous power waveform and the average power graphical representation. Note that this relationship is only valid for purely resistive ac circuits.
Instantaneouspower
Voltage
Current
Cur
rent
(A)
Vol
tage
(V)
Inst
anta
neou
s po
wer
(W)
Ex. 1-3 – Instantaneous Power and Average Power Discussion
© Festo Didactic 86358-00 37
Figure 1-18. Instantaneous power and average power.
Rationale behind rms values
In Exercise 1-1, the concept of rms values was first introduced without a full explanation of the rationale behind it. Using the concept of average power, we can now better understand the relationship between the rms voltage measured in an ac circuit and the voltage measured in a dc circuit.
Consider the ac circuit shown in Figure 1-19a. In this circuit, the ac power source delivers a given amount of average power to a resistor. Now, to deliver that same amount of power to the same resistor in the dc circuit shown in Figure 1-19b, the dc power source needs to be set to a particular voltage . This voltage is equal to the rms voltage of the ac power source. In other words, when the power delivered to a resistive load by an ac power source is equal to the power delivered to an equivalent resistive load by a dc power source ( ), the rms voltage of the ac power source is equal to the voltage of the dc power source ( ). Note that, for reasons that will be seen later, this relationship is only true in the case of resistive loads and is not valid when other components (e.g., inductors and capacitors) are introduced in a circuit.
Figure 1-19. Equivalent ac and dc circuits supplying the same voltage and delivering the same power.
The above rationale also applies to the rms values of current in an ac circuit. Thus, when the current of a dc power source is equal to the rms value of the current in an ac circuit, then the power dissipated in the resistor in the dc circuit is equal to the average power dissipated in the same resistor in the ac circuit.
(a) AC power circuit (b) DC power circuit
Instantaneous power
Average power
Pow
er (W
)

Ex. 1-3 – Instantaneous Power and Average Power Procedure Outline
38 © Festo Didactic 86358-00
The Procedure is divided into the following sections:
Setup and connections Average power measurements Rationale behind rms values
High voltages are present in this laboratory exercise. Do not make or modify anybanana jack connections with the power on unless otherwise specified.
Setup and connections
In this section, you will connect an ac circuit containing a resistor and set up the equipment to measure the source voltage , source current , and power delivered to the resistor by the source.
1. Refer to the Equipment Utilization Chart in Appendix A to obtain the list of equipment required to perform this exercise.
Install the required equipment in the Workstation.
2. Make sure that the main power switch on the Four-Quadrant Dynamometer/ Power Supply is set to the O (off) position, then connect its Power Input to an ac power outlet.
Connect the Power Input of the Data Acquisition and Control Interface to a 24 V ac power supply. Turn the 24 V ac power supply on.
3. Connect the USB port of the Data Acquisition and Control Interface to a USB port of the host computer.
Connect the USB port of the Four-Quadrant Dynamometer/Power Supply to a USB port of the host computer.
4. Turn the Four-Quadrant Dynamometer/Power Supply on, then set the Operating Mode switch to Power Supply.
5. Turn the host computer on, then start the LVDAC-EMS software.
In the LVDAC-EMS Start-Up window, make sure that the Data Acquisition and Control Interface and the Four-Quadrant Dynamometer/Power Supply are detected. Make sure that the Computer-Based Instrumentation function for the Data Acquisition and Control Interface is available. Select the network voltage and frequency that correspond to the voltage and frequency of your local ac power network, then click the OK button to close the LVDAC-EMS Start-Up window.
PROCEDURE OUTLINE
PROCEDURE

Ex. 1-3 – Instantaneous Power and Average Power Procedure
© Festo Didactic 86358-00 39
6. Set up the circuit shown in Figure 1-20.
Figure 1-20. AC circuit containing a resistor, as well as a voltmeter and an ammeter for voltage, current, and power measurements.
Make the necessary switch settings on the Resistive Load in order to obtain the resistance value required.
Use inputs E1 and I1 of the Data Acquisition and Control Interface to measure the source voltage and the source current , respectively.
7. In LVDAC-EMS, open the Four-Quadrant Dynamometer/Power Supply window, then make the following settings:
Set the Function parameter to AC Power Source.
Make sure that the Voltage Control parameter is set to Knob. This allows the ac power source to be controlled manually.
Set the No Load Voltage parameter to 100 V.
Set the Frequency parameter to the frequency of your local ac power network.
Leave the other parameters set as they are.
Average power measurements
In this section, you will observe the waveforms of the source voltage , source current , and power which the ac power source delivers to the resistor in the ac power circuit you set-up in the previous section. You will measure the average source power , as well as the rms values of the source voltage and source current . You will then calculate the source power from the measured rms values of the source voltage and current and compare the result with the measured source power .
171
100 V

Ex. 1-3 – Instantaneous Power and Average Power Procedure
40 © Festo Didactic 86358-00
8. In LVDAC-EMS, open the Metering window. Set meters E1 and I1 to measure the rms values of the ac power source voltage and source current , respectively.
In the Four-Quadrant Dynamometer/Power Supply window, enable the ac power source. Readjust the value of the No Load Voltage parameter so that the ac power source voltage (indicated by meter E1 in the Metering window) is equal to 100 V.
9. In LVDAC-EMS, open the Oscilloscope and set the parameters to display the source voltage , source current , and power which the ac power source delivers to the resistor on channels 1, 2, and 3, respectively. Ensure that the time base is adjusted to show at least two complete cycles of the waveforms and select convenient vertical scales.
10. On the Oscilloscope, determine the period of the waveforms of the source voltage and source current , then calculate the source frequency from the measured period .
Period ms Frequency Hz
11. On the Oscilloscope, determine the period of the waveform of instantaneous power , then calculate the source frequency from the measured period .
Period ms Frequency Hz
12. How does the frequency of the waveform of instantaneous power obtained in the previous step compare with the frequency of the current and voltage recorded in step 10?
13. Observe that the polarity of the waveform of instantaneous power is always positive. Explain why.

Ex. 1-3 – Instantaneous Power and Average Power Procedure
© Festo Didactic 86358-00 41
14. On the Oscilloscope, record the average value of the waveform of the source power .
Average power W
15. Record below the rms values of the source voltage and source current , indicated by meters E1 and I1 in the Metering window, respectively.
Source voltage V Source current A
16. Calculate the power which the source delivers to the load resistor using the rms values of and measured in the previous step.
Power W
17. Compare the power calculated in the previous step with the average power recorded in step 14. Are the values close to each other?
Yes No
18. Does this confirm that the average power dissipated in a resistor connected to an ac power source is equal to the product of the rms values of the resistor voltage and current?
Yes No
Rationale behind rms values
In this section, you will set the Four-Quadrant Dynamometer/Power Supply so that it operates as a dc power source. You will then adjust the dc source voltage until you obtain a power that is equal to the average power obtained previously using the ac power source. This will allow you to determine the relationship between the dc voltage value and the rms voltage value when the same amount of power is delivered to a resistive load.
19. In the Four-Quadrant Dynamometer/Power Supply window, set the Function parameter to DC Voltage Source. This changes the ac power source to a dc power source and automatically sets the status of the Four-Quadrant Dynamometer/Power Supply to Stopped.

Ex. 1-3 – Instantaneous Power and Average Power Procedure
42 © Festo Didactic 86358-00
The circuit is now set-up as shown in Figure 1-21.
Figure 1-21. DC circuit containing a resistor, as well as a voltmeter and an ammeter for voltage, current, and power measurements.
20. In the Four-Quadrant Dynamometer/Power Supply window, enable the dc power source, then adjust the voltage of the dc power source so that the power delivered to the resistor (see the average value of the power waveform in channel 3 indicated under the Oscilloscope display) is equal to the average power delivered by the ac power source in the previous section (recorded in step 14). Record the dc source voltage below:
DC source voltage V
21. Compare the measured dc source voltage to the rms voltage of the ac power source used in the previous section (recorded in step 15). Are the values close to each other?
Yes No
22. What can you conclude about the rms value of the voltage (or current) in ac circuits containing a resistive load?
23. In the Four-Quadrant Dynamometer/Power Supply window, disable the dc power source.
24. Close LVDAC-EMS, then turn off all the equipment. Disconnect all leads and return them to their storage location.
171

Ex. 1-3 – Instantaneous Power and Average Power Conclusion
© Festo Didactic 86358-00 43
In this exercise, you were introduced to the notion of instantaneous power and average power and saw how to differentiate between them. You saw how to calculate the instantaneous power in an ac circuit as well as how to represent instantaneous power graphically. You learned how to determine the average power dissipated in an ac circuit. You also learned the relationship between rms voltage values and dc voltage values in circuits containing resistive loads.
1. What is the difference between the average power and the instantaneous power in an ac circuit?
2. How is it possible to calculate the average power dissipated in an ac circuit?
3. What is the frequency of a power waveform compared to the corresponding voltage and current sine waves? Explain why.
4. What is the average power dissipated by a 100 resistor when it is connected to an ac source having an amplitude of 141 V?
5. A sinusoidal voltage having a period of 20.0 ms is applied to a resistive load. What is the frequency of the power waveform at the resistor?
CONCLUSION
REVIEW QUESTIONS


Unit 1 – Alternating Current Unit Test
© Festo Didactic 86358-00 45
Unit Test
1. What is the period of a sine wave?
a. The time between the positive and negative half-waves of the sine wave. b. The number of times its cycle repeats itself in a second. c. The time between the maximum positive value and the maximum
negative value. d. The time it takes for the sine wave to complete one cycle.
2. What is the period of a sine wave whose frequency is 120 Hz?
a. 120 ms b. 8.33 ms c. 33.4 ms d. 16.7 ms
3. AC power produces a current which changes direction periodically and alternates between maximum positive and negative values.
a. True b. False c. It depends on the frequency . d. None of the above.
4. What is the phase shift between the voltage and current in a circuit containing only a resistive load?
a. 180° b. 90° c. There is no phase shift. d. It depends on the power dissipated in the load.
5. Given the following ac voltage equations: and , calculate the phase shift between them. Consider the
second one as the reference.
a. -30° b. 80° c. -80° d. It is impossible to calculate their phase shift as they do not have the
same frequency.
6. The phase angle of a sine wave determines the:
a. frequency of the sine wave. b. initial value of the sine wave. c. maximum positive and negative values of the sine wave. d. duration of the positive and negative half-waves of the sine wave.

Unit 1 – Alternating Current Unit Test
46 © Festo Didactic 86358-00
7. In a given circuit containing only a resistor, an ac power source will dissipate more power than a dc power source having a voltage equal to the amplitude of the ac voltage sine wave.
a. True b. False, because the ac power source average power value is zero over a
complete period. c. False, because the amplitude of an ac voltage sine wave is greater than
its rms voltage value. d. True, because power equals the product of the rms voltage and current
values.
8. The instantaneous power waveform in a dc circuit is the same as in an ac circuit.
a. True b. False, the instantaneous power in a dc circuit is constant. c. True, if they have the same frequency. d. False, instantaneous power does not exist in dc circuits.
9. The maximum positive and negative values of a sine wave are determined by the:
a. phase angle. b. period. c. frequency. d. amplitude.
10. What is the amplitude of a voltage sine wave if it produces the same average power in a resistor as a dc voltage of 50.0 V?
a. 70.7 V b. 141 V c. 50.0 V d. 35.5 V

© Festo Didactic 86358-00 47
When you have completed this unit, you will know what an inductor and a capacitor are. You will be able to calculate the inductive reactance of an inductor from its inductance and the capacitive reactance of a capacitor from its capacitance. You will be familiar with the relationship between the source frequency and the reactance of an inductor or a capacitor. You will also know the effects of introducing an inductor and a capacitor in an ac circuit on the voltage and current waveforms.
The Discussion of Fundamentals covers the following points:
Introduction to inductors and capacitors Distinction between resistance, reactance, and impedance
Introduction to inductors and capacitors
Most circuits studied so far contained only resistive components. Typical ac circuits, however, contain two other fundamental types of components: inductors and capacitors. In Exercise 1-2, you used an inductor and a capacitor to produce a phase shift between the voltage and current sine waves in an ac circuit. This unit covers inductors and capacitors in more detail.
Inductors are widely used in ac circuits. In fact, the windings of transformers and ac motors are fundamentally inductors, which means that the windings have the same effect as an inductor when introduced in an ac circuit. Inductors can also be deliberately added to ac circuits in order to modify the circuit characteristics. Figure 2-1 shows some of the many types of inductors available. An inductor consists essentially of a conducting wire shaped as a coil. Current flowing through the wire creates a strong magnetic field inside the coil.
Resistance, Reactance, and Impedance
Unit 2
UNIT OBJECTIVE
DISCUSSION OUTLINE
DISCUSSION OF FUNDAMENTALS
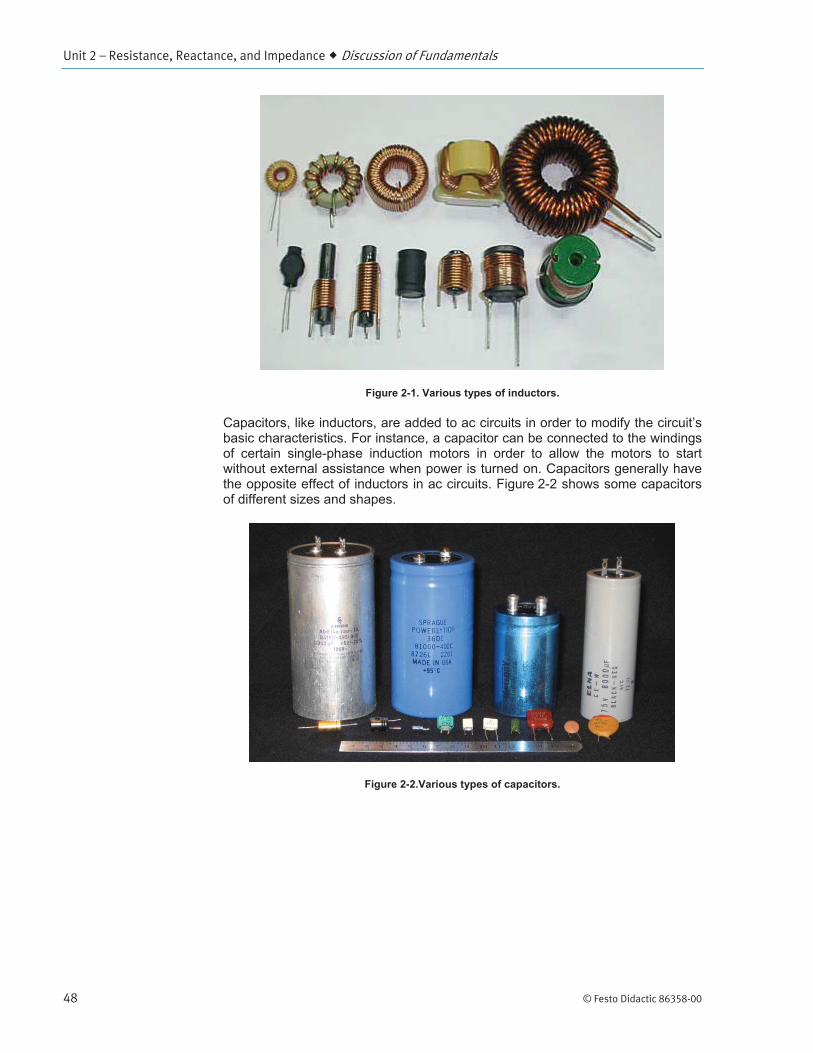
Unit 2 – Resistance, Reactance, and Impedance Discussion of Fundamentals
48 © Festo Didactic 86358-00
Figure 2-1. Various types of inductors.
Capacitors, like inductors, are added to ac circuits in order to modify the circuit’s basic characteristics. For instance, a capacitor can be connected to the windings of certain single-phase induction motors in order to allow the motors to start without external assistance when power is turned on. Capacitors generally have the opposite effect of inductors in ac circuits. Figure 2-2 shows some capacitors of different sizes and shapes.
Figure 2-2.Various types of capacitors.

Unit 2 – Resistance, Reactance, and Impedance Discussion of Fundamentals
© Festo Didactic 86358-00 49
Distinction between resistance, reactance, and impedance
Like resistors, inductors and capacitors oppose current flow in electrical circuits. However, while the opposition to current flow produced by resistors is called resistance, the opposition to current flow caused by inductors and capacitors is referred to as reactance. Like resistance, reactance is expressed in ohms ( ). The reactance of an inductor is known as inductive reactance while the reactance of a capacitor is known as capacitive reactance. Reactance is studied in detail in the first two exercises of this unit.
The total opposition to current flow in an ac circuit, i.e., the opposition to current flow due to all resistors, inductors, and capacitors in the circuit, is referred to as the impedance. Impedance, like resistance and reactance, is expressed in ohms ( ). Impedance is studied in the third exercise of this unit.

© Festo Didactic 86358-00 51
When you have completed this exercise, you will know what an inductor is. You will be able to calculate the inductive reactance of an inductor from its inductance. You will know the relationship between the source frequency and the inductive reactance of an inductor. You will also know the effect of introducing an inductor in an ac circuit on the voltage and current waveforms.
The Discussion of this exercise covers the following points:
Inductors and inductive reactance Inductive phase shift
Inductors and inductive reactance
An inductor consists basically of a coil of wire with or without an iron core. Inductors store energy in the magnetic field that is produced when current flows through the coil. As a result, inductors oppose current changes.
The fundamental characteristic of an inductor is the inductance , which is expressed in henries (H). Inductance is one of the main factors that determine the opposition to current flow of an inductor, i.e., the inductive reactance . As for resistance, inductive reactance is expressed in ohms ( ). The equation for inductive reactance is given below:
(2-1)
where is the inductive reactance of the inductor, expressed in ohms ( ). is the frequency of the ac power source, expressed in hertz (Hz). is the inductance of the inductor, expressed in henries (H).
Equation (2-1) shows that the inductive reactance of an inductor is directly proportional to the inductance of the inductor and the frequency of the ac power source.
Ohm’s law states that the current flowing in an inductor is equal to . Therefore, the higher the inductive reactance of the inductor, the lower the inductor current.
Inductive Reactance
Exercise 2-1
EXERCISE OBJECTIVE
DISCUSSION OUTLINE
DISCUSSION
The current flowing in a resistor is equal to . Notice the similarity with the equation for the current flowing in an inductor.

Ex. 2-1 – Inductive Reactance Procedure Outline
52 © Festo Didactic 86358-00
Inductive phase shift
Another fundamental characteristic of an inductor is that the sine wave of the current flowing in the inductor lags the sine wave of the voltage across the inductor by 90°. Figure 2-3 shows the typical voltage and current waveforms related to an inductor and the corresponding phasors.
Figure 2-3. Voltage and current waveforms related to an inductor and corresponding phasors.
The 90° phase shift between the voltage and current sine waves related to an inductor is only true for ideal inductors. For actual inductors, the current lags the voltage by a little less than 90°. This is because the wire of the inductor coil itself has a certain resistance. This resistance adds to the opposition to current flow produced by the inductor, i.e., the total opposition to current flow created by the inductor is equal to the inductive reactance plus the resistance of the wire coil. The exact relationship between inductance and resistance is explained in Exercise 2-3 of this manual.
The Procedure is divided into the following sections:
Setup and connections Inductance and inductive reactance Effect of frequency on the inductive reactance Measuring the inductive phase shift
High voltages are present in this laboratory exercise. Do not make or modify anybanana jack connections with the power on unless otherwise specified.
Setup and connections
In this section, you will connect an ac circuit containing an inductor and set up the equipment to measure the voltage across the inductor and the current flowing through the inductor.
PROCEDURE OUTLINE
PROCEDURE
90°
Current Voltage
Phase shift
0

Ex. 2-1 – Inductive Reactance Procedure
© Festo Didactic 86358-00 53
1. Refer to the Equipment Utilization Chart in Appendix A to obtain the list of equipment required to perform this exercise.
Install the required equipment in the Workstation.
2. Make sure that the main power switch on the Four-Quadrant Dynamometer/ Power Supply is set to the O (off) position, then connect its Power Input to an ac power outlet.
Connect the Power Input of the Data Acquisition and Control Interface to a 24 V ac power supply. Turn the 24 V ac power supply on.
3. Connect the USB port of the Data Acquisition and Control Interface to a USB port of the host computer.
Connect the USB port of the Four-Quadrant Dynamometer/Power Supply to a USB port of the host computer.
4. Turn the Four-Quadrant Dynamometer/Power Supply on, then set the Operating Mode switch to Power Supply.
5. Turn the host computer on, then start the LVDAC-EMS software.
In the LVDAC-EMS Start-Up window, make sure that the Data Acquisition and Control Interface and the Four-Quadrant Dynamometer/Power Supply are detected. Make sure that the Computer-Based Instrumentation function for the Data Acquisition and Control Interface is available. Select the network voltage and frequency that correspond to the voltage and frequency of your local ac power network, then click the OK button to close the LVDAC-EMS Start-Up window.
6. Set up the circuit shown in Figure 2-4.
Figure 2-4. AC circuit containing an inductor.
The value of the inductance to be used in the circuit of Figure 2-4 depends on the frequency of the ac power source, as indicated in Table 2-1.
100 V
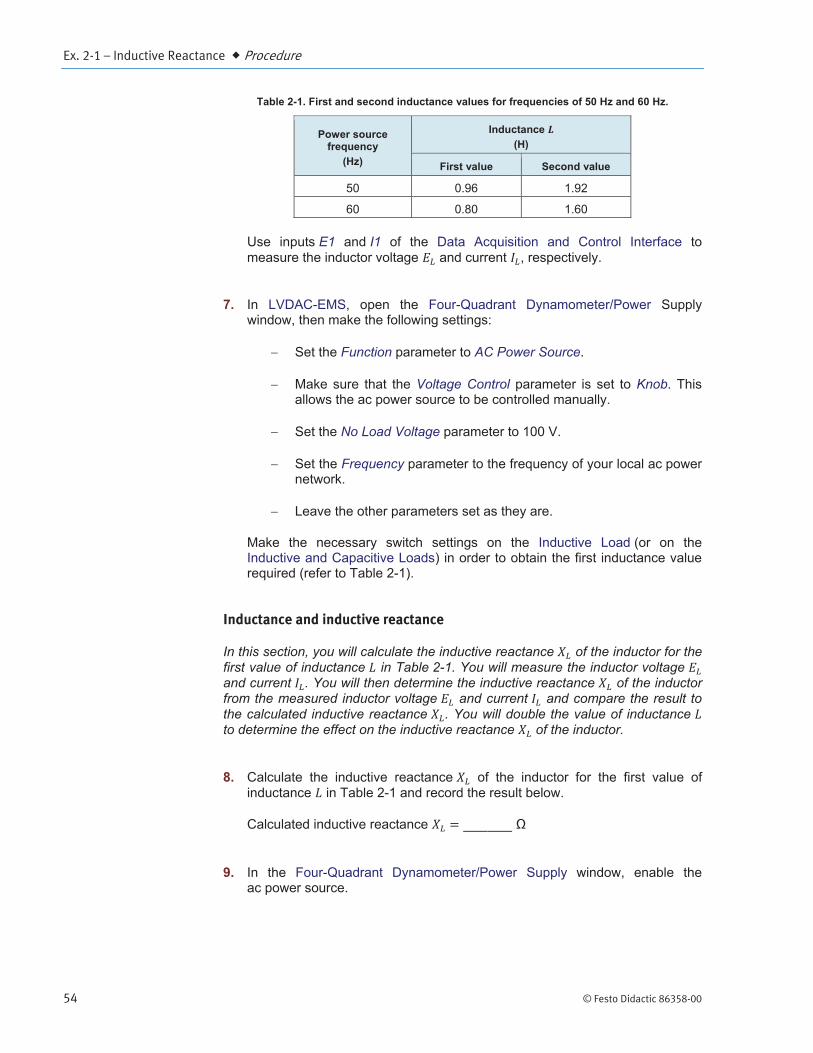
Ex. 2-1 – Inductive Reactance Procedure
54 © Festo Didactic 86358-00
Table 2-1. First and second inductance values for frequencies of 50 Hz and 60 Hz.
Power source frequency
(Hz)
Inductance (H)
First value Second value
50 0.96 1.92
60 0.80 1.60
Use inputs E1 and I1 of the Data Acquisition and Control Interface to measure the inductor voltage and current , respectively.
7. In LVDAC-EMS, open the Four-Quadrant Dynamometer/Power Supply window, then make the following settings:
Set the Function parameter to AC Power Source.
Make sure that the Voltage Control parameter is set to Knob. This allows the ac power source to be controlled manually.
Set the No Load Voltage parameter to 100 V.
Set the Frequency parameter to the frequency of your local ac power network.
Leave the other parameters set as they are.
Make the necessary switch settings on the Inductive Load (or on the Inductive and Capacitive Loads) in order to obtain the first inductance value required (refer to Table 2-1).
Inductance and inductive reactance
In this section, you will calculate the inductive reactance of the inductor for the first value of inductance in Table 2-1. You will measure the inductor voltage and current . You will then determine the inductive reactance of the inductor from the measured inductor voltage and current and compare the result to the calculated inductive reactance . You will double the value of inductance to determine the effect on the inductive reactance of the inductor.
8. Calculate the inductive reactance of the inductor for the first value of inductance in Table 2-1 and record the result below.
Calculated inductive reactance
9. In the Four-Quadrant Dynamometer/Power Supply window, enable the ac power source.

Ex. 2-1 – Inductive Reactance Procedure
© Festo Didactic 86358-00 55
10. In LVDAC-EMS, open the Metering window. Set meters E1 and I1 to measure the rms values of the inductor voltage and current , respectively.
In the Four-Quadrant Dynamometer/Power Supply window, readjust the value of the No Load Voltage parameter so that the ac power source voltage (indicated by meter E1 in the Metering window) is equal to 100 V.
Record below the measured values of the inductor voltage and current (meters E1 and I1, respectively).
Inductor voltage V Inductor current A
11. Calculate the inductive reactance of the inductor using the inductor voltage and current measured in the previous step.
Inductive reactance
12. Compare the inductive reactance obtained in the previous step with the calculated inductive reactance recorded in step 8. Are the values close to each other?
Yes No
13. Set the inductance of the inductor to the second value indicated in Table 2-1 by making the necessary switch settings on the Inductive Load.
14. Calculate the inductive reactance of the inductor for the second value of inductance in Table 2-1 and record the result in the second column in Table 2-2 (see next procedure section).
Indicate the frequency (50 or 60 Hz) of your local ac power network in the first column in Table 2-2.
15. In the Metering window, measure the rms values of the inductor voltage and current . Record the values in the proper cells of the third and fourth columns in Table 2-2.
16. Calculate the inductive reactance of the inductor using the inductor voltage and current measured in the previous step. Record the result in the fifth column in Table 2-2.

Ex. 2-1 – Inductive Reactance Procedure
56 © Festo Didactic 86358-00
17. Compare the inductive reactance obtained in the previous step with the calculated inductive reactance recorded in step 14. Are the values close to each other?
Yes No
18. Compare the inductive reactance of the inductor for the first inductance value to the inductive reactance for the second inductance value. What happened to the inductive reactance of the inductor when you doubled the inductance ? Describe the relationship between the inductance and the inductive reactance of an inductor.
Effect of frequency on the inductive reactance
In this section, you will calculate the inductive reactance of the inductor using the second value of inductance in Table 2-1, for ac power source frequencies of 40 Hz and 70 Hz. For each of these two frequencies, you will measure the inductor voltage and current , calculate the inductive reactance of the inductor from the measured voltage and current, and compare it with the corresponding calculated inductive reactance . Using the inductive reactance values calculated from the measured inductor voltages and currents, you will determine the relationship between the source frequency and the inductive reactance .
19. Calculate the inductive reactance of the inductor (using the second value of inductance indicated in Table 2-1) at frequencies of 40 and 70 Hz. Record the results in the proper cells of the second column in Table 2-2.
Table 2-2. Calculated inductive reactance and measured voltage , current , and inductive reactance for various frequencies.
Power source frequency
(Hz)
Calculated inductive
reactance ( )
Inductor voltage
(V)
Inductor current
(A)
Inductive reactance
( )
40
50 or 60
70
20. In the Four-Quadrant Dynamometer/Power Supply window, set the Frequency parameter to 40 Hz.

Ex. 2-1 – Inductive Reactance Procedure
© Festo Didactic 86358-00 57
21. In the Metering window, measure the rms values of the inductor voltage and current and record the values in the proper cells of the third and fourth columns in Table 2-2.
22. Calculate the inductive reactance of the inductor from the inductor voltage and current measured in the previous step. Record the result in the proper cell of the fifth column in Table 2-2.
23. In the Four-Quadrant Dynamometer/Power Supply window, set the Frequency parameter to 70 Hz, then repeat steps 21 and 22.
24. Determine the relationship between the inductive reactance of an inductor and the ac power source frequency using the values recorded in Table 2-2.
Measuring the inductive phase shift
In this section, you will observe the waveforms of the inductor voltage and current using the Oscilloscope to determine the phase shift between these parameters. Then, using the Phasor Analyzer, you will measure the phase shift between the inductor voltage phasor and the inductor current phasor, and compare the result to the phase shift you determined from the voltage and current waveforms.
25. In the Four-Quadrant Dynamometer/Power Supply window, set the Frequency parameter to the frequency of your local ac power network.
26. In LVDAC-EMS, open the Oscilloscope and display the inductor voltage and current on channels 1 and 2, respectively. If necessary, set the time base to display at least two cycles of the waveforms. Select channel 1 (inductor voltage) as the trigger source then set the trigger level to 0 V.
Notice that the amplitude of the inductor voltage waveform is equivalent to the rms value of the inductor voltage indicated in the Metering window. Also notice that the amplitude of the inductor current waveform is equivalent to the rms value of the inductor current indicated in the Metering window.
27. Does the sine wave of the inductor current lag the sine wave of the inductor voltage?
Yes No

Ex. 2-1 – Inductive Reactance Conclusion
58 © Festo Didactic 86358-00
28. Using the Oscilloscope, determine the period of the waveforms of the inductor voltage and the inductor current. Record the value below.
Period ms
29. Using the Oscilloscope, determine the time interval between the inductor voltage and the inductor current, then calculate the phase shift between the two waveforms.
Consider the inductor voltage waveform as the reference.
Time interval ms
Phase shift °
30. In LVDAC-EMS, open the Phasor Analyzer and display the inductor voltage (input E1) and current (input I1). Set the Reference Phasor parameter to the inductor voltage (input E1). Record the phase shift between the inductor voltage phasor and inductor current phasor below. Knowing that phasors rotate counterclockwise, indicate whether the phasor of the inductor current leads or lags the phasor of the inductor voltage .
a Notice how the length of the inductor voltage phasor and inductor current phasor corresponds to the voltage and current values indicated in the Metering window.
Phase shift °
31. Compare the phase shift you determined from the inductor voltage and current waveforms with the phase shift measured from the corresponding phasors of the inductor voltage and current. Are both values close to each other?
Yes No
32. In the Four-Quadrant Dynamometer/Power Supply window, disable the ac power source.
33. Close LVDAC-EMS, then turn off all the equipment. Disconnect all leads and return them to their storage location.
In this exercise, you learned what an inductor is. You also learned how to calculate the inductive reactance of an inductor from its inductance. You saw the relationship between the source frequency and the inductive reactance of an inductor. You verified the phase shift between the voltage and current related to an inductor.
CONCLUSION

Ex. 2-1 – Inductive Reactance Review Questions
© Festo Didactic 86358-00 59
1. An ac power circuit containing an inductor has a source voltage of 150 V and a source current of 0.5 A. Calculate the inductive reactance of the inductor.
2. Consider an ac power circuit having a source frequency and containing a single inductor. What happens to the inductive reactance of the inductor when the source frequency decreases to half the initial value?
3. How does inductive reactance vary with inductance ?
4. Consider an ac power circuit containing an ideal inductor. Determine the phase shift between the waveforms of the inductor voltage and current. Consider the inductor voltage as the reference.
5. How does the resistance of the wire coil in an actual inductor affect the phase shift between the inductor voltage and current?
REVIEW QUESTIONS

© Festo Didactic 86358-00 61
When you have completed this exercise, you will know what a capacitor is. You will be able to calculate the capacitive reactance of a capacitor from its capacitance. You will know the relationship between the source frequency and the capacitive reactance of a capacitor. You will also know the effect of introducing a capacitor in an ac circuit on the voltage and current waveforms.
The Discussion of this exercise covers the following points:
Capacitors and capacitive reactance Capacitive phase shift
Capacitors and capacitive reactance
A capacitor consists basically of two plates of a conductive material (generally a metal) separated by an insulating material. A pair of terminals on the capacitor provides access to the metal plates. When current flows through a capacitor, the capacitor stores energy in the electric field that builds up between the metal plates. As a result, capacitors oppose voltage changes.
The fundamental characteristic of any capacitor is the capacitance , which is expressed in farads (F). Capacitance is one of the main factors that determine the opposition to current flow of the capacitor, i.e., the capacitive reactance . Like resistance and inductive reactance, capacitive reactance is expressed in ohms ( ). The equation for capacitive reactance is given below:
(2-2)
where is the capacitive reactance of the capacitor, expressed in ohms ( ). is the frequency of the ac power source, expressed in hertz (Hz). is the capacitance of the capacitor, expressed in farads (F).
Equation (2-2) shows that the capacitive reactance of a capacitor is inversely proportional to the capacitance and the frequency of the ac power source.
Ohm’s law states that the current flowing in a capacitor is equal to . Therefore, the higher the capacitive reactance of the capacitor, the lower the capacitor current.
Capacitive reactance
Exercise 2-2
EXERCISE OBJECTIVE
DISCUSSION OUTLINE
DISCUSSION
Notice the differences: inductors store energy in a magnetic field and oppose current changes. Capacitors store energy in an electric field and oppose voltage changes.
In practice, the capaci-tance of a capacitor is generally expressed in F. 1 F = 0.000001 F.

Ex. 2-2 – Capacitive reactance Procedure Outline
62 © Festo Didactic 86358-00
Capacitive phase shift
Another fundamental characteristic of a capacitor is that the sine wave of the current flowing in the capacitor leads the sine wave of the voltage across the capacitor by 90°. Figure 2-5 shows the typical voltage and current waveforms related to a capacitor and the corresponding phasors.
Figure 2-5. Voltage and current waveforms related to a capacitor and corresponding phasors.
Contrary to inductors, the difference between ideal and actual capacitors is negligible. This is because the resistance of the plates and terminals composing a capacitor is very low and has little influence on the phase shift between the capacitor voltage and current waveforms. The actual phase shift between the capacitor voltage and current waveforms is thus very close to 90°.
The Procedure is divided into the following sections:
Setup and connections Capacitance and capacitive reactance Effect of the frequency on the capacitive reactance Measuring the capacitive phase shift
High voltages are present in this laboratory exercise. Do not make or modify anybanana jack connections with the power on unless otherwise specified.
Setup and connections
In this section, you will connect an ac circuit containing a capacitor and set up the equipment to measure the voltage across the capacitor and the current flowing through the capacitor.
1. Refer to the Equipment Utilization Chart in Appendix A to obtain the list of equipment required to perform this exercise.
Install the required equipment in the Workstation.
PROCEDURE OUTLINE
PROCEDURE
90°
Phase shift
Voltage Current
0

Ex. 2-2 – Capacitive reactance Procedure
© Festo Didactic 86358-00 63
2. Make sure that the main power switch on the Four-Quadrant Dynamometer/ Power Supply is set to the O (off) position, then connect its Power Input to an ac power outlet.
Connect the Power Input of the Data Acquisition and Control Interface to a 24 V ac power supply. Turn the 24 V ac power supply on.
3. Connect the USB port of the Data Acquisition and Control Interface to a USB port of the host computer.
Connect the USB port of the Four-Quadrant Dynamometer/Power Supply to a USB port of the host computer.
4. Turn the Four-Quadrant Dynamometer/Power Supply on, then set the Operating Mode switch to Power Supply.
5. Turn the host computer on, then start the LVDAC-EMS software.
In the LVDAC-EMS Start-Up window, make sure that the Data Acquisition and Control Interface and the Four-Quadrant Dynamometer/Power Supply are detected. Make sure that the Computer-Based Instrumentation function for the Data Acquisition and Control Interface is available. Select the network voltage and frequency that correspond to the voltage and frequency of your local ac power network, then click the OK button to close the LVDAC-EMS Start-Up window.
6. Set up the circuit shown in Figure 2-6.
Figure 2-6. AC circuit containing a capacitor.
The value of the capacitance to be used in the circuit of Figure 2-6 depends on the frequency of the ac power source, as indicated in Table 2-3.
100 V

Ex. 2-2 – Capacitive reactance Procedure
64 © Festo Didactic 86358-00
Table 2-3. First and second capacitance values for frequencies of 50 Hz and 60 Hz.
Power source frequency
(Hz)
Capacitance ( F)
First value Second value
50 10.6 5.3
60 8.8 4.4
Use inputs E1 and I1 of the Data Acquisition and Control Interface to measure the capacitor voltage and current , respectively.
7. In LVDAC-EMS, open the Four-Quadrant Dynamometer/Power Supply window, then make the following settings:
Set the Function parameter to AC Power Source.
Make sure that the Voltage Control parameter is set to Knob. This allows the ac power source to be controlled manually.
Set the No Load Voltage parameter to 100 V.
Set the Frequency parameter to the frequency of your local ac power network.
Leave the other parameters set as they are.
Make the necessary switch settings on the Capacitive Load (or on the Inductive and Capacitive Loads) in order to obtain the first capacitance value required (refer to Table 2-3).
Capacitance and capacitive reactance
In this section, you will calculate the capacitive reactance of the capacitor for the first value of capacitance in Table 2-3. You will measure the capacitor voltage and current . You will then determine the capacitive reactance of the capacitor from the measured capacitor voltage and current and compare the result to the calculated capacitive reactance . You will decrease the capacitance to half its initial value to determine the effect on the capacitive reactance of the capacitor.
8. Calculate the capacitive reactance of the capacitor for the first value of capacitance in Table 2-3 and record the result below.
Calculated capacitive reactance
9. In the Four-Quadrant Dynamometer/Power Supply window, enable the ac power source.

Ex. 2-2 – Capacitive reactance Procedure
© Festo Didactic 86358-00 65
10. In LVDAC-EMS, open the Metering window. Set meters E1 and I1 to measure the rms values of the capacitor voltage and current , respectively.
In the Four-Quadrant Dynamometer/Power Supply window, readjust the value of the No Load Voltage parameter so that the ac power source voltage (indicated by meter E1 in the Metering window) is equal to 100 V.
Record below the measured values of the capacitor voltage and current (meters E1 and I1, respectively).
Capacitor voltage V
Capacitor current A
11. Calculate the capacitive reactance of the capacitor using the capacitor voltage and current measured in the previous step.
Capacitive reactance
12. Compare the capacitive reactance obtained in the previous step with the calculated capacitive reactance recorded in step 8. Are the values close to each other?
Yes No
13. Set the capacitance of the capacitor to the second value indicated in Table 2-3 by making the necessary switch settings on the Capacitive Load.
In the Four-Quadrant Dynamometer/Power Supply window, readjust the value of the No Load Voltage parameter, if necessary, so that the ac power source voltage (indicated by meter E1 in the Metering window) is equal to 100 V.
14. Calculate the capacitive reactance of the capacitor for the second value of capacitance in Table 2-3 and record the result in the proper cell of the second column in Table 2-4 (see next procedure section).
15. In the Metering window, measure the rms values of the capacitor voltage and current . Record the values in the proper cells of the third and fourth columns in Table 2-4.
16. Calculate the capacitive reactance of the capacitor using the capacitor voltage and current measured in the previous step. Record the result in the proper cell of the fifth column in Table 2-4.

Ex. 2-2 – Capacitive reactance Procedure
66 © Festo Didactic 86358-00
17. Compare the capacitive reactance obtained in the previous step with the calculated capacitive reactance recorded in step 14. Are the values close to each other?
Yes No
18. Compare the capacitive reactance of the capacitor obtained with the first capacitance value to the capacitive reactance obtained with the second capacitance value. What happened to the capacitive reactance of the capacitor when you decreased the capacitance to half its initial value? Describe the relationship between the capacitance and the capacitive reactance of a capacitor.
Effect of the frequency on the capacitive reactance
In this section, you will calculate the capacitive reactance of the capacitor using the second value of capacitance in Table 2-3, for ac power source frequencies of 40 Hz and 70 Hz. For each of these two frequencies, you will measure the capacitor voltage and current , calculate from these measured values the capacitive reactance of the capacitor, and compare the results with the corresponding calculated capacitive reactance . Using the capacitive reactance values calculated from the measured capacitive voltages and currents, you will determine the relationship between the source frequency and the capacitive reactance .
19. Calculate the capacitive reactance of the capacitor (using the second value of capacitance indicated in Table 2-3) at frequencies of 40 and 70 Hz. Record the results in the proper cells of the second column in Table 2-4.
Table 2-4. Calculated capacitive reactance and measured voltage , current , and capacitive reactance for various frequencies.
Power source frequency
(Hz)
Calculated capacitive
reactance ( )
Capacitor voltage
(V)
Capacitor current
(A)
Capacitive reactance
( )
40
50 or 60
70
20. In the Four-Quadrant Dynamometer/Power Supply window, set the Frequency parameter to 40 Hz.

Ex. 2-2 – Capacitive reactance Procedure
© Festo Didactic 86358-00 67
21. In the Metering window, measure the rms values of the capacitor voltage and current and record the values in the proper cells of the third and fourth columns in Table 2-4.
22. Calculate the capacitive reactance of the capacitor from the capacitor voltage and current measured in the previous step. Record the result in the proper cell of the fifth column in Table 2-4.
23. In the Four-Quadrant Dynamometer/Power Supply window, set the Frequency parameter to 70 Hz, then repeat steps 21 and 22.
24. Determine the relationship between the capacitive reactance of a capacitor and the ac power source frequency using the values recorded in Table 2-4.
Measuring the capacitive phase shift
In this section, you will observe the waveforms of the capacitor voltage and current using the Oscilloscope to determine the phase shift between these parameters. Then, using the Phasor Analyzer, you will measure the phase shift between the capacitor voltage phasor and the capacitor current phasor, and compare the result to the phase shift you determined from the voltage and current waveforms.
25. In the Four-Quadrant Dynamometer/Power Supply window, set the Frequency parameter to the frequency of your local ac power network.
26. In LVDAC-EMS, open the Oscilloscope and display the capacitor voltage and current on channels 1 and 2, respectively. If necessary, set the time base to display at least two cycles of the waveforms. Select channel 1 (capacitor voltage) as the trigger source then set the trigger level to 0 V.
Notice that the amplitude of the capacitor voltage waveform is equivalent to the rms value of the capacitor voltage indicated in the Metering window. Also notice that the amplitude of the capacitor current waveform is equivalent to the rms value of the capacitor current indicated in the Metering window.
27. Does the sine wave of the capacitor current lead the sine wave of the capacitor voltage?
Yes No

Ex. 2-2 – Capacitive reactance Conclusion
68 © Festo Didactic 86358-00
28. Using the Oscilloscope, determine the period of the waveforms of the capacitor voltage and the capacitor current. Record the value below.
Period ms
29. Using the Oscilloscope, determine the time interval between the capacitor voltage and the capacitor current, then calculate the phase shift between the two waveforms.
Consider the capacitor voltage waveform as the reference.
Time interval ms
Phase shift °
30. In LVDAC-EMS, open the Phasor Analyzer and display the capacitor voltage (input E1) and current (input I1). Set the Reference Phasor parameter to the capacitor voltage (input E1). Record the phase shift between the capacitor voltage phasor and capacitor current phasor below. Indicate whether the phasor of the capacitor current leads or lags the phasor of the capacitor voltage
Phase shift °
31. Compare the phase shift you determined from the capacitor voltage and current waveforms with the phase shift measured from the corresponding phasors of the capacitor voltage and current. Are both values close to each other?
Yes No
32. In the Four-Quadrant Dynamometer/Power Supply window, disable the ac power source.
33. Close LVDAC-EMS, then turn off all the equipment. Disconnect all leads and return them to their storage location.
In this exercise, you learned what a capacitor is. You also learned how to calculate the capacitive reactance of a capacitor from its capacitance. You saw the relationship between the source frequency and the capacitive reactance of a capacitor. You verified the phase shift between the voltage and current related to a capacitor.
CONCLUSION

Ex. 2-2 – Capacitive reactance Review Questions
© Festo Didactic 86358-00 69
1. An ac power circuit containing a capacitor ( 12 F) has a source frequency of 60 Hz. Calculate the capacitive reactance of the capacitor.
2. Consider an ac power circuit having a source frequency and containing a single capacitor. What happens to the capacitive reactance of the capacitor when the source frequency decreases to half its initial value?
3. How does capacitive reactance vary with capacitance ?
4. Consider an ac power circuit containing a capacitor. Determine the phase shift between the waveforms of the capacitor voltage and current. Consider the capacitor voltage as the reference.
5. An ac power circuit containing a capacitor has a source voltage of 120 V, a source current of 1.5 A, and a power source frequency of 60 Hz. Calculate the capacitance of the capacitor.
REVIEW QUESTIONS


© Festo Didactic 86358-00 71
When you have completed this exercise, you will be familiar with the phasor diagrams related to a resistor, an inductor, and a capacitor. You will be able to calculate the equivalent reactance of reactive components in series ac circuits and represent the equivalent reactance on a phasor diagram. You will also know how to calculate the impedance of series and parallel ac circuits and represent the equivalent impedance on a phasor diagram.
The Discussion of this exercise covers the following points:
Phasor diagrams related to resistors, inductors, and capacitors Equivalent reactance of series-connected reactive components Impedance of resistors, inductors, and capacitors connected in series Impedance of resistors, inductors, and capacitors connected in parallel
Phasor diagrams related to resistors, inductors, and capacitors
Each parameter in an ac power circuit (e.g., voltage, current, power, etc.) can be represented as a phasor, i.e., a vector having its beginning at the origin (0, 0) of a cartesian plane. The length of the phasor is determined by the magnitude of the parameter that the phasor represents, while the angular position (direction) of the phasor is determined by the phase angle of the parameter. The horizontal axis of the plane is called the real-number axis, while the vertical axis of the plane is called the imaginary-number axis. The phasor diagrams related to basic components, i.e., the resistor, inductor, and capacitor, are introduced below.
Phasor diagram related to a resistor
The current flowing in a resistor is in phase with the voltage across the resistor (see Figure 1-17 in Exercise 1-3). Consequently, the resistance of a resistor ( ) can be represented as a phasor that is in phase with the voltage and current phasors related to the resistor, as shown in Figure 2-7.
a Vectorial calculations related to phasors are explained in more detail in Appendix D.
Impedance
Exercise 2-3
EXERCISE OBJECTIVE
DISCUSSION OUTLINE
DISCUSSION

Ex. 2-3 – Impedance Discussion
72 © Festo Didactic 86358-00
Figure 2-7. Phasor diagram of the voltage , current , and resistance related to a resistor.
Phasor diagram related to an inductor
The current flowing in an ideal inductor lags the voltage across the inductor by 90° (as seen in Exercise 2-1). The inductive reactance of an inductor can be determined using vectorial calculation to solve the equation . The result of this calculation (i.e., the inductive reactance ) is a phasor that leads the phasor of the inductor voltage by 90° and that is 180° out of phase with respect to the phasor of the inductor current , as shown in Figure 2-8.
Figure 2-8. Phasor diagram of the voltage , current , and inductive reactance related to an inductor.

Ex. 2-3 – Impedance Discussion
© Festo Didactic 86358-00 73
Phasor diagram related to a capacitor
The current flowing in a capacitor leads the voltage across the capacitor by 90° (as seen in Exercise 2-2). The capacitive reactance of a capacitor can be determined using vectorial calculation to solve the equation . The result of this calculation (i.e., the capacitive reactance ) is a phasor that lags the phasor of the capacitor voltage by 90° and that is 180° out of phase with respect to the phasor of the capacitor current , as shown in Figure 2-9.
Figure 2-9. Phasor diagram of the voltage , current , and capacitive reactance related to a capacitor.
Equivalent reactance of series-connected reactive components
The main difference between the phasor diagram related to an inductor and the phasor diagram related to a capacitor is the direction of the reactance phasor. Inductive reactance and capacitive reactance are both on the imaginary-number axis (vertical axis of diagram) but of opposite polarity. Consequently, when an inductor is in series with a capacitor in an ac power circuit, the inductive and capacitive reactance values cancel each other. The equivalent reactance of an inductor and a capacitor in series is thus determined by the following equation:
(2-3)
where is the equivalent reactance of the inductor and the capacitor,
expressed in ohms ( ). is the inductive reactance of the inductor, expressed in
ohms ( ). is the capacitive reactance of the capacitor, expressed in
ohms ( ).

Ex. 2-3 – Impedance Discussion
74 © Festo Didactic 86358-00
Equation (2-3) shows that, in a series ac circuit containing an inductor and a capacitor, if the inductive reactance of the inductor has a higher value than the capacitive reactance of the capacitor, then the equivalent reactance of the inductor and capacitor is positive and said to be inductive. Consider, for example, a series ac circuit containing an inductor ( 300 ) and a capacitor ( 100 ). The equivalent reactance of the inductor and capacitor is +200 (300 – 100 ), or 200 inductive, which means that the inductor and capacitor connected in series are equivalent to a single inductor having an inductive reactance of 200 . The sine wave of the current flowing through the reactive components thus lags the sine wave of the voltage across the reactive components by 90°. Figure 2-10 shows the phasor diagram related to a series ac circuit containing an inductor and a capacitor, and having an inductive equivalent reactance.
Figure 2-10. Phasor diagram related to a series ac circuit containing an inductor and a capacitor, and having an inductive equivalent reactance.
Conversely, Equation (2-3) shows that, in a series ac circuit containing an inductor and a capacitor, if the capacitive reactance of the capacitor is higher than the inductive reactance of the inductor, then the equivalent reactance of the inductor and capacitor is negative and is said to be capacitive. Consider, for example, a series ac circuit containing an inductor ( 150 ) and a capacitor ( 250 ). The equivalent reactance of the inductor and capacitor is -100 (150 – 250 ), or 100 capacitive, which means that the inductor and capacitor connected in series are equivalent to a single capacitor having a capacitive reactance of 100 . The sine wave of the current flowing through the reactive components thus leads the sine wave of the voltage across the reactive components by 90°. Figure 2-11 shows the phasor diagram related to a series ac circuit containing an inductor and a capacitor, and having a capacitive equivalent reactance.

Ex. 2-3 – Impedance Discussion
© Festo Didactic 86358-00 75
Figure 2-11. Phasor diagram related to a series ac circuit containing an inductor and a capacitor, and having a capacitive equivalent reactance.
Impedance of resistors, inductors, and capacitors connected in series
When a resistor and a reactive component (inductor or capacitor) are connected in series, the total opposition to current flow in the circuit, which is known as the impedance , is equal to the vectorial sum of the resistance of the resistor and the reactance of the reactive component. Figure 2-12 shows the phasor diagram related to the impedance of a resistor and an inductor connected in series.
Figure 2-12. Phasor diagram showing the impedance of a resistor and an inductor connected in series.
Figure 2-12 clearly shows that the impedance results from the addition of the phasor of resistance to the phasor of inductive reactance . In fact, the phasor of impedance is the diagonal of the rectangle formed by the phasors of the resistance and inductive reactance . Therefore, following the Pythagorean Theorem, the impedance of a resistor in series with a reactive component can be calculated using the following equation:

Ex. 2-3 – Impedance Discussion
76 © Festo Didactic 86358-00
(2-4)
where is the impedance of the resistor and reactive component connected
in series, expressed in ohms ( ). is the resistance of the resistor, expressed in ohms ( ). is the reactance of the reactive component, expressed in ohms ( ).
Equation (2-4) is valid for inductors and capacitors. Figure 2-13 shows an example of the impedance resulting from a resistor and a capacitor connected in series.
Figure 2-13. Phasor diagram showing the impedance of a resistor and a capacitor connected in series.
When more than one reactive component is connected in series with a resistor, it is necessary to calculate the equivalent circuit reactance before calculating the impedance using Equation (2-4). Consider for example the ac circuit shown in Figure 2-14a. The equivalent reactance of the inductor and the capacitor is -100 (100 - 200 ). The impedance is thus equal to 316 ( ). Figure 2-14b shows the corresponding phasor diagram.
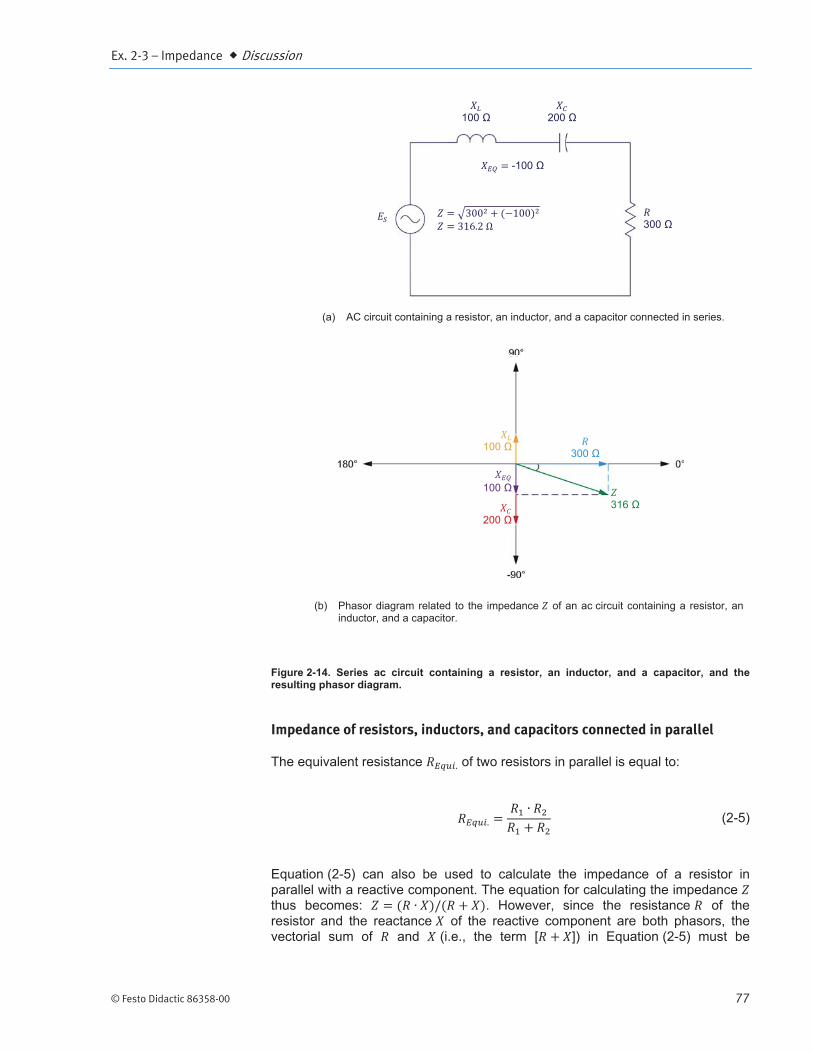
Ex. 2-3 – Impedance Discussion
© Festo Didactic 86358-00 77
Figure 2-14. Series ac circuit containing a resistor, an inductor, and a capacitor, and the resulting phasor diagram.
Impedance of resistors, inductors, and capacitors connected in parallel
The equivalent resistance of two resistors in parallel is equal to:
(2-5)
Equation (2-5) can also be used to calculate the impedance of a resistor in parallel with a reactive component. The equation for calculating the impedance thus becomes: . However, since the resistance of the resistor and the reactance of the reactive component are both phasors, the vectorial sum of and (i.e., the term [ ]) in Equation (2-5) must be
(b) Phasor diagram related to the impedance of an ac circuit containing a resistor, an inductor, and a capacitor.
(a) AC circuit containing a resistor, an inductor, and a capacitor connected in series.
100
200
-100
300
100
100
200
316
300

Ex. 2-3 – Impedance Procedure Outline
78 © Festo Didactic 86358-00
replaced by the term . The resulting equation for calculating the impedance of resistive and reactive components connected in parallel is given below:
(2-6)
where is the impedance of the resistor and reactive component connected
in parallel, expressed in ohms ( ).
For example, consider the ac circuit containing a resistor and an inductor shown in Figure 2-15. The impedance of this circuit is equal to:
Figure 2-15. Parallel ac circuit containing a resistor and an inductor.
The Procedure is divided into the following sections:
Setup and connections Equivalent reactance of a series LC circuit Impedance of a series RL circuit Impedance of a series RC circuit Impedance of a series RLC circuit Impedance of a parallel RL circuit Impedance of a parallel RC circuit
High voltages are present in this laboratory exercise. Do not make or modify any banana jack connections with the power on unless otherwise specified.
PROCEDURE OUTLINE
PROCEDURE
250
400

Ex. 2-3 – Impedance Procedure
© Festo Didactic 86358-00 79
Setup and connections
In this section, you will connect a series ac circuit containing an inductor and a capacitor and set up the equipment to measure the voltage and current related to these components.
1. Refer to the Equipment Utilization Chart in Appendix A to obtain the list of equipment required to perform this exercise.
Install the required equipment in the Workstation.
2. Make sure that the main power switch on the Four-Quadrant Dynamometer/ Power Supply is set to the O (off) position, then connect its Power Input to an ac power outlet.
Connect the Power Input of the Data Acquisition and Control Interface to a 24 V ac power supply. Turn the 24 V ac power supply on.
3. Connect the USB port of the Data Acquisition and Control Interface to a USB port of the host computer.
Connect the USB port of the Four-Quadrant Dynamometer/Power Supply to a USB port of the host computer.
4. Turn the Four-Quadrant Dynamometer/Power Supply on, then set the Operating Mode switch to Power Supply.
5. Turn the host computer on, then start the LVDAC-EMS software.
In the LVDAC-EMS Start-Up window, make sure that the Data Acquisition and Control Interface and the Four-Quadrant Dynamometer/Power Supply are detected. Make sure that the Computer-Based Instrumentation function for the Data Acquisition and Control Interface is available. Select the network voltage and frequency that correspond to the voltage and frequency of your local ac power network, then click the OK button to close the LVDAC-EMS Start-Up window.

Ex. 2-3 – Impedance Procedure
80 © Festo Didactic 86358-00
6. Set up the circuit shown in Figure 2-16.
Figure 2-16. Series ac circuit containing an inductor and a capacitor.
Make the necessary switch settings on the Inductive Load and Capacitive Load (or on the Inductive and Capacitive Loads) in order to obtain the inductive and capacitive reactance values required. The voltage is the voltage across the inductor and capacitor and the current is the current flowing through the inductor and capacitor.
Use inputs E1 and I1 of the Data Acquisition and Control Interface to measure the voltage and current , respectively.
7. In LVDAC-EMS, open the Four-Quadrant Dynamometer/Power Supply window, then make the following settings:
Set the Function parameter to AC Power Source.
Make sure that the Voltage Control parameter is set to Knob. This allows the ac power source to be controlled manually.
Set the No Load Voltage parameter to 100 V.
Set the Frequency parameter to the frequency of your local ac power network.
Leave the other parameters set as they are.
100 V
600
100

Ex. 2-3 – Impedance Procedure
© Festo Didactic 86358-00 81
Equivalent reactance of a series LC circuit
In this section, you will calculate the equivalent reactance of the reactive components in the circuit of Figure 2-16. You will measure the voltage and current and calculate the equivalent reactance from these values. Using the Oscilloscope, you will determine the phase relationship between the voltage and current and whether the equivalent reactance is inductive or capacitive. You will then interchange the inductive and capacitive reactance values in the circuit and repeat the previous manipulations. You will determine the relationship between the polarity of the equivalent reactance of the reactive components and the nature of the equivalent reactance (inductive or capacitive).
8. Calculate the equivalent reactance of the reactive components.
Equivalent reactance
9. In the Four-Quadrant Dynamometer/Power Supply window, enable the ac power source.
10. In LVDAC-EMS, open the Metering window. Set meters E1 and I1 to measure the rms values of the voltage and current , respectively.
In the Four-Quadrant Dynamometer/Power Supply window, readjust the value of the No Load Voltage parameter so that the ac power source voltage (indicated by meter E1 in the Metering window) is equal to 100 V.
Record below the rms values of the voltage and current (meters E1 and I1, respectively).
Voltage V Current A
11. Calculate the equivalent reactance of the inductor and capacitor using the voltage and current measured in the previous step.
Equivalent reactance
12. Compare the equivalent reactance obtained in the previous step with the calculated equivalent reactance recorded in step 8. Are the values equal?
Yes No
13. In LVDAC-EMS, open the Oscilloscope and display the voltage and current on channels 1 and 2, respectively. Set the time base to display at least two cycles of the waveforms. Select channel 1 (voltage ) as the trigger source then set the trigger level to 0 V.

Ex. 2-3 – Impedance Procedure
82 © Festo Didactic 86358-00
14. Using the Oscilloscope, determine the phase relationship between the voltage and current . Is the equivalent reactance of the inductor and capacitor inductive or capacitive?
15. In the Four-Quadrant Dynamometer/Power Supply window, disable the ac power source.
16. Make the necessary switch settings on the Inductive Load and Capacitive Load (or on the Inductive and Capacitive Loads) in order to obtain the values of inductive reactance and capacitive reactance indicated in the circuit of Figure 2-17.
Figure 2-17. Series ac circuit containing an inductor and a capacitor.
17. Calculate the equivalent reactance of the inductor and capacitor.
Equivalent reactance
18. In the Four-Quadrant Dynamometer/Power Supply window, enable the ac power source.
In the Four-Quadrant Dynamometer/Power Supply window, readjust the value of the No Load Voltage parameter so that the ac power source voltage (indicated by meter E1 in the Metering window) is equal to 100 V.
19. In the Metering window, measure the rms values of the voltage and current , and record the values below.
Voltage V Current A
100 V
100
600

Ex. 2-3 – Impedance Procedure
© Festo Didactic 86358-00 83
20. Calculate the equivalent reactance of the inductor and capacitor using the voltage and current measured in the previous step.
Equivalent reactance
21. Compare the equivalent reactance obtained in the previous step with the calculated equivalent reactance recorded in step 17. Are the values virtually equal?
Yes No
22. Using the Oscilloscope, determine the phase relationship between the voltage and current . Is the equivalent reactance of the inductor and capacitor inductive or capacitive?
23. Do your observations in this section confirm the relationship between the polarity of the calculated equivalent reactance and the nature of the equivalent reactance (inductive or capacitive) observed? Explain.
Impedance of a series RL circuit
In this section, you will set up a series ac circuit containing a resistor and an inductor. You will calculate the impedance of the resistor and inductor. You will then measure the voltage and current related to these components. You will calculate the impedance of the resistor and inductor from the measured voltage and current then compare the result with the calculated impedance .
24. In the Four-Quadrant Dynamometer/Power Supply window, disable the ac power source.

Ex. 2-3 – Impedance Procedure
84 © Festo Didactic 86358-00
25. Set up the circuit shown in Figure 2-18.
Figure 2-18. Series ac circuit containing a resistor and an inductor.
Make the necessary switch settings on the Resistive Load and Inductive Load (or on the Inductive and Capacitive Loads) in order to obtain the resistance and inductive reactance values required.
Use inputs E1 and I1 of the Data Acquisition and Control Interface to measure the voltage and current , respectively.
26. Calculate the impedance of the resistor and inductor.
Impedance
27. In the Four-Quadrant Dynamometer/Power Supply window, enable the ac power source.
In the Four-Quadrant Dynamometer/Power Supply window, readjust the value of the No Load Voltage parameter so that the ac power source voltage (indicated by meter E1 in the Metering window) is equal to 100 V.
28. In the Metering window, measure the rms values of the voltage and current , and record the values below.
Voltage V Current A
29. Calculate the impedance of the resistor and inductor using the voltage and current measured in the previous step.
Impedance
30. Compare the impedance obtained in the previous step with the calculated impedance recorded in step 26. Are both values close to each other?
Yes No
100 V
171
300

Ex. 2-3 – Impedance Procedure
© Festo Didactic 86358-00 85
Impedance of a series RC circuit
In this section, you will set up a series ac circuit containing a resistor and a capacitor. You will calculate the impedance of the resistor and capacitor. You will then measure the voltage and current related to these components. You will calculate the impedance of the resistor and capacitor from the measured voltage and current then compare the result with the calculated impedance .
31. In the Four-Quadrant Dynamometer/Power Supply window, disable the ac power source.
32. Set up the circuit shown in Figure 2-19.
Make the necessary switch settings on the Resistive Load and Capacitive Load (or on the Inductive and Capacitive Loads) in order to obtain the resistance and capacitive reactance values required.
Use inputs E1 and I1 of the Data Acquisition and Control Interface to measure the voltage and current , respectively.
Figure 2-19. Series ac circuit containing a resistor and a capacitor.
33. Calculate the impedance of the resistor and capacitor.
Impedance
34. In the Four-Quadrant Dynamometer/Power Supply window, enable the ac power source.
In the Four-Quadrant Dynamometer/Power Supply window, readjust the value of the No Load Voltage parameter so that the ac power source voltage (indicated by meter E1 in the Metering window) is equal to 100 V.
100 V
200
100

Ex. 2-3 – Impedance Procedure
86 © Festo Didactic 86358-00
35. In the Metering window, measure the rms values of the voltage and current , and record the values below.
Voltage V Current A
36. Calculate the impedance of the resistor and capacitor using the voltage and current measured in the previous step.
Impedance
37. Compare the impedance obtained in the previous step with the calculated impedance recorded in step 33. Are both values close to each other?
Yes No
Impedance of a series RLC circuit
In this section, you will set up a series ac circuit containing a resistor, an inductor, and a capacitor. You will calculate the impedance of the resistor, inductor, and capacitor. You will then measure the voltage and current related to these components. You will calculate the impedance of the resistor, inductor, and capacitor from the measured voltage and current then compare the result with the calculated impedance .
38. In the Four-Quadrant Dynamometer/Power Supply window, disable the ac power source.
39. Set up the circuit shown in Figure 2-20.
Figure 2-20. Series ac circuit containing a resistor, an inductor, and a capacitor.
100 V
171
200
300

Ex. 2-3 – Impedance Procedure
© Festo Didactic 86358-00 87
Make the necessary switch settings on the Resistive Load, and on the Inductive Load and Capacitive Load (or on the Inductive and Capacitive Loads) in order to obtain the resistance, inductive reactance, and capacitive reactance values required.
Use inputs E1 and I1 of the Data Acquisition and Control Interface to measure the voltage and current , respectively.
40. Calculate the impedance of the resistor, inductor, and capacitor.
Impedance
41. In the Four-Quadrant Dynamometer/Power Supply window, enable the ac power source.
In the Four-Quadrant Dynamometer/Power Supply window, readjust the value of the No Load Voltage parameter so that the ac power source voltage (indicated by meter E1 in the Metering window) is equal to 100 V.
42. In the Metering window, measure the rms values of the voltage and current , and record the values below.
Voltage V Current A
43. Calculate the impedance of the resistor, inductor, and capacitor using the voltage and current measured in the previous step.
Impedance
44. Compare the impedance obtained in the previous step with the calculated impedance recorded in step 40. Are both values close to each other?
Yes No
Impedance of a parallel RL circuit
In this section, you will set up a parallel ac circuit containing a resistor and an inductor. You will calculate the impedance of the resistor and inductor. You will then measure the voltage and current related to these components. You will calculate the impedance of the resistor and inductor from the measured voltage and current then compare the result with the calculated impedance .
45. In the Four-Quadrant Dynamometer/Power Supply window, disable the ac power source.

Ex. 2-3 – Impedance Procedure
88 © Festo Didactic 86358-00
46. Set up the circuit shown in Figure 2-21.
Figure 2-21. Parallel ac circuit containing a resistor and an inductor.
Make the necessary switch settings on the Resistive Load and Inductive Load (or on the Inductive and Capacitive Loads) in order to obtain the resistance and inductive reactance values required.
Use inputs E1 and I1 of the Data Acquisition and Control Interface to measure the voltage and current , respectively.
47. Calculate the impedance of the resistor and inductor.
Impedance
48. In the Four-Quadrant Dynamometer/Power Supply window, enable the ac power source.
In the Four-Quadrant Dynamometer/Power Supply window, readjust the value of the No Load Voltage parameter so that the ac power source voltage (indicated by meter E1 in the Metering window) is equal to 100 V.
49. In the Metering window, measure the rms values of the voltage and current , and record the values below.
Voltage V Current A
50. Calculate the impedance of the resistor and inductor using the voltage and current measured in the previous step.
Impedance
100 V
171
300

Ex. 2-3 – Impedance Procedure
© Festo Didactic 86358-00 89
51. Compare the impedance obtained in the previous step to the calculated impedance recorded in step 47. Are both values close to each other?
Yes No
Impedance of a parallel RC circuit
In this section, you will set up a parallel ac circuit containing a resistor and a capacitor. You will calculate the impedance of the resistor and capacitor. You will then measure the voltage and current related to these components. You will calculate the impedance of the resistor and capacitor from the measured voltage and current then compare the result with the calculated impedance .
52. In the Four-Quadrant Dynamometer/Power Supply window, disable the ac power source.
53. Set up the circuit shown in Figure 2-22.
Figure 2-22. Parallel ac circuit containing a resistor and a capacitor.
Make the necessary switch settings on the Resistive Load and Capacitive Load (or on the Inductive and Capacitive Loads) in order to obtain the resistance and capacitive reactance values required.
Use inputs E1 and I1 of the Data Acquisition and Control Interface to measure the voltage and current , respectively.
54. Calculate the impedance of the resistor and capacitor.
Impedance
100 V
171
200

Ex. 2-3 – Impedance Conclusion
90 © Festo Didactic 86358-00
55. In the Four-Quadrant Dynamometer/Power Supply window, enable the ac power source.
In the Four-Quadrant Dynamometer/Power Supply window, readjust the value of the No Load Voltage parameter so that the ac power source voltage (indicated by meter E1 in the Metering window) is equal to 100 V.
56. In the Metering window, measure the rms values of the voltage and current , and record the values below.
Voltage V Current A
57. Calculate the impedance of the resistor and capacitor using the voltage and current measured in the previous step.
Impedance
58. Compare the impedance obtained in the previous step to the calculated impedance recorded in step 54. Are both values close to each other?
Yes No
59. In the Four-Quadrant Dynamometer/Power Supply window, disable the ac power source.
60. Close LVDAC-EMS, then turn off all the equipment. Disconnect all leads and return them to their storage location.
In this exercise, you became familiar with the phasor diagrams related to a resistor, an inductor, and a capacitor. You learned how to calculate the equivalent reactance of reactive components in series ac circuits and represent the equivalent reactance on a phasor diagram. You also learned how to calculate the impedance of series and parallel ac circuits and represent the impedance on a phasor diagram.
1. Define impedance.
CONCLUSION
REVIEW QUESTIONS

Ex. 2-3 – Impedance Review Questions
© Festo Didactic 86358-00 91
2. Consider a series ac circuit containing an inductor and a capacitor. Knowing that the equivalent reactance of the reactive components has a negative value, determine the phase relationship between the source voltage and current. Is the equivalent reactance inductive or capacitive?
3. Determine the total impedance of a series ac circuit containing a resistor ( 250 ), an inductor ( 150 ), and a capacitor ( 200 ).
4. Determine the total impedance of an ac circuit containing a resistor ( 350 ) connected in parallel with two reactive components connected in series: an inductor ( 300 ) and a capacitor ( 150 ).
5. In an ac circuit containing a reactive component, what is the phase relationship between the phasor of the reactance and the phasor of the source current ?


Unit 2 – Resistance, Reactance, and Impedance Unit Test
© Festo Didactic 86358-00 93
Unit Test
1. In an ac circuit containing an ideal inductor, the inductor current:
a. lags the inductor voltage by 90°. b. leads the inductor voltage by 180°. c. lags the inductor voltage by 180°. d. leads the inductor voltage by 90°.
2. Given a parallel ac circuit containing a resistor ( 200 ) and an inductor ( 350 ), calculate the impedance of the circuit.
a. 127 b. 403 c. 265 d. 174
3. The inductance of an inductor is directly proportional to the:
a. ac power source frequency and inductance . b. current and voltage . c. impedance of the circuit and inductance . d. ac power source frequency and voltage .
4. Which equation determines the reactance of a capacitor?
a. b. c. d.
5. In an ac circuit containing a capacitor, the capacitor current:
a. lags the capacitor voltage by 90°. b. leads the capacitor voltage by 180°. c. lags the capacitor voltage by 180°. d. leads the capacitor voltage by 90°.
6. The impedance of an ac circuit determines:
a. The equivalent reactance of the circuit. b. The total opposition to voltage changes of the circuit. c. The total opposition to current flow of the circuit. d. All of the above.

Unit 2 – Resistance, Reactance, and Impedance Unit Test
94 © Festo Didactic 86358-00
7. Given a series ac circuit containing an inductor ( 250 ) and a capacitor ( 150 ), calculate the equivalent reactance of the circuit.
a. -100 b. 400 c. 100 d. -400
8. In an ac circuit containing an ideal inductor, the phasor of the inductor current:
a. leads the phasor of inductive reactance by 90°. b. lags the phasor of inductive reactance by 180°. c. lags the phasor of inductive reactance by 90°. d. leads the phasor of inductive reactance by 180°.
9. Given a series ac circuit containing a resistor ( 400 ) and a capacitor ( 250 ), calculate the impedance of the circuit.
a. 150 b. 316 c. 650 d. 472
10. Which equation determines the reactance of an inductor?
a. b. c. d.

© Festo Didactic 86358-00 95
When you have completed this unit, you will know what active, reactive, and apparent power are and how to calculate their value. You will be familiar with phasor diagrams related to the active, reactive, and apparent power in a circuit. You will be able to calculate the total reactive power in a circuit containing more than one reactive element. You will know what the power factor of a circuit is and how to calculate its value. You will also be able to draw the power triangle of a circuit.
The Discussion of Fundamentals covers the following points:
Introduction to active, reactive, and apparent power
Introduction to active, reactive, and apparent power
In Exercise 1-3, you saw that the voltage and current waveforms related to a resistor are in phase. You also saw that the waveform of the power dissipated in a resistor has a frequency that is twice the source frequency and is always positive, the mean value of this power waveform corresponding to the amount of power dissipated in the resistor. You will see later in this unit that the power dissipated in resistors is referred to as active power.
In Unit 2, you saw that there is a phase shift of 90° between the voltage and current waveforms related to a reactive component. You will see later in this unit that the waveform of the power related to a reactive component also has a frequency of twice the source frequency but has a null average value, meaning that power is not dissipated in the reactive component but simply exchanged with the source. You will see that the power related to reactive components is referred to as reactive power. Finally, you will learn that vectorial summation of the active power and reactive power in a circuit allows the apparent power in the circuit to be determined. You will see in Unit 4 that calculating the active, reactive, and apparent power in a circuit (i.e., determining the power triangle of the circuit) is often necessary to solve complex ac circuits.
Power in AC Circuits
Unit 3
UNIT OBJECTIVE
DISCUSSION OUTLINE
DISCUSSION OF FUNDAMENTALS


© Festo Didactic 86358-00 97
When you have completed this exercise, you will know what active power and reactive power are. You will also know how to calculate active power and reactive power in the components of an ac circuit.
The Discussion of this exercise covers the following points:
Active power in a resistor Reactive power in an inductor Reactive power in a capacitor Power Meter
Active power in a resistor
Figure 3-1 displays the voltage, current, instantaneous power, and average power related to a resistor.
Figure 3-1. Voltage, current, instantaneous power, and average power related to a resistor.
Figure 3-1 shows that the power waveform related to a resistor never changes polarity, i.e., it is always positive. This indicates that the resistor receives power from the ac power source and uses all this power to produce heat. In other words, the resistor receives power from the source without returning any power to the source.
The power used by a resistor to produce heat is referred to as the active power (expressed in watts [W]) because it is used to perform work (the production of heat is a form of work). The amount of active power dissipated in
Active and Reactive Power
Exercise 3-1
EXERCISE OBJECTIVE
DISCUSSION OUTLINE
DISCUSSION
Instantaneouspower
Voltage Current
Average power oractive power
Cur
rent
(A)
Vol
tage
(V)
Pow
er (W
)

Ex. 3-1 – Active and Reactive Power Discussion
98 © Festo Didactic 86358-00
a resistor is equal to the average value of the power waveform and can be determined from the rms values of the voltage across the resistor and the current flowing in the resistor. The equation for calculating the active power dissipated in a resistor is given below:
(3-1)
where is the active power dissipated in the resistor, expressed in
watts (W). is the rms value of the voltage across the resistor, expressed in
volts (V). is the rms value of the current flowing in the resistor, expressed in
amperes (A).
Reactive power in an inductor
Figure 3-2 displays the voltage, current, instantaneous power, and average power related to an inductor.
Figure 3-2. Voltage, current, instantaneous power, and average power related to an inductor.
Figure 3-2 shows that the power waveform related to an inductor is a sine wave having twice the frequency of the ac power source, which is similar to the power waveform related to a resistor. However, the polarity of the power waveform related to an inductor alternates, i.e., it is positive half of the time and negative the other half of the time. When the polarity of the power waveform is positive, the source delivers power to the inductor. Conversely, when the polarity of the power waveform is negative, it is the inductor that delivers power to the source, i.e., the inductor returns the received power to the source. Therefore, no power is dissipated in an ideal inductor and no work is done. In other words, the active power in an ideal inductor is null. This is confirmed by the fact that the average value of the power waveform related to an inductor (see Figure 3-2) is equal to 0.
Instantaneouspower Voltage
Current
Average power or active power
Cur
rent
(A)
Vol
tage
(V)
Pow
er (W
)

Ex. 3-1 – Active and Reactive Power Discussion
© Festo Didactic 86358-00 99
The power in an inductor is referred to as the reactive power (expressed in reactive volt-amperes [var]) because this power is not used to perform work. Reactive power simply indicates that power is exchanged between the source and the inductor.
Like the active power dissipated in a resistor, the reactive power in an inductor can be determined from the rms values of the voltage across the inductor and the current flowing in the inductor. The equation for calculating the reactive power in an inductor is given below:
(3-2)
where is the reactive power in the inductor, expressed in reactive
volt-amperes (var). is the rms value of the voltage across the inductor, expressed in
volts (V). is the rms value of the current flowing in the inductor, expressed in
amperes (A).
This relationship is true only for ideal inductors. In actual inductors, a small amount of active power is dissipated in the wire of the inductor coil and thus, not returned to the source. Because of this, the measured amount of reactive power in an actual inductor is slightly lower than the value of the reactive power in the inductor calculated using Equation (3-2).
Reactive power in a capacitor
Figure 3-3 displays the voltage, current, instantaneous power, and average power related to a capacitor.
Figure 3-3. Voltage, current, instantaneous power, and average power related to a capacitor.
Instantaneouspower
Voltage
Current
Average power or active power
Cur
rent
(A)
Vol
tage
(V)
Pow
er (W
)

Ex. 3-1 – Active and Reactive Power Discussion
100 © Festo Didactic 86358-00
Figure 3-3 shows that the power waveform related to a capacitor is very similar to the power waveform related to an inductor. Therefore, all observations about the power in an inductor also apply to the power in a capacitor. The equation for calculating the reactive power in a capacitor is given below:
(3-3)
where is the reactive power in the capacitor, expressed in reactive
volt-amperes (var). is the rms value of the voltage across the capacitor, expressed in
volts (V). is the rms value of the current flowing in the capacitor, expressed in
amperes (A).
Power Meter
Commercial instruments are available to measure active power and reactive power directly. These instruments are referred to as power meters. A selector on the power meter usually allows the unit to measure active or reactive power. A power meter determines power by measuring the voltage across a component and the current flowing in the component. All power meters thus generally have at least a voltage input and a current input to measure the circuit voltage and current. Figure 3-4 shows the typical connections of a power meter.
Figure 3-4. AC circuit diagram showing the connections of a power meter.
Voltage input
Current input
Power Meter
AC powersource

Ex. 3-1 – Active and Reactive Power Procedure Outline
© Festo Didactic 86358-00 101
The Procedure is divided into the following sections:
Setup and connections Active power in a resistor Reactive power in an inductor Reactive power in a capacitor
High voltages are present in this laboratory exercise. Do not make or modify anybanana jack connections with the power on unless otherwise specified.
Setup and connections
In this section, you will connect an ac circuit containing a resistor and set up the equipment to measure the voltage across the resistor and the current flowing in the resistor.
1. Refer to the Equipment Utilization Chart in Appendix A to obtain the list of equipment required to perform this exercise.
Install the required equipment in the Workstation.
2. Make sure that the main power switch on the Four-Quadrant Dynamometer/ Power Supply is set to the O (off) position, then connect its Power Input to an ac power outlet.
Connect the Power Input of the Data Acquisition and Control Interface to a 24 V ac power supply. Turn the 24 V ac power supply on.
3. Connect the USB port of the Data Acquisition and Control Interface to a USB port of the host computer.
Connect the USB port of the Four-Quadrant Dynamometer/Power Supply to a USB port of the host computer.
4. Turn the Four-Quadrant Dynamometer/Power Supply on, then set the Operating Mode switch to Power Supply.
PROCEDURE OUTLINE
PROCEDURE

Ex. 3-1 – Active and Reactive Power Procedure
102 © Festo Didactic 86358-00
5. Turn the host computer on, then start the LVDAC-EMS software.
In the LVDAC-EMS Start-Up window, make sure that the Data Acquisition and Control Interface and the Four-Quadrant Dynamometer/Power Supply are detected. Make sure that the Computer-Based Instrumentation function for the Data Acquisition and Control Interface is available. Select the network voltage and frequency that correspond to the voltage and frequency of your local ac power network, then click the OK button to close the LVDAC-EMS Start-Up window.
6. Set up the circuit shown in Figure 3-5.
Figure 3-5. AC circuit containing a resistor and set up for power measurements.
Make the necessary switch settings on the Resistive Load in order to obtain the resistance value required.
Use inputs E1 and I1 of the Data Acquisition and Control Interface to measure the resistor voltage and current , respectively.
7. In LVDAC-EMS, open the Four-Quadrant Dynamometer/Power Supply window, then make the following settings:
Set the Function parameter to AC Power Source.
Make sure that the Voltage Control parameter is set to Knob. This allows the ac power source to be controlled manually.
Set the No Load Voltage parameter to 100 V.
Set the Frequency parameter to the frequency of your local ac power network.
Leave the other parameters set as they are.
100 V
200

Ex. 3-1 – Active and Reactive Power Procedure
© Festo Didactic 86358-00 103
Active power in a resistor
In this section, you will calculate the active power dissipated in the resistor. Using the Oscilloscope, you will observe the waveforms of the resistor voltage, current, and power. You will record the average value of the power waveform and compare it with the calculated active power . You will also determine the active power in the resistor from the rms values of the resistor voltage and current measured on the Oscilloscope and in the Metering window, and compare the result with the calculated active power . Finally, you will measure the reactive power in the resistor to verify that there is virtually no reactive power in a resistor.
8. Calculate the active power dissipated in the resistor of the circuit shown in Figure 3-5.
Active power W
9. In LVDAC-EMS, open the Metering window. Set meters E1 and I1 to measure the rms values of the resistor voltage (E1) and current (I1), respectively.
In the Four-Quadrant Dynamometer/Power Supply window, enable the ac power source. Readjust the value of the No Load Voltage parameter so that the ac power source voltage (indicated by meter E1 in the Metering window) is equal to 100 V.
10. In LVDAC-EMS, open the Oscilloscope and display the resistor voltage, current, and power on channels 1, 2, and 3, respectively. If necessary, set the time base to display at least two cycles of the sine waves.
11. Observe the power waveform displayed on the Oscilloscope. Is the polarity of the power waveform always positive? Explain why.
12. Record the average value of the power waveform indicated on the Oscilloscope.
Average power W
13. Compare the average power obtained in the previous step with the calculated active power recorded in step 8. Are both values close to each other?
Yes No

Ex. 3-1 – Active and Reactive Power Procedure
104 © Festo Didactic 86358-00
14. Record the rms values of the resistor voltage and current indicated on the Oscilloscope.
Resistor voltage V Resistor current A
15. Calculate the active power dissipated in the resistor from the rms values of the resistor voltage and current measured in the previous step.
Active power W
16. Compare the active power obtained in the previous step with the calculated active power recorded in step 8. Are both values close to each other?
Yes No
17. In the Metering window, set a meter to measure the active power in the resistor from the rms values of the resistor voltage (input E1) and current (input I1). Record the active power indicated by the meter below.
Active power W
18. Compare the active power obtained in the previous step with the calculated active power recorded in step 8. Are both values close to each other?
Yes No
19. In the Metering window, set a meter to measure the reactive power in the resistor from the rms values of the resistor voltage and current . Record the reactive power indicated by the meter below.
Reactive power var
20. Do the values of the reactive power obtained in the previous step and the active power recorded in step 17 confirm that virtually all the power supplied to a resistor is dissipated in the resistor and does not return to the source (i.e., that there is only active power in a resistor)?
Yes No

Ex. 3-1 – Active and Reactive Power Procedure
© Festo Didactic 86358-00 105
Reactive power in an inductor
In this section, you will set up an ac circuit containing an inductor. You will calculate the reactive power in the inductor. Using the Oscilloscope, you will observe the waveforms of the inductor voltage, current, and power, and confirm that the power waveform has a virtually null average value. You will determine the reactive power in the inductor from the rms values of the inductor voltage and current measured on the Oscilloscope and in the Metering window, and compare the result with the calculated reactive power . Finally, you will measure the active power in the inductor to verify that the active power in an inductor has a virtually null value.
21. In the Four-Quadrant Dynamometer/Power Supply window, disable the ac power source.
22. Set up the circuit shown in Figure 3-6.
Figure 3-6. AC circuit containing an inductor and set up for power measurements.
Make the necessary switch settings on the Inductive Load (or on the Inductive and Capacitive Loads) in order to obtain the inductive reactance value required.
Use inputs E1 and I1 of the Data Acquisition and Control Interface to measure the voltage across the inductor and current flowing through the inductor, respectively.
23. Calculate the reactive power in the inductor.
Reactive power var
24. In the Four-Quadrant Dynamometer/Power Supply window, enable the ac power source.
In the Four-Quadrant Dynamometer/Power Supply window, readjust the value of the No Load Voltage parameter so that the ac power source voltage (indicated by meter E1 in the Metering window) is equal to 100 V.
200
100 V

Ex. 3-1 – Active and Reactive Power Procedure
106 © Festo Didactic 86358-00
25. Observe the inductor power waveform displayed on the Oscilloscope. Is the polarity of the power waveform alternating? Explain why.
26. Has the inductor power waveform a virtually null average value? Explain why.
27. Record the rms values of the inductor voltage and current indicated on the Oscilloscope.
Inductor voltage V Inductor current A
28. Calculate the reactive power in the inductor from the rms values of the inductor voltage and current measured in the previous step.
Reactive power var
29. Compare the reactive power obtained in the previous step with the calculated reactive power recorded in step 23. Are both values close to each other?
Yes No
30. In the Metering window, set a meter to measure the active power in the inductor from the rms values of the inductor voltage (input E1) and current (input I1). Record the active power indicated by the meter.
Active power W
31. In the Metering window, set a meter to measure the reactive power in the inductor from the rms values of the inductor voltage and current . Record the reactive power indicated by the meter.
Reactive power var

Ex. 3-1 – Active and Reactive Power Procedure
© Festo Didactic 86358-00 107
32. Do the values of the reactive power obtained in the previous step and the active power recorded in step 30 confirm that virtually all the power supplied to an inductor is returned to the source and that very little power is dissipated in the inductor (i.e., that there is mainly reactive power in an inductor)?
Yes No
Reactive power in a capacitor
In this section, you will set up an ac circuit containing a capacitor. You will calculate the reactive power in the capacitor. Using the Oscilloscope, you will observe the waveforms of the capacitor voltage, current, and power, and confirm that the average value of the power waveform is null. You will calculate the reactive power in the capacitor from the rms values of the capacitor voltage and current measured on the Oscilloscope and in the Metering window, and compare the result with the calculated reactive power . Finally, you will measure the active power in the capacitor to verify that the active power in a capacitor has a virtually null value.
33. In the Four-Quadrant Dynamometer/Power Supply window, disable the ac power source.
34. Set up the circuit shown in Figure 3-7.
Figure 3-7. AC circuit containing a capacitor and set up for power measurements.
Make the necessary switch settings on the Capacitive Load (or on the Inductive and Capacitive Loads) in order to obtain the capacitive reactance value required.
Use inputs E1 and I1 of the Data Acquisition and Control Interface to measure the voltage across the capacitor and current flowing through the capacitor, respectively.
35. Calculate the reactive power in the capacitor.
Reactive power var
300
100 V

Ex. 3-1 – Active and Reactive Power Procedure
108 © Festo Didactic 86358-00
36. In the Four-Quadrant Dynamometer/Power Supply window, enable the ac power source.
In the Four-Quadrant Dynamometer/Power Supply window, readjust the value of the No Load Voltage parameter so that the ac power source voltage (indicated by meter E1 in the Metering window) is equal to 100 V.
37. Observe the capacitor power waveform displayed on the Oscilloscope. Is the polarity of the power waveform alternating?
Yes No
38. Is the average value of the capacitor power waveform null? Explain why?
39. Record the rms values of the capacitor voltage and current indicated on the Oscilloscope.
Capacitor voltage V
Capacitor current A
40. Calculate the reactive power in the capacitor from the rms values of the capacitor voltage and current measured in the previous step.
Reactive power var
41. Compare the reactive power obtained in the previous step with the calculated reactive power recorded in step 35. Are both values close to each other?
Yes No
42. In the Metering window, set a meter to measure the active power in the capacitor from the rms values of the capacitor voltage (input E1) and current (input I1). Record the active power indicated by the meter.
Active power W

Ex. 3-1 – Active and Reactive Power Conclusion
© Festo Didactic 86358-00 109
43. In the Metering window, set a meter to measure the reactive power in the capacitor from the rms values of the capacitor voltage and current . Record the reactive power indicated by the meter.
Reactive power var
44. Do the values of the reactive power obtained in the previous step and the active power recorded in step 42 confirm that virtually all the power supplied to a capacitor is returned to the source and that very little power is dissipated in the capacitor (i.e., that there is only reactive power in a capacitor)?
Yes No
45. In the Four-Quadrant Dynamometer/Power Supply window, disable the ac power source.
46. Close LVDAC-EMS, then turn off all the equipment. Disconnect all leads and return them to their storage location.
In this exercise, you learned what active power and reactive power are. You also learned how to calculate the active and reactive power in the components of an ac circuit.
1. What is the main difference between active and reactive power.
2. What is the difference between the power waveform related to a resistor (active power waveform) and the power waveform (reactive power waveform) related to a reactive component?
3. Consider an ac circuit containing a capacitor ( 300 ) and having a source voltage of 100 V. Calculate the reactive power in the capacitor.
CONCLUSION
REVIEW QUESTIONS
Ex. 3-1 – Active and Reactive Power Review Questions
110 © Festo Didactic 86358-00
4. Consider an ac circuit containing an inductor ( 200 ). Calculate the source voltage , knowing that the reactive power in the inductor is equal to 70 var.
5. Consider an ac circuit containing a resistor and having a source voltage of 100 V. Calculate the resistance of the resistor, knowing that the active power dissipated in the resistor is equal to 75 W.
© Festo Didactic 86358-00 111
When you have completed this exercise, you will be familiar with phasor diagrams showing the active power, reactive power, and apparent power in a circuit. You will know what the power factor of a circuit is and how to calculate its value. You will also know how to calculate the total reactive power and the apparent power in a circuit. You will be able to represent the active, reactive, and apparent power in a circuit as a power triangle.
The Discussion of this exercise covers the following points:
Phasor diagrams related to active and reactive power Apparent power Power triangle Power factor
Phasor diagrams related to active and reactive power
Phasor diagram related to the active power in a resistor
When a resistor is connected to an ac power source, the current flowing in the resistor is in phase with the voltage across the resistor (see Figure 3-8). The active power dissipated in the resistor can be determined using vectorial calculation to solve the equation . The result of this calculation is a phasor having twice the frequency of the ac power source and a phase angle of 0° as shown in the figure below.
Apparent Power and the Power Triangle
Exercise 3-2
EXERCISE OBJECTIVE
DISCUSSION OUTLINE
DISCUSSION

Ex. 3-2 – Apparent Power and the Power Triangle Discussion
112 © Festo Didactic 86358-00
Figure 3-8. AC circuit containing a resistor and corresponding phasor diagrams showing the resistor voltage , current , and active power .
Phasor diagram related to the reactive power in an inductor
When an ideal inductor is connected to an ac power source, the current flowing in the inductor lags the voltage across the inductor by 90° (see Figure 3-9). The reactive power in the inductor can be determined using vectorial calculation to solve the equation . The result of this calculation is a phasor having twice the frequency of the ac power source and a phase of -90° as shown in the figure below.
Figure 3-9. AC circuit containing an inductor and corresponding phasor diagrams showing the inductor voltage , current , and reactive power .
90°
-90°
90°
±180°
±180°
-90°
0°
0°
90°
90°
±180°
±180°
0°
0°
-90°
-90°

Ex. 3-2 – Apparent Power and the Power Triangle Discussion
© Festo Didactic 86358-00 113
Phasor diagram related to the reactive power in a capacitor
Similarly, when a capacitor is connected to an ac power source, the current flowing in the capacitor leads the voltage across the capacitor by 90° (see Figure 3-10. As for inductors, the reactive power in a capacitor can be determined using vectorial calculation to solve the equation . The result of the calculation is a phasor having twice the frequency of the ac power source and a phase angle of 90° as shown in the figure below.
Figure 3-10. AC circuit containing a capacitor and corresponding phasor diagrams showing the capacitor voltage , current , and reactive power .
Comparing Figure 3-9 and Figure 3-10 shows that the phasor of the reactive power in an inductor is 180° out of phase with respect to the phasor of the reactive power in a capacitor. Therefore, when an inductor and a capacitor are both present in an ac circuit, the total reactive power in the circuit is equal to . This relationship is valid whether the reactive components are connected in series or in parallel. The total reactive power is in fact the reactive power that the source exchanges with the inductor and capacitor. When has a higher value than , the total reactive power is positive. Conversely, when has a higher value than , the total reactive power is negative. Figure 3-11 shows an example of the total reactive power when the reactive power exceeds the reactive power in an ac circuit containing an inductor and a capacitor.
-90°
-90°
90°
90°
±180°
±180°
0°
0°

Ex. 3-2 – Apparent Power and the Power Triangle Discussion
114 © Festo Didactic 86358-00
Figure 3-11. Total reactive power in an ac circuit containing an inductor and a capacitor ( ).
Apparent power
When an ac power source is connected to a circuit containing a resistor and reactive components, the source delivers active power to the resistor and exchanges reactive power with the reactive components. This is illustrated in Figure 3-12.
Figure 3-12. AC circuit containing a resistor, an inductor, and a capacitor, and corresponding phasor diagram showing the active, reactive, and apparent power in the circuit.
90°
-90°
±180° 0°

Ex. 3-2 – Apparent Power and the Power Triangle Discussion
© Festo Didactic 86358-00 115
The phasor diagram in Figure 3-12 shows that the apparent power , which corresponds to the total power in an ac circuit, is equal to the vectorial sum of the active power in the resistor and the total reactive power in the reactive components. Therefore, following the Pythagorean theorem, the apparent power in a circuit can be calculated using the following equation:
(3-4)
where is the apparent power or total power in the circuit, expressed in volt-
amperes (VA). is the total active power dissipated in the circuit, expressed in
watts (W). is the total reactive power in the circuit, expressed in reactive volt-
amperes (var).
Equation (3-4) is valid for parallel circuits (as in Figure 3-12), series circuits, and series-parallel circuits. The apparent power in an ac circuit can also be determined by multiplying the rms values of the source voltage and current , as shown in the following equation:
(3-5)
Power triangle
The phasors representing the active power , the reactive power , and the apparent power in an ac circuit form a triangle. This triangle is known as the power triangle. An example of a power triangle is given in Figure 3-13.
Figure 3-13. Power triangle.
Power factor
When analyzing a circuit, it is often important to know what portion of the current flowing in the circuit is used to perform actual work (i.e., to carry active power) and what portion of the current flowing in the circuit is simply used for the exchange of power between the reactive components and the source. These portions can be evaluated by determining the power factor of the circuit.
224 VA
100 var
200 W

Ex. 3-2 – Apparent Power and the Power Triangle Procedure Outline
116 © Festo Didactic 86358-00
The power factor of a circuit is the ratio of the active power to the apparent power in the circuit. It can thus be determined using the following equation:
(3-6)
where is the power factor of the circuit.
The power factor of a circuit can vary between 0 (purely reactive circuit) and 1 (purely resistive circuit). The higher the value of the power factor, the more efficient a circuit is in using electrical power to do useful work (heating, propelling a vehicle, etc.). This means that, for the same amount of active power supplied to a load, a circuit having a low power factor will draw more current (more reactive power will be exchanged in the circuit) than a circuit having a high power factor. An electric power system having a low power factor requires larger wires and loses more energy in the distribution system to perform the same amount of work as an electric power system having a high power factor.
The Procedure is divided into the following sections:
Setup and connections Total reactive power in a circuit Apparent power, power factor, and power triangle
High voltages are present in this laboratory exercise. Do not make or modify any banana jack connections with the power on unless otherwise specified.
Setup and connections
In this section, you will connect a parallel ac circuit containing an inductor and a capacitor, and set up the equipment to measure the voltages and currents related to these components.
1. Refer to the Equipment Utilization Chart in Appendix A to obtain the list of equipment required to perform this exercise.
Install the required equipment in the Workstation.
2. Make sure that the main power switch on the Four-Quadrant Dynamometer/ Power Supply is set to the O (off) position, then connect its Power Input to an ac power outlet.
Connect the Power Input of the Data Acquisition and Control Interface to a 24 V ac power supply. Turn the 24 V ac power supply on.
The power factor is a ratio between two terms ex-pressed in units of power (1 W = 1 VA). Therefore, it is a dimensionless quantity.
PROCEDURE OUTLINE
PROCEDURE

Ex. 3-2 – Apparent Power and the Power Triangle Procedure
© Festo Didactic 86358-00 117
3. Connect the USB port of the Data Acquisition and Control Interface to a USB port of the host computer.
Connect the USB port of the Four-Quadrant Dynamometer/Power Supply to a USB port of the host computer.
4. Turn the Four-Quadrant Dynamometer/Power Supply on, then set the Operating Mode switch to Power Supply.
5. Turn the host computer on, then start the LVDAC-EMS software.
In the LVDAC-EMS Start-Up window, make sure that the Data Acquisition and Control Interface and the Four-Quadrant Dynamometer/Power Supply are detected. Make sure that the Computer-Based Instrumentation function for the Data Acquisition and Control Interface is available. Select the network voltage and frequency that correspond to the voltage and frequency of your local ac power network, then click the OK button to close the LVDAC-EMS Start-Up window.
6. Set up the circuit shown in Figure 3-14.
Figure 3-14. Parallel ac circuit containing an inductor and a capacitor, and set up for measuring the reactive power in each component.
Make the necessary switch settings on the Inductive Load and Capacitive Load (or on the Inductive and Capacitive Loads) in order to obtain the inductive reactance and capacitive reactance values required.
Use inputs E1, I1, I2, and I3 of the Data Acquisition and Control Interface to measure the source voltage ( ), the source current , the inductor current , and the capacitor current , respectively.
, , 100 V
100
240

Ex. 3-2 – Apparent Power and the Power Triangle Procedure
118 © Festo Didactic 86358-00
7. In LVDAC-EMS, open the Four-Quadrant Dynamometer/Power Supply window, then make the following settings:
Set the Function parameter to AC Power Source.
Make sure that the Voltage Control parameter is set to Knob. This allows the ac power source to be controlled manually.
Set the No Load Voltage parameter to 100 V.
Set the Frequency parameter to the frequency of your local ac power network.
Leave the other parameters set as they are.
Total reactive power in a circuit
In this section, you will calculate the reactive power in the inductor, the reactive power in the capacitor, and the total reactive power in the circuit. You will use the Metering window to measure the source voltage , the source current , the inductor current , and the capacitor current . You will then determine from these values the reactive power in the inductor, reactive power in the capacitor, and total reactive power in the circuit, and compare the results with the calculated values. You will also determine the total reactive power from the measured rms values of the source voltage and current , and compare the result with the calculated total reactive power. You will use the Metering window to measure the total reactive power directly and compare the result with the calculated total reactive power.
8. Calculate the reactive power in the inductor, the reactive power in the capacitor, and the total reactive power in the circuit.
Reactive power var
Reactive power var
Total reactive power var
9. In LVDAC EMS, open the Metering window. Set meter E1 to measure the rms value of the ac power source voltage .
In the Four-Quadrant Dynamometer/Power Supply window, enable the ac power source. Readjust the value of the No Load Voltage parameter so that the ac power source voltage (indicated by meter E1 in the Metering window) is equal to 100 V.

Ex. 3-2 – Apparent Power and the Power Triangle Procedure
© Festo Didactic 86358-00 119
10. In the Metering window, set meter E1 to measure the rms value of the source voltage ( ) and meters I1, I2, and I3 to measure the rms values of the source current , the inductor current , and the capacitor current , respectively. Record the values below.
V A
V A
V A
11. Determine the reactive power in the inductor, the reactive power in the capacitor, and the total reactive power in the circuit using the voltage and current values measured in the previous step.
Reactive power var
Reactive power var
Total reactive power var
12. Compare the reactive power in the inductor, the reactive power in the capacitor, and the total reactive power in the circuit obtained in the previous step with the calculated values you recorded in step 8. Are the values close to each other?
Yes No
13. Determine the total reactive power in the circuit using the rms values of the source voltage and current you measured in step 10. Record the result below.
Total reactive power var
14. Compare the total reactive power obtained in the previous step with the reactive power values you recorded in steps 8 and 11. Are the values close to each other?
Yes No
15. In the Metering window, set a meter to measure the total reactive power in the circuit. Record the value below.
Total reactive power var

Ex. 3-2 – Apparent Power and the Power Triangle Procedure
120 © Festo Didactic 86358-00
16. Does the total reactive power measured in the previous step confirm the other total reactive power values you obtained so far?
Yes No
Apparent power, power factor, and power triangle
In this section, you will set up a parallel ac circuit containing a resistor, an inductor, and a capacitor. You will calculate the active power dissipated in the resistor, the total reactive power in the circuit, the apparent power in the circuit, and the power factor of the circuit. Using the Metering window, you will measure the source voltage , the source current , the resistor current , and the current flowing in the inductor and capacitor. You will determine from these measured values the active power , reactive power , and apparent power in the circuit, and the power factor of the circuit. Using the Metering window, you will then measure the active power , reactive power , apparent power , and power factor directly, and compare the results with the values you obtained from the measured voltage and current values. Finally, you will draw the power triangle of the circuit.
17. In the Four-Quadrant Dynamometer/Power Supply window, disable the ac power source.
18. Set up the circuit shown in Figure 3-15.
Figure 3-15. Parallel ac circuit containing a resistor, an inductor, and a capacitor, and set up for power measurements.
Make the necessary switch settings on the Resistive Load, and on the Inductive Load and Capacitive Load (or on the Inductive and Capacitive Loads) in order to obtain the resistance, inductive reactance, and capacitive reactance values required.
Use inputs E1, I1, I2, and I3 of the Data Acquisition and Control Interface to measure the source voltage and current , the resistor current , and the current flowing through the inductor and capacitor connected in parallel.
100 V
300
100
171
, ,

Ex. 3-2 – Apparent Power and the Power Triangle Procedure
© Festo Didactic 86358-00 121
19. Calculate the active power , the total reactive power , and the apparent power in the circuit, and the power factor of the circuit. Record the values below.
Active power W
Total reactive power var
Apparent power VA
Power factor
20. In the Four-Quadrant Dynamometer/Power Supply window, enable the ac power source. Readjust the value of the No Load Voltage parameter so that the source voltage (indicated by meter E1 in the Metering window) is equal to 100 V.
21. In the Metering window, measure the rms values of the source voltage ( ), the resistor current , and the current . Record the values below.
V
V A
V A
22. Determine the active power in the resistor, the total reactive power in the circuit, the apparent power in the circuit, and the power factor of the circuit using the voltage and current values measured in the previous step.
Active power W
Reactive power var
Apparent power VA
Power factor
23. Compare the active power in the resistor, the total reactive power in the circuit, the apparent power in the circuit, and the power factor of the circuit obtained in the previous step with the values you calculated in step 19. Are the values close to each other?
Yes No

Ex. 3-2 – Apparent Power and the Power Triangle Procedure
122 © Festo Didactic 86358-00
24. In the Metering window, measure the rms value of the source current . Record the value below.
Source current A
25. Determine the apparent power in the circuit from the measured rms values of the source voltage and current (recorded in step 21 and 24, respectively). Record the result below.
Apparent power VA
26. Compare the apparent power obtained in the previous step with the values of the apparent power recorded in steps 19 and 22. Are all values close to each other?
Yes No
27. In the Metering window, set three meters to measure the power in the circuit from the rms values of the source voltage (input E1) and current (input I1). Set the first meter to measure the active power , the second meter to measure the total reactive power , and the third meter to measure the apparent power . Set a fourth meter to measure the power factor of the circuit. Record the results below.
Active power W
Total reactive power var
Apparent power VA
Power factor
28. Do the values of the active power , total reactive power , apparent power , and power factor measured in the previous step confirm the active power, total reactive power, apparent power, and power factor values you obtained so far?
Yes No

Ex. 3-2 – Apparent Power and the Power Triangle Conclusion
© Festo Didactic 86358-00 123
29. Draw the power triangle of the circuit using the active power , total reactive power , and apparent power measured in step 27.
Power triangle of the circuit in Figure 3-15.
30. In the Four-Quadrant Dynamometer/Power Supply window, disable the ac power source.
31. Close LVDAC-EMS, then turn off all the equipment. Disconnect all leads and return them to their storage location.
In this exercise, you became familiar with the phasor diagrams showing the active power, reactive power, and apparent power in a circuit. You learned what the power factor of a circuit is and how to calculate its value. You also learned how to calculate the total reactive power and the apparent power in a circuit. You saw how to represent the active, reactive, and apparent power in a circuit as a power triangle.
1. Is it possible to determine the phase relationship between a power phasor and the corresponding voltage and current phasors? Explain why.
2. What is the phase relationship between the reactive power in an inductor and the reactive power in a capacitor?
CONCLUSION
REVIEW QUESTIONS

Ex. 3-2 – Apparent Power and the Power Triangle Review Questions
124 © Festo Didactic 86358-00
3. What are the differences between the active power , reactive power , and apparent power ?
4. A parallel ac circuit having a source voltage of 100 V contains an ideal inductor ( 150 ) and a capacitor ( 350 ). Calculate the resulting total reactive power in the circuit. Indicate the phase relationship between the source current and the source voltage .
5. A parallel ac circuit having a source voltage of 150 V contains a resistor ( 200 ) and an inductor ( 50 ). Calculate the apparent power in the circuit and the power factor of the circuit.

Unit 3 – Power in AC Circuits Unit Test
© Festo Didactic 86358-00 125
Unit Test
1. Complete the following sentence: Active power is used by
a. resistive components to perform work, while reactive power is exchanged between the source and reactive components without performing any work.
b. reactive components to perform work, while reactive power is exchanged between the source and resistive components without performing any work.
c. resistive components and is returned to the source without performing any work, while reactive power is exchanged between the source and reactive components to perform work.
d. resistive components to perform work and decreases the power factor of the circuit.
2. Which one of the following sentences is true with respect to the waveforms of active power and reactive power?
a. The active power waveform has a zero average value and a frequency that is twice the ac power source frequency.
b. The reactive power waveform is out of phase with respect to the waveforms of the current and voltage and has a frequency that is equal to the ac power source frequency.
c. The reactive power waveform has a positive average value and a frequency that is twice the ac power source frequency.
d. The active power waveform has a positive average value and a frequency that is twice the ac power source frequency.
3. Given a parallel ac circuit having a source voltage of 100 V and containing an inductor ( 150 ) and a capacitor ( 300 ). Calculate the total reactive power in the circuit.
a. var b. var c. var d. var
4. Given an ac circuit having a source voltage of 140 V and containing a resistor ( 200 ). Calculate the active power and reactive power in the resistor.
a. W, var b. W, var c. W, var d. W, var

Unit 3 – Power in AC Circuits Unit Test
126 © Festo Didactic 86358-00
5. The active power dissipated in a capacitor is equal to the
a. product of the instantaneous values of the capacitor voltage and current. b. instantaneous value of the capacitor power waveform. c. average value of the capacitor power waveform. d. vectorial sum of the reactive and apparent power in the circuit.
6. Complete the following sentence as regards the positive and negative halves of the power waveform related to a reactive component: During the positive half of the power waveform, the reactive component
a. absorbs power from the source, while during the negative half of the power waveform, the reactive component returns power to the source.
b. transforms power received from the source into active power, while during the negative half of the power waveform, the reactive component converts power in reactive power.
c. transforms power received from the source into reactive power, while during the negative half of the power waveform, the reactive component converts power in active power.
d. returns power to the source, while during the negative half of the power waveform, the reactive component absorbs power from the source.
7. What is the relationship between the polarity of the total reactive power in an ac circuit and the nature of the circuit (inductive or capacitive)?
a. An ac circuit having a positive total reactive power is capacitive, while an ac circuit having a negative total reactive power is inductive.
b. An ac circuit having a positive total reactive power is inductive, while an ac circuit having a negative total reactive power is capacitive.
c. An ac circuit having a positive total reactive power is both inductive and capacitive, while an ac circuit having a negative total reactive power is neither inductive nor capacitive.
d. The polarity of the total reactive power cannot be used to determine whether an ac circuit is inductive or capacitive.
8. Complete the following sentence: The reactive power in an ideal inductor
a. leads the reactive power in a capacitor by 180°. b. leads the reactive power in a capacitor by 90°. c. lags the reactive power in a capacitor by 180°. d. lags the reactive power in a capacitor by 90°.
9. The power factor of an ac circuit determines the
a. frequency of the power waveform. b. ratio between inductive and capacitive reactive power in a circuit. c. ratio between the active power and the apparent power in the circuit. d. ratio between the number of resistive components and the number of
reactive components in a circuit.

Unit 3 – Power in AC Circuits Unit Test
© Festo Didactic 86358-00 127
10. Consider a parallel ac circuit containing a resistor ( 100 ) and an ideal inductor ( 250 ). Calculate the apparent power in the circuit knowing that the active power in the resistor is equal to 75 W.
a. VA b. VA c. VA d. VA


© Festo Didactic 86358-00 129
When you have completed this unit, you will be able to resolve simple ac circuits using the circuit impedance calculation method. You will also be able to solve complex ac circuits using the power triangle method.
The Discussion of Fundamentals covers the following points:
Introduction to circuit analysis Circuit analysis methods
Introduction to circuit analysis
Circuit analysis consists of calculating all electrical parameters when a circuit (i.e., an arrangement of electrical components) is connected to an ac power source having a certain voltage . More specifically, circuit analysis consists of determining (via calculations) the voltage across each component, the current flowing in each branch of the circuit, the total circuit current (i.e., the source current ), the power in each component, as well as the active power , the reactive power , and the apparent power in the circuit, and the power factor of the circuit.
Circuit analysis methods
Two different methods (approaches) for solving ac circuits are discussed in this unit. The first method relies on the calculation of circuit impedance and can be used to quickly solve simple ac power circuits. The second method is based on the power triangle and can be used to solve almost any ac power circuit. Both of these methods use only simple algebraic calculations and no vectorial calculation whatsoever.
AC Circuits Analysis
Unit 4
UNIT OBJECTIVE
DISCUSSION OUTLINE
DISCUSSION OF FUNDAMENTALS


© Festo Didactic 86358-00 131
When you have completed this exercise, you will be able to resolve simple parallel and series ac circuits using the circuit impedance calculation method.
The Discussion of this exercise covers the following points:
Solving simple parallel circuits Solving simple series circuits
Solving simple parallel circuits
Figure 4-1 shows a parallel ac circuit containing a resistor and an inductor.
Figure 4-1. Parallel ac circuit containing a resistor and an inductor.
The step-by-step sequence for solving the ac circuit shown in Figure 4-1 using the impedance calculation method is given below. The source voltage , the resistance of the resistor, and the inductive reactance of the inductor are the only values known in the circuit diagram above. The circuit is solved using the following operations:
Solving Simple AC Circuits Using Circuit Impedance Calculation
Exercise 4-1
EXERCISE OBJECTIVE
DISCUSSION OUTLINE
DISCUSSION
?
? ? ?
?
? ?
? ?

Ex. 4-1 – Solving Simple AC Circuits Using Circuit Impedance Calculation Discussion
132 © Festo Didactic 86358-00
As the name of the method indicates, the key to solving the circuit using the circuit impedance calculation method is to determine the circuit impedance . When the circuit impedance is determined, the other calculations follow logically.
Example
Consider the following ac circuit:
Figure 4-2. Parallel ac circuit containing a resistor and an inductor.
The step-by-step sequence for solving the circuit shown in Figure 4-2 using the impedance calculation method is given below:
?
150 V
200
300
? ?
? ? ?
? ?

Ex. 4-1 – Solving Simple AC Circuits Using Circuit Impedance Calculation Discussion
© Festo Didactic 86358-00 133
Solving simple series circuits
Figure 4-3 shows a series ac circuit containing a resistor, an inductor, and a capacitor.
Figure 4-3. Series ac circuit containing a resistor, an inductor, and a capacitor.
The impedance calculation method used to solve parallel ac circuits can also be used to solve the series ac circuit shown in Figure 4-3. Given the values of the source voltage , the resistance of the resistor, the inductive reactance of the inductor, and the capacitive reactance of the capacitor, the values of the other parameters can be determined as follows:
As with parallel ac circuits, the key to solving the circuit is determining the circuit impedance . The rest of the calculations are simple algebraic operations deriving from the value of the circuit impedance .
? ?
? ?
? ?
?
? ? ?
?

Ex. 4-1 – Solving Simple AC Circuits Using Circuit Impedance Calculation Discussion
134 © Festo Didactic 86358-00
Example
Consider the following ac circuit:
Figure 4-4. Series ac circuit containing a resistor, an inductor, and a capacitor.
The step-by-step sequence for solving the circuit shown in Figure 4-4 using the impedance calculation method is given below.
As you can see, solving both parallel and series ac circuits using the circuit impedance calculation method involves no vectorial calculation. This method enables the resolution of ac circuits using only basic algebraic calculations.
200
300
100
150 V

Ex. 4-1 – Solving Simple AC Circuits Using Circuit Impedance Calculation Procedure Outline
© Festo Didactic 86358-00 135
The Procedure is divided into the following sections:
Setup and connections Solving a simple parallel ac circuit Solving a simple series ac circuit
High voltages are present in this laboratory exercise. Do not make or modify anybanana jack connections with the power on unless otherwise specified.
Setup and connections
In this section, you will connect a parallel ac circuit containing a resistor and a capacitor, and set up the equipment to measure all the circuit parameters.
1. Refer to the Equipment Utilization Chart in Appendix A to obtain the list of equipment required to perform this exercise.
Install the required equipment in the Workstation.
2. Make sure that the main power switch on the Four-Quadrant Dynamometer/ Power Supply is set to the O (off) position, then connect its Power Input to an ac power outlet.
Connect the Power Input of the Data Acquisition and Control Interface to a 24 V ac power supply. Turn the 24 V ac power supply on.
3. Connect the USB port of the Data Acquisition and Control Interface to a USB port of the host computer.
Connect the USB port of the Four-Quadrant Dynamometer/Power Supply to a USB port of the host computer.
4. Turn the Four-Quadrant Dynamometer/Power Supply on, then set the Operating Mode switch to Power Supply.
5. Turn the host computer on, then start the LVDAC-EMS software.
In the LVDAC-EMS Start-Up window, make sure that the Data Acquisition and Control Interface and the Four-Quadrant Dynamometer/Power Supply are detected. Make sure that the Computer-Based Instrumentation function for the Data Acquisition and Control Interface is available. Select the network voltage and frequency that correspond to the voltage and frequency of your local ac power network, then click the OK button to close the LVDAC-EMS Start-Up window.
PROCEDURE OUTLINE
PROCEDURE

Ex. 4-1 – Solving Simple AC Circuits Using Circuit Impedance Calculation Procedure
136 © Festo Didactic 86358-00
6. Set up the circuit shown in Figure 4-5.
Figure 4-5. Parallel ac circuit containing a resistor and a capacitor, and set up for circuit analysis.
Make the necessary switch settings on the Resistive Load and Capacitive Load (or on the Inductive and Capacitive Loads) in order to obtain the resistance and capacitive reactance values required.
Use inputs E1, I1, I2, and I3 of the Data Acquisition and Control Interface to measure the source voltage ( ), the source current , the resistor current , and the capacitor current , respectively.
7. In LVDAC-EMS, open the Four-Quadrant Dynamometer/Power Supply window, then make the following settings:
Set the Function parameter to AC Power Source.
Make sure that the Voltage Control parameter is set to Knob. This allows the ac power source to be controlled manually.
Set the No Load Voltage parameter to 100 V.
Set the Frequency parameter to the frequency of your local ac power network.
Leave the other parameters set as they are.
Solving a simple parallel ac circuit
In this section, you will use the impedance calculation method to solve the circuit you set up in the previous steps. You will then measure the circuit parameters and compare the results with the calculated circuit parameters.
100 V
100
171

Ex. 4-1 – Solving Simple AC Circuits Using Circuit Impedance Calculation Procedure
© Festo Didactic 86358-00 137
8. Resolve the entire circuit shown in Figure 4-5 using the impedance calculation method.
Impedance
Source current A
Apparent power VA
Resistor current A
Active power W
Capacitor current A
Reactive power var
Power factor
9. In LVDAC-EMS, open the Metering window. Set meter E1 to measure the rms value of the ac power source voltage .
In the Four-Quadrant Dynamometer/Power Supply window, enable the ac power source. Readjust the value of the No Load Voltage parameter so that the ac power source voltage (indicated by meter E1 in the Metering window) is equal to 100 V.
10. In the Metering window, set the meters to measure the following parameters:
Source voltage V
Source current A
Resistor current A
Capacitor current A
Active power W
Resistor power W
Reactive power var
Capacitor reactive power var
Apparent power VA
Power factor
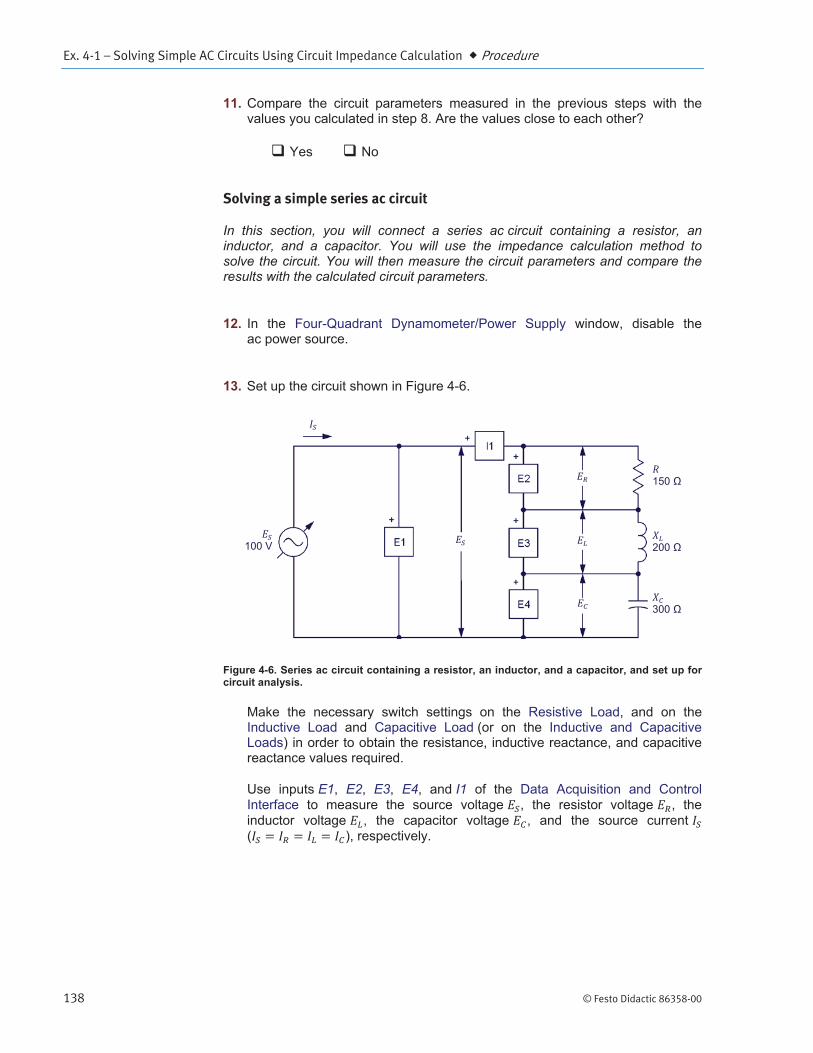
Ex. 4-1 – Solving Simple AC Circuits Using Circuit Impedance Calculation Procedure
138 © Festo Didactic 86358-00
11. Compare the circuit parameters measured in the previous steps with the values you calculated in step 8. Are the values close to each other?
Yes No
Solving a simple series ac circuit
In this section, you will connect a series ac circuit containing a resistor, an inductor, and a capacitor. You will use the impedance calculation method to solve the circuit. You will then measure the circuit parameters and compare the results with the calculated circuit parameters.
12. In the Four-Quadrant Dynamometer/Power Supply window, disable the ac power source.
13. Set up the circuit shown in Figure 4-6.
Figure 4-6. Series ac circuit containing a resistor, an inductor, and a capacitor, and set up for circuit analysis.
Make the necessary switch settings on the Resistive Load, and on the Inductive Load and Capacitive Load (or on the Inductive and Capacitive Loads) in order to obtain the resistance, inductive reactance, and capacitive reactance values required.
Use inputs E1, E2, E3, E4, and I1 of the Data Acquisition and Control Interface to measure the source voltage , the resistor voltage , the inductor voltage , the capacitor voltage , and the source current ( ), respectively.
100 V
150
200
300

Ex. 4-1 – Solving Simple AC Circuits Using Circuit Impedance Calculation Procedure
© Festo Didactic 86358-00 139
14. Resolve the entire circuit shown in Figure 4-6 using the impedance calculation method.
Equivalent reactance
Impedance
Source current A
Apparent power VA
Resistor voltage V
Active power W
Inductor voltage V
Reactive power var
Capacitor voltage V
Reactive power var
Total reactive power var
Power factor
15. In the Four-Quadrant Dynamometer/Power Supply window, enable the ac power source.
Readjust the value of the No Load Voltage parameter so that the ac power source voltage (indicated by meter E1 in the Metering window) is equal to 100 V.
16. In the Metering window, set the meters to measure the following parameters:
Source voltage V
Resistor voltage V
Inductor voltage V
Capacitor voltage V
Source current A
Active power W
Resistor power W
Inductor reactive power var

Ex. 4-1 – Solving Simple AC Circuits Using Circuit Impedance Calculation Conclusion
140 © Festo Didactic 86358-00
Capacitor reactive power var
Total reactive power var
Apparent power VA
Power factor
17. Compare the circuit parameters measured in the previous steps with the values you calculated in step 14. Are the values close to each other?
Yes No
18. In the Four-Quadrant Dynamometer/Power Supply window, disable the ac power source.
19. Close LVDAC-EMS, then turn off all the equipment. Disconnect all leads and return them to their storage location.
In this exercise, you learned how to resolve simple parallel and series ac circuits using the circuit impedance calculation method.
1. A parallel ac power circuit contains a resistor ( 150 ) and an inductor ( 250 ). Knowing that the source voltage is equal to 150 V, calculate the apparent power in the circuit using the impedance calculation method.
2. A series ac power circuit contains a resistor ( 100 ) and a capacitor ( 225 ). Knowing that the source voltage is equal to 100 V, calculate the power factor of the circuit using the impedance calculation method.
CONCLUSION
REVIEW QUESTIONS

Ex. 4-1 – Solving Simple AC Circuits Using Circuit Impedance Calculation Review Questions
© Festo Didactic 86358-00 141
3. A parallel ac power circuit contains a resistor ( 200 ), an inductor, and a capacitor. Knowing that the source voltage is equal to 100 V and that the total reactive power in the circuit is 70.0 var, calculate the circuit impedance .
4. A series ac power circuit contains a resistor ( 150 ), an inductor ( 250 ), and a capacitor ( 200 ). Knowing that the active power dissipated in the circuit is equal to 100 W, calculate the apparent power in the circuit.
5. A series ac power circuit contains a resistor ( 250 ), an inductor ( 100 ), and a capacitor ( 300 ). Knowing that the source voltage is equal to 150 V, calculate the power factor of the circuit.


© Festo Didactic 86358-00 143
When you have completed this exercise, you will be able to resolve complex ac circuits using the power triangle method.
The Discussion of this exercise covers the following points:
Solving ac circuits using the power triangle method
Solving ac circuits using the power triangle method
Figure 4-7 shows an ac circuit containing a resistor, an inductor, and two capacitors.
Figure 4-7. AC circuit containing a resistor, an inductor, and two capacitors.
The step-by-step sequence for solving the ac circuit shown in Figure 4-7 using the power triangle method is given below. The values of the source voltage , the resistance of the resistor, the inductive reactance of the inductor, and the capacitive reactances and of the capacitors are known from the circuit diagram. To solve the circuit using the power triangle method, it is necessary to assume a certain voltage value (determined arbitrarily) across one of the circuit components. In this example, the voltage ( ) across the resistor is assumed to be equal to V. This results in the following:
Solving AC Circuits Using the Power Triangle Method
Exercise 4-2
EXERCISE OBJECTIVE
DISCUSSION OUTLINE
DISCUSSION
? ?
? ?
? ?
? ?
?
? ? ?
?
? ? ?
?
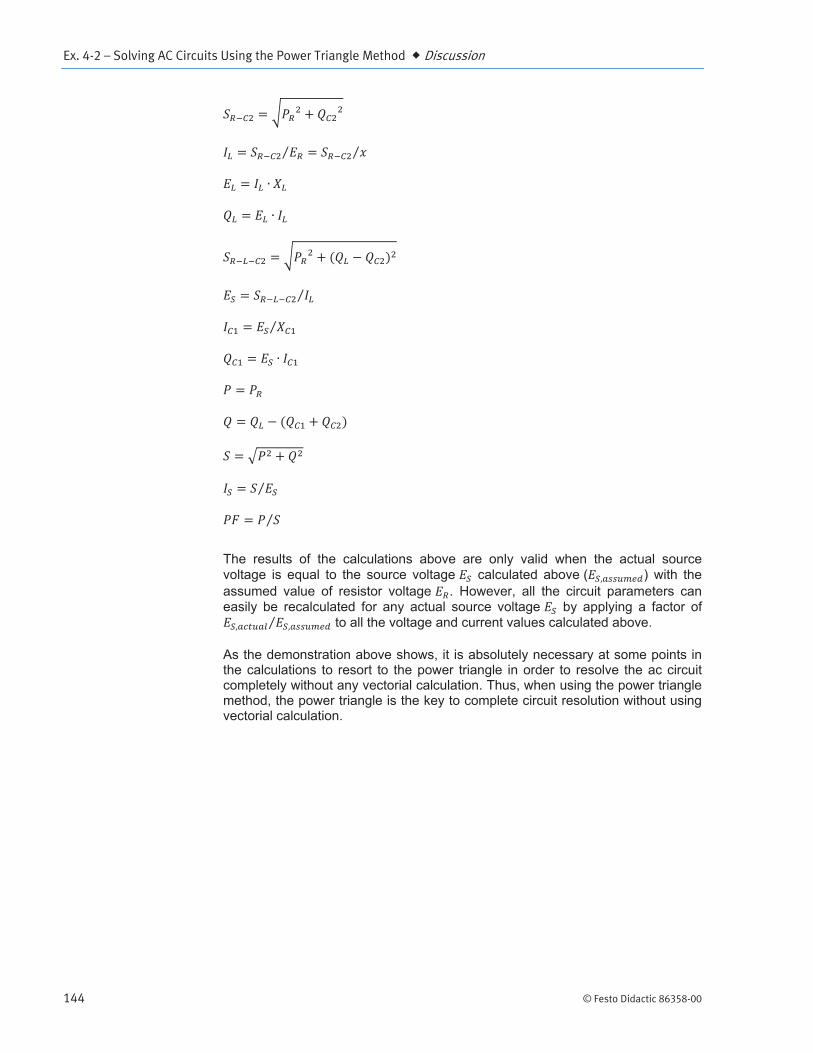
Ex. 4-2 – Solving AC Circuits Using the Power Triangle Method Discussion
144 © Festo Didactic 86358-00
The results of the calculations above are only valid when the actual source voltage is equal to the source voltage calculated above ( ) with the assumed value of resistor voltage . However, all the circuit parameters can easily be recalculated for any actual source voltage by applying a factor of
to all the voltage and current values calculated above.
As the demonstration above shows, it is absolutely necessary at some points in the calculations to resort to the power triangle in order to resolve the ac circuit completely without any vectorial calculation. Thus, when using the power triangle method, the power triangle is the key to complete circuit resolution without using vectorial calculation.

Ex. 4-2 – Solving AC Circuits Using the Power Triangle Method Discussion
© Festo Didactic 86358-00 145
Example
Figure 4-8 shows an ac circuit containing a resistor, an inductor, and two capacitors.
Figure 4-8. AC circuit containing a resistor, an inductor, and two capacitors.
The step-by-step sequence for solving the ac power circuit shown in Figure 4-8 is given below. In the calculations, it is assumed that the voltage ( ) measured across the resistor is equal to 40.0 V.
? ?
86.0
100
? ?
200
? ?
171
? ?
100 V
?
? ? ?
?
? ? ?
?

Ex. 4-2 – Solving AC Circuits Using the Power Triangle Method Discussion
146 © Festo Didactic 86358-00
The values calculated above are valid only if the source voltage is 41.3 V. Knowing that the actual source voltage is 100 V, the assumed resistor voltage has to be multiplied by the ratio in order to obtain the actual value of the resistor voltage . The actual resistor voltage is thus equal to:
The whole circuit can then be resolved using the value of the actual voltage .
The value of the source voltage obtained in the previous step confirms that the actual source voltage is effectively equal to 100 V when the resistor voltage is 96.9 V. The remaining circuit parameters can then be calculated:

Ex. 4-2 – Solving AC Circuits Using the Power Triangle Method Procedure Outline
© Festo Didactic 86358-00 147
The Procedure is divided into the following sections:
Setup and connections Solving an ac circuit using the power triangle method
High voltages are present in this laboratory exercise. Do not make or modify any banana jack connections with the power on unless otherwise specified.
Setup and connections
In this section, you will connect an ac circuit containing two resistors, an inductor, and a capacitor, and set up the equipment to measure all the circuit parameters.
1. Refer to the Equipment Utilization Chart in Appendix A to obtain the list of equipment required to perform this exercise.
Install the required equipment in the Workstation.
2. Make sure that the main power switch on the Four-Quadrant Dynamometer/ Power Supply is set to the O (off) position, then connect its Power Input to an ac power outlet.
Connect the Power Input of the Data Acquisition and Control Interface to a 24 V ac power supply. Turn the 24 V ac power supply on.
3. Connect the USB port of the Data Acquisition and Control Interface to a USB port of the host computer.
Connect the USB port of the Four-Quadrant Dynamometer/Power Supply to a USB port of the host computer.
4. Turn the Four-Quadrant Dynamometer/Power Supply on, then set the Operating Mode switch to Power Supply.
PROCEDURE OUTLINE
PROCEDURE

Ex. 4-2 – Solving AC Circuits Using the Power Triangle Method Procedure
148 © Festo Didactic 86358-00
5. Turn the host computer on, then start the LVDAC-EMS software.
In the LVDAC-EMS Start-Up window, make sure that the Data Acquisition and Control Interface and the Four-Quadrant Dynamometer/Power Supply are detected. Make sure that the Computer-Based Instrumentation function for the Data Acquisition and Control Interface is available. Select the network voltage and frequency that correspond to the voltage and frequency of your local ac power network, then click the OK button to close the LVDAC-EMS Start-Up window.
6. Set up the circuit shown in Figure 4-9.
Figure 4-9. AC circuit containing two resistors, an inductor, and a capacitor, and set up for circuit analysis.
Make the necessary switch settings on the Resistive Load, and on the Inductive Load and Capacitive Load (or on the Inductive and Capacitive Loads) in order to obtain the resistance, inductive reactance, and capacitive reactance values required.
Use inputs E1, E2, E3, and E4 of the Data Acquisition and Control Interface to measure the source voltage , the inductor voltage , the capacitor voltage ( ), and the voltage across resistor , respectively. Use inputs I1, I2, and I3 to measure the source current ( ), the capacitor current , and the current flowing in resistor , respectively.
7. In LVDAC-EMS, open the Four-Quadrant Dynamometer/Power Supply window, then make the following settings:
Set the Function parameter to AC Power Source.
Make sure that the Voltage Control parameter is set to Knob. This allows the ac power source to be controlled manually.
Set the No Load Voltage parameter to 100 V.
100 V
200
86.0
,
171
300

Ex. 4-2 – Solving AC Circuits Using the Power Triangle Method Procedure
© Festo Didactic 86358-00 149
Set the Frequency parameter to the frequency of your local ac power network.
Leave the other parameters set as they are.
Solving an ac circuit using the power triangle method
In this section, you will use the power triangle method to solve the circuit you set up in the previous steps. You will then measure the circuit parameters and compare the results with the calculated circuit parameters.
8. Resolve the entire circuit of Figure 4-9 using the power triangle method. Assume that the capacitor voltage ( is equal to 50.0 V.
Resistor current A
Active power W
Capacitor current A
Reactive power var
Apparent power VA
Source current A
Inductor voltage V
Reactive power var
Resistor voltage V
Active power W
Active power W
Reactive power var
Apparent power VA
Source voltage V
Power factor

Ex. 4-2 – Solving AC Circuits Using the Power Triangle Method Procedure
150 © Festo Didactic 86358-00
9. In LVDAC EMS, open the Metering window. Set meter E3 to measure the rms value of the ac power source voltage .
In the Four-Quadrant Dynamometer/Power Supply window, enable the ac power source. Readjust the value of the No Load Voltage parameter so that the ac power source voltage (indicated by meter E3 in the Metering window) is equal to 100 V.
10. In the Metering window, set the meters to measure the following parameters:
Resistor voltage V
Capacitor voltage V
Inductor voltage V
Source voltage V
Resistor voltage V
Source current A
Capacitor current A
Resistor current A
Active power W
Active power W
Reactive power var
Reactive power var
Active power W
Reactive power var
Apparent power VA
Power factor
11. Compare the circuit parameters measured in the previous step with the circuit parameters you calculated in step 8. Are the values close to each other?
Yes No
12. In the Four-Quadrant Dynamometer/Power Supply window, disable the ac power source.
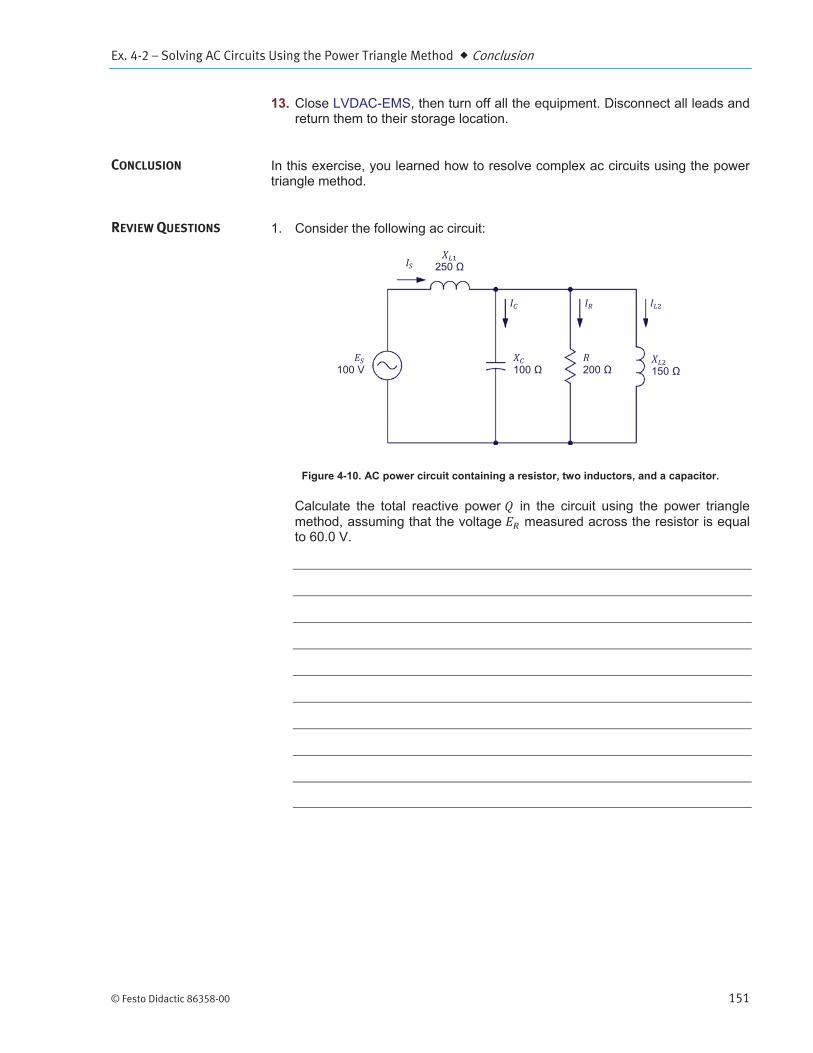
Ex. 4-2 – Solving AC Circuits Using the Power Triangle Method Conclusion
© Festo Didactic 86358-00 151
13. Close LVDAC-EMS, then turn off all the equipment. Disconnect all leads and return them to their storage location.
In this exercise, you learned how to resolve complex ac circuits using the power triangle method.
1. Consider the following ac circuit:
Figure 4-10. AC power circuit containing a resistor, two inductors, and a capacitor.
Calculate the total reactive power in the circuit using the power triangle method, assuming that the voltage measured across the resistor is equal to 60.0 V.
CONCLUSION
REVIEW QUESTIONS
100 V
250
100
200
150

Ex. 4-2 – Solving AC Circuits Using the Power Triangle Method Review Questions
152 © Festo Didactic 86358-00
2. Calculate the source voltage in the ac circuit of Figure 4-10, assuming that the resistor voltage is still 60 V.
3. Calculate the actual total reactive power in the ac circuit of Figure 4-10 using the parameter values you calculated in the previous questions.
4. Calculate the actual source voltage in the ac circuit of Figure 4-10 using the parameter values you calculated in the previous questions.
5. Calculate the power factor of the ac circuit in Figure 4-10 using the parameter values you calculated in the previous questions.
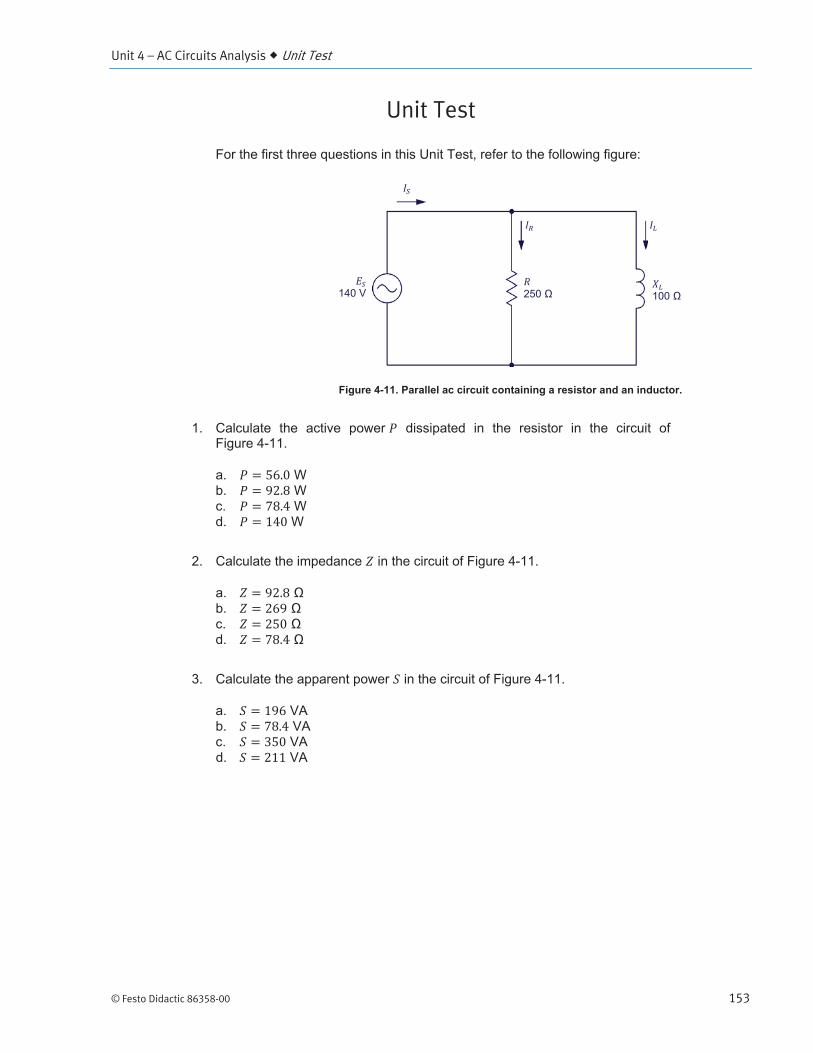
Unit 4 – AC Circuits Analysis Unit Test
© Festo Didactic 86358-00 153
Unit Test
For the first three questions in this Unit Test, refer to the following figure:
Figure 4-11. Parallel ac circuit containing a resistor and an inductor.
1. Calculate the active power dissipated in the resistor in the circuit of Figure 4-11.
a. W b. W c. W d. W
2. Calculate the impedance in the circuit of Figure 4-11.
a. b. c. d.
3. Calculate the apparent power in the circuit of Figure 4-11.
a. VA b. VA c. VA d. VA
140 V
250
100

Unit 4 – AC Circuits Analysis Unit Test
154 © Festo Didactic 86358-00
For questions 4 to 10 of this Unit Test, refer to the following figure:
Figure 4-12. AC circuit containing two resistors, an inductor, and a capacitor.
4. Calculate the active power dissipated in the second resistor ( ) in the circuit of Figure 4-12.
a. W b. W c. W d. W
5. Calculate the apparent power in the capacitor and the second resistor ( ) in the circuit of Figure 4-12.
a. VA b. VA c. VA d. VA
6. Calculate the active power dissipated in the first resistor ( ) in the circuit of Figure 4-12.
a. W b. W c. W d. W
7. Calculate the total reactive power in the circuit of Figure 4-12.
a. var b. var c. var d. var
120 V
100
150
300
200

Unit 4 – AC Circuits Analysis Unit Test
© Festo Didactic 86358-00 155
8. Calculate the apparent power in the circuit of Figure 4-12.
a. VA b. VA c. VA d. VA
9. Calculate the source current in the circuit of Figure 4-12.
a. A b. A c. A d. A
10. Calculate the power factor of the circuit shown in Figure 4-12.
a. b. c. d.

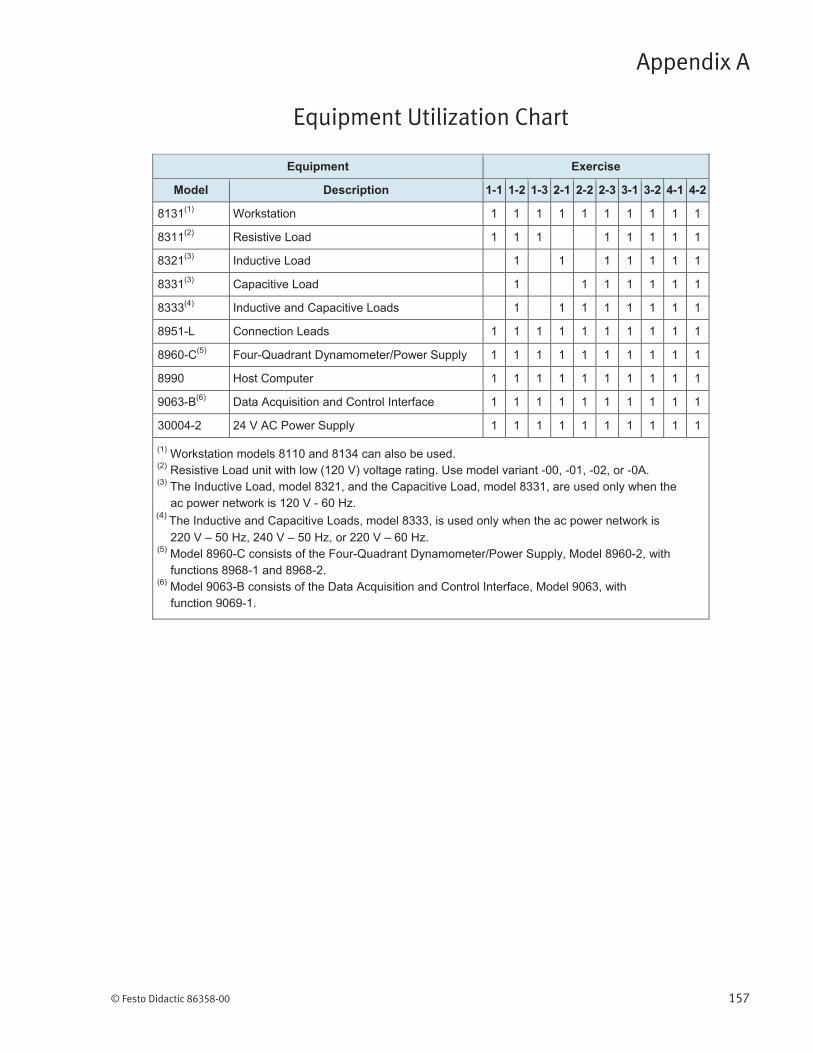
© Festo Didactic 86358-00 157
Equipment Exercise
Model Description 1-1 1-2 1-3 2-1 2-2 2-3 3-1 3-2 4-1 4-2
8131(1) Workstation 1 1 1 1 1 1 1 1 1 1
8311(2) Resistive Load 1 1 1 1 1 1 1 1
8321(3) Inductive Load 1 1 1 1 1 1 1
8331(3) Capacitive Load 1 1 1 1 1 1 1
8333(4) Inductive and Capacitive Loads 1 1 1 1 1 1 1 1
8951-L Connection Leads 1 1 1 1 1 1 1 1 1 1
8960-C(5) Four-Quadrant Dynamometer/Power Supply 1 1 1 1 1 1 1 1 1 1
8990 Host Computer 1 1 1 1 1 1 1 1 1 1
9063-B(6) Data Acquisition and Control Interface 1 1 1 1 1 1 1 1 1 1
30004-2 24 V AC Power Supply 1 1 1 1 1 1 1 1 1 1
(1) Workstation models 8110 and 8134 can also be used. (2) Resistive Load unit with low (120 V) voltage rating. Use model variant -00, -01, -02, or -0A. (3) The Inductive Load, model 8321, and the Capacitive Load, model 8331, are used only when the ac power network is 120 V - 60 Hz. (4) The Inductive and Capacitive Loads, model 8333, is used only when the ac power network is 220 V – 50 Hz, 240 V – 50 Hz, or 220 V – 60 Hz. (5) Model 8960-C consists of the Four-Quadrant Dynamometer/Power Supply, Model 8960-2, with functions 8968-1 and 8968-2. (6) Model 9063-B consists of the Data Acquisition and Control Interface, Model 9063, with function 9069-1.
Equipment Utilization Chart
Appendix A


© Festo Didactic 86358-00 159
active power The power dissipated in a resistive component is referred to as the active power , expressed in watts (W). Active power, as opposed to reactive power, is used by the resistive component to perform work and is not returned to the source. The amount of active power in a component is equal to the average value of the power waveform and can be determined by multiplying the rms values of the voltage and current related to the component.
amplitude The amplitude of a sine wave is the maximum value reached by the sine wave during its cycle. The maximum value is the same for both the positive and negative half-waves of the cycle, except for the polarity which changes from positive (+) to negative (–)
apparent power The apparent power in an ac circuit is equal to the vectorial sum of the active power and reactive power in the circuit. Apparent power is expressed in volt-amperes (VA) and can be calculated using the following equation: .
average power The average power supplied to a circuit component corresponds to the average value of the power waveform related to the component and is equal to the active power dissipated in that component. Thus, in a purely resistive component, the average power is equal to the product of the rms values of the voltage and current related to the component. In the case of purely reactive components, the average power is null.
capacitance The defining characteristic of a capacitor is its capacitance , expressed in microfarads ( F). Capacitance is one of the main factors that determine the opposition to current flow of a capacitor, i.e., its capacitive reactance .
capacitive reactance The capacitive reactance of a capacitor determines the opposition to current flow of the capacitor in ac circuits and is expressed in ohms. The capacitive reactance is inversely proportional to the capacitance of the capacitor and the frequency of the ac power source ( ).
capacitor A capacitor basically consists of two plates of a conductive material (generally a metal) separated by an insulating material. Capacitors, as inductors, oppose current flow in ac circuits. The opposition to current flow of a capacitor is determined by its capacitance. The current flowing in a capacitor leads the voltage across the capacitor by 90°.
frequency The frequency of a sine wave, expressed in hertz (Hz), indicates the number of times the sine wave cycle repeats itself in a second. The frequency of a sine wave is inversely proportional to the period of the sine wave ( ).
impedance The impedance is the total opposition to current flow caused by an array of resistive and reactive components in an ac circuit. Impedance is measured in ohms .
Glossary of New Terms
Appendix B

Appendix B Glossary of New Terms
160 © Festo Didactic 86358-00
inductance The defining characteristic of an inductor is its inductance , expressed in henries (H). Inductance is one of the main factors that determine the opposition to current flow of an inductor, i.e., its inductive reactance .
inductive reactance The inductive reactance of an inductor determines the opposition to current flow of the inductor and is expressed in ohms. The inductive reactance is directly proportional to the inductance of the inductor and the frequency of the ac power source ( ).
inductor An inductor consists basically of a coil of wire wound around an iron core. Inductors, as capacitors, oppose current flow in ac circuits. The opposition to current flow of an inductor is determined by its inductance. The current flowing in an inductor lags the voltage measured across the inductor by about 90°.
instantaneous power Instantaneous power is the product of the rms values of the voltage and current related to a circuit component at each instant of a sine wave cycle. The waveform of instantaneous power (or power waveform) is a squared sine wave having a frequency that is twice the source frequency.
lagging A lagging sine wave is a sine wave whose phase angle is inferior to that of the reference sine wave. In other words, a lagging sine wave occurs after the reference sine wave. A lagging waveform is shifted to the right of the reference waveform on a graph or an oscilloscope display.
leading A leading sine wave is a sine wave whose phase angle is superior to that of the reference sine wave. In other words, a leading sine wave occurs before the reference sine wave. A leading waveform is shifted to the left of the reference waveform on a graph or an oscilloscope display.
negative half-wave The negative half-wave of a sine wave cycle is the portion of the sine wave having a negative (-) polarity.
period The period of a sine wave, expressed in seconds (s), indicates the time required for one complete sine wave cycle to occur. The period of a sine wave is inversely proportional to the frequency of the sine wave ( ).
phase angle The phase angle of a sine wave determines the initial value (i.e., the value at 0) of the sine wave. In other words, the phase angle determines by how much the value of a sine wave differs from 0 at time 0, and thus, the position in time of the sine wave.
phase shift The phase shift between two sine waves having the same frequency measures the difference between the phase angle of each sine wave. The phase shift indicates the extent of the separation in time between the two sine waves, as well as the relationship between the sine waves, i.e., leading, lagging, or in phase.

Appendix B Glossary of New Terms
© Festo Didactic 86358-00 161
phasor A phasor is a vector having its origin at the center (0, 0) of a cartesian plane. A phasor is used to represent a sine wave whose amplitude , phase angle , and frequency do not vary in time (e.g., the voltage, current, or power related to a circuit component).
positive half-wave The positive half-wave of a sine wave is the portion of a sine wave cycle having a positive (+) polarity.
power factor The power factor of a circuit is the ratio between the active power and the apparent power in the circuit ( ). The power factor of a circuit is a dimensionless quantity that varies between 0 (indicating a purely reactive circuit) and 1 (indicating a purely resistive circuit).
power triangle The power triangle related to an ac circuit is a trigonometric representation of the relationship between the active power , reactive power , and apparent power (the adjacent side, the opposite side, and the hypotenuse of a right triangle, respectively) in the circuit. Using the laws of trigonometry, it is possible to calculate the length of any side when the other two are known.
reactance In an ac circuit, the reactance of a component determines its opposition to current flow. Reactance can be of two types, inductive or capacitive, and is expressed in ohms ( ).
reactive power The power in a reactive component (an inductor or a capacitor) is referred to as the reactive power , expressed in reactive volt-amperes (var). Reactive power, as opposed to active power, is not used by the reactive component to perform work and is returned to the source. The amount of reactive power in a component can be determined by multiplying the rms values of the voltage and current related to the component.
vector A vector is the graphical representation of a quantity having a magnitude and a direction.


© Festo Didactic 86358-00 163
The following table gives impedance values which can be obtained using either the Resistive Load, Model 8311, the Inductive Load, Model 8321, or the Capacitive Load, Model 8331. Figure C-1 shows the load elements and connections. Other parallel combinations can be used to obtain the same impedance values listed.
Table C-1. Impedance table for the load modules.
Impedance ( ) Position of the switches
120 V 60 Hz
220 V 50 Hz/60 Hz
240 V 50 Hz 1 2 3 4 5 6 7 8 9
1200 4400 4800 I
600 2200 2400 I
300 1100 1200 I
400 1467 1600 I I
240 880 960 I I
200 733 800 I I
171 629 686 I I I
150 550 600 I I I I
133 489 533 I I I I
120 440 480 I I I
109 400 436 I I I I
100 367 400 I I I I I
92 338 369 I I I I I
86 314 343 I I I I I I
80 293 320 I I I I I I I
75 275 300 I I I I I I I
71 259 282 I I I I I I
67 244 267 I I I I I I I
63 232 253 I I I I I I I I
60 220 240 I I I I I I I I
57 210 229 I I I I I I I I I
Impedance Table for the Load Modules
Appendix C

Appendix C Impedance Table for the Load Modules
164 © Festo Didactic 86358-00
Figure C-1. Location of the load elements on the Resistive Load, Inductive Load, and Capacitive Load, Models 8311, 8321, and 8331, respectively.
Figure C-2 shows the load elements and connections when using the Inductive and Capacitive Loads, Model 8333. All impedance values using two banks of elements or less that are given in Appendix C can also be obtained with this model.
Figure C-2. Location of the load elements on the Inductive and Capacitive Loads, Model 8333.
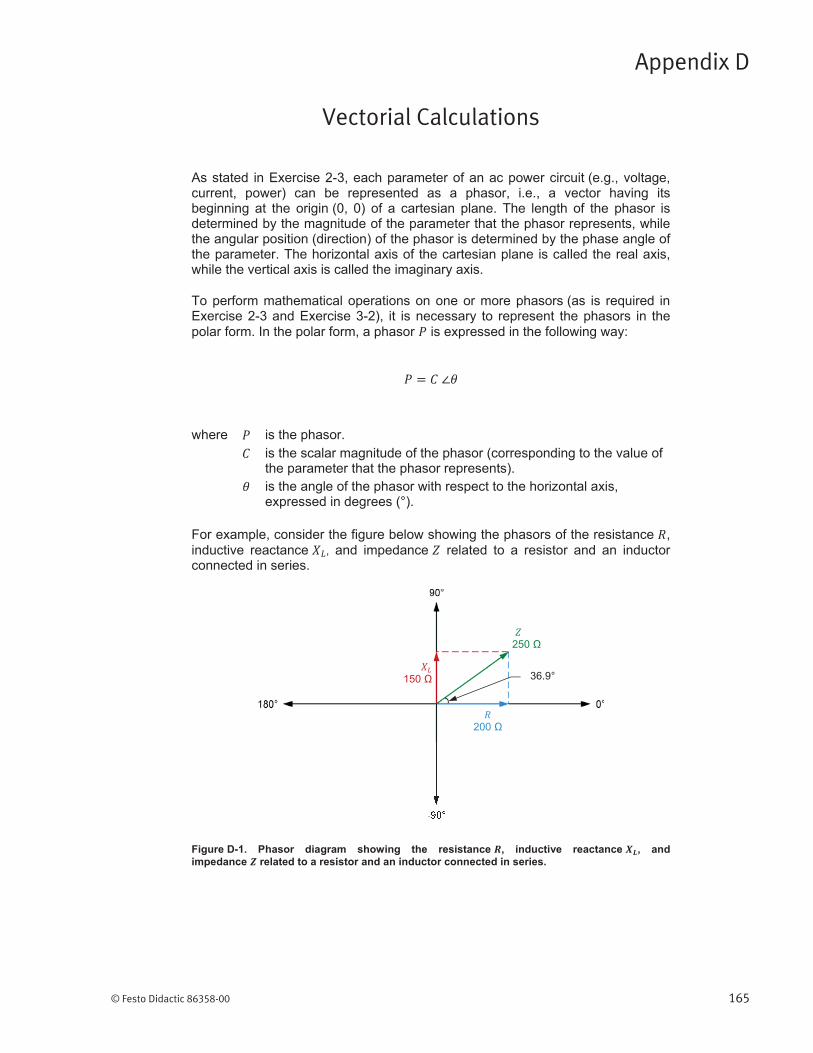
© Festo Didactic 86358-00 165
As stated in Exercise 2-3, each parameter of an ac power circuit (e.g., voltage, current, power) can be represented as a phasor, i.e., a vector having its beginning at the origin (0, 0) of a cartesian plane. The length of the phasor is determined by the magnitude of the parameter that the phasor represents, while the angular position (direction) of the phasor is determined by the phase angle of the parameter. The horizontal axis of the cartesian plane is called the real axis, while the vertical axis is called the imaginary axis.
To perform mathematical operations on one or more phasors (as is required in Exercise 2-3 and Exercise 3-2), it is necessary to represent the phasors in the polar form. In the polar form, a phasor is expressed in the following way:
where is the phasor. is the scalar magnitude of the phasor (corresponding to the value of
the parameter that the phasor represents). is the angle of the phasor with respect to the horizontal axis,
expressed in degrees (°).
For example, consider the figure below showing the phasors of the resistance , inductive reactance , and impedance related to a resistor and an inductor connected in series.
Figure D-1. Phasor diagram showing the resistance , inductive reactance , and impedance related to a resistor and an inductor connected in series.
Vectorial Calculations
Appendix D
150
200
250
36.9°

Appendix D Vectorial Calculations
166 © Festo Didactic 86358-00
In Figure D-1, the polar form of the phasor of the resistance is , while the polar form of the phasor of the inductive reactance is . The angle of the impedance can be calculated using the Pythagorean Theorem [ ]. The polar form of the phasor of the impedance is thus .
When the value of the angle of a phasor is negative, it indicates that the phasor has a negative value on the vertical axis. The polar notation of the capacitive reactance of a capacitor is thus .
Vectorial division
In Exercise 2-3, it is necessary to divide phasors in order to obtain the phasor diagrams related to a resistor, an inductor, and a capacitor. When dividing two phasors ( ) and ( ), the following equation is used:
Figure D-2 shows the phasor diagram related to an ideal inductor in an ac circuit.
Figure D-2. Phasor diagram of the voltage , current , and inductive reactance related to an inductor.
Figure D-2 shows that the phasor of the inductive reactance is 180° out of phase with respect to the phasor of the inductor current . This is because the inductive reactance results from the division of the phasor of the inductor voltage by the phasor of the inductor current, as shown in the calculations below.

Appendix D Vectorial Calculations
© Festo Didactic 86358-00 167
Similarly, the phasor of the capacitive reactance of a capacitor is also 180° out of phase with respect to the capacitor current , as shown in the calculations below.
Vectorial multiplication
In Exercise 3-2, it is necessary to multiply phasors in order to obtain the phasor diagrams related to the active power and reactive power in an ac circuit. When multiplying two phasors ( ) and ( ), the following equation is used:
Figure D-3 shows an ac circuit containing a capacitor and the phasor diagrams related to the capacitor.
Figure D-3. AC circuit containing a capacitor and phasor diagrams related to the capacitor.
90°
90°
-90°
-90°
±180°
±180°
0°
0°

Appendix D Vectorial Calculations
168 © Festo Didactic 86358-00
Figure D-3 shows that the phase angle ( ) of the phasor representing the reactive power in the capacitor has the same value as that of the phasor representing the capacitor current . This is because the reactive power results from the multiplication of the phasors of the capacitor voltage and current , as shown in the calculations below.
Similarly, the phase angle ( ) of the phasor representing the reactive power in an inductor has the same value as that of the phasor representing the inductor current , as shown in the calculations below.

© Festo Didactic 86358-00 169
Various symbols are used in the circuit diagrams of this manual. Each symbol is a functional representation of a particular electrical device that can be implemented using the equipment. The use of these symbols greatly simplifies the number of interconnections that need to be shown on the circuit diagram, and thus, makes it easier to understand the circuit operation.
For each symbol other than those of power sources, resistors, inductors, and capacitors, this appendix gives the name of the device which the symbol represents, as well as the equipment and the connections required to properly connect the device to a circuit. Notice that the terminals of each symbol are identified using circled letters. The same circled letters identify the corresponding terminals in the Equipment and Connections diagram. Also notice that the numbers (when present) in the Equipment and Connections diagrams correspond to terminal numbering used on the actual equipment.
a When a current at inputs I1, I2, I3, or I4 exceeds 4 A (either permanently or momentarily), use the corresponding 40 A input terminal and set the Range parameter of the corresponding input to High in the Data Acquisition and Control Settings window of LVDAC-EMS.
Circuit Diagram Symbols
Appendix E
Equipment and Connections Symbol
Isolated voltage and current measurement inputs
Data Acquisition and Control Interface (9063)
Voltage inputs
Current inputs

Appendix E Circuit Diagram Symbols
170 © Festo Didactic 86358-00
Three-phase induction machine
Four-Pole Squirrel Cage Induction Motor (8221-0)
Induction machine
Three-phase synchronous motor
Equipment and Connections Symbol
Synchronous Motor / Generator (8241-2)
Synchronous motor
Three-phase induction machine
Three-Phase Induction Machine (8221-2)
Induction machine

Appendix E Circuit Diagram Symbols
© Festo Didactic 86358-00 171
Three-phase synchronous generator
Synchronous generator
Synchronous Motor / Generator (8241-2)
Wound-rotor
induction machine
Three-phase wound-rotor induction machine
Three-Phase Wound-Rotor Induction Machine (8231-B)
Equipment and Connections Symbol

Appendix E Circuit Diagram Symbols
172 © Festo Didactic 86358-00
Power diode three-phase full-wave rectifier
Rectifier and Filtering Capacitors (8842-A)
Power thyristor three-phase bridge
Power Thyristors (8841)
Equipment and Connections Symbol Permanent Magnet
Synchronous Machine (8245)
Permanent Magnet Synchronous Machine
PMSM
U
V
W

Appendix E Circuit Diagram Symbols
© Festo Didactic 86358-00 173
Three-phase inverter
IGBT Chopper / Inverter (8837-B)
Equipment and Connections Symbol


© Festo Didactic 86358-00 175
Index of New Terms
a The bold page number indicates the main entry. Refer to the Glossary of New Terms 159 for definitions of new terms.
active power ...................................... 95, 97, 98, 99, 100, 111, 114, 115, 116, 129 amplitude ........................................................................................ 1, 5, 8, 9, 10, 23 apparent power .................................................................... 95, 111, 115, 116, 129 average power ................................................................... 1, 35, 36, 37, 97, 98, 99 capacitance .......................................................................................................... 61 capacitive reactance .................................................... 49, 61, 73, 74, 80, 133, 143 capacitors ......................................................... 37, 47, 48, 49, 61, 62, 76, 143, 145 frequency .......................... 1, 3, 5, 8, 11, 23, 24, 36, 51, 61, 95, 98, 111, 112, 113 impedance ..................................... 49, 71, 75, 76, 77, 78, 129, 131, 132, 133, 134 inductance ...................................................................................................... 51, 52 inductive reactance ...................................................... 49, 72, 73, 74, 80, 133, 143 inductors ................................................ 37, 47, 48, 49, 51, 52, 61, 62, 76, 99, 113 instantaneous power .................................................................... 35, 36, 97, 98, 99 lagging ...................................................................................................... 21, 23, 24 leading ...................................................................................................... 21, 23, 24 negative half-wave ........................................................................................... 2, 35 period ..................................................................................... 1, 5, 8, 11, 23, 24, 36 phase angle ........................................................................ 21, 22, 23, 71, 111, 113 phase shift ........................................................................ 21, 23, 24, 47, 52, 62, 95 phasor ............................... 5, 6, 23, 71, 72, 73, 74, 75, 76, 95, 111, 112, 113, 115 positive half-wave ............................................................................................. 2, 35 power factor ......................................................................... 95, 111, 115, 116, 129 power triangle ............................................................... 95, 111, 115, 129, 143, 144 reactance ........................................................... 49, 51, 52, 71, 73, 75, 76, 77, 131 reactive power ......................... 95, 97, 99, 100, 111, 112, 113, 114, 115, 116, 129 vector ............................................................................................................... 5, 71


© Festo Didactic 86358-00 177
Bibliography
Boylestad, Robert L., Introductory Circuit Analysis, 11th ed., Upper Saddle River: Prentice Hall, 2006, ISBN 978-0131730441.
Wildi, Theodore, Electrical Machines, Drives, and Power Systems, 6th ed., Upper Saddle River: Prentice Hall, 2005, ISBN 978-0131776913.