single-image structured illumination using hilbert
TRANSCRIPT

Single-image structured illuminationusing Hilbert transformdemodulation
Zachary R. HoffmanCharles A. DiMarzio
Zachary R. Hoffman, Charles A. DiMarzio, “Single-image structured illumination using Hilbert transformdemodulation,” J. Biomed. Opt. 22(5), 056011 (2017), doi: 10.1117/1.JBO.22.5.056011.
Downloaded From: https://www.spiedigitallibrary.org/journals/Journal-of-Biomedical-Optics on 9/19/2017 Terms of Use: https://spiedigitallibrary.spie.org/ss/TermsOfUse.aspx

Single-image structured illumination using Hilberttransform demodulation
Zachary R. Hoffmana,b,* and Charles A. DiMarzioa
aNortheastern University, Boston, Massachusetts, United StatesbDraper Laboratory, Cambridge, Massachusetts, United States
Abstract. Structured illumination microscopy (SIM) achieves sectioning at depth by removing undesired lightfrom out-of-focus planes within a specimen. However, it generally requires at least three modulated images withdiscrete phase shifts of 0, 120, and 240 deg to produce sectioning. Using a Hilbert transform demodulation, it ispossible to produce both sectioning and depth information relative to a reference plane (i.e., a coverslip) usingonly a single image. The specimen is modulated at a known frequency, and the unmodulated portion of theimage is estimated. These two components are used to provide a high-quality sectioned image containingboth axial and lateral information of an object. The sectioning resolution with a single image is on par with thatof a control three-image SIM. We are also able to show that when used with three images of discrete phase, thismethod produces better contrast within a turbid media than the traditional SIM technique. Because the traditionalSIM requires alignment of three different phases, small differences in optical path length can introduce strongartifacts. Using the single-image technique removes this dependency, greatly improving sectioning in turbidmedia. Multiple targets with various depths and opaqueness are considered, including human skin in vivo, dem-onstrating a quick and useful way to provide noninvasive sectioning in real time. © 2017 Society of Photo-Optical
Instrumentation Engineers (SPIE) [DOI: 10.1117/1.JBO.22.5.056011]
Keywords: structured Illumination; optical sectioning; thick specimen; turbid media; incoherent light; spatial frequency domainimaging.
Paper 170108R received Feb. 22, 2017; accepted for publication May 11, 2017; published online May 31, 2017.
1 IntroductionIn this paper, we introduce a technique that produces confocal-like optical sectioning from a single structured illuminationmicroscopy (SIM) image. This new method requires a singleN ×M pixel sample, which is time limited only by the framerate of the camera. This allows us to section samples at physio-logically relevant time scales. This is in comparison to confocalmicroscopy and traditional structured illumination, whichrequire either sequential scanning of N ×M pixels or at leastthree frames of data, respectively. The method outlined also pro-duces more robust sectioning within a turbid medium than tradi-tional structured illumination.
Optical sectioning has provided pathologists and clinicianswith the ability to image biological samples noninvasively, at orbelow the surface. In cases such as skin cancer, malignant cellsare often located below the stratum corneum, a layer of cornifiedepithelial cells that occludes living subsurface cells.1 This makesit difficult for a pathologist to determine the health of cells with-out excising the cells for further analysis. Sectioning is used tobuild a depth map of a specimen, measuring axial informationproviding a three dimension or tomographic map to give depthinformation about subsurface objects.2,3 Additionally, opticalsectioning produces higher contrast images by rejecting scat-tered light from out-of-focus planes.4
Currently, the most common method of optical sectioning isconfocal microscopy. Confocal microscopy works by passingreceived light through a pinhole, which rejects out-of-focus
light from reaching the detector. While confocal microscopyproduces sectioning, it also rejects a disproportionally largeamount of light, requiring a high powered source to functionproperly. Additionally, because the pinhole only allows a singlepixel to be imaged at a time, raster scanning is required to build afull two-dimensional image.4,5 Recently, a new method of opti-cal sectioning known as SIM, which does not require the use of apinhole, has been developed. SIM has the advantage of using awidefield imaging technique, eliminating the need to raster scan.A high-frequency pattern is used to modulate the plane of inter-est. Optical sectioning is achieved by decoupling the AC light(in-focus) from the DC light (out-of-focus) of a given image.Decoupling is achieved by phase shifting the pattern to at leastthree different positions and then pairwise subtracting themfrom one another.2,3 SIM, however, has not been used for im-aging within highly scattering media as issues with contrastand phase alignment at depth produce very weak section-ing.6–8 There have been other attempts to overcome these issuesusing many more samples, such as tens of random modulationpatterns, but this comes at the cost of requiring much more datato produce sectioning.9 These factors have greatly limited theusage of SIM, especially with regard to in vivo imaging.
The methods described above require multiple samples overa period of time to produce sectioning, making in vivo imagingdifficult. Also, because SIM requires alignment of three differ-ent phases, small differences in optical path length can introducestrong artifacts, particularly at depth, as we will show later in thispaper. This paper will show that only a single phase is required to
*Address all correspondence to: Zachary R. Hoffman, E-mail: [email protected] 1083-3668/2017/$25.00 © 2017 SPIE
Journal of Biomedical Optics 056011-1 May 2017 • Vol. 22(5)
Journal of Biomedical Optics 22(5), 056011 (May 2017)
Downloaded From: https://www.spiedigitallibrary.org/journals/Journal-of-Biomedical-Optics on 9/19/2017 Terms of Use: https://spiedigitallibrary.spie.org/ss/TermsOfUse.aspx

produce sectioning at depth, providing axial information aboutthe specimen and increasing the contrast.
Using a specialized two-dimensional Hilbert transform,Nadeau et al. showed that only two images are required todecouple the signals from one another.10–12 We directly applythe Hilbert demodulation technique to show that it also workswith sectioning on a micron scale. Additionally, we extend thework by reducing the number of images required from 2 to 1,making single-shot optical sectioning possible. We show thatsubsurface objects can be sectioned through a turbid medium,generating better contrast and resolution than the traditionalthree-phase SIM at depth and evidence for application inin vivo skin imaging.
2 Methods
2.1 Structured Illumination—Conventional Approach
Structured illumination is achieved by projecting high fre-quency, spatially patterned light onto a specimen. The typicalsetup for SIM and for all experimentation throughout thispaper is sketched in Fig. 1. The pattern lies on a plane conjugateto both the CCD and a discrete plane of focus at the specimen.As a result, light scattered from the in-focus plane is modulated,separating it from the out-of-focus light. Separating these twocomponents allows for the removal of unwanted light fromregions above and below the plane of interest. This is accom-plished by measuring a total of three images, typically withphases 0, 120, and 240 deg, and then processing them withthe differencing scheme:2
EQ-TARGET;temp:intralink-;e001;63;426IAC ¼ffiffiffiffiffiffiffiffiffiffiffiffiffiffiffiffiffiffiffiffiffiffiffiffiffiffiffiffiffiffiffiffiffiffiffiffiffiffiffiffiffiffiffiffiffiffiffiffiffiffiffiffiffiffiffiffiffiffiffiffiffiffiffiffiffiffiffiffiffiffiffiffiffiffiffiffiffiffiffiffiffiffiffiffiffiffiffiffiffiffiffiffiffiffiffiffiffiffiffiffiffiffiffiffiffiffiffiffiffiffiffiffiffiffiffiffiffiffiffiffiffiðI0 deg − I120 degÞ2 þ ðI0 deg − I240 degÞ2 þ ðI120 deg − I240 degÞ2
q; (1)
where I is a 2-D array of the lateral coordinates x and y.When selecting the frequency of the modulation pattern,
there is a trade-off between sectioning depth and sectioning res-olution. A high-frequency pattern will produce higher section-ing resolution as it quickly blurs away from the conjugate plane.However, it becomes difficult to resolve at depth, limiting theabsolute sectioning depth. Using a lower frequency patternwill result in poorer sectioning resolution but good sectioningdepth. The absolute value of the resolutions will depend onthe numerical aperture (NA) of the system. However, for thispaper, we use a single-modulation pattern of 40 cycles∕imagefor all depths and samples to simplify comparison across all sce-narios. This particular value was selected to achieve a reasonablesectioning resolution (∼2 μm) and sectioning depth (∼30 μm).At these sizes, we will be able to section at biologically relevantsizes and depth, specifically when considering skin cells and atdepths located near the junction of the epidermis and dermis.1
Also, because we have used only a single modulation frequency,data acquisition time and processing will remain constant for alltargets and depths.
2.2 Spatial Frequency Domain Imaging—UsingHilbert Transform
To achieve single-image sectioning, we extend the spatial fre-quency domain imaging (SFDI) work done by Nadeauet al.12 Similar to SIM, SFDI functions by modulating an imagewith a known frequency and phase. SFDI works to separate the
absorption coefficient (μa) and reduced scattering coefficient(μ 0
s) of a material, which have differing sensitivities to the spatialfrequency of the projected light. As a result, μa and μ 0
s can bedecoupled using the DC and AC portions of the signal,respectively.13–15 In SIM, we use the same principal to decouplein-focus and out-of-focus light.
Conventional SFDI requires three phases to be measuredalong with one image without modulation, for a total of fourimages. Recent advancements in signal processing and SFDIhave produced a method of demodulating an image of unknownphase, frequency, and angle using the 2-D Hilbert transform.Developed by Larkin et al.,10,11 a spiral function is applied todemodulate a 2-D fringe pattern of unknown frequency andphase. In the two-dimensional case, the Hilbert transform isapplied using the spiral function, where u and v are positionalindices within the frequency domain:
EQ-TARGET;temp:intralink-;e002;326;198Sðu; vÞ ¼ uþ ivffiffiffiffiffiffiffiffiffiffiffiffiffiffiffiffiffiffiffiðu2 þ v2Þ
p ; (2)
which has the benefit of being agnostic to both the frequencyand angle of the modulation pattern. This Hilbert demodulationtechnique was leveraged by Nadeau et al.12 to perform fast,accurate SFDI processing. With this method, only two imagesare required to decouple μa and μ 0
s . SIM and SFDI differ in thatthe higher frequency modulation of SIM quickly goes out-of-focus away from the focal plane. As such, we treat the in-focusand out-of-focus regions as separate, distinct regions.
Fig. 1 Layout of the experimental setup. The dashed lines representplanes that are conjugate to one another. This focuses a pattern fromthe DMD onto a discrete plane of the specimen (after the objective)and relays this back onto the camera.
Journal of Biomedical Optics 056011-2 May 2017 • Vol. 22(5)
Hoffman and DiMarzio: Single-image structured illumination using Hilbert transform demodulation
Downloaded From: https://www.spiedigitallibrary.org/journals/Journal-of-Biomedical-Optics on 9/19/2017 Terms of Use: https://spiedigitallibrary.spie.org/ss/TermsOfUse.aspx

2.3 One-Dimensional Simulation
Using a one-dimensional simulation, we describe how the in-focus light (AC) and out-of-focus light (DC) components froma signal can be isolated from one another. For the simulation, the“Hilbert” function from Mathworks MATLAB v2015a is usedbut serves as a suitable stand-in for the spiral function whenapplied to the two-dimensional cases going forward.
First, synthetic data are generated to demonstrate the algo-rithm. Here, the synthetic data represent a spatially varying sig-nal in one direction, a simplified version of the two-dimensionalimages, which will be considered later on. This is the signal thatwill lie in the conjugate plane, just beyond the objective inFig. 1. A random signal is constructed with a mean of 0.5,which represents the signal we hope to extract from a givenfocal plane (shown in green in Fig. 2). A modulation patternis constructed as MðxÞ ¼ 0.25 cosð2πfxÞ þ 0.5, which is the
patterned light that will be projected by the digital micromirrordevice (DMD). This modulation pattern represents an irradiancepattern projected onto the sample, which has a mean of 0.5 andranges from 0.25 to 0.75 (shown by the dashed blue line) andmultiplied by the in-focus signal (RIF). Independently, a secondlow spatial frequency, random pattern is created to represent theout-of-focus light (ROF, shown in red). This signal is generatedwith low spatial frequency, as it represents the background scat-tered light from regions outside the conjugate plane.
To simulate some error, we couple about 2% modulation intothe out-of-focus light to visualize how small errors, such asimperfect focusing, will impact the final reconstruction. At theextremes, 100% of the modulation pattern would exist in theout-of-focus signal, making it impossible to decouple the twosignals, thus, producing no sectioning at all, whereas as an errorof 0% would produce a perfect reconstruction, with infinitelysmall sectioning resolution. Here, the small error is used to
Fig. 2 All data in raw samples (unitless counts). (a) The low frequency out-of-focus and high frequencyin-focus signals that are combined with themodulation pattern, as described in Eq. (3). (b) Power spectraldensity of the measured signal before and after the DC component is removed. We can see the modu-lation pattern present at ∼150 cycles∕image. (c) Time-series data of the signals before (black) and aftersignal subtraction (yellow). (d) The recovered in-focus portion of the signal using the Hilbert transform ascompared to the original signal.
Journal of Biomedical Optics 056011-3 May 2017 • Vol. 22(5)
Hoffman and DiMarzio: Single-image structured illumination using Hilbert transform demodulation
Downloaded From: https://www.spiedigitallibrary.org/journals/Journal-of-Biomedical-Optics on 9/19/2017 Terms of Use: https://spiedigitallibrary.spie.org/ss/TermsOfUse.aspx

ensure that our simulation accurately models these imperfec-tions. The 2% value is intended to show a small amount oferror expected in real-world data, while still demonstrating theaccuracy of the simulation/technique. The in-focus and out-of-focus signals are then added together to construct the simulatedsignal, shown in black. The construction of the signal is thus
EQ-TARGET;temp:intralink-;e003;63;686ΓðxÞ ¼ 0.5MðxÞRIFðxÞ þ 0.48ROFðxÞ þ 0.02MðxÞROFðxÞ;(3)
where ΓðxÞ represents the fully modulated signal, which is com-posed of the modulated in-focus portion and partially modulatedout-of-focus light.
The modulated in-focus portion of the signal is recovered bysubtracting the combined in-focus and out-of-focus signals,without modulation:
EQ-TARGET;temp:intralink-;e004;63;576ΓIFðxÞ ¼ ΓðxÞ − RðxÞ: (4)
The unmodulated portion, RðxÞ, can be independently mea-sured without projecting a modulation pattern [simulated here,RðxÞ ¼ 0.5 � ½ROFðxÞ þ RIFðxÞ�] or estimated by filtering outthe modulation pattern, as we will do later in this paper. InEq. (4), we are left with the modulated in-focus portion of light.The in-focus section can then be reconstructed using the“Hilbert” function to demodulate the signal as follows:
EQ-TARGET;temp:intralink-;e005;63;468RIFðxÞ ¼ RðxÞ þ ji fΓIFðxÞgj: (5)
We have now successfully decoupled the in-focus lightfrom the background. To show the accuracy of the technique,Fig. 2(d) shows an estimation of the in-focus light comparedto the original signal. We note that there is some loss in accuracydue to modulation from some of the out-of-focus regions. Thistype of error will manifest itself as a loss of contrast, particularlyin regions of high-spatial frequency. In the above simulation,RðxÞ was known and subtracted from the modulated signal.This can be achieved by measuring the signal twice: one meas-urement with modulation and one without. However, similarresults can also be achieved with only one measurement, as willbe shown in the next section. Rather than trying to measure theunmodulated signal, it is estimated by filtering out the modu-lated portion of the image. In both scenarios, this unmodulatedportion is then subtracted from the modulated measurement.
2.4 Structured Illumination—Single Image Approach
By projecting a high-frequency modulation pattern under planarillumination, at a plane conjugate to the CCD, all components ofthis plane are spatially shifted outside the broadband signal. Thisscattered out-of-focus light remains centered in the baseband ofthe spatial frequency domain due to the pattern being blurredoutside of the focal plane. In Sec. 3.2, a method of decouplingthe in-focus and out-of-focus signals, which can readily beadapted to this type of 2-D application, is described. Our algo-rithm, outlined in Fig. 3, describes the process required to sep-arate the modulated and unmodulated images, producing a high-contrast sectioned image. In the interest of developing an opticalsectioning system with the least number of samples required, wehave extended this work to function using only a single sample.Using a single sample will prove to be extremely useful in real-time biological imaging. Specifically, motion artifacts can createconstraints on any method that requires multiple samples of data
for reconstruction. As long as there is minimal movement withinthe integration time of the frame, a single sample will suffice inproducing high-quality sectioned images in vivo. Also, in com-parison to the three-phase SIM, there is no need to finely alignmultiple phases of data, making our method particularly robustat depth.
In the 1-D simulation, we directly measure the broadbandsignal without modulation. With this new method, only a singleimage, which contains both the in-focus and out-of-focus com-ponents and the modulation pattern, is measured. Using a com-bination of a low-pass filter and a notch filter, which are definedbased on the frequency of the modulation pattern, the low fre-quency information from the out-of-focus light is estimated, asshown in Fig. 4. It should be noted that, for these experiments, ageneric Gaussian filter is applied to eliminate the modulationpattern. However, the selection of this filter will differ depend-ing on the frequency and angle of the modulation patternapplied, i.e., the region of data that will be filtered within thefrequency domain. For our experimental data, the frequency(40 cycles∕image) and angle (30 deg) are known ahead oftime and can be tuned to filter out the first orders of the modu-lation pattern. From multiple experimental datasets, we haveempirically selected a Gaussian filter with a full width, halfmax, of 10 cycles, providing the best sectioning results. Thisestimated unmodulated image can then be subtracted fromthe image, leaving only the modulated in-focus signal. As wedescribed in Sec. 3.2, we apply the Hilbert transform using thespiral function technique to remove the modulation pattern fromthe in-focus signal. The result is a sectioned image that has beendemodulated. Depending on how well RðxÞ is estimated, thesuccess of the demodulation will vary; for instance, we mayfind some residual banding if the modulation pattern cannotbe completely filtered out. However, it is shown that our methodprovides good sectioning over a wide variety of situations.
2.5 Experimental Setup
A 635-nm LED with a line width of 17 nm was used as the lightsource. The patterns were projected onto the specimen using aTI Lightcrafter DMD. The images were then captured using anAllied Vision Guppy PRO F-125 CCD camera. The objectivehas a nominal magnification of 10× in air with a NA of0.25. When combined with the tube lens, the system has anoverall magnification of 9×. The configuration of the micro-scope is outlined in Fig. 1 and is used for all data capturedthroughout this paper.
Fig. 3 Flow chart outlining the single-image sectioning process.
Journal of Biomedical Optics 056011-4 May 2017 • Vol. 22(5)
Hoffman and DiMarzio: Single-image structured illumination using Hilbert transform demodulation
Downloaded From: https://www.spiedigitallibrary.org/journals/Journal-of-Biomedical-Optics on 9/19/2017 Terms of Use: https://spiedigitallibrary.spie.org/ss/TermsOfUse.aspx

3 ResultsTo show that this technique is comparable to ordinary SIM, wemust be able to verify that we can accurately extract topographicand tomographic information. In cases of biological samples,such as skin imaging, we would like to isolate planes of focuslocated within the sample, which would otherwise be occludedby scattered light from surrounding layers. To test the topo-graphic capabilities of the system, a paper card, which containsmultiple layers of fibers positioned at various unknown depths,is imaged. Each single image result is compared against the typ-ical three-phase sectioning method of SIM to ensure the accu-racy of the results. A widefield image is also constructed bysumming each of the three phase images together. This simu-lates an image of the specimen as it would be seen through aconventional microscope without any sectioning. Next, a tomo-graphic phantom is constructed based on Glazowski andZavislan.16 A 1951 Air Force resolution chart is placed 30 μmbelow a piece of ground glass, which serves as a source of scat-tering. Between the two planes, ultrasonic gel with an index ofrefraction of 1.33 is used to simulate water contained within theskin tissue.
3.1 Single Image Results
We start by sectioning a business card, which contains multiplelayers. To compare to the three-phase SIM, three total imagesare taken with phases of 0, 120, and 240 deg. Each imageencompasses a 402 × 538 μm region, with a square wave modu-lation pattern of frequency ∼40 cycles∕image projected at anarbitrary angle of 30 deg. The images are processed usingEq. (1) to produce the demodulated AC signal. Then, only asingle phase image is processed using the Hilbert techniquedeveloped above.
Figure 5 shows a comparison of the wide-field (a) versus thethree image sectioning (b) and single-image sectioning (c). It isclear that both methods remove a great deal of light from the out-of-focus regions, isolating a single plane-of-interest. Additionally,the contrast is greatly improved in the remaining regions. Thereare some small artifacts in the single-image sectioning. Specifi-cally, some banding remains from an imperfect estimation of theDC image. Additionally, there are some edge effects from theapplication of the Hilbert function. Taking the differencebetween the three-phase SIM and single-phase SIM, there areonly small changes between images (σ ¼ 0.14, where the images
Fig. 4 (a) Frequency domain of a modulated image with AC pattern visible along the horizontal axis,scale bar is in dB. (b) Frequency domain of image after a notch and low-pass filter has been appliedto estimate the DC signal.
Fig. 5 Image of a business card at depth. (a) The widefield image with no sectioning is shown. (b) Thethree-phase SIM reconstruction is shown. (c) The single-image demodulation is shown.
Journal of Biomedical Optics 056011-5 May 2017 • Vol. 22(5)
Hoffman and DiMarzio: Single-image structured illumination using Hilbert transform demodulation
Downloaded From: https://www.spiedigitallibrary.org/journals/Journal-of-Biomedical-Optics on 9/19/2017 Terms of Use: https://spiedigitallibrary.spie.org/ss/TermsOfUse.aspx

are scaled from 0 to 1). However, on the whole, we produce ahigh-quality sectioned image, providing good isolation of a sin-gle plane, quite comparable to the three phase reconstruction.Furthermore, we have been able to produce this image withone-third the number of samples as required by traditional SIM,decreasing the measurement time from 150 to 50 ms. In thisexperiment, Fig. 6 quantifies the difference between the actualand estimated DC images, with the vast majority of pixels withina few percent (σ ¼ 0.01).
3.2 Image Results from Multiple Depths
By building a z-stack from 25 individually processed images, afull map has been built of each specimen across a depth of25 μm at 1-μm increments, as shown in Fig. 7. The same modu-lation frequency is used across all depths, where three phases aretaken at each depth. These data can be used to verify the axialresolution and isolation of planes through the construction of ahigh depth-of-field (DoF) image. To show the extended DOF,we use a maximum intensity projection, which combines thepixels with the highest amplitude from each depth into a singleimage. This projection removes all scattered light and shows theentire specimen in focus along the z-axis, helping to visualizethe two-dimensional structure without any occlusion from thelayer above or below the focal plane.
For this data, we use the three-phase SIM as our ground truthand qualitatively compare it to our single image method. Weshould expect to see individual fibers existing on discrete planes,as well as continuity along each of the fibers. Reviewing Fig. 7,we see how well the single-image sectioning is able to sectionthe image. It is clear that the fibers are well isolated from oneanother, on par with typical SIM methods. Figure 8 shows thestructure of the fibers. Here, even the smaller fibers are retainedproviding good resolution and reconstruction of the card. Whencomparing the two height maps to one another, we find that alllayers sectioned using the single-image technique are within�3 μm. Similar to the single image above, the large DoF imagematches within a few percent (σ ¼ 0.14, where the image ampli-tude is scaled from 0 to 1).
3.3 Sectioning Versus Depth
Additionally, we want to ensure that this method works at depth,even when the plane of interest is occluded by scattering layersabove and below the plane of interest. To model skin imaging,we have built a phantom, as developed and demonstratedby Glazowski and Zavislan,16 for testing sectioning in highlyscattering media. This phantom consists of a 1951 Air Forceresolution chart at a depth of 30 μm below a piece of highlyscattering ground glass. The space between the target and the
Fig. 6 DC images shown of the business card from Fig. 5, representing the out-of-focus portions of thecard. Both (a) and (b) are scaled from 0 to 1. (a) The actual DC image taken without modulation patternpresent. (b) The estimated DC image by filtering as described above. (c) Difference between the twoimages. The color bar on (c) represents the normalized difference between the two.
Fig. 7 Height map of a business card from 0 to 25 μm at 1-μm increments. (a) Three-phase SIM and(b) single-image SIM.
Journal of Biomedical Optics 056011-6 May 2017 • Vol. 22(5)
Hoffman and DiMarzio: Single-image structured illumination using Hilbert transform demodulation
Downloaded From: https://www.spiedigitallibrary.org/journals/Journal-of-Biomedical-Optics on 9/19/2017 Terms of Use: https://spiedigitallibrary.spie.org/ss/TermsOfUse.aspx

glass has been impregnated with a gel (n ¼ 1.33) to simulatewater. The objective lens has been increased to 20× NA ¼ 0.4;otherwise, all other components of the optical setup are thesame, as described in Sec. 3.5.
As demonstrated in Fig. 9, the resolution chart was imagedusing both the three-phase and single-phase SIM. In the wide-field image (d), we see the structure present from the resolutionchart below, but the contrast is low due to scattered light fromthe ground glass above. Reviewing the three-phase SIM, we
notice that the sectioning is poor (e). This is likely due to smallchanges in the phases of the modulation patterns as it passesthrough multiple surfaces before reaching the focal plane.7,8
Because three images are used, sectioning is highly dependenton how well each of the three phases overlaps at the focal plane.Any changes in phase are liable to produce artifacts at theintended target. This can be slightly mitigated using additionalphases or multiple random patterns, but at the cost of additionalsamples.9,17 For this experiment, the phase changes are likely
Fig. 8 Maximum intensity projection of a business card from 0 to 25 μmat 1-μm increments. The intensityfor each image is normalized and mapped from 0 to 1. (a) Three-phase SIM and (b) single-image SIM.
Fig. 9 1951 Air Force resolution target 30-μm below skin phantom. The chart displays group 6, elements2 to 6, which encompasses resolutions of ∼7.0 to ∼4.4 μm. The top row shows the single-phasereconstruction on each of three phases, (a) 0 deg, (b) 120 deg, and (c) 240 deg, demonstrating the effec-tiveness regardless of modulation phase. (d) Widefield image with strong cluttering from out-of-focusregions. (e) Three-phase sectioning exhibiting major distortions due to local phase shifts from turbidmedia. (f) Average of all three single phase images (a)–(c), providing additional noise reduction.
Journal of Biomedical Optics 056011-7 May 2017 • Vol. 22(5)
Hoffman and DiMarzio: Single-image structured illumination using Hilbert transform demodulation
Downloaded From: https://www.spiedigitallibrary.org/journals/Journal-of-Biomedical-Optics on 9/19/2017 Terms of Use: https://spiedigitallibrary.spie.org/ss/TermsOfUse.aspx

due to differences in the optical path length from the rough sur-face of the ground glass above the target. However, with in vivoimaging, phase misalignment may be exacerbated by a host offactors, such as vibration, diffusion, and small changes in indexof refraction, all of which can be overcome using our single-phase sectioning system.
As expected, the single-phase sectioning provides much bet-ter resolution as it is much less sensitive to phase. Because thespiral function used for the Hilbert transform does not requirea-priori knowledge, small deviations in the frequency or angleof the pattern do not negatively impact the sectioning. Thisresults in a much more robust method of sectioning at depth.Figures 9(a)–9(c) show good contrast at the target, isolating asingle plane from the scattered light. We show that the process-ing works regardless of the phase, as long as the modulationpattern is present [(a) 0 deg; (b) 120 deg; (c) 240 deg]. By takingthe mean of all three phases after they have been individuallyprocessed, we see that there is a further improvement innoise reduction and contrast [Fig. 9(f)]. Figure 10 shows thecontrast improvement, by taking a cross-section of the imagealong group 6, element 4, with a line width of 5.52 μm [outlinedin red in Fig. 9(d)]. There is a clear difference in the contrast ofthe signal as the scattered light from above the target has beenremoved. Note that there is a small trend along the resolutionchart; this is due to slight nonuniformities in the lighting ofour sample and is not related to the target itself. By calculatingthe relative contrast (max–min) for each cycle, there is a 2×improvement in the vertical direction and a 5× improvementin the horizontal direction. The three-phase sectioning hasbeen left out as the bars are no longer resolvable at this depth.
A measurement of the resolution chart was also taken at thesurface (depth ¼ 0 μm) to verify that the system is diffractionlimited (Resolution ¼ 1.22λ∕NA). We find that the minimumresolution at the surface is ∼2.0 μm, which agrees with ourexpectations. As we attempt to image the chart at depth, therewill be considerable resolution loss due to the scattering of lightabove the target. In Fig. 9(d), it can be seen that, without anysectioning, the resolution varies quite a bit but, at best, has
a resolution of about 5.5 μm (group 6, element 4, highlightedin red). Reviewing Fig. 9(f), it can be seen that the next elementdown (group 6, element 3) is now visible, having increased thelateral to ∼4.9 μm. Therefore, at a depth of 30 μm, we find thereto be a 2.75x loss of resolution. However, after sectioning, thiscan be modestly improved.
3.4 Three-Phase Structured Illumination Microscopyat Depth
To better understand why the three-phase sectioning sufferswithin a turbid media, we have imaged the square pattern ona mirror at the surface (d ¼ 0 μm) and within our skin phantom(d ¼ 10 μm; Fig. 11). Taking the cross-sections, how the rela-tive phase and frequency begin to diverge can be seen. Theamplitude from the surface measurements (left) extends from0.1 to 1×, the total dynamic range of the camera, whereas atdepth, the signal contrast is cut in half. As a result, the sectioningcontrast of traditional SIM is greatly degraded, achieving amaximum amplitude of 0.5. Additionally, the phase of each sig-nal is shifted slightly, creating a low frequency modulation,which does not actually exist on the mirror. As we attempt toimage the pattern beyond 10 μm, these errors are greatly exac-erbated, rendering the final three-phase sectioned image nearlyuseless. The alignment of these patterns is critical for the successof the three-phase SIM. However, our single-phase technique isrobust to small changes in frequency and phase and, therefore,produces high-quality sectioning in these scenarios.
3.5 Sectioning Biological Samples
To further validate the method, sectioning was applied to a num-ber of biological samples, including onion cells and in vivo tothe skin of a human arm. Again, a square modulation pattern of40 cycles∕image is projected horizontally to modulate theimage. Two layers of onion cells were placed directly on top ofone another. The system was focused at the top layer of cells, asshown in Fig. 12. The widefield image [Fig. 12(a)] shows multi-ple cells aligned diagonally across the image. Scattered light
Fig. 10 From Fig. 9, group 6, element 4, outlined in red, cross-sections along the (a) vertical bars and(b) horizontal bars are compared. The red line is taken from Fig. 9(d) and compared to the blue line takenfrom 9(f). This shows the contrast improvement and removal of DC signal using the single-phasesectioning.
Journal of Biomedical Optics 056011-8 May 2017 • Vol. 22(5)
Hoffman and DiMarzio: Single-image structured illumination using Hilbert transform demodulation
Downloaded From: https://www.spiedigitallibrary.org/journals/Journal-of-Biomedical-Optics on 9/19/2017 Terms of Use: https://spiedigitallibrary.spie.org/ss/TermsOfUse.aspx

from the cells below the surface can be seen in the image.The single-image sectioning [Fig. 12(c)] works in removingthe scattered light from below. However, there are strong band-ing artifacts due to an imperfect demodulation. This imperfectdemodulation comes as a result of data loss, where the patternedlight goes to zero. This banding is exacerbated by choosing alow frequency modulation pattern. A higher frequency patternwould produce more uniform sectioning; however, it woulddecrease our sectioning depth. In clinical application, adjustingthe frequency of the modulation pattern relative to the imagingdepth might be worth considering. Adding in the other twophases ameliorates this issue by filling gaps of data loss. By
processing the other two phases and adding them together[Fig. 12(d)], we see that the results are nearly identical to thethree-phase sectioning [Fig. 12(b)]. In comparison to the tradi-tional three-phase SIM, the results show that similar sectioningand resolution can be achieved through the methods devel-oped above.
One particularly strong advantage of our method is therobustness of sectioning within a turbid media. Figure 13 showsthe layer of onion cells about 5 μm below the cells, as shown inFig. 12. The scattered light from the cells above can be seenclearly in the widefield image (A). Again, the single-image sec-tioning (C) produces high-quality sectioning with only minimal
Fig. 11 Cross-sections of a modulation pattern projected on a mirror at (a) d ¼ 0 μm and (b) d ¼ 10 μm.All three phases are plotted as well as the sectioned signal using Eq. (1).
Fig. 12 Two layers of onion cells. This figure shows the top layer(depth ¼ 0 μm). Scale bar is 20 μm. (a) Widefield image from addingall three phases. (b) Traditional three-phase sectioning. (c) Single-phase sectioning using Hilbert demodulation. (d) Three images sec-tioned using Hilbert demodulation then added together.
Fig. 13 Two layers of onion cells, this figure shows the bottom layer(depth ¼ 5 μm). Scale bar is 20 μm. (a) Widefield image from addingall three phases. (b) Traditional three-phase sectioning. (c) Single-phase sectioning using Hilbert demodulation. (d) Three images sec-tioned using Hilbert demodulation then added together.
Journal of Biomedical Optics 056011-9 May 2017 • Vol. 22(5)
Hoffman and DiMarzio: Single-image structured illumination using Hilbert transform demodulation
Downloaded From: https://www.spiedigitallibrary.org/journals/Journal-of-Biomedical-Optics on 9/19/2017 Terms of Use: https://spiedigitallibrary.spie.org/ss/TermsOfUse.aspx
artifacts. When adding all three phases together (D), the advan-tages over the traditional SIM method (B) can be seen; first,many artifacts in traditional SIM can be seen around theedges, reducing total contrast within the image. Additionally,there is some residual modulation pattern within the image.After the sectioning is applied, the two layers are completelyseparated from one another. Given that onion cells have a thick-ness of ∼2 to 3 μm, this experiment demonstrates that our axialresolution is ∼3 μm.
Finally, we apply our sectioning method directly to in vivosectioning of human skin. The results are shown in Fig. 14. Thewidefield image shows very little detail as there is a great deal ofscattering. Given the frame rate (21 Hz) of the camera, there ismotion from frame to frame. The motion results from many fac-tors including muscle twitches beneath the skin, as well as largermovements due to breathing and heartbeats. Due to all of thismotion, the traditional three-phase imaging (B) is completelydistorted. The differencing scheme relies on only the modulationchanging phase but does not account for motion within thespecimen itself. With the specimen changing location overthe three frames, the result does not contain useful information.Reviewing Fig. 14(b), only highly reflective portions of theimage are seen in the processed image. However, there is noindication of structure, such as nuclei, which would presentthemselves as dark circles within the tissue. This is an importantdetail as even minor changes in position of the pattern can resultin major degradation of the sectioned image.
Applying the single-image processing (C) provides goodsectioning and contrast of the cells below the surface. Here, wecan see the granular layer of the skin, where the dark spots(shown by the superimposed arrows) point out the nucleus of
the cells. The depth, dimension, and relative sizes appear toagree with those shown by Rajadhyaksha et al.4 Furthermore,the three phases can be added together (D) to increase the con-trast of the image. For images that contain motion, the contrast isimproved. As compared to the differencing method (B), thereare only minor motion artifacts; otherwise, the method ismuch more robust to small changes in the pattern position.
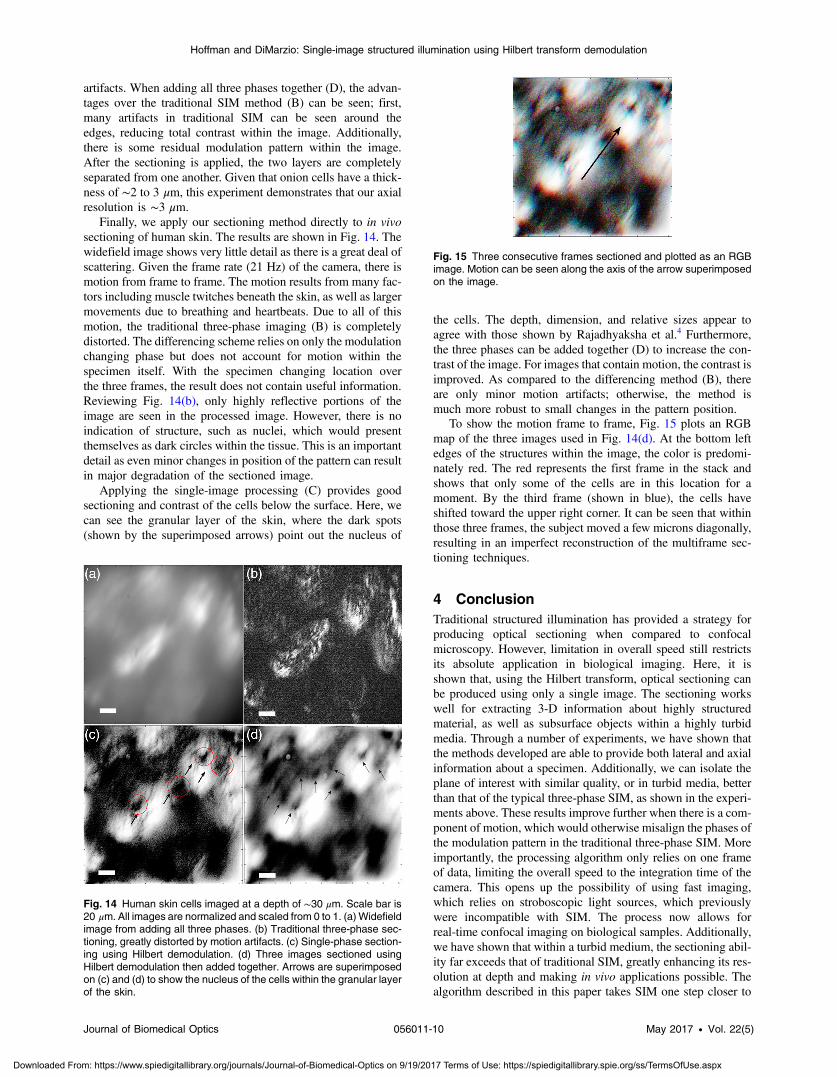
To show the motion frame to frame, Fig. 15 plots an RGBmap of the three images used in Fig. 14(d). At the bottom leftedges of the structures within the image, the color is predomi-nately red. The red represents the first frame in the stack andshows that only some of the cells are in this location for amoment. By the third frame (shown in blue), the cells haveshifted toward the upper right corner. It can be seen that withinthose three frames, the subject moved a few microns diagonally,resulting in an imperfect reconstruction of the multiframe sec-tioning techniques.
4 ConclusionTraditional structured illumination has provided a strategy forproducing optical sectioning when compared to confocalmicroscopy. However, limitation in overall speed still restrictsits absolute application in biological imaging. Here, it isshown that, using the Hilbert transform, optical sectioning canbe produced using only a single image. The sectioning workswell for extracting 3-D information about highly structuredmaterial, as well as subsurface objects within a highly turbidmedia. Through a number of experiments, we have shown thatthe methods developed are able to provide both lateral and axialinformation about a specimen. Additionally, we can isolate theplane of interest with similar quality, or in turbid media, betterthan that of the typical three-phase SIM, as shown in the experi-ments above. These results improve further when there is a com-ponent of motion, which would otherwise misalign the phases ofthe modulation pattern in the traditional three-phase SIM. Moreimportantly, the processing algorithm only relies on one frameof data, limiting the overall speed to the integration time of thecamera. This opens up the possibility of using fast imaging,which relies on stroboscopic light sources, which previouslywere incompatible with SIM. The process now allows forreal-time confocal imaging on biological samples. Additionally,we have shown that within a turbid medium, the sectioning abil-ity far exceeds that of traditional SIM, greatly enhancing its res-olution at depth and making in vivo applications possible. Thealgorithm described in this paper takes SIM one step closer to
Fig. 14 Human skin cells imaged at a depth of ∼30 μm. Scale bar is20 μm. All images are normalized and scaled from 0 to 1. (a) Widefieldimage from adding all three phases. (b) Traditional three-phase sec-tioning, greatly distorted by motion artifacts. (c) Single-phase section-ing using Hilbert demodulation. (d) Three images sectioned usingHilbert demodulation then added together. Arrows are superimposedon (c) and (d) to show the nucleus of the cells within the granular layerof the skin.
Fig. 15 Three consecutive frames sectioned and plotted as an RGBimage. Motion can be seen along the axis of the arrow superimposedon the image.
Journal of Biomedical Optics 056011-10 May 2017 • Vol. 22(5)
Hoffman and DiMarzio: Single-image structured illumination using Hilbert transform demodulation
Downloaded From: https://www.spiedigitallibrary.org/journals/Journal-of-Biomedical-Optics on 9/19/2017 Terms of Use: https://spiedigitallibrary.spie.org/ss/TermsOfUse.aspx

producing high-contrast images at depth, approaching the qual-ity of confocal with the advantage of sectioning in real time.
Using structured illumination for sectioning within turbidmedia has always been difficult due to loss of contrast andthe need for exact alignment of phases. As a result of this andthe need for multiple images to produce high-quality sectioning,SIM has never been a serious tool in skin imaging. However, themethods we have developed in this paper overcome many ofthese limitations, taking SIM much closer to producing confocallike images. Using only a single frame, we have shown thathigh-quality sectioning can be produced even within tens ofmicrons deep within highly scattering media, such as skin. Thismethod makes SIM a powerful new tool for in vivo and real-timeimaging of biological samples.
DisclosuresThe authors declare no conflicts of interest exist.
AcknowledgmentsThe authors would like to thank Kyle Nadeau, Will Goth, JosephHollmann, Guoan Zheng, and Kaikai Guo for their input on thepaper. This work was done in part under and NSF grant fromthe Division of Chemical, Bioengineering, Environmental, andTransport Systems (CBET); Award No. 1510281.
References1. M. Haftek, “Compartmentalization of the human stratum corneum
by persistent tight junction like structures,” Exp. Dermatol. 20(8),617–621 (2011).
2. M. A. A. Neil et al., “Method of obtaining optical sectioning byusing structured light in a conventional microscope,” Opt. Lett. 22(24),1905–1907 (1997).
3. M. G. L. Gustafsson, “Surpassing the lateral resolution limit by a factorof two using structured illumination microscopy,” J. Microsc. 198(2),82–87 (2000).
4. M. Rajadhyaksha et al., “In vivo confocal scanning laser microscopy ofhuman skin: melanin provides strong contrast,” J. Invest. Dermatol.104(6), 946–952 (1995).
5. M. Minsky, “Microscopy apparatus,” U.S. Patent No. 3, 013, 467(1961).
6. M. J. Booth, “Adaptive optics in microscopy,” Philos. Trans. R. Soc. A365(1861), 2829–2843 (2007).
7. M. Arigovindan, J. W. Sedat, and D. A. Agard, “Effect of depth depen-dent spherical aberrations in 3D structured illumination microscopy,”Opt. Express 20(6), 6527–6541 (2012).
8. J. G. McNally et al., “Artifacts in computational optical-sectioningmicroscopy,” J. Opt. Soc. Am. A 11(3), 1056–1067 (1994).
9. Z. R. Hoffman and C. A. DiMarzio, “Structured illumination micros-copy using random intensity incoherent reflectance,” J. Biomed. Opt.18(6), 069803 (2013).
10. K. G. Larkin, D. J. Bone, and M. A. Oldfield, “Natural demodulation oftwo-dimensional fringe patterns. I. General background of the spiralphase quadrature transform,” J. Opt. Soc. Am. A 18(8), 1862–1870(2001).
11. K. G. Larkin, “Natural demodulation of two-dimensional fringe pat-terns. II. Stationary phase analysis of the spiral phase quadrature trans-form,” J. Opt. Soc. Am. A 18(8), 1871–1881 (2001).
12. K. P. Nadeau, A. J. Durkin, and B. J. Tromberg, “Advanced demodu-lation technique for the extraction of tissue optical properties and struc-tural orientation contrast in the spatial frequency domain,” J. Biomed.Opt. 19(5), 056013 (2014).
13. T. D. O’sullivan et al., “Diffuse optical imaging using spatially and tem-porally modulated light,” J. Biomed. Opt. 17(7), 0713111–07131114(2012).
14. D. J. Cuccia et al., “Modulated imaging: quantitative analysis andtomography of turbid media in the spatial-frequency domain,” Opt.Lett. 30(11):1354–1356 (2005).
15. D. J. Cuccia et al., “Quantitation and mapping of tissue optical proper-ties using modulated imaging,” J. Biomed. Opt. 14(2), 024012 (2009).
16. C. E. Glazowski and J. Zavislan, “A coherent model for turbid imagingwith confocal microscopy,” Biomed. Opt. Express 4(4), 500–513(2013).
17. E. Mudry et al., “Structured illumination microscopy using unknownspeckle patterns,” Nat. Photonics 6(5), 312–315 (2012).
Zachary R. Hoffman is a PhD candidate at Northeastern Universitywhere he works in Professor Charles DiMarzio’s lab. His researchfocuses on developing and improving methods of structured illumina-tion microscopy for resolving subsurface information in-vivo. He isalso working as an engineer at Draper Laboratory, developing lightbased inertial sensors.
Charles A. DiMarzio holds degrees from the University of Maine,WPI, and Northeastern University. After 14 years at RaytheonCompany in coherent laser radar, he joined Northeastern University.He is an associate professor of electrical and computer engineering,mechanical and industrial engineering, and bioengineering inNortheastern University. He is the author of a textbook, Optics forEngineers. His interests include confocal microscopy, structured illu-mination, and the interaction of light and sound.
Journal of Biomedical Optics 056011-11 May 2017 • Vol. 22(5)
Hoffman and DiMarzio: Single-image structured illumination using Hilbert transform demodulation
Downloaded From: https://www.spiedigitallibrary.org/journals/Journal-of-Biomedical-Optics on 9/19/2017 Terms of Use: https://spiedigitallibrary.spie.org/ss/TermsOfUse.aspx