single cmo management committee 21 june 2012 eu sheep and goats meat market situation
TRANSCRIPT

Single CMO Management Committee
21 June 2012
EU SHEEP and GOATS Meat Market Situation
2DG AGRI, Sheep & Goat Meat AG – 30 May 2012
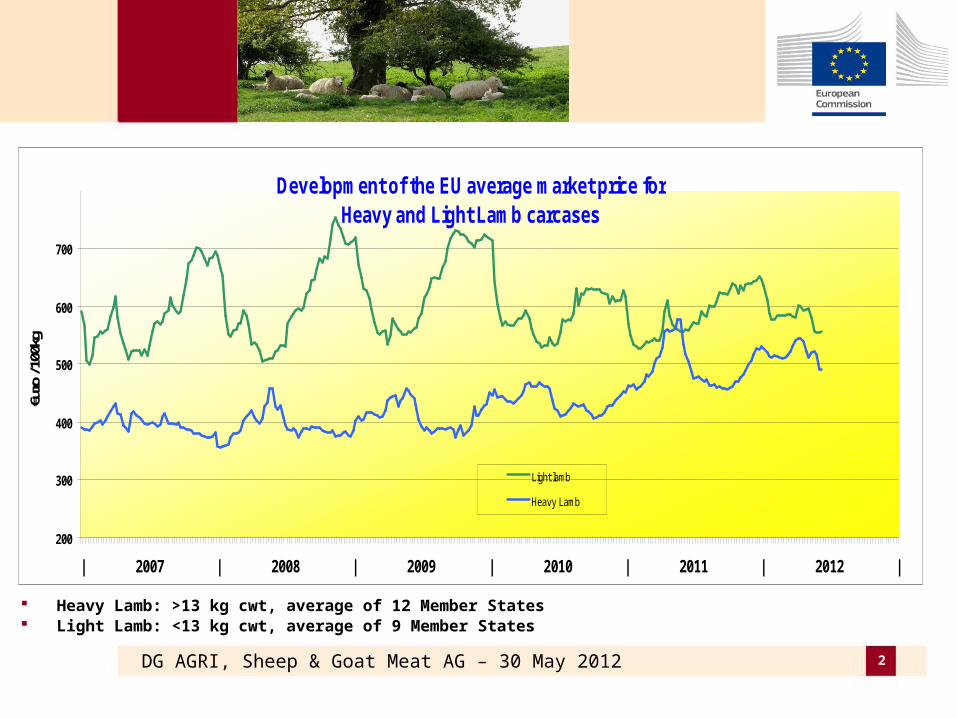
Heavy Lamb: >13 kg cwt, average of 12 Member States Light Lamb: <13 kg cwt, average of 9 Member States
Development of the EU average market price for Heavy and Light Lamb carcases
200
300
400
500
600
700
| 2007 | 2008 | 2009 | 2010 | 2011 | 2012 |
€uro
/ 100
kg
Light lamb
Heavy Lamb
3DG AGRI, Sheep & Goat Meat AG – 30 May 2012
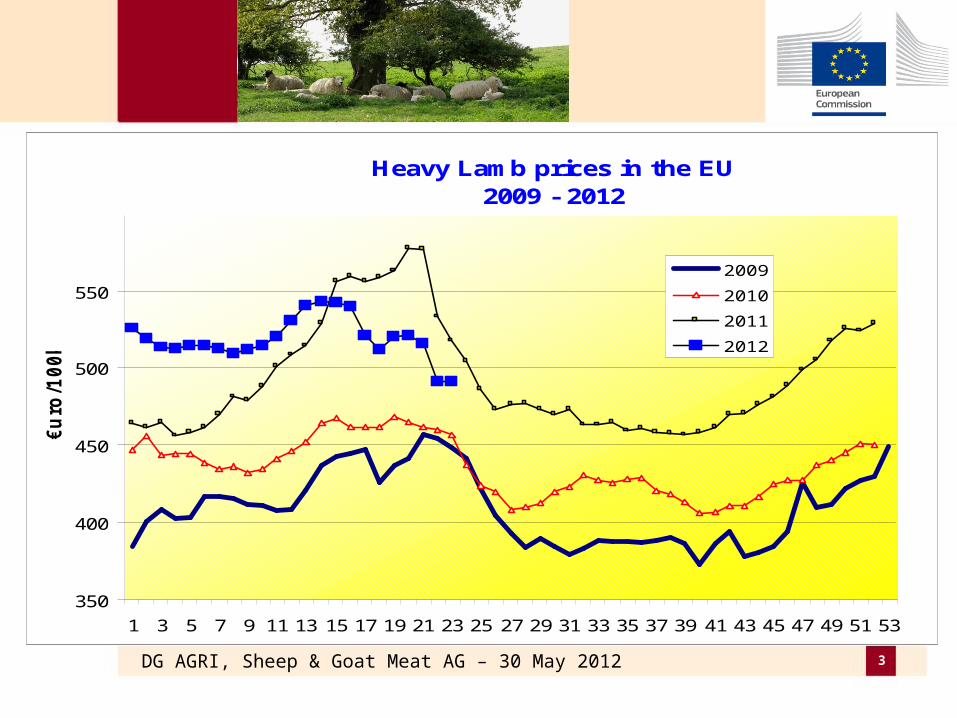
Heavy Lamb prices in the EU2009 - 2012
350
400
450
500
550
1 3 5 7 9 11 13 15 17 19 21 23 25 27 29 31 33 35 37 39 41 43 45 47 49 51 53
€u
ro/1
00kg
2009
2010
2011
2012

4DG AGRI, Sheep & Goat Meat AG – 30 May 2012
Light Lamb prices in the EU2009 - 2012
500
550
600
650
700
1 4 7 10 13 16 19 22 25 28 31 34 37 40 43 46 49 52
€u
ro/1
00kg
2009
2010
2011
2012

5DG AGRI, Sheep & Goat Meat AG – 30 May 2012
sheep and goat population in EU 27in 1000 heads
0
25 000
50 000
75 000
100 000
Total Sh & Go 115 408 113 224 112 974 112 355 111 833 109 471 109 088 109 048 102 360 101 164 99 102 98 817
EU 27 goats 13 175 13 904 14 011 13 739 13 477 13 084 13 231 13 245 11 454 13 062 13 467 13 206
EU 27 sheep 102 234 99 320 98 964 98 616 98 356 96 387 95 857 95 803 90 907 88 102 85 636 85 611
2000 2001 2002 2003 2004 2005 2006 2007 2008 2009 2010 2011

6DG AGRI, Sheep & Goat Meat AG – 30 May 2012
Percentual change of sheep (left axis) and the actual number at the December 2011 Survey on Sheep (right axis)
-30,0%
-20,0%
-10,0%
0,0%
10,0%
EU -19
BG DE IE EL ES FR IT CY LT HU MT NL Ös PL PT RO SK SE UK
Ch
ang
e co
mp
ared
to
201
0 (D
iag
on
als)
0
10.000
20.000
30.000
40.000
Actu
al nu
mb
er of an
imals at th
e D
ecemb
er 2011 Su
rvey in 1000 h
eads (P
lain)

7DG AGRI, Sheep & Goat Meat AG – 30 May 2012
Sheep and Goat meat supply in the EU2003 = EU 15 2004 = EU 25 2007 = EU 27
98
5
98
5
97
1
1 0
21
94
9
74
8
71
7
73
0
72
9
162135 95 95
75 73 6872
7860
5959 57
27
8
25
6
26
3
22
6
22
6
22
2
17
5
13
0
13
0
0
250
500
750
1 000
1 250
2004 2005 2006 2007 2008 2009 2010 2011 2012
in 1
000 T
on
nes
5.0
10.0
15.0
20.0
25.0
30.0
35.0
Sh
eep
Carc
ase w
eig
ht
in K
G
Sheep Non official GoatImp - Exp (Pw) Carc W. Heavy Carc W. Light
8DG AGRI, Sheep & Goat Meat AG – 30 May 2012
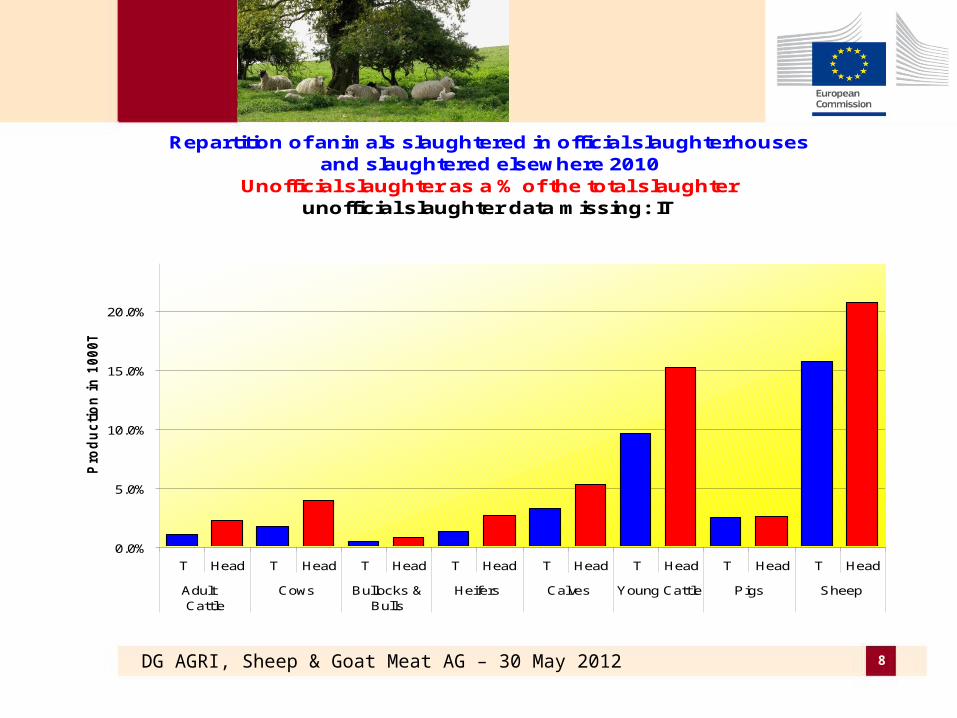
Repartition of animals slaughtered in official slaughterhousesand slaughtered elsewhere 2010
Unofficial slaughter as a % of the total slaughterunofficial slaughter data missing: IT
0.0%
5.0%
10.0%
15.0%
20.0%
T Head T Head T Head T Head T Head T Head T Head T Head
Adult Cattle
Cows Bullocks &Bulls
Heifers Calves Young Cattle Pigs Sheep
Pro
du
cti
on
in
1000T
on
n

9DG AGRI, Sheep & Goat Meat AG – 30 May 2012
Lamb production in the UK and Spain compaired to "Other" in 1000 Tonns
0
100
200
300
400
500
600
2000 2001 2002 2003 2004 2005 2006 2007 2008 2009 2010 2011 2012
Other
UK
ES

10DG AGRI, Sheep & Goat Meat AG – 30 May 2012
Combined Sheep and Goat slaughter in heads
in % of EU Total sheep & goat slaughter - 2011
0.0%
5.0%
10.0%
15.0%
20.0%
25.0%
de ie gr es fr it uk Other
Goat
sheep

11DG AGRI, Sheep & Goat Meat AG – 30 May 2012
Community average and international market prices for
Heavy Lamb carcases
150
250
350
450
550
| 2007 | 2008 | 2009 | 2010 | 2011 | 2012 |
€u
ro /
100kg
Heavy Lamb Uruguay N. Zealand (avg N&S island)
12DG AGRI, Sheep & Goat Meat AG – 30 May 2012
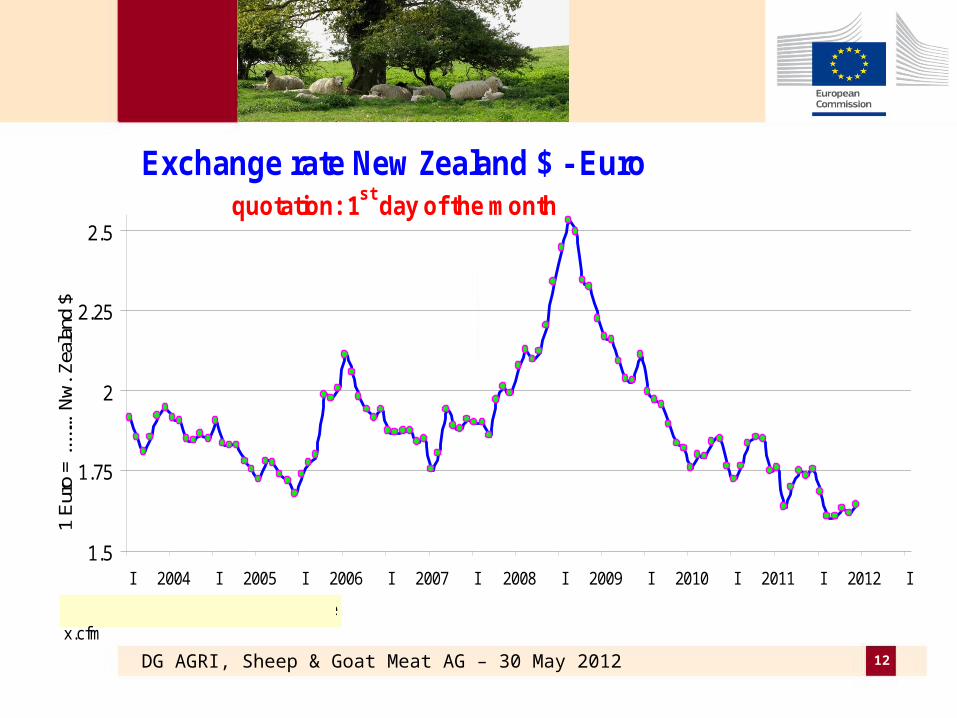
Exchange rate New Zealand $ - Euroquotation: 1st day of the month
1.5
1.75
2
2.25
2.5
I 2004 I 2005 I 2006 I 2007 I 2008 I 2009 I 2010 I 2011 I 2012 I
1 E
uro
= ...
..…N
w. Z
eala
nd $
http://ec.europa.eu/budget/inforeuro/index.cfm

13DG AGRI, Sheep & Goat Meat AG – 30 May 2012
EU imports of sheep & goat and live animals (1):Trade figures (COMEXT – tonnes cwe)
OriginsOriginstonnes % tonnes % tonnes % tonnes % tonnes %
New Zealand 242.424 85,1% 240.921 83,5% 211.334 82,9% 192.636 82,5% 65.702 88,7%
Australia 22.398 7,9% 23.359 8,1% 22.047 8,6% 20.892 8,9% 4.165 5,6%
Chile 3.844 1,3% 5.727 2,0% 5.856 2,3% 5.317 2,3% 1.091 1,5%
Uruguay 5.934 2,1% 5.722 2,0% 4.513 1,8% 4.951 2,1% 664 0,9%
For.JRep.Mac 2.346 0,8% 2.598 0,9% 2.173 0,9% 2.574 1,1% 1.531 2,1%
Argentina 5.708 2,0% 7.610 2,6% 5.982 2,3% 4.301 1,8% 684 0,9%
Iceland 1.434 0,5% 2.047 0,7% 2.381 0,9% 2.071 0,9% 166 0,2%
Falkland Is. 480 0,2% 479 0,2% 532 0,2% 607 0,3% 0 0,0%EXTRA EU15-25-27 284.778 288.621 255.076 233.616 74.114
% change + 1,3% - 11,6% - 8,4% - 23,6%
2008 2009 2010 Jan-Apr 122011

14DG AGRI, Sheep & Goat Meat AG – 30 May 2012
EU imports of sheep & goat and live animals (2):Trade figures (COMEXT)
IMPORTS of Sheet & Goat into EU (Tonnes cwe)
97 90482 729
65 702
5 410
6 938
4 165
111 027
96 954
74 114
0
20 000
40 000
60 000
80 000
100 000
120 000
Jan-Apr 10 Jan-Apr 11 Jan-Apr 12
Tonn
es c
we
New Zealand Australia Argentina
Uruguay Chile Other Origins
IMPORTS of Sheep & Goat into EU (1000 EUR)
373 800 400 430366 199
20 44434 504
23 656
410 448422 719
469 469
0
50 000
100 000
150 000
200 000
250 000
300 000
350 000
400 000
450 000
500 000
Jan-Apr 10 Jan-Apr 11 Jan-Apr 12
1,00
0 EU
R
New Zealand Australia Argentina
Uruguay Chile Other Origins

15DG AGRI, Sheep & Goat Meat AG – 30 May 2012
Imports of Sheep & Goat products
0
5 000
10 000
15 000
20 000
25 000
30 000
35 000
40 000
45 000
|Jan 06
2006 |Jan 07
2007 |Jan 08
2008 |Jan 09
2009 |Jan 10
2010 |Jan 11
2011 |Jan 12
in T
on
ne
s c
we
FRESH FROZEN OTHERS

16DG AGRI, Sheep & Goat Meat AG – 30 May 2012
EU exports of sheep & goat and live animals (1):Trade figures (COMEXT – tonnes cwe)
DestinationsDestinationstonnes % tonnes % tonnes % tonnes % tonnes %
Hong Kong 278 2.8% 616 4.4% 1 349 5.0% 4 404 10.7% 2 643 24.8%
Vietnam 823 8.3% 2 563 18.3% 3 005 11.1% 3 405 8.2% 1 361 12.8%
Sw itzerland 1 355 13.6% 1 404 10.0% 2 213 8.2% 2 661 6.4% 991 9.3%
Turkey 24 0.2% 77 0.5% 4 029 14.9% 12 740 30.8% 975 9.1%
Jordan 1 0.0% 352 2.5% 4 408 16.3% 5 239 12.7% 481 4.5%
Lebanon 974 9.8% 1 460 10.4% 2 397 8.9% 2 779 6.7% 446 4.2%EXTRA EU15-25-27 9 951 14 032 27 071 41 347 10 659
% change + 41% + 93% + 53% - 5.9%
2008 2009 2010 Jan-Apr 122011
17DG AGRI, Sheep & Goat Meat AG – 30 May 2012
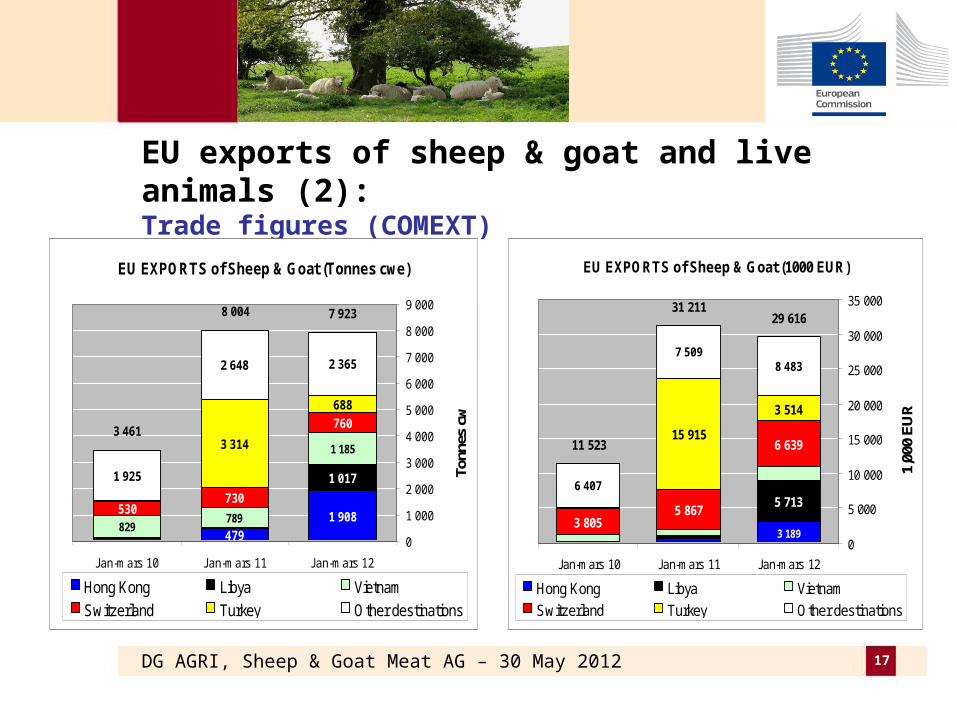
EU exports of sheep & goat and live animals (2):Trade figures (COMEXT)
EU EXPORTS of Sheep & Goat (Tonnes cwe)
479
1 908
1 017
789
1 185
530730
760
3 314
688
1 925
2 648 2 365
829
3 461
8 004 7 923
0
1 000
2 000
3 000
4 000
5 000
6 000
7 000
8 000
9 000
Jan-mars 10 Jan-mars 11 Jan-mars 12
Tonn
es c
w
Hong Kong Libya Vietnam
Switzerland Turkey Other destinations
EU EXPORTS of Sheep & Goat (1000 EUR)
5 713
3 8055 867
6 63915 915
3 514
6 407
7 5098 483
3 189
11 523
31 21129 616
0
5 000
10 000
15 000
20 000
25 000
30 000
35 000
Jan-mars 10 Jan-mars 11 Jan-mars 12
1,00
0 E
UR
Hong Kong Libya Vietnam
Switzerland Turkey Other destinations
18DG AGRI, Sheep & Goat Meat AG – 30 May 2012
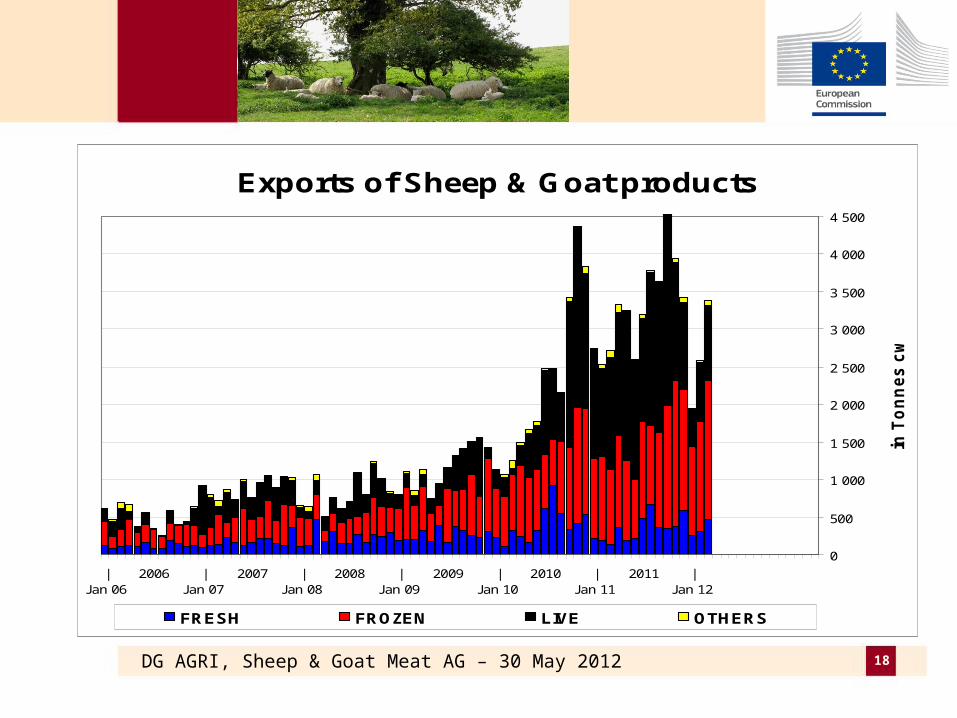
Exports of Sheep & Goat products
0
500
1 000
1 500
2 000
2 500
3 000
3 500
4 000
4 500
|Jan 06
2006 |Jan 07
2007 |Jan 08
2008 |Jan 09
2009 |Jan 10
2010 |Jan 11
2011 |Jan 12
in T
on
ne
s c
we
FRESH FROZEN LIVE OTHERS

19DG AGRI, Sheep & Goat Meat AG – 30 May 2012
Export of live sheep, in headsexcluding pure-bred breeding
0
20 000
40 000
60 000
80 000
100 000
120 000
| 2008 | 2009 | 2010 | 2011 | 2012 |
A = LIVE LAMBS "SHEEP UP TO A YEAR OLD"
B = LIVE SHEEP excl. A
2010 = 652 933 heads2011 = 1 454 984 heads
20DG AGRI, Sheep & Goat Meat AG – 30 May 2012
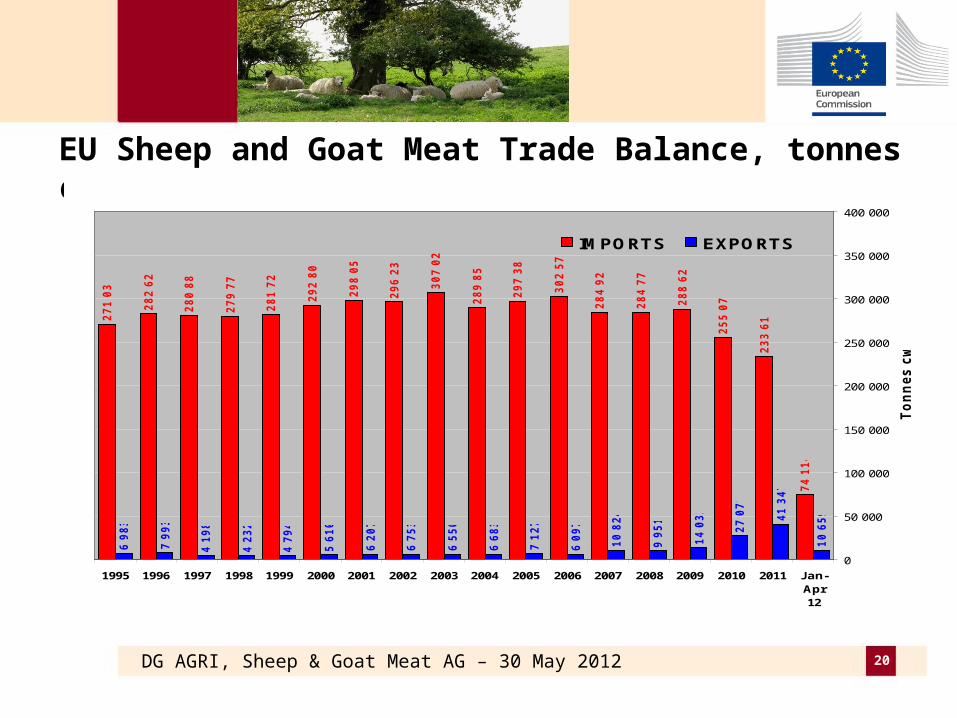
EU Sheep and Goat Meat Trade Balance, tonnes cwe
27
1 0
34
28
2 6
24
28
0 8
84
27
9 7
74
28
1 7
28
29
2 8
04
29
8 0
57
29
6 2
39
30
7 0
25
28
9 8
55
29
7 3
81
30
2 5
77
28
4 9
27
28
4 7
78
28
8 6
21
25
5 0
76
23
3 6
16
74
11
4
6 9
83
7 9
93
4 1
98
4 2
32
4 7
94
5 6
10
6 2
07
6 7
53
6 5
50
6 6
83
7 1
27
6 0
97
10
82
4
9 9
51
14
03
2
27
07
1
41
34
7
10
65
9
0
50 000
100 000
150 000
200 000
250 000
300 000
350 000
400 000
1995 1996 1997 1998 1999 2000 2001 2002 2003 2004 2005 2006 2007 2008 2009 2010 2011 Jan-Apr12
To
nn
es c
we
IMPORTS EXPORTS
23DG AGRI, Sheep & Goat Meat AG – 30 May 2012
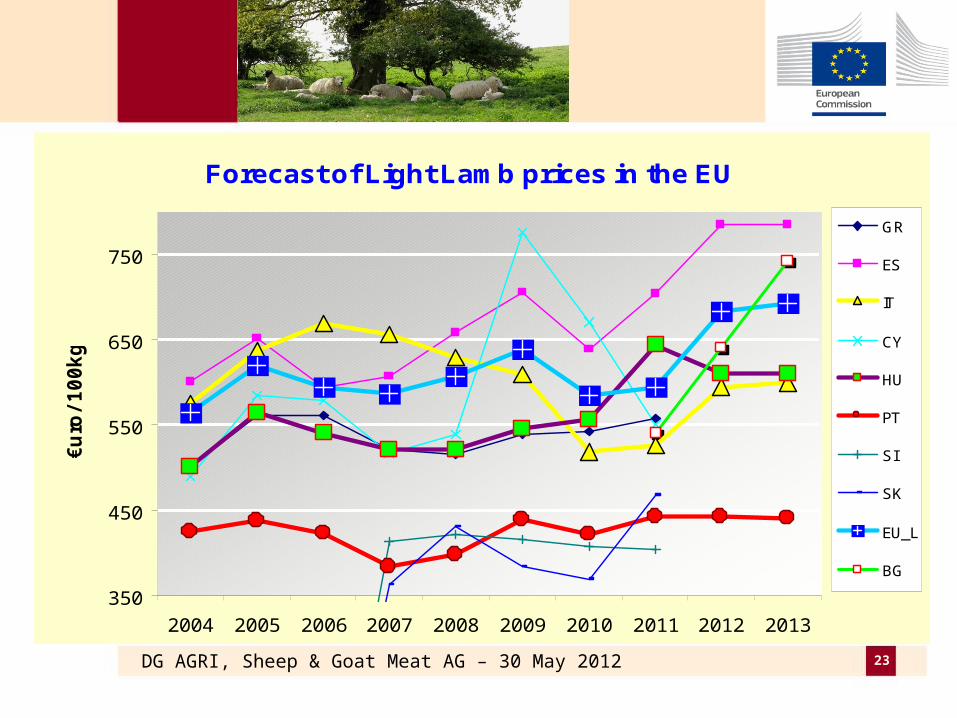
Forecast of Light Lamb prices in the EU
350
450
550
650
750
2004 2005 2006 2007 2008 2009 2010 2011 2012 2013
€u
ro/
10
0k
g
GR
ES
IT
CY
HU
PT
SI
SK
EU_L
BG

24DG AGRI, Sheep & Goat Meat AG – 30 May 2012
Forecast of Heavy Lamb prices in the EU
150
250
350
450
550
2004 2005 2006 2007 2008 2009 2010 2011 2012 2013
€u
ro/
10
0k
g
BE
DE
IE
ES
FR
NL
AT
PL
RO
SE
UK
EU_H

26DG AGRI, Sheep & Goat Meat AG – 30 May 2012
EU-27 sheep and goat meat market balance, DG AGRI forecast
EU-27 sheep and goatmeat market balance
2010 2011e 2012f 2013f 10/09 11/10 12/11 13/12Gross Indigenous Production 976 991 985 972 -1.5 1.6 -0.6 -1.3
Live Imports 0 0 0 0 -23.6 876.1 -98.1 -31.0Live Exports 11 22 15 18 190.9 98.5 -31.1 16.7
Net Production 965 970 970 955 -2.3 0.5 0.0 -1.5of which EU-15 861 868 860 850 -2.7 0.9 -0.9 -1.2of which EU-12 104 101 110 105 1.2 -2.7 8.6 -4.5
Meat Imports 239 221 215 215 -11.9 -7.5 -2.9 0.0Meat Exports 13 16 23 25 70.8 19.6 47.0 7.6
Consumption 1 191 1 175 1 162 1 145 -4.8 -1.3 -1.1 -1.4
Population (mio) 502 503 504 506 0.3 0.3 0.3 0.3of which EU-15 399 400 402 403 0.4 0.4 0.4 0.3of which EU-12 103 103 103 103 -0.1 -0.2 -0.1 -0.1
Per Capita Consumption (kg) 2.4 2.3 2.3 2.3 -5.1 -1.6 -1.4 -1.7
% variation000 t carcass weight