single cell profiling of signaling pathways and phenotypic
TRANSCRIPT
Single Cell Profiling of Signaling Pathways and Phenotypic
Marker Expression in Philadelphia-like B-cell Acute
Lymphoblastic Leukemia
by
Alicia Kilfoy
A thesis submitted in conformity with the requirements
for the degree of Master of Science
Graduate Department of Immunology,
Faculty of Medicine, University of Toronto
© Copyright by Alicia Kilfoy 2019
ii
Single Cell Profiling of Signaling Pathways and Phenotypic
Marker Expression in Philadelphia-like B-cell Acute
Lymphoblastic Leukemia
Alicia Kilfoy
Master of Science
Department of Immunology,
University of Toronto
2019
Abstract
B-cell Acute Lymphoblastic Leukemia (B-ALL) is the most common childhood cancer,
but also occurs in adults. It is caused by a broad spectrum of genetic alterations which are used for
risk stratification. Across all ages, the Philadelphia-like (Ph-like) subtype is associated with lower
survival rates. Kinase activating mutations that converge on either ABL or JAK2 signaling are
found in >80% of Ph-like cases. Although clinically approved targeted therapies are available for
both subgroups, there is currently no test to rapidly identify them. Therefore, I built a mass
cytometry panel to profile signaling and phenotypic markers in 7 BCR-ABL and 4 Ph-like samples.
I identified blasts with activating ABL or JAK2 mutations based on expression of pSTAT5 and its
reduction by targeted inhibitors. Furthermore, I distinguished Ph-like and BCR-ABL specific
clusters that differed in CD14 and CD127 expression. My thesis demonstrates how mass cytometry
can be used to identify Ph-like samples.

iii
Acknowledgments I entered this graduate program as a nervous undergrad student lacking confidence. Three
years later I leave with a new sense of confidence and resilience and for that I have so many people
to thank. First and fore mostly, I’d like to thank my supervisor Dr. Cynthia Guidos. I have learned
so much and grown immensely, both scientifically and personally, under your supervision. From
your attention to detail to valuable life lessons such as the importance of preparation, I am so
grateful for your continued support and mentorship. This project has been the most phenomenal to
be a part of. Although, I do have to say, I will be very happy to never titrate another antibody
again. To my committee members, Drs. Jayne Danska, Naoto Hirano and Michael Ratcliffe thank
you for your insight and knowledge. Your thoughts and opinions on not only my project but the
scientific method have helped propel my work forward. Particularly, I’d like to thank Dr. Danska
for her guidance and support. You and Cindy are true examples of strong women I admire and
aspire to be like. Most importantly, I will so miss cheering on the Raptors together. Go Raps Go!
To my most valued and beloved support network: my parents, boyfriend and younger
brother, words cannot describe how thankful I am for you. Thank you for always answering the
phone no matter the time of night, eagerly listening to me practice my presentations, and most
importantly never failing to make me laugh despite my mood.
To the Guidos/Danska lab members both present and past I have had the pleasure of
working with, I will miss you all dearly. I leave the lab not only with an MSc but with wonderful
friendships. To Dina Levi, I would not have completed this program without you. Thank you for
being the absolute best mother duck and taking me under your wing. To Mark Gower, you were
fabulous to work alongside and will be an excellent PI one day. To my other closest “labbies” Miki
Gams, Michelle Zuo, Frances Simbulan, Kirsty Bannerman, Jerry Shen, Tina Chen, and Greg
Chang thank you for always listening to my rants and importantly laughing at my jokes.
I am so sad to end this chapter of my life, but am entirely thankful for the memories and
lessons that came with it. To future students reading this I advise following the mantra of Dory,
one of the wisest fishes in the sea, and “Just Keep Swimming!” Alicia out!
iv
Data Acknowledgments I have a few people I’d like to thank and acknowledge for their contributions to this thesis.
First, Mark Gower who performed the hierarchical clustering in R and made the Dendrogram in
Figure 3.7. Second, I’d like to thank Anthony Zhao who created the platform I used to run
Phenograph analysis. Last, I’d like to thank Greg Chang who conjugated the antibodies and the
various members of the CyTOF team who collected the samples.
v
Table of Contents
Abstract..........................................................................................................................................ii Acknowledgments.........................................................................................................................iii Table of Contents...........................................................................................................................v List of Figures and Tables...........................................................................................................vii List of Abbreviations..................................................................................................................viii Chapter 1: Introduction 1.1 Overview...................................................................................................................................2
1.2 B-cell Acute Lymphoblastic Leukemia…………....................................................................3
1.3 BCR-ABL B-ALL......................................................................................................................4 1.4 Philadelphia-like B-ALL...........................................................................................................5 1.5 High Dimensional Immune Phenotyping of Leukemia Using Mass Cytometry........................................................................................................................................7
1.6 Project Rationale and Goals.......................................................................................................9 Chapter 2: Materials and Methods 2.1 Cell Culture .............................................................................................................................12 2.2 Peripheral Blood Mononuclear Cells (PBMC) from Non-Leukemic Donors............................................................................................................................................12 2.3 B-ALL Patient Samples ..........................................................................................................12 2.4 Antibodies................................................................................................................................13 2.5 Cell Staining for Mass Cytometry...........................................................................................13 2.6 De-barcoding and Clustering Analysis....................................................................................15 2.7 Statistical Analysis...................................................................................................................16
vi
Chapter 3: Results 3.1 Optimization and Validation of CyTOF Antibodies...............................................................21 3.2 Validation Pilot on BCR-ABL Samples...................................................................................25 3.3 CyTOF Profiling of Signaling Activity in Ph-like vs BCR-ABL Subgroups...........................31 3.4 Unsupervised Clustering Algorithm Reveals Differential Expression of Phenotypic Markers in Ph-like and BCR-ABL Samples .................................................................................................35 3.5 Conclusions and Summary......................................................................................................46
Chapter 4 Discussion
4.1 Overview..................................................................................................................................48 4.2 BCR-ABL Phenotypic and Signaling Heterogeneity................................................................49 4.3 RUX Sensitive pSTAT5 as a Ph-like CRLF2/JAK2 B-ALL Marker......................................50 4.4 BCR-ABL Specific Cluster Expressed Significantly Higher CD14, CD34 and CD19............51 4.5 Ph-like Specific Cluster Expressed Significantly Higher CD127 and HLA-DR....................52 4.6 Class Defining Clusters Could be Subclones Present at Diagnosis.........................................52 4.7 Conclusions and Future Directions .........................................................................................53 References.....................................................................................................................................56

vii
List of Tables and Figures
Chapter 2: Materials and Methods Table 2.1 Immunophenotyping Antibodies...................................................................................17 Table 2.2 Antibodies Specific for Signaling and Apoptosis Markers...........................................18 Table 2.3 Signaling Agonists and Antagonists..............................................................................19
Chapter 3: Results Figure 3.1: Development and optimization of a 36-Marker CyTOF panel...................................23 Figure 3.2: Pilot CyTOF analysis of BCR-ABL samples...............................................................27 . Figure 3.3: Highly heterogeneous marker expression in BCR-ABL samples................................28 Figure 3.4: Signaling pathway activation in BCR-ABL samples...................................................29 Figure 3.5: Patient cohort for Ph-like vs BCR-ABL experiments..................................................32 Fig 3.6: DAS and RUX decrease pSTAT5 more robustly in BCR-ABL and Ph-like CRLF2/JAK2 samples respectively................................................................................................33 Figure 3.7: Hierarchical clustering of phenotypic markers by sample group..................................38 Figure 3.8: Unbiased identification of non-leukemic clusters.......................................................39 Figure 3:9: PG tSNE visualization of PG clusters in non-leukemic vs leukemic PBMC samples ..........................................................................................................................................40 Figure 3.10: PG tSNE visualization of leukemic clusters in BCR-ABL vs Ph-like samples.........41 Figure 3.11: Phenotypic marker intensity in the 5 most abundant PG leukemic clusters in each sample...................................................................................................................42 Figure 3.12: PG cluster enrichment and abundance analysis revealed significantly different BCR-ABL and Ph-like specific clusters..................................................................................................43

viii
List of Abbreviations
Ab Antibody ABL Abelson tyrosine kinase AML Acute Myeloid Leukemia B-ALL B-cell Acute Lymphoblastic Leukemia BcS Barcode Separation Bcl-xL B cell lymphoma extra-large BCR Breakpoint cluster region BLNK Bruton tyrosine kinase BM Bone marrow BSA Bovine Serum Albumin Cl-casp 3 Cleaved Caspase 3 CML Chronic Myelogenous Leukemia COG Children’s Oncology Group CRLF2 Cytokine receptor-like factor 2 CSF1R Colony Stimulating factor-1 receptor CSM CyTOF Staining Media CyTOF Cytometry by Time-Of-Flight DAS Dasatinib DMSO Dimethylsulfoxide EBF1 Early B cell factor-1 EFS Event-free survival EL Event Length EPOR Erythropoietin receptor ETV6 E26 transformation specific variant 6 FC Fold change FCS Flow cytometry standard FBS Fetal bovine serum FISH Fluorescence in-situ hybridisation gc Common g chain HR High-risk for relapse HSC Hematopoietic stem cell IFN-γ Interferon gamma Ig Immunoglobulin IKZF1 IKAROS Family Zinc Finger 1 IL-3 Interleukin-3 IL-6 Interleukin-6 IL-7Ra Interleukin-7 receptor a chain IMD Integrated mass data ITAM Immunoreceptor tyrosine-based activation motif JAK Janus family kinase KLD Kullback-Leibler Divergence
ix
MAPK Mitogen-activated protein kinase MD Mahalanobis Distance Min Minutes MMI Median metal intensity mTOR Mammalian target of rapamycin OS Overall survival Pax5 Paired Box 5 PBMCs Peripheral blood mononuclear cell PBS Phosphate-buffered saline PCR Polymerase chain reaction Pd Palladium PDGFR Platelet-derived growth factor receptor PG Phenograph Ph Philadelphia chromosome PI3K Phosphoinositide 3-kinase Pre-BCR Pre-B-cell receptor Pre-B Precursor- B Pro-B Progenitor-B PV Pervanadate RT Room temperature RUNX1 Runt-related transcription factor 1 RUX Ruxolitinib SAP Saponin SD Standard deviation SFM Serum-free media SR Standard-risk for relapse SRC Sarcoma kinase STAT Signal-transducer and activator of transcription SYK Spleen tyrosine kinase cRPMI Complete RPMI media TF Transcription factor TKi Tyrosine kinase inhibitor TSLPR Thymic stromal lymphopoietin receptor tSNE t-Distributed Stochastic Neighbor Embedding Tyr Tyrosine VEH Vehicle WBC White blood cell

1
Chapter 1 Introduction
2
1.1 Overview
B cell development is a highly-regulated process involving tightly intertwined transcription
factors (TFs) and signaling pathways. Genetic alterations in these pathways caused by cytogenetic
abnormalities, genes fusions or kinase activating mutations can lead to an arrest in development,
accumulation of immature lymphoid progenitor cells and subsequent B-ALL. Despite being the
most common childhood cancer, B-ALL also affects adults, peaking in prevalence in children
between the ages of 2-5 and subsequently in adults over 501. Along with age and white blood cell
(WBC) count, the genetic alteration is used to classify patients as high-risk (HR) or standard-risk
(SR) for relapse. In pediatric B-ALL, SR subtypes are more prevalent and is one of the reasons
why overall survival rates (OS) are more than 90%2. In contrast, in adult B-ALL HR subtypes are
more prevalent which is one of the reasons why OS rates are below 50%2. This discrepancy in OS
rates highlights the need for better therapies in treatment of HR B-ALL.
The implementation of a tyrosine kinase inhibitor (TKi) specific for the Abelson (ABL)
tyrosine kinase has dramatically increased OS rates in patients whose leukemic blasts harbour the
BCR-ABL (breakpoint cluster region-ABL) fusion. The success of the implementation of this
targeted therapy led to the discovery of a new HR subtype named Ph-like B-ALL in pediatric and
adult B-ALL. Importantly, this subtype is associated with an increase in both prevalence and
morbidity with age. Since the discovery, next generation sequencing techniques have identified a
wide range of kinase activating mutations in 90% of Ph-like cases. 80% of these mutations
converge on either the Janus family kinase/Signal-transducer and activator of transcription
(JAK/STAT) or ABL signaling pathways for which TKis are available and FDA approved for
treatment of other malignancies2.
However, there are currently several impediments in effective clinical implementation of
these TKis into routine Ph-like treatment. First, the kinase activating mutations are highly
heterogeneous so rapid identification with classical techniques is difficult. Second, routine clinical
ALL immunophenotyping methods cannot distinguish Ph-like from other B-ALL subtypes. The
primary goal of my Master’s thesis was to determine if cytometry by time of flight (CyTOF) could
be used to identify Ph-like specific signaling and/or phenotypic marker expression patterns. To
achieve this, I developed and validated a 36-marker CyTOF panel to simultaneously profile
phenotypic and signaling markers in 7 BCR-ABL and 4 Ph-like B-ALL peripheral blood samples
taken at diagnosis. This introduction will explain how disruptions in B cell development can lead
3
to arrest in development and subsequent B-ALL. I will also highlight the pathobiology of the two
genetic subtypes my thesis focused on: BCR-ABL and Ph-like B-ALL. Lastly, I will introduce
CyTOF and explain how it has been used by other groups in Leukemia research.
1.2 B-cell Acute Lymphoblastic Leukemia
B-ALL is a hematopoietic malignancy caused by an accumulation of transformed
progenitor B (pro-B) or precursor B cells (pre-B) in the bone marrow (BM)1-3. This transformation
is caused by a wide range of genetic aberrations including mutations, chromosome translocations,
aneuploidy and gene fusions that alter pathways critical in B cell development1,4. For example,
deletions of IKZF1 (IKAROS Family Zinc Finger 1), the gene essential for lymphopoiesis, are
often observed in B-ALL and are associated with inferior outcomes in pediatric and adult cases2,5-
6. Mutations and fusions involving genes that encode TFs necessary for B-cell commitment and
specification such as E2A, EBF1 (early B cell factor-1) and PAX5 (paired box 5) are also often
present in B-ALL7-9. In normal B cell development, these TFs act upstream and induce expression
of crucial B cell genes including CD79a/b, and enhance V(D)J recombination of the heavy and
lights chains of the B cell receptor10-12. These genes and their respective TFs play a critical role in
controlling normal B cell development. Their disruption results in one of the phenotypic features
observed in B-ALL developmental arrest7.
In addition to genes and TFs, signaling receptors and their downstream pathways, such as
interleukin-7 receptor (IL-7R) and pre-BCR (pre-B cell receptor), are also frequently mutationally
activated in B-ALL. First, both activating and loss-of-function mutations in the IL-7 signaling
pathway have been identified13-14. This pathway plays an important role during the transition from
common lymphoid progenitor to pro-B cells15. Specifically, the IL-7 cytokine binds to the IL-7Ra
and the common g chain (gc) heterodimer which signals through the JAK/STAT pathway
promoting cell survival and proliferation16. Interestingly, the IL-7Ra chain can also pair with the
thymic stromal lymphopoietin receptor (TSLPR) to promote B cell precursor proliferation and
overexpression of TSLPR is often observed in poor outcome B-ALL17. Second, during early B cell
development, pre-B cells are programmed to die unless they successful assemble and signal
through the pre-BCR18. Surprisingly, approximately 70% of B-ALL cases do not express a pre-
BCR on their surface and thus subvert this developmental check point through over activation of
signaling molecules downstream of the pre-BCR or other signaling pathways19-20. Constitutive

4
activation of these signaling pathways promotes leukemogenesis through enhanced cell
metabolism, proliferation and impaired apoptosis21. Genetic alterations can sometimes be identified clinically through chromosomal analysis,
polymerase chain reaction (PCR) and fluorescence in-situ hybridisation (FISH)1,22. Along with age
and WBC count, they are used to stratify a patient as HR or SR for relapse23. Patients diagnosed
with SR subtypes are often cured with standard dose chemotherapy, while HR subtypes are more
likely to be resistant. Instead, genetic subtypes classified as HR are treated with high-dose
chemotherapy or bone marrow transplant24-25. In pediatric B-ALL, SR subtypes including
hyperdiploidy (>50 chromosomes), the ETV6-RUNX1 (E26 transformation specific variant 6-runt-
related transcription factor 1) fusion and trisomy 4, 10 and 17 are more prevalent, providing at
least one explanation for high OS rates of ~ 90% for pediatric B-ALL patients4,26-27. OS rates for
adults with B-ALL are significantly inferior (>50%), a statistic that is influenced by a higher
prevalence of HR genetic subtypes. These subtypes include hypodiploidy, the BCR-ABL and the
MLL-AF4 gene fusions4,26-27. In addition to low OS in adults, OS in both pediatric and adult
relapsed and refractory cases are dismal28. These issues highlight a need for better treatment
options or targeted treatment in HR B-ALL.
1.3 BCR-ABL B-ALL
BCR-ABL B-ALL is a HR subtype characterized by expression of the constitutively active
ABL tyrosine kinase29. BCR-ABL gene fusions are often formed by [t(9;22)(q34;q11.2)]
translocations that can be cytogenetically detected as the Philadelphia (Ph) chromosome31. This
translocation fuses the 3’ end of the BCR on chromosome 22 with the 5’ exons of ABL gene on
chromosome 9 to cause constitutive activation of ABL signaling30-32. One phosphorylation target
of the ABL kinase is Tyr177 of the BCR protein, which provides a docking site for proteins that
activate RAS/MAPK and PI3K/AKT signaling34. BCR-ABL also phosphorylates STAT5 in a
JAK-independent manner, and activated phospho-STAT5 (pSTAT5) inhibits programmed cell
death through upregulation of the anti-apoptotic molecule BCL-xL (B-cell lymphoma-extra-
large)33. Thus, signaling through the mutationally activated ABL kinase promotes abnormal
survival, metabolism and proliferation of BCR-ABL leukemic B cells33.
The addition of ABL-targeted TKis to standard of care has dramatically increased OS rates
in pediatric and adult patients with BCR-ABL B-ALL35. Imatinib, the first ABL-targeted TKi
5
increased 5-year OS rates in adults to 43% from the historic 10%36-37. The application of TKi
therapy in BCR-ABL B-ALL provides an excellent example for the potential success of targeted
therapies. However, new therapies are needed for treatment of patients with other HR B-ALL
subtypes, in particular those that lack cytogenetic abnormalities.
1.4 Philadelphia-like B-ALL
The Children’s Oncology Group (COG)-TARGET from St Jude’s Children’s Hospital and
the Dutch Childhood Oncology group performed genome wide expression profiling of pediatric
B-ALL cases in order to better classify and improve treatment options for HR subtypes. They
simultaneously identified Ph-like or BCR-ABL-like B-ALL as a poor outcome subgroup of
pediatric B-ALL38-40. These cases lacked clinically identified translocations including BCR-ABL,
had a high frequency of IKZF1 mutations, and gene expression profiles similar to cases with the
BCR-ABL gene fusion39-40. Since the initial discovery of this subtype in pediatric cases, Ph-like B-
ALL has also been identified in adult B-ALL. The prevalence of this genetic subtype increases
with increasing age, comprising up to 15% of childhood B-ALL, 25% of young adult cases (21-
39 years of age) and up to 33% (>40 years of age) in older adults41-42. Increasing age also correlates
with inferior outcome. For example, the 5-year event-free survival (EFS) rates in young adults is
40.4% compared to 18.9% in older adults42. Nonetheless, across all age groups Ph-like B-ALL is
associated with inferior outcomes compared to non-Ph-like B-ALL41.
More recent studies using next generation sequencing have identified kinase activating
mutations in 90% of Ph-like cases43-44. The largest subgroup has mutations that converge on JAK-
STAT signaling45-46. Specifically, rearrangements in the gene that encodes the TSLP receptor,
CRLF2 (cytokine receptor like factor 2) are the most prevalent alteration in Ph-like, either as a
translocation of CRLF2 to the immunoglobulin heavy-chain transcriptional enhancer region (IGH-
CRLF2) or a deletion of the pseudo autosomal region of the sex chromosomes resulting in a fusion
between CRLF2 and the G-protein purinergic receptor P2RY8 gene (P2RY8-CRLF2). More than
half of these cases also have activating mutations in JAK1 or JAK245-47. Other mutations that
activate JAK-STAT signaling have also been identified in Ph-like B-ALL including gene fusions
involving JAK2, rearrangements in the erythropoietin receptor (EPOR), and a variety of sequence
mutations in JAK1, JAK3, IL7R or SH2B3, a negative regulator of JAK-STAT signaling47-48. The
second major subgroup in Ph-like B-ALL involves rearrangements of ABL-class genes such as

6
ABL1, ABL2, PDGFRB (platelet derived growth factor receptor b) and CSF1R (colony stimulating
factor 1 receptor) 45,47. Many different fusion partners have been identified for each of these genes,
including 12 different partners with ABL1 and 3 with ABL245,47. This genetic landscape suggests
that implementing TKi therapy into standard of care could improve outcomes for patients with Ph-
like ALL.
Pre-clinical and anecdotal reports testing ABL and JAK targeted-TKis in Ph-like ALL have
been promising. These include Dasatinib (DAS), a second generation ABL TKi, and Ruxolitinib
(RUX) JAK 1/2 inhibitor; both FDA approved for treatment of other neoplasms49-51. For example,
in 2013 clinicians reported a successful case of incorporating Imatinib into the treatment of a
refractory pediatric Ph-like B-ALL patient with an EBF1-PDGFRB fusion50. In this case study,
treatment was determined successful as after 14 days of treatment the minimal residual disease in
the patient’s BM was reduced to 0.059%. Furthermore, following 10 months of consolidation
therapy the patient remained in continuous remission50. Based on pre-clinical studies and this case
report, three separate clinical trials (NCT02420717, NCT01406756, NCT03117751) were
launched to test the efficacy of DAS together with standard treatment for Ph-like ABL cases47,51.
RUX has also showed promise in studies using cell lines and patient-derived xenograft models of
CRLF2/JAK mutant Ph-like ALL47,51-52. Furthermore, a completed phase 1 clinical trial
demonstrated the safety of the RUX in refractory pediatric patients51,53. Following completion of
this phase 1 trial, three separate phase 2 trials (NCT02420717, NCT02723994, NCT03117751)
were launched and are ongoing testing the efficacy of RUX in refractory pediatric and young
adults51.
Despite these successes, there are several barriers to implementing TKi for treatment of
Ph-like ALL. First, the genetic alterations observed in Ph-like B-ALL are highly heterogeneous,
which makes it difficult to identify Ph-like cases in a timely manner using classical techniques54.
Second, leukemic sub-clones are often present at diagnosis and relapse highlighting the need for a
single cell diagnostic assay55. Third, routine clinical ALL immunophenotyping methods cannot
distinguish Ph-like from other B-ALL subtypes. Thus, a new single-cell assay is needed to identify
and further classify Ph-like patients in a timely manner.

7
1.5 High Dimensional Immune Phenotyping of Leukemia Using Mass Cytometry
Flow cytometry is the most widely used single cell technology for single cell
immunophenotypic profiling of human leukemia. In classical flow cytometry, antibodies (Abs) are
conjugated to fluorophores and molecular expression is quantified based on the fluorophore’s light
emission. However, spectral overlap between fluorophores makes distinguishing them from one
another difficult, especially when the number of markers in the panel is increased. Thus, only a
limited number of markers can be simultaneously profiled using flow cytometry. In contrast, mass
cytometry combines flow cytometry with time-of-flight mass spectrometry to overcome this
limitation. In this technology, known as CyTOF, cells are labelled with Abs tagged with heavy
metal isotopes56, allowing for up to 100 different stable isotopes to be measured with 3-5% overlap
between metal tags57 in contrast to 5-100% overlap between fluorescent tags in conventional flow
cytometry. Currently, at least 40 different metal isotopes are available with sufficient purity to be
routinely used in CyTOF experiments57.
Prior to staining, it is possible to first barcode individual samples with unique metal tags
so that they can later be pooled for multiplexed staining. One barcoding option utilizes six
palladium (Pd) isotopes with atomic masses of 102, 104, 105, 106, 108 and 110. Assigning each
sample a unique 3 Pd isotope code allows for up to 20 samples to be multiplexed stained58.
Multiplex staining has several benefits in CyTOF experiments. First, it reduces staining variability
across tubes. Second, barcoding improves doublet discrimination. In this barcoding scheme, the
combination of any two barcodes, resulting from a cell doublet, yields an “illegal” barcode58. This
scheme cannot detect doublets of cells from the same sample because they have the same 3 Pd
barcode, but every other illegal combination can be detected and removed in de-barcoding58.
However, there are drawbacks to this method. One of the largest issues is that prior to staining
cells are fixed with paraformaldehyde (PFA) and permeablized which can affect surface epitopes
and the quality of staining58. However, overall, Pd based barcoding minimizes sample variation
and allows for up to 20 samples at a time to be multiplexed stained.
In immune profiling CyTOF experiments cells are first incubated with a cocktail of Abs
conjugated to heavy metal isotopes which bind targets of interest on or within the cell. Following
staining, cells are re-suspended with EQ normalization 5 element beads and the solution is
introduced into the CyTOF machine through a capillary tube which delivers the cells to a nebulizer.
In the nebulizer, the addition of argon gas nebulizes the cell suspension into a fine spray of water
8
droplets containing the one or a few cells56-57. The droplets next enter a heated chamber and are
carried into an inductively coupled argon plasma torch that vaporizes, atomizes and ionizes the
cell droplet producing an ion cloud. The cloud next passes through an electrostatic quadrupole ion
deflector which filters out the low molecular mass ions such as oxygen and carbon, leaving an ion
cloud enriched for the heavy metal reporter ions. Finally, the ion cloud, derived from one or a few
cells, is divided into slices that are pushed sequentially into the time of flight (TOF) chamber. In
the TOF chamber, an ion detector measures how long it takes ions to travel the known distance to
the detector. Heavier metals take longer than lighter metals56-57.
After acquisition, software is used to 1) compile sequential “pushes” meeting certain signal
intensity thresholds into cell “events”, 2) convert this integrated mass data (IMD) file into a flow
cytometry standard (FCS) file containing all cell events for that sample and 3) normalize the FCS
file using the global EQ bead “passport” value on the Helios software. Lastly, the FCS is de-
barcoded to produce individual FCS files for each sample in the mixture. These de-barcoded FCS
files can then be analyzed by standard flow cytometry data analysis software to perform manual
gating of one-dimensional histograms or two-dimensional scatter plots56-57. However, this
approach is highly subjective and is limited to examining 2 dimensions at a time. To avoid these
issues, data scientists developed computational workflows that cluster data into cell subsets and
then use dimensionality reduction to visualize the clusters.
Phenograph (PG) is a commonly used algorithm that produces a k-nearest neighbour graph
in which each cell is connected to the k cells most similar to it in high-dimensional space. PG then
uses the Louvain community detection algorithm to find and partition highly interconnected nodes
(groups of cells) into communities or clusters of phenotypically similar cells59,60. These clusters
can then be visualized and explored using the t-Distributed Stochastic Neighbour Embedding (t-
SNE) dimensionality reduction algorithm. tSNE converts the Euclidean distance between two cells
in high dimensional space into a conditional probability (p) matrix. Simultaneously the algorithm
also creates a random conditional probability matrix (q) in 2-dimensional space. The algorithm
then calculates the Kullbach-Liebler divergence (KLD) value to quantify the difference between
the p and q matrices as it iterates through many successive versions of q61. The goal of each
iteration is to decrease the KLD value from the prior iteration. The experimenter chooses the
number of iterations, typically 1000-5000 (depends on total number of events in the run), that

9
produces the lowest final KLD, ideally <5. Together CyTOF and and these algorithms provide an
unbiased and exciting approach to explore the immune phenotypes.
CyTOF has been used by other research groups to highlight the heterogeneity of leukemia
and determine biomarkers of both prognosis and relapse. In 2013, Amir et al., published the first
paper to use tSNE to visualize CyTOF data. In this paper, they compared primary non-leukemic
BM samples to B-ALL BM samples62. Specifically, they applied tSNE to a 29-marker panel
measuring four BM samples, two healthy and two from ALL patients. As expected, the two healthy
samples overlapped in the tSNE graph while the two cancer samples occupied very separate
regions on the tSNE. They also showed preliminary data demonstrating how tSNE can be used to
explore cancer heterogeneity in Acute Myeloid Leukemia (AML) samples. Using a 30 marker
panel and tSNE they showed several markers with gradient expression in two AML samples
including CD33, CD34 and HLA-DR. Lastly, they applied the tSNE algorithm to a matched
diagnostic/relapse pair from one AML patient. The tSNE identified a region of shared phenotypes
in both samples, but rarer at diagnosis suggesting that a rare resistant clone maintained a consistent
phenotype from diagnosis to relapse62.
More recently, the PG and tSNE algorithms were used to examine expression of signaling
and phenotypic markers in AML pediatric samples. Using CyTOF, PG and tSNE this group
identified a new primitive signalling phenotype in AML that predicted survival in an independent
cohort59. In addition, Good et al. incorporated signaling and phenotypic markers to construct a
predictive model of relapse in 60 pediatric BM B-ALL samples with diverse clinical genetics
including 16 patients with JAK2 mutations63. For example, they identified activation of various
signaling molecules including phospho-SYK (Spleen Tyrosine Kinase) and downstream
molecules involved in PI3K/mTOR61 signaling as indicative of relapse. Together, these studies
have demonstrated the value of using high dimensional CyTOF-based single cell profiling of
leukemia.
1.6 Project Rationale and Goals The major goal of my project was to use high-dimensional single cell profiling by CyTOF
to identify signaling pathway activation and/or phenotypic profiles associated with Ph-like B-ALL.
I chose CyTOF as it overcomes several hurdles encountered in fluorescence-based flow cytometry
and allows for simultaneous profiling of currently up to 40 markers. To achieve my goal, I had

10
two specific aims. The first was to develop and optimize a 36 marker CyTOF panel and assay to
measure expression of phosphorylated and phenotypic markers in primary B-ALL samples. The
second was to use this panel and assay to characterize phenotypic marker expression and basal or
TKi treating signaling pathways in Ph-like ALL.

11
Chapter 2 Material and Methods
12
2.1 Cell Culture
Human leukemia or lymphoma cell lines Ramos and U937 were purchased from the
American Type Culture Collection (Manassas, VA, USA), while the K-562 and NALM-6 cell lines
were obtained from Dr. Hans Hitzler (Toronto, ON), and Deutsche Sammlung von
Mikroorganismen und Zellkulturen (DSMZ, Braunschweig, Germany) respectively. Ramos, U937
and NALM-6 cells were cultured in complete RPMI media (cRMPI) comprised of RPMI 1640
GlutaMAX (Thermo Fisher Scientific, Waltham, MA, US) supplemented with 10% fetal bovine
serum (FBS) (Wisent Inc, Saint-Jean Baptiste, QC), 10 mM Hepes (pH 7.2, Wisent Inc), and 1
mM sodium pyruvate (Thermo Fischer Scientific). K-562 cells were cultured in Dulbecco’s
Modified Eagle Medium (DMEM)- GlutaMAX media (Thermo Fisher Scientific) supplemented
with 10% FBS, and 55µM 2-Mercaptoethanol (Thermo Fischer Scientific). The murine pro-B cell
line BaF3 was used in titrations experiment and was obtained from Dr. Robert Rottapel (Toronto,
ON)64. BaF3 cells engineered to express human TSLPR (BaF3-TSLPR) were also used and
obtained from Dr. Shai Izraei (Tel Aviv University, Israel). Both cell lines were cultured in cRPMI
and 0.1-0.5 ng/mL recombinant murine interleukin-3 (IL-3) (PeproTech, Montreal, QC). All cell
lines were cultured in a humidified 5% CO2 incubator. For routine passage, cell lines were
suspended at 5x10⁵ cells/mL in pre-warmed fresh media and transferred to a new vessel. To
determine the number of viable cells, cells were diluted in 0.4% Trypan Blue (Sigma Aldrich,
Oakville, ON) in PBS and counted using a hemocytometer (VWR International, Radnor, PA).
2.2 Peripheral Blood Mononuclear Cells (PBMC) from Non-Leukemic Donors
Single units of whole blood (480 mL of blood and 70 mL of citrate, phosphate, dextrose
anticoagulant) from two different donors were provided by Canadian Blood Services (CBS),
Vancouver, British Columbia and shipped on ice to SickKids Peter Gillgan Centre For Research
and Learning. PBMCs were isolated using Ficoll Paque Plus (GE Life Science) following the
manufacturer’s instructions, viably frozen in 90% FBS and 10% Dimethylsulfoxide (DMSO) and
stored in cryovials in liquid nitrogen until use.
2.3 B-ALL Patient Samples Viably frozen PBMC samples from adult patients with newly diagnosed B-ALL were
obtained from the Princess Margaret Cancer Center (Dr. Mark Minden). These samples were
13
collected after informed consent and following guidelines established by the Research Ethics
Board at the institution.
2.4 Antibodies Details of the Abs used including clone, manufacturer, metal-tag and titration condition
(cell line and treatment) are listed in Tables 2.1 and 2.2. Purified carrier-free Abs were purchased
and metal tagged using Fluidigm Maxpar metal conjugation kits (Fluidigm, Markham, ON)
according to the manufacturer’s instructions. The optimal concentration of each metal-tagged
immunophenotyping antibody was determined by titrating on cell populations containing cells
positive and negative for each marker as described in Results. The optimal concentration of
signaling pathway and apoptosis Abs was determined on cells that were treated with cytokines or
other signaling pathway agonists and/or small molecule signaling pathway antagonists (Table 2.3).
Lyophilized cytokines were dissolved in phosphate buffered saline (PBS, Thermo Fisher
Scientific) supplemented with 1% Bovine Serum Albumin (BSA) (Sigma-Aldrich Canada) at 10
µg/mL, aliquoted and stored at -800C. Goat anti-human IgM (polyclonal) and Staurosporine were
both purchased and stored at 40C until used in experiments. 10 minutes (min) prior to use fresh
Pervanadate (PV) (stock: 100 mM) was made from 480 µL Serum-Free Media ((SFM) RPMI 1640
GlutaMAX, 10 mM Hepes (pH 7.2, Wisent Inc), and 1 mM sodium pyruvate (Thermo Fischer
Scientific), 500 µL 200 mM sodium orthovanadate (Sigma-Aldrich Canada) and 20 µL Hydrogen
Peroxide (VWR International Ltd). 10 µL of this 100 mM PV stock was added per 1 mL of cells
suspended in SFM for a final concentration of 1 mM PV. DAS (Toronto Research Chemicals,
Toronto, ON) and RUX (Cedarlane, Burlington, ON) were reconstituted in DMSO at 30 mM,
aliquoted and stored at -200C. Prior to use, aliquots were further diluted in SFM.
2.5 Cell Staining for Mass Cytometry
Cells were thawed and washed once in cRMPI supplemented with benzonase (Sigma-
Aldrich Canada) and 4mM Mg2+ (Sigma-Aldrich Canada) before resting for 30 min at 370 C in
cRPMI without benzonase and 4mM Mg2+, and lastly deprived of serum through a rest in SFM. B-
ALL samples and control PBMC were serum-starved for 1h whereas cell lines were starved for 2h
(K-562, Ramos, Nalm-6, U937) or 4 hr (BaF3). BaF3 cells were also starved of IL-3 during the 4h
incubation. After serum starvation, samples were collected by centrifugation at 300xg and re-
14
suspended in SFM. Two million cells in 200 µL were aliquoted into 1.2 mL cluster tubes (Fischer
Scientific Company) and warmed for 15 min in a 370C water bath. Signaling agonist or antagonists
were then added in a volume of 50 µL at 5X their final concentration listed in Table 2.1. Cisplatin
(3µM in PBS, Cedarlane) was added for the last 3 min of each treatment. Cells were then
immediately fixed by adding an equal volume of 3.2% paraformaldehyde (Cedarlane). After 10
min at room temperature (RT), samples were washed twice by adding 400 µL of CyTOF staining
media (CSM) (PBS with 1% (w/v) BSA (Thermofisher Scientific)). For all post-fixation washes,
cells were pelleted at 600xg.
Where indicated, samples were barcoded using the Cell-ID 20-Plex Pd Barcoding kit from
Fluidigm, in which 3 different Pd isotopes are chosen from a pool of 6 Pd isotopes to make 20
unique barcodes. The barcoding procedure was carried out according to manufacturer’s
instructions, after which up to 20 samples were pooled into a 15mL Falcon tube for multiplexed
staining. Fc receptors were first blocked by re-suspending cell pellets in 25 µL /3x106 cells of
TruStain (BioLegend, California, USA) for 10 min at RT. Abs specific for surface markers were
diluted to 2X their desired final concentration in CSM. An equal volume of this cocktail was added
to the cells without washing out theTruStain, and cells were incubated for 30 min at RT. Cells
were then washed with 5mL of CSM, and resuspended in 1 mL/3x106 cells of Perm III (BD
Bioscience, Mississauga, ON), a methanol-based permeabilization solution, for 10 min on ice.
Samples were then capped and stored for up to 48h in a -200C freezer.
The next morning cells were brought to RT, washed twice with 5mL CSM and stained with
a cocktail of Abs specific for signaling proteins and other intracellular markers for 30 min at RT.
Cells were then washed twice in 5 mL CSM and re-suspended in PBS containing 0.3% saponin
(SAP), (Sigma-Aldrich Canada, Oakville, ON), 1.6% paraformaldehyde and 0.05 mM 191/193Iridium
(Fluidigm) to stain DNA for up to 48hr at 4oC. In Ab titration experiments, cells were not barcoded
and were stained with the 2- or 3-fold serial dilutions of each Ab ranging from 1/30 to 1/2430. In
titrations for anti-surface marker Abs the cell staining procedure altered slightly. Specifically, cells
were first stained with Cisplatin (1 µM) for 5 min at RT, and immediately quenched with CSM.
Following cells were re-suspended first in 25 µL Fc block for 10 min, and then 25 µL of a 2X
cocktail with titrating abs at concentrations ranging 3-fold from 1/30 to 1/2430.
15
Prior to acquisition on the Helios, cells were washed once with CSM, and once with PBS.
Finally, cells were re-suspended Fluidigm Cell Acquisition Solution containing 5-element EQ
normalization beads (Fluidigm) according to Fluidigm’s protocol. For patient experiments,
between 60,000 and 100,000 events per sample were collected. After acquisition the IMD files
were converted to FCS files. The FCS files were normalized using the global EQ bead “passport”
value on the Helios software.
2.6 De-barcoding and Clustering Analyses
For patient experiments, following normalization, FCS files were concatenated into one
FCS file containing the events collected from all the samples in the experiment. Therefore, prior
to Cytobank analysis the data was first de-barcoded using the single-cell de-barcoder MatLab
software (Nolan Lab, CA, USA). The software assigns each event in the multiplexed concatenated
file to their corresponding sample based on three brightest Pd isotopes present and eliminates
events with less than three Pd stains. The de-barcoder accomplishes this through two calculated
parameters: Barcode Separation (BcS) and Mahalanobis Distance (MD). BcS is a measure of the
intensity difference between the isotopes with the third and fourth highest intensities58,65. This value
is low for debris events which have low intensity values for all Pd isotopes and for cell aggregates
that have high intensity values for four or more Pd isotopes58,65. Increasing the stringency or value
of the BcS filters out these unwanted events. MD quantifies the distance, in Pd intensity space,
between an event and the distribution of its assigned barcode population. Application of a lower
MD value removes events with inconsistent Pd intensities58,65. These two parameters were used
accordingly in experiments to eliminate unassigned events and de-barcode samples. After de-
barcoding the MatLab software produces new FCS files, one per each sample/treatment.
The de-barcoded FCS files were then uploaded to the cloud-based storage and analysis
software Cytobank (Santa Clara, CA, USA). For titration experiments, FCS files were uploaded
directly to Cytobank. For all experiments, Cytobank was used to perform pre-gating to remove
EQ beads, debris, aggregates and dead cells, as well as to perform additional gating and
visualization for statistical analyses of titration experiments.
For the patient experiments I used the open source PG algorithm
(github.com/jacoblevine/PhenoGraph) to identify cell subsets in an unbiased manner. I performed
the clustering on FCS files containing only single live cells (exported from Cytobank) from 11
16
leukemic samples (7 BCR-ABL, 4 Ph-like) and 3 non-leukemic PBMC controls (244,986 events
total). The user-defined parameters were k=30 and Arcsinh scale argument=5, and I clustered
using the following 12 markers: CD45, HLA-DR, TSLPR, CD34, CD19, CD14, CD127, CD38,
CD33, CD3, CD79a and IgM. The event count from each sample was down-sampled to 17,499,
the lowest event count across all the samples. The R package “flowCore” was used to create new
FCS files which included PG cluster IDs. The FCS files were uploaded to Cytobank and run
through the dimensionality reduction algorithm tSNE using the same phenotypic markers as in
clustering and the PG cluster IDs. tSNE analysis was run with the following settings:
iterations=3,000, theta = 0.5, perplexity= 50. The final KLD value was 4.3. The 2-dimensional
plots produced by tSNE were then coloured based on PG clusters or markers of interest. To
visualize and quantify the PG clusters, I used the automatic clustering feature in Cytobank.
A matrix of Median Metal Intensities (MMIs) of phenotypic markers (CD45, CD34,
CD79a, CD19, IgM, HLA-DR, CD38, CD14, CD33, CD3, CD127 and TSLPR) from the leukemic
population (CD45lo CD34all) was imported into R and the heatmap.2 function from the R package
‘gplots’ was used to plot heatmap(s). Heatmap.2 function also carried out hierarchical clustering
of samples (results represented by column dendrogram) and of markers (resulted represented by
row dendrogram). MMIs are represented as SD from row mean (z-scores) for visualization
purposes, calculated using the heatmap.2 function66-67.
2.7 Statistical Analysis Agonist/Antagonist potentiated phospho-protein levels were normalized to phospho-
protein levels in untreated cells using the Log2 fold-change (FC) ratio calculated in Cytobank. This
ratio is the Log2 (MMI of the marker in treated cells divided by the MMI of the marker in untreated
cells). Log2 FC ratios and basal pSTAT5 MMIs were compared between subgroups with two-tailed
unpaired T-tests. MMIs of pAbs from VEH and DAS treated BCR-ABL samples were also
compared with two-tailed ratio paired T-tests. Cluster enrichments were compared Fisher’s exact
test. Multiple t-tests were also used to compare cluster abundance and MMIs of subgroup specific
clusters. The original FDR method of Benjamini and Hochberg method was used with a desired
FDR (Q) of 5%. For all analysis threshold for statistical significance was set below P=0.05. All
analysis and graphs displayed were made in Prism GraphPad Software (V8.0, La Jolla, California).
17
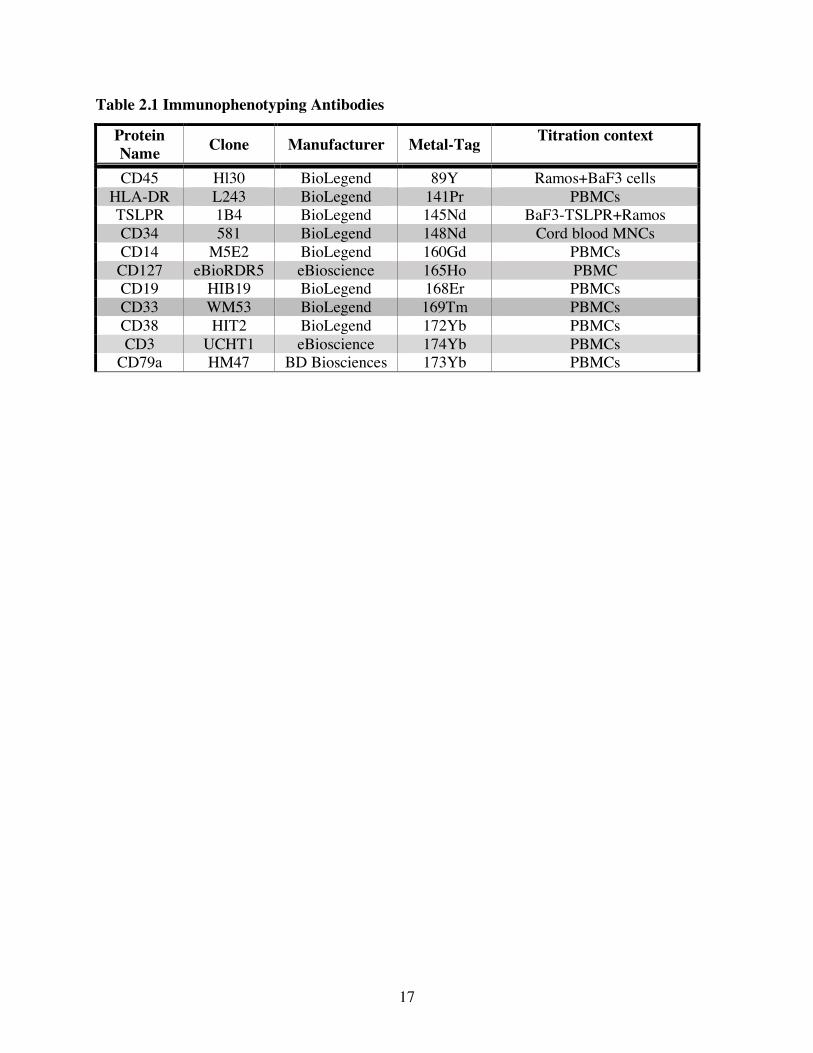
Table 2.1 Immunophenotyping Antibodies
Protein Name Clone Manufacturer Metal-Tag Titration context
CD45 Hl30 BioLegend 89Y Ramos+BaF3 cells HLA-DR L243 BioLegend 141Pr PBMCs TSLPR 1B4 BioLegend 145Nd BaF3-TSLPR+Ramos CD34 581 BioLegend 148Nd Cord blood MNCs CD14 M5E2 BioLegend 160Gd PBMCs CD127 eBioRDR5 eBioscience 165Ho PBMC CD19 HIB19 BioLegend 168Er PBMCs CD33 WM53 BioLegend 169Tm PBMCs CD38 HIT2 BioLegend 172Yb PBMCs CD3 UCHT1 eBioscience 174Yb PBMCs
CD79a HM47 BD Biosciences 173Yb PBMCs
18
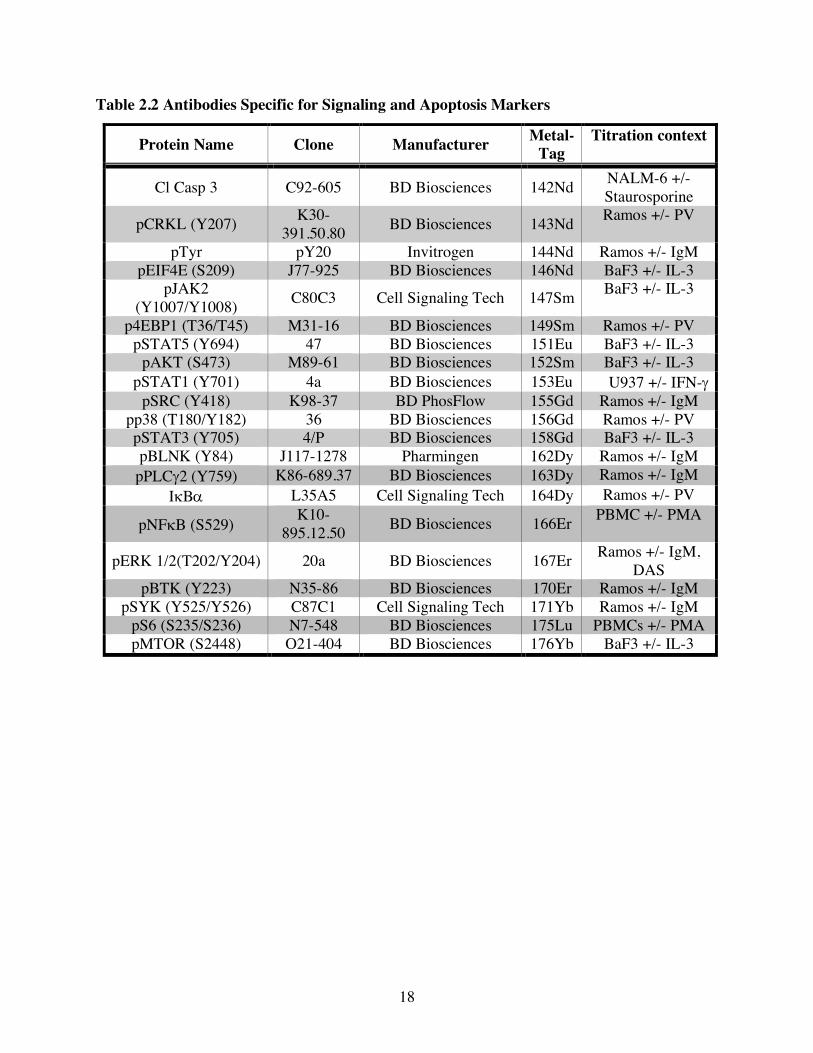
Table 2.2 Antibodies Specific for Signaling and Apoptosis Markers
Protein Name Clone Manufacturer Metal-Tag
Titration context
Cl Casp 3 C92-605 BD Biosciences 142Nd NALM-6 +/- Staurosporine
pCRKL (Y207) K30-391.50.80 BD Biosciences 143Nd Ramos +/- PV
pTyr pY20 Invitrogen 144Nd Ramos +/- IgM pEIF4E (S209) J77-925 BD Biosciences 146Nd BaF3 +/- IL-3
pJAK2 (Y1007/Y1008) C80C3 Cell Signaling Tech 147Sm BaF3 +/- IL-3
p4EBP1 (T36/T45) M31-16 BD Biosciences 149Sm Ramos +/- PV pSTAT5 (Y694) 47 BD Biosciences 151Eu BaF3 +/- IL-3
pAKT (S473) M89-61 BD Biosciences 152Sm BaF3 +/- IL-3 pSTAT1 (Y701) 4a BD Biosciences 153Eu U937 +/- IFN-g
pSRC (Y418) K98-37 BD PhosFlow 155Gd Ramos +/- IgM pp38 (T180/Y182) 36 BD Biosciences 156Gd Ramos +/- PV pSTAT3 (Y705) 4/P BD Biosciences 158Gd BaF3 +/- IL-3 pBLNK (Y84) J117-1278 Pharmingen 162Dy Ramos +/- IgM
pPLCg2 (Y759) K86-689.37 BD Biosciences 163Dy Ramos +/- IgM IkBa L35A5 Cell Signaling Tech 164Dy Ramos +/- PV
pNFkB (S529) K10-895.12.50 BD Biosciences 166Er PBMC +/- PMA
pERK 1/2(T202/Y204) 20a BD Biosciences 167Er Ramos +/- IgM, DAS
pBTK (Y223) N35-86 BD Biosciences 170Er Ramos +/- IgM pSYK (Y525/Y526) C87C1 Cell Signaling Tech 171Yb Ramos +/- IgM
pS6 (S235/S236) N7-548 BD Biosciences 175Lu PBMCs +/- PMA pMTOR (S2448) O21-404 BD Biosciences 176Yb BaF3 +/- IL-3
19
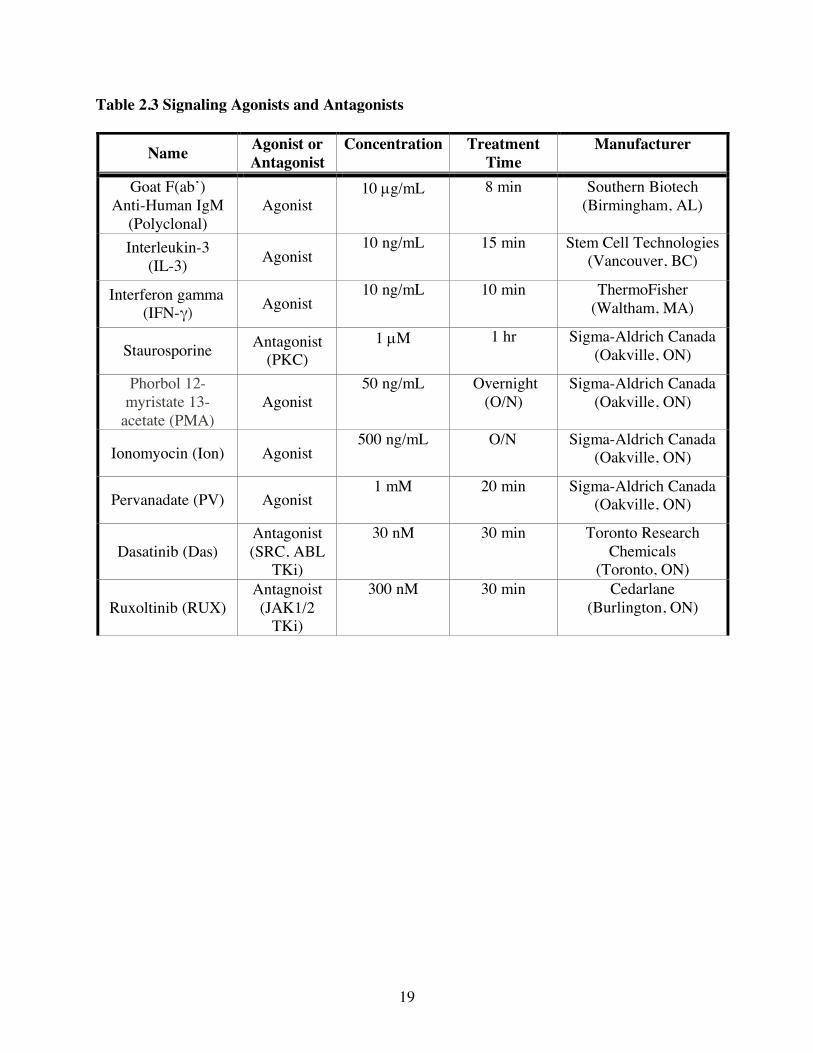
Table 2.3 Signaling Agonists and Antagonists
Name Agonist or Antagonist
Concentration Treatment Time
Manufacturer
Goat F(ab’) Anti-Human IgM
(Polyclonal) Agonist
10 µg/mL 8 min Southern Biotech (Birmingham, AL)
Interleukin-3 (IL-3) Agonist
10 ng/mL 15 min Stem Cell Technologies (Vancouver, BC)
Interferon gamma (IFN-γ) Agonist
10 ng/mL 10 min ThermoFisher (Waltham, MA)
Staurosporine Antagonist (PKC)
1 µM 1 hr Sigma-Aldrich Canada (Oakville, ON)
Phorbol 12-myristate 13-
acetate (PMA) Agonist 50 ng/mL Overnight
(O/N) Sigma-Aldrich Canada
(Oakville, ON)
Ionomyocin (Ion) Agonist 500 ng/mL O/N Sigma-Aldrich Canada
(Oakville, ON)
Pervanadate (PV) Agonist 1 mM 20 min Sigma-Aldrich Canada
(Oakville, ON)
Dasatinib (Das) Antagonist (SRC, ABL
TKi)
30 nM 30 min Toronto Research Chemicals
(Toronto, ON)
Ruxoltinib (RUX) Antagnoist (JAK1/2
TKi)
300 nM 30 min Cedarlane (Burlington, ON)

20
Chapter 3
Results
21
3.1 Optimization and Validation of CyTOF Antibodies
To simultaneously profile phenotypic and signaling markers a large panel of over 35
markers is needed. Building a panel of this size is difficult in fluorescence-based flow cytometry
due to spectral overlap and compensation. CyTOF overcomes these limitations by using a mass
spectrometer coupled to a flow cytometer and quantifies epitopes using Abs conjugated to heavy
metals instead of fluorophores. The use of heavy metal isotopes as reporters allows for
simultaneous profiling of up to 40 markers at a time56. Therefore, my goal was to build and
optimize a CyTOF panel and assay to profile signaling and phenotypic markers in B-ALL samples.
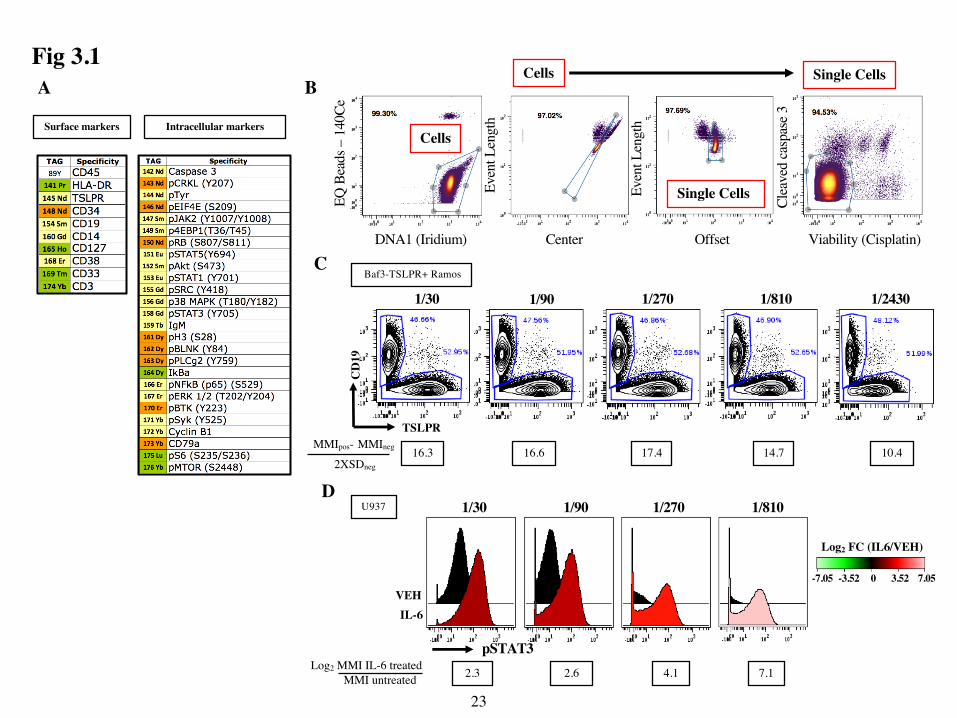
Specifically, I designed and validated a 36-marker CyTOF panel, seen in Fig 3.1A to
identify key cell lineages and signaling pathway activation in viably frozen diagnostic B-ALL
samples. I included Abs specific for various B cell markers including CD19 and intracellular
CD79a. I also included Abs specific for HLA-DR, CD38 and intracellular IgM to classify B cell
differentiation states. Leukemic B cells typically express lower amounts of CD45, a pan-
hematopoietic marker, than normal B cells. They also are often positive for CD34, a
stem/progenitor cell marker23. Therefore, I also included Abs specific for CD45 and CD34. As
approximately 50% of Ph-like samples aberrantly express the TSLPR heterodimer (TSLPR + IL-
7Ra (CD127)), I included Abs specific for both CD127 and TSLPR68. To identify myeloid and T
cells, I added Abs specific for CD3, CD33 and CD14 Abs to the panel. To detect signaling activity,
I also incorporated Abs specific for pSTAT5 a known ABL and JAK target, and various
phosphorylated signaling proteins in the PI3K/mTOR, RAS/MAPK and Pre-BCR signaling
pathways. Lastly, I included an Ab specific for Cleaved caspase-3 (Cl-casp 3) to identify and
exclude pre-apoptotic cells as they signal differently from live cells. I first validated and titrated
each Ab to their optimal dilution on cell lines or PBMC samples known to include positive and
negative cells for each marker.
For the Ab titration examples shown in Fig1 and all data shown in this thesis I used the
gating strategy in Fig 3.1B. First, I excluded EQ beads and debris by gating on EQ beads(140Ce)-
DNA+ events. From this “Cell” population (EQ-DNA+) I excluded aggregates using 2D plots of the
Event Length (EL) vs Center and EL vs Offset Gaussian Distribution parameters. EL is the number
of detector scans it takes to measure an ion cloud. A typical single cell occupies 10-40 scans of the
detector. Therefore, ion clouds with a higher EL are likely doublets and were eliminated. Center
and Offset are Gaussian parameters derived from the Helios acquisition software and are used to
22
identify outliers69. These two gates identified a “Single Cell” population. Lastly, from this “Single
Cell” population I removed dead and pre-apoptotic cells stained for Cisplatin or Cl-casp 3. All
plots shown were gated on the “Live Single Cell” population created by this 4-gate combination.
To titrate Abs specific for phenotypic markers I stained samples known to include cells
positive and negative for the marker of interest (eg., PBMC or tonsil samples). Alternatively, I
mixed cell lines known to be positive or negative for the marker. The titration condition I used for
each phenotypic marker is listed in Table 2.1 in the Material and Methods section. I choose the
optimal dilution by calculating the staining index (SI) using the formula shown in Fig. 3.1C. This
SI ratio accounts not only for the difference in intensity of the positive cells, but also for variation
in the spread of the negative population. For example, to titrate the TSLPR Ab I mixed TSLPR-
human CD19+ Ramos B lymphoma cells with murine CD19- BaF3 cells transfected with human
TSLPR. I stained this cell mixture for 30 min with an Ab-cocktail including anti-CD19 at a
constant dilution and anti-TSLPR at the following dilutions: 1/30, 1/90, 1/270, 1/810 and 1/2430.
Ultimately, I chose 1/300 as the optimal dilution since the SI ratio decreased at higher dilutions
To titrate phospho-specific Abs, I compared staining of untreated cells to those treated with
signaling pathway agonists or antagonists in cell lines. The titration conditions I used for phospho-
specific Abs are listed in Table 2.2 of my Material and Methods section. In the example shown in
Fig 3.1D I treated U937 cells with interleukin-6 (IL-6) for 15 min prior to fixation,
permeabilization and staining with anti-pSTAT3 at the following dilutions: 1/30, 1/90, 1/270,
1/810 and 1/2430. Ultimately, I chose 1/100 because at lower concentrations the pSTAT3 MMI of
the untreated cells decreased sharply and a large fraction of IL6-stimulated cells no longer stained
as reflected in the increasing Log2 FC ratios.
Surface markers Intracellular markers
EQ B
eads
–14
0Ce
DNA1 (Iridium) Center
Even
t Len
gth
Offset
Even
t Len
gth
Viability (Cisplatin)
Clea
ved
casp
ase 3
16.3 16.6 17.4 14.7 10.4
CBaf3-TSLPR+ Ramos
1/30 1/90 1/270 1/810 1/2430
TSLPR
CD
19
MMIpos- MMIneg
2XSDneg
A B
1/30 1/270
VEHIL-6
1/8101/90
Log2 FC (IL6/VEH)
U937
2.3 2.6 4.1 7.1
-7.05 7.053.52-3.52 0
D
Log2 MMI IL-6 treatedMMI untreated
pSTAT3
Cells
Cells Single Cells
Single Cells
23
Fig 3.1
24
Figure 3.1: Development and optimization of a 36-marker CyTOF panel. (A) CyTOF panel
separated into surface (12) and intracellular (24) markers. (B) Example of pre-gating strategy
shown for all experiments. The cells used in this example were non-leukemic PBMCs. Contour
plots of EQ beads (140Ce) vs DNA Intercalator Iridium were first gated to identify “Cells” and
exclude beads and debris. Plots of Event Length vs Offset and Event Length vs Centre gated on
the “Cells” population were then used to exclude doublets and identify “Single Cells”. Finally
plots of Cleaved Caspase-3 vs the Cisplatin gated on the “Single Cell” population were used to
exclude dead and pre-apoptotic cells. (C) Example of a titration for a surface marker Ab. A 50/50
mixture of BaF3 cells transfected with human TSLPR and Ramos cells were stained with anti-
CD19 (constant dilution) and 3-fold serial dilutions of anti-TSLPR ranging 1/30 to 1/2430.
Contour plots show CD19 vs TSLPR on the live single cell population defined using the pre-gating
strategy shown in (A). Gates used to identify the positive (CD19- TSLPR+) and negative (CD19+
TSLPR-) populations used for the SI calculations are shown. This calculation yields the difference
between the MMI of positive cells and negative cells divided by 2x the standard deviation (SD) of
the negative cells. (D) Example of a titration for a signaling Ab. U937 cells were stimulated with
SFM (Vehicle, VEH) or IL-6 for 15 min prior to fixation, permeabilization and staining with 3-
fold serial dilutions of anti-pSTAT3. Histograms show pSTAT3 intensity in VEH-treated and IL-
6 treated cells at each Ab dilution. To determine the optimal dilution for each Ab I calculated the
Log2 FC ratio of the MMI of treated cells divided by the MMI of cells treated with SFM (VEH).
25
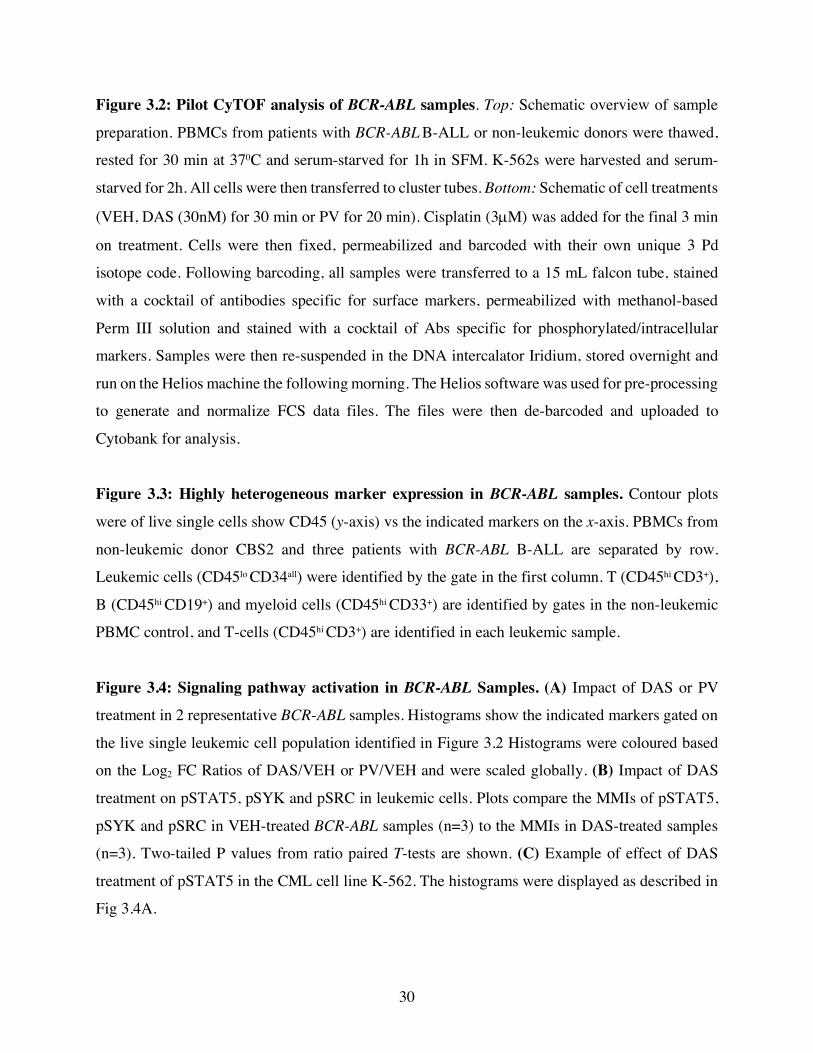
3.2 Validation Pilot on BCR-ABL Samples
Before profiling Ph-like samples, I wanted to ensure that the assay worked efficiently with
patient samples and that I could detect activated signaling in leukemic blasts. To achieve this goal,
I completed a pilot experiment on 3 BCR-ABL samples, the BCR-ABL CML (chronic myeloid
leukemia) cell line K-562 (a positive control for ABL signaling) and PBMCs from a non-leukemic
donor +/- the ABL-specific TKi DAS or PV (Fig 3.2). I included PV to inhibit phosphatase activity
and globally activate signaling to verify signaling-induced changes in phospho-Ab staining in each
sample. I chose BCR-ABL samples first as they have activated ABL signaling and are more readily
available compared to Ph-like samples. Following thaw and serum-starve, I divided each sample
into three cluster tubes and treated with SFM (VEH), DAS or PV. After treatment, I barcoded each
sample with a unique combination of 3 Pd isotopes from a pool of 6 (known as a 6 choose 3
combinatorial strategy) and pooled the samples together for staining. Ab cocktails specific for
surface and phosphorylated or intracellular markers were used sequentially as described in
Materials and Methods.
After pre-gating, I identified notable differences in expression of several markers in PBMC
from leukemic and non-leukemic donors. PBMC from non-leukemic donors contained CD45hi
subsets expressing CD19 (B cells), CD33 (myeloid cells) and CD3 (T cells) (Fig 3.3). All leukemic
samples also contained a discrete T cell population but had few CD45hi cells that co-expressed
CD19 or CD33. PBMC from non-leukemic donors also contained rare CD45lo CD34+ cells, likely
circulating hematopoietic stem cells and progenitors. By contrast, PBMCs from BCR-ABL
leukemic donors had a prevalent CD45lo CD34+/- CD19+ population that expressed surprisingly
varying levels of the other markers. These data show that my CyTOF panel can readily identify
leukemic B cells in BCR-ABL samples.
As the BCR-ABL gene fusion is known to activate numerous signaling pathways, I next
investigated the signaling patterns in these samples. The histograms in Fig 3.4A display basal
phosphorylation of various markers and the effects of DAS and PV in leukemic cells of 2 BCR-
ABL samples. Importantly, PV treatment increased expression of all phospho-markers,
demonstrating that the Abs can detect signaling-related changes in phosphorylation and that
leukemic blasts from the patient samples were capable of signaling. DAS treatment significantly
decreased pSTAT5 in the BCR-ABL B-ALL samples and robustly in the K-562 cells (Fig 3.4B/C),
demonstrating that in both STAT5 phosphorylation is ABL dependent. The BCR-ABL samples

26
showed varying basal expression of other phospho-markers including pSYK and pSRC (phospho-
Sarcoma kinase) that were also significantly decreased by DAS treatment. In conclusion, this pilot
experiment showed that this assay can detect oncogenically activated signaling in leukemic patient
samples.

Pd BC1-1312 Phenotypic Markers
20 Signaling & Intracellular Markers
De-barcode & Analysis
SamplesBC1 BC2 BC3BC4 BC5 BC6
BC13
BC7 BC8 BC9
Patient 1
Patient 2
K-562PBMCs
VEHDASPV
Patient 3BC10 BC11 BC12
Treatment
3 BCR-ABL PBMC5 samples 1 Non-leukemic PBMC
K-562 cell line
Each sample
Cluster tubes for treatment
1. Thaw2. 30 min rest at 370C
3. 1h serum-starve
27
Fig 3.2

CD
45
CD34 CD19CD3 HLA-DRCD38
795
100709
90124
CD33
Non-leukemicPBMC
BCR-ABL B-ALL
“Leukemic Cells”
28
Fig 3.3

BCR-ABLB-ALL795
90124
pSTAT5 pSYK pSRC pBTK
VEH
DAS
PV
VEH
DAS
PV
Log2 FC (DAS/VEH or PV/VEH)
-7.0 7.00-3.5 3.5
A
C
Log2 FC (DAS/VEH)
DAS
VEH
-2.92 2.921.46-1.46 0
BCR-ABL CML Cell Line
K-562
pSTAT5
29
pSTAT5P=0.01
P=0.02
pSYK
P=0.0004
pSRC
Treatment
BFig 3.4
30
Figure 3.2: Pilot CyTOF analysis of BCR-ABL samples. Top: Schematic overview of sample
preparation. PBMCs from patients with BCR-ABL B-ALL or non-leukemic donors were thawed,
rested for 30 min at 370C and serum-starved for 1h in SFM. K-562s were harvested and serum-
starved for 2h. All cells were then transferred to cluster tubes. Bottom: Schematic of cell treatments
(VEH, DAS (30nM) for 30 min or PV for 20 min). Cisplatin (3µM) was added for the final 3 min
on treatment. Cells were then fixed, permeabilized and barcoded with their own unique 3 Pd
isotope code. Following barcoding, all samples were transferred to a 15 mL falcon tube, stained
with a cocktail of antibodies specific for surface markers, permeabilized with methanol-based
Perm III solution and stained with a cocktail of Abs specific for phosphorylated/intracellular
markers. Samples were then re-suspended in the DNA intercalator Iridium, stored overnight and
run on the Helios machine the following morning. The Helios software was used for pre-processing
to generate and normalize FCS data files. The files were then de-barcoded and uploaded to
Cytobank for analysis.
Figure 3.3: Highly heterogeneous marker expression in BCR-ABL samples. Contour plots
were of live single cells show CD45 (y-axis) vs the indicated markers on the x-axis. PBMCs from
non-leukemic donor CBS2 and three patients with BCR-ABL B-ALL are separated by row. Leukemic cells (CD45lo CD34all) were identified by the gate in the first column. T (CD45hi CD3+),
B (CD45hi CD19+) and myeloid cells (CD45hi CD33+) are identified by gates in the non-leukemic
PBMC control, and T-cells (CD45hi CD3+) are identified in each leukemic sample.
Figure 3.4: Signaling pathway activation in BCR-ABL Samples. (A) Impact of DAS or PV
treatment in 2 representative BCR-ABL samples. Histograms show the indicated markers gated on
the live single leukemic cell population identified in Figure 3.2 Histograms were coloured based
on the Log2 FC Ratios of DAS/VEH or PV/VEH and were scaled globally. (B) Impact of DAS
treatment on pSTAT5, pSYK and pSRC in leukemic cells. Plots compare the MMIs of pSTAT5,
pSYK and pSRC in VEH-treated BCR-ABL samples (n=3) to the MMIs in DAS-treated samples
(n=3). Two-tailed P values from ratio paired T-tests are shown. (C) Example of effect of DAS
treatment of pSTAT5 in the CML cell line K-562. The histograms were displayed as described in
Fig 3.4A.

31
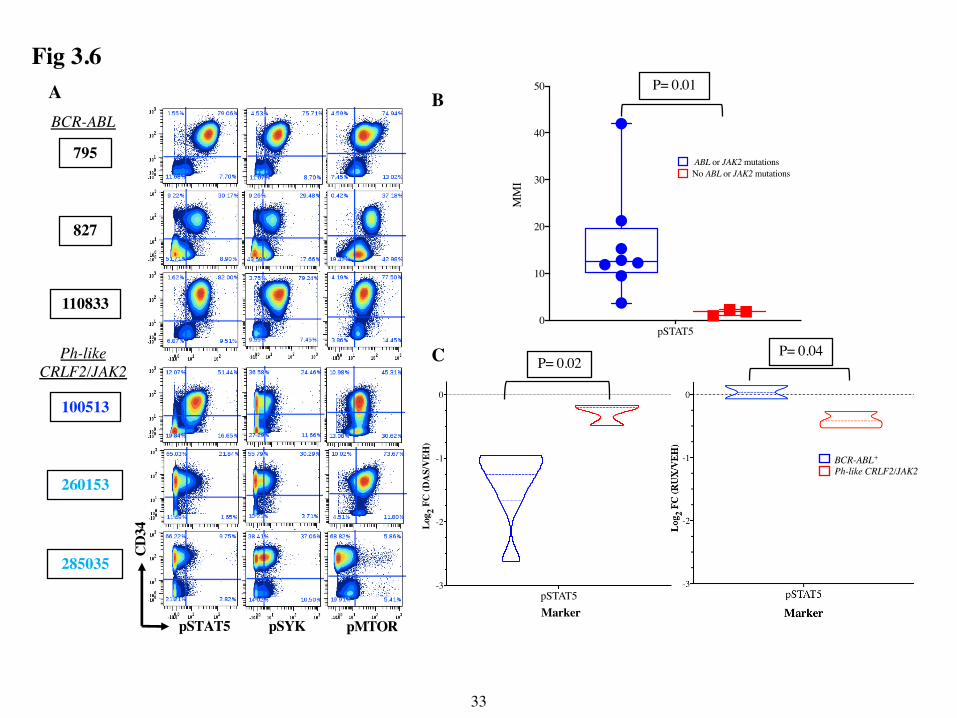
3.3 CyTOF Profiling of Signaling Activity in Ph-like vs BCR-ABL B-ALL Subgroups
Most Ph-like ALL cases have mutations that activate JAK/STAT or ABL signaling.
Therefore, I used my CyTOF assay to compare signaling activity and phenotypic markers in
PBMC from adult patients with Ph-like (n=4) compared to BCR-ABL (n=7) B-ALL over three
experimental days as laid out in Fig 3.5. I included PBMC from a non-leukemic donor in each
experiment as a positive control for the phenotypic markers. Among the 4 Ph-like cases, one was
CRLF2- with a PAX5-JAK2 fusion, two were CRLF2+, and one had a Ph-like gene expression
signature but signaling mutations associated with this class were not detected by RNA-sequencing
(Mark Gower and C. Guidos, unpublished data).
Two-dimensional contour plots of CD34 versus selected phospho-markers for 3 samples
from each group are shown in Fig 3.6A. The CD34+ leukemic cells in BCR-ABL samples exhibited
high pSTAT5, as expected based on prior reports that pSTAT5 is a direct ABL target as well as
high pSYK and pMTOR33,70. Interestingly, pSTAT5 was more highly expressed by CD34+
leukemic cells in the Ph-like sample with the PAX5-JAK2 fusion than in the CRLF2+ cases. In fact,
basal pSTAT5 levels were significantly higher in the samples with ABL or JAK2 mutations
compared to the samples without (Fig 3.6B). Importantly, DAS decreased pSTAT5 more robustly
in the BCR-ABL than the Ph-like samples, indicating the dependence of STAT5 phosphorylation
on active ABL signaling in this group (Fig 3.6C). Lastly, RUX decreased pSTAT5 more robustly
than DAS in all 3 of these Ph-like CRLF2 and JAK2 samples (Fig 3.6C). These data suggest that
this CyTOF phospho-assay can identify leukemic blasts with activating ABL or JAK2 mutations
based on their higher expression of basal pSTAT5 and its reduction by ABL- or JAK2-selective
tyrosine kinase inhibitors

Sample ID Key Mutations Leukemic Subgroup100709 BCR-ABL BCR-ABL795 BCR-ABL BCR-ABL90124 BCR-ABL BCR-ABLCBS2 (non-leukemic) -110833 BCR-ABL BCR-ABL120324 BCR-ABL BCR-ABL100513 PAX5-JAK2 Ph-like JAK2260153 CRLF2+ Ph-like CRLF2827 BCR-ABL BCR-ABLCBS2 (non-leukemic) -285035 CRLF2+ Ph-like CRLF2100702 ERG-LINC, IKZF1 Ph-like Other9407 BCR-ABL BCR-ABLCBS2 (non-leukemic) -
LeukemiaSubgroup
# of Sample(s)
BCR-ABL 7
Ph-like JAK2 1
Ph-like CRLF2 2
Ph-like Other 1
CBS2 (non-leukemic) 3
Summary Table
Pilot
Exp #1
Exp #2
Exp #3
A B
32
Fig 3.5
pSTAT5 pSYK pMTOR
CD
34795
827
110833
A B
100513
260153
285035
BCR-ABL
Ph-like CRLF2/JAK2 P= 0.02
P= 0.04C
P= 0.01
pSTAT50
10
20
30
40
50
ABL or JAK2 mutationsNo ABL or JAK2 mutations
MM
I
pSTAT5-3
-2
-1
0
Log 2 F
C (D
AS/
VEH
)
Marker
BCR-ABL+
Ph-like CRLF2/JAK2
33
Fig 3.6
34
Figure 3.5: Patient cohort for Ph-like vs BCR-ABL experiments. (A) List of sample IDs, key
mutations and subgroups profiled in the BCR-ABL pilot and 3 additional experiments. All samples
are from adult patients at Princess Margaret Cancer Centre. PBMC samples from a single non-
leukemic donor were used (CBS2). The clinical laboratory at Princess Margaret Cancer Centre
identified all BCR-ABL samples as such by cytogenetic analysis, FISH or RT-PCR. The clinic
laboratory also identified the Ph-like CRLF2 samples (260153 and 285035) as CRLF2+ by flow
cytometry. The PAX5-JAK2 fusion in sample 100513 was identified by my fellow student Mark
Gower using RNA-sequencing. Sample 100702 was classified as Ph-like Other based on gene
expression profiling performed by Mark Gower. (B) Summary table of number of samples profiled
per genetic subtype. In experiment 3 and 4 all samples were also treated with RUX (300 nM) for
30 min.
Fig 3.6: DAS and RUX decrease pSTAT5 more robustly in BCR-ABL and Ph-like
CRLF2/JAK2 samples respectively. (A) Comparison of basal pSTAT5, pSYK and pMTOR
levels among BCR-ABL, Ph-like CRLF2 and Ph-like JAK2 samples. Contour plots of live single
cells from untreated are shown for 3 representative BCR-ABL, 1 Ph-like JAK2 (Sample ID in dark
blue) and 2 Ph-like CRLF2 (sample ID in light blue) are shown. Plots show CD34 (y-axis) vs the
indicated markers on the x-axis. The percentage of cells in each quadrant is shown. (B) Box and
whisker plots show basal pSTAT5 MMI of leukemic cells from untreated samples with mutations
in ABL or JAK2 (BCR-ABL + Ph-like JAK2, n=8) compared to those without mutations in ABL or
JAK2 (Ph-like CRLF2 + Ph-like Other HR, n=3). Each dot shows the pSTAT5 MMI from a single
sample and the line is the mean MMI of all samples. (C) Effect of DAS or RUX treatment on
pSTAT5 in BCR-ABL vs Ph-like CRLF2/JAK2 (Ph-like CRLF2 + Ph-like JAK2) samples. Violin
plots compare the Log2 FC ratio of Treated/Untreated (DAS/VEH or RUX/VEH) cells for pSTAT5
between groups. DAS treatment: BCR-ABL n=7, Ph-like CRF2/JAK2 n=3. RUX treatment: BCR-
ABL n=2, Ph-like CRLF2/JAK2 n=3. P values from unpaired, two-tailed T-tests are displayed for
comparison in B and C.
35
3.4 Unsupervised Clustering Algorithm Reveals Differential Expression of Phenotypic
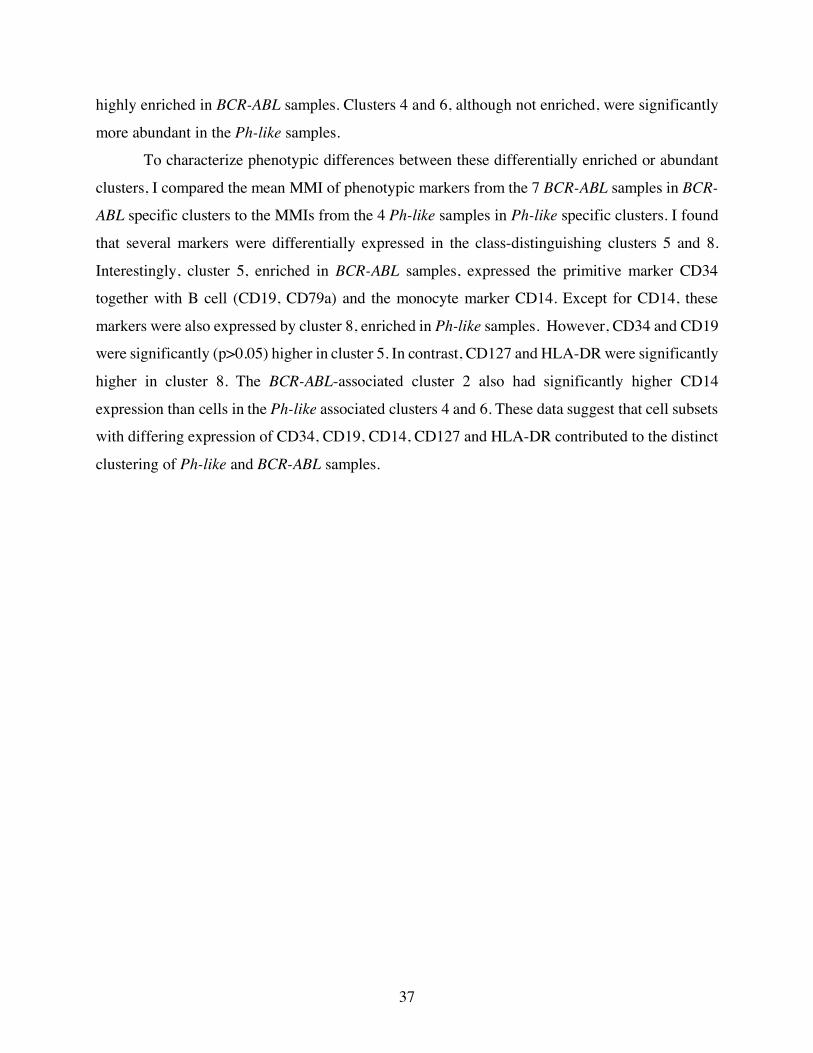
Markers in Ph-like and BCR-ABL Samples I next sought to determine if these Ph-like and BCR-ABL samples exhibited distinct
phenotypic marker profiles, since this could be helpful in identifying Ph-like samples in the clinic.
To identify any group specific patterns, my fellow student Mark Gower performed hierarchical
clustering of the MMIs of phenotypic markers from leukemic cells in each sample. However, the
dendrogram did not reveal any group-specific patterns (Fig 3.7). Therefore, I next used PG, an
unsupervised clustering algorithm to ask whether BCR-ABL and Ph-like samples contained distinct
cell subsets. Lastly, I used the dimensionality reduction algorithm tSNE to visualize the PG
clusters.
In my PG analysis, I chose K=30 and clustered 17,499 events (244,986 events total) from
each of the 7 BCR-ABL, 4 Ph-like and 3 non-leukemic PBMC samples using 12 phenotypic
markers: CD45, CD34, IgM, CD19, CD79a, CD38, HL-ADR, CD33, CD14, TSLPR, CD127 and
CD3. Expression of the signaling markers was generally low and none differed significantly across
the 2 subgroups (data not shown). Therefore, they were not considered further in my analysis.
The major cell lineages cluster distinctly and mapped to different areas on the t-SNE maps
from one another, as seen in the representative plots from one control PBMC sample, coloured by
expression of CD3, IgM or CD33 (Fig 3.8A). To further explore the non-leukemic clusters, I
graphed the abundance of each cluster as the % of total live population in the control PBMC
samples (Fig. 3.8B). From these graphs, I identified the top 8 most abundant clusters in non-
leukemic PBMC control as 9,13,14, 15, 16, 17, 20 and 23. As depicted in the heat map in Fig 3.8C,
cells in the top 2 most abundant clusters expressed myeloid or B cell markers, while the 3rd to 8th
most abundant clusters expressed T cell markers. PG identified 8 major non-leukemic clusters
which represented B, myeloid and T-cells.
These 8 non-leukemic clusters were also present to varying extents in the leukemic samples
as shown by the t-SNE maps in Fig 3.9. For example, in sample 9407 the T cell clusters (top right,
coloured orange-red) were much less abundant than in the non-leukemic PBMC example above it.
In contrast, in other samples such as 285035, the T cell clusters appeared very similar in abundance
to the PBMC control. By contrast, inspection of the tSNE maps for each leukemic sample showed
the presence of unique clusters that were not found in the PBMC controls.
36
Examination of t-SNE maps that were pre-gated on CD45lo CD34+/- cells from each sample
confirmed that these clusters were leukemia-specific (Fig 3.10) and revealed differences in the
leukemic clusters from BCR-ABL versus Ph-like subgroups. For example, the leukemic clusters
from Ph-like samples, irrespective of their mutation, occupied the right side of the t-SNE maps,
whereas they occupied the left side of the maps in 5/7 of the BCR-ABL samples. The two BCR-
ABL samples (9407 and 827) that did not follow this pattern mapped more similarly to Ph-like
samples. Interestingly, these two samples also clustered with the Ph-like samples in the
dendrogram in Fig 3.7.
These data suggested that the prevalence of some leukemic clusters differed across BCR-
ABL vs Ph-like samples. To further explore this idea, I used heatmaps to examine marker intensity
among the leukemic clusters in each sample (Fig 3.11). I chose to examine the top 5 most abundant
clusters since they accounted for > 60% of the total live singlet population across 10/11 samples
analyzed. The only exception was sample 827 in which the top 5 clusters totaled 37 % of the total
cells. Interestingly, the top 5 most abundant leukemic clusters and their marker intensities were
quite heterogeneous both within and between the two subgroups. For example, the 5/7 BCR-ABL
samples had a CD14-expressing cluster that was absent from the Ph-like samples. Overall, the 5
most abundant leukemic clusters exhibited highly variable expression of phenotypic markers in
both the BCR-ABL and Ph-like subgroups.
I next asked if the two leukemia subtypes exhibited differential cluster enrichment or
cluster abundance within the top 5 most abundant leukemic clusters. First, to determine which
clusters were enriched in the both subgroups, I constructed contingency tables and used Fisher’s
exact test to determine if the number of cases that had each PG cluster in their top 5 most abundant
clusters differed by leukemic subgroups (Fig 3.12A). Second, I compared the abundance of cells
in selected clusters across the two subgroups (Fig 3.12B). This analysis revealed that cluster 0 was
not selectively enriched in one group over the other. Moreover, although cluster 0 trended towards
higher abundance in the Ph-like samples, this difference was not significant. However, other
clusters were differentially represented in the 2 leukemia groups. In particular, cluster 5 was
significantly enriched in BCR-ABL samples, whereas cluster 8 was significantly enriched in Ph-
like samples. These 2 clusters also showed significantly different abundance between the 2 groups.
Cluster 2 was also present in 5/7 BCR-ABL samples and not in Ph-like samples, and thus was more
37
highly enriched in BCR-ABL samples. Clusters 4 and 6, although not enriched, were significantly
more abundant in the Ph-like samples.
To characterize phenotypic differences between these differentially enriched or abundant
clusters, I compared the mean MMI of phenotypic markers from the 7 BCR-ABL samples in BCR-
ABL specific clusters to the MMIs from the 4 Ph-like samples in Ph-like specific clusters. I found
that several markers were differentially expressed in the class-distinguishing clusters 5 and 8.
Interestingly, cluster 5, enriched in BCR-ABL samples, expressed the primitive marker CD34
together with B cell (CD19, CD79a) and the monocyte marker CD14. Except for CD14, these
markers were also expressed by cluster 8, enriched in Ph-like samples. However, CD34 and CD19
were significantly (p>0.05) higher in cluster 5. In contrast, CD127 and HLA-DR were significantly
higher in cluster 8. The BCR-ABL-associated cluster 2 also had significantly higher CD14
expression than cells in the Ph-like associated clusters 4 and 6. These data suggest that cell subsets
with differing expression of CD34, CD19, CD14, CD127 and HLA-DR contributed to the distinct
clustering of Ph-like and BCR-ABL samples.
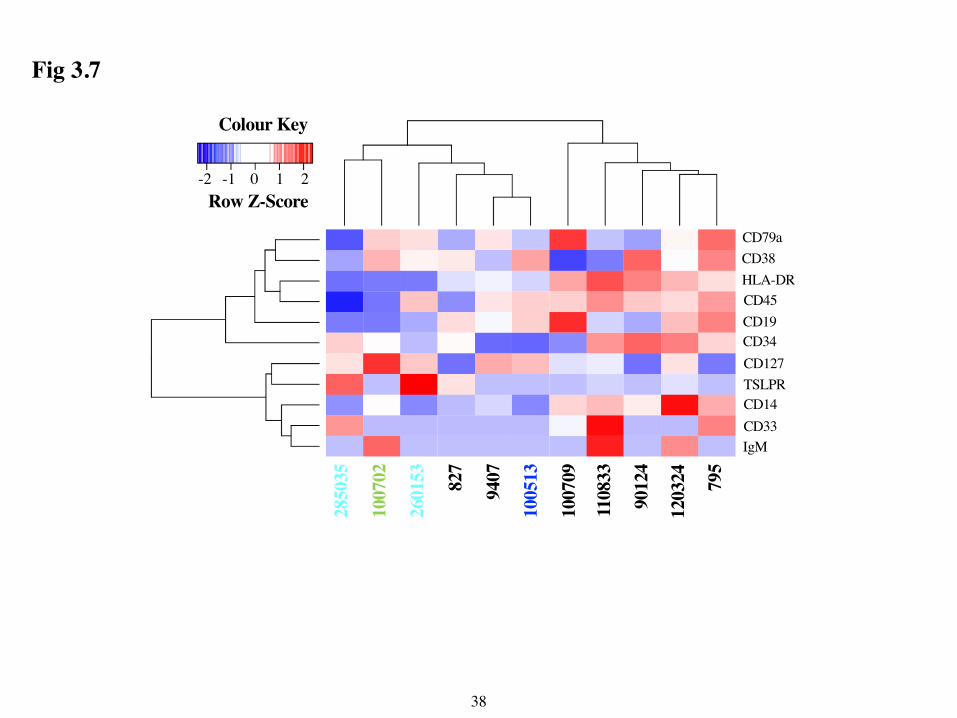
-2
20 1-1Row Z-Score
795
1203
24
9012
4
1108
33
1007
09
1005
13
9407827
2601
53
2850
35
1007
02
CD79aCD38HLA-DRCD45CD19CD34
CD14CD33IgM
CD127TSLPR
Colour Key
Row Z-Score-2 -1 0 1 2
38
Fig 3.7

tSNE1
CD3 CD33
T Cells B Cells Myeloid CellsA
tSNE2
Myeloid CellsC CD3
IgM
9
13
14
15
16
17
20
23
CD79a
CD19
CD14CD33CD38
B Cells
T Cells
Cluster
Arcsinh Ratio of Medians
-6.37 6.370-3.17 3.17
B1 2 3PBMC30
20
10
00 32
% o
f tot
al
Cluster 0 32 0
HLA-DR
IgM
39
Fig 3.8
CD127
32
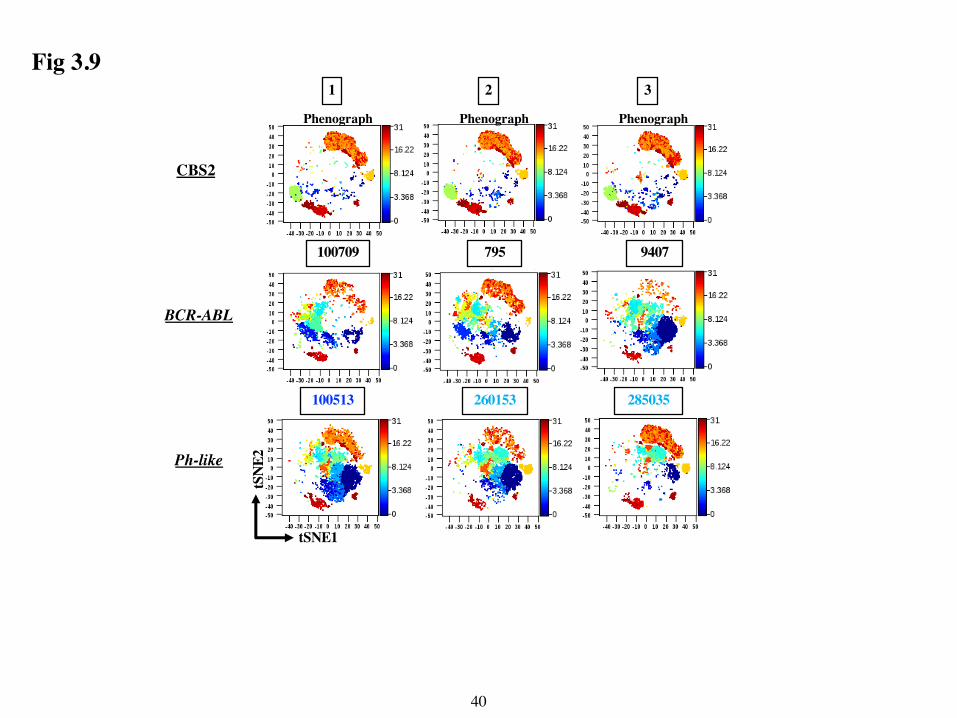
CBS2
100709 795 9407
Ph-like
100513 260153 285035
BCR-ABL
1 2 3
tSN
E2
Phenograph Phenograph Phenograph
tSNE1
40
Fig 3.9
BCR-ABL
120324 827 9407
Ph-like 100513 260153 285035 100702
tSNE2
tSNE1
100709 795 90124 110833
Phenograph Phenograph Phenograph Phenograph
41
Fig 3.10

IgM
100513
260153
285035
100702
Ph-like
100709
795
90124
110833
120324
9407
827
11
BCR-ABL
63.411.36.74.13.1
% of total
39.26.76.66.55.4
35.521.510.58.57.335.221.88.86.34.1
36.319.76.66.45.5
65.99.364.43
10.710.18.74.42.9
% of total23.621.113.812.86.7
41.316.26.44.73.851.17.57.54.31.126.424.19.37.26.1
0
527
105204
12211125
1152
290
25
190
21
05376
08
2865
03481
04
810
6
60
1985
480
196
Cluster ClusterCD45
CD34
CD19
CD79
aCD
127
CD14
CD33
CD38
HLA
-DR
TSLP
R
-3.71 3.71-1.86 1.860
Arcsinh Ratio of Medians
CD45
CD34
CD19
CD79
aCD
127
CD14
CD33
CD38
HLA
-DR
TSLP
R
IgM
88.6%
64.4%
83.3%
76.2%
74.5%
88.6%
36.8%
78%
72.4%
71.5%
73.1%
42
Fig 3.11
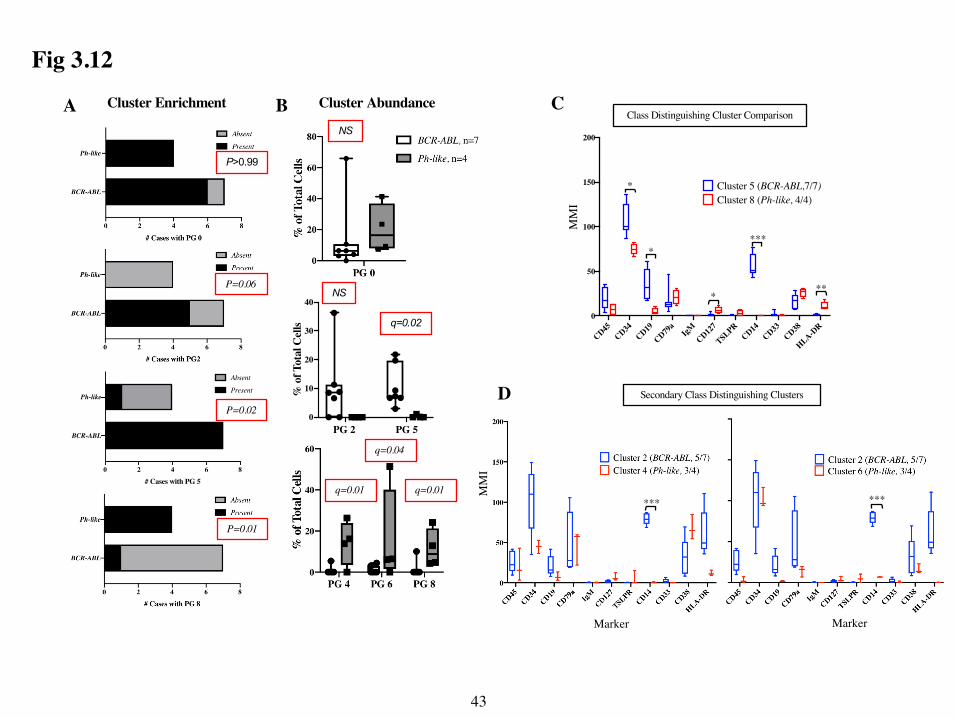
A
P>0.99
NS
P=0.01
P=0.06
Cluster Enrichment Cluster Abundance
q=0.01 q=0.01
q=0.04
P=0.02
0 2 4 6 8
BCR-ABL
Ph-like
# Cases with PG 5
Present
Absent
q=0.02
NS
PG 2 PG 50
10
20
30
40%
of T
otal
Cel
ls
B Class Distinguishing Cluster Comparison
*** ***
Marker
MM
I
MM
I
C
Marker
D Secondary Class Distinguishing Clusters
CD45CD34CD19
CD79a
IgMCD127
TSLPRCD14CD33CD38
HLA-DR
0
50
100
150
200
Cluster 5 (BCR-ABL,7/7) Cluster 8 (Ph-like, 4/4)
*
*
*
***
**
43
Fig 3.12
44
Figure 3.7: Hierarchical clustering of phenotypic markers by sample group. MMIs of the
indicated phenotypic markers gated on leukemic cells from each sample were hierarchically
clustered using the R heatmaps.2 package. Each row was coloured based on the Z score which
indicates of signed fractional number of standard deviations that separate each sample MMI from
the row mean MMI. Samples were coloured according to their leukemic subtypes. (Ph-like
JAK2=dark blue, Ph-like CRLF2=light blue, Ph-like Other=green, BCR-ABL=black).
Figure 3.8: Unbiased identification of non-leukemic clusters. Live single cells from all samples
listed in Table 3.4.1 were clustered using the PG algorithm (k=30) based on expression of 12
phenotypic markers: CD45, CD34, CD19, CD3, CD79a, IgM, HLA-DR, CD14, CD33, CD38,
TSLPR, CD127. (A) Representative tSNE plots of 1 control PBMC sample coloured by CD3,
CD19 or CD33 intensity. Black arrows identify T, B and myeloid cell clusters. The t-SNE was
performed using 3,000 iterations, the 12 phenotypic markers and the PG cluster IDs. (B) Major
PG clusters in non-leukemic PBMC. Bar graphs show abundance (%) of the 32 PG clusters
identified in the 3 non-leukemic PBMC samples as determined by automatic cluster gating in
Cytobank. (C) Heatmap analysis of myeloid, B and T cell marker intensity in the 8 most abundant
PBMC PG clusters (rows). Heat-map shows expression levels of phenotypic markers (columns) in
the 8 most abundant clusters of a control PBMC samples. The heatmap is colored by the arcsinh
ratio of MMIs normalized to the column’s minimum.
Figure 3.9: PG tSNE visualization of PG clusters in non-leukemic vs leukemic PBMC
samples. tSNE plots of control PBMC from 3 experiments compared to 3 examples of BCR-ABL
samples and Ph-like CRLF2/JAK2 PBMC samples. Graphs are colored by PG cluster number. Ph-
like JAK2 and Ph-like CRLF2 sample IDs are coloured as previously described in Fig 3.6.
Figure 3.10: PG tSNE visualization of leukemic clusters in BCR-ABL vs Ph-like samples.
Clustering and tSNE analysis were performed as described in Figure 3.8. tSNE maps shown were
gated on the leukemic cell population (CD45lo CD34+) and coloured based by PG cluster number.
Ph-like sample IDs were coloured based on their subgroup as previously described.

45
Figure 3.11: Phenotypic marker intensity in the 5 most abundant PG leukemic clusters in
each sample. Heat maps compare the expression of phenotypic markers (CD45, CD34, CD19,
CD79a, IgM, CD127, TSLPR, CD14, CD33, CD38 and HLA-DR) in the top 5 most abundant
clusters in each sample. The % of the total live population in each cluster is listed to the right of
each heat map. Non-leukemic clusters identified in Fig 3.8 were excluded. Phenotypic markers are
separated by row and normalized by the arcsinh ratio to the column’s minimum within each
sample. All heat maps are scaled globally. Samples are separated by subgroups, BCR-ABL on the
left and Ph-like on the right. Ph-like samples are coloured based on subgroup as previously
described in Fig 3.4.1.
Figure 3.12: PG Cluster enrichment and abundance analysis revealed significantly different
BCR-ABL and Ph-like specific clusters. (A) Cluster enrichment analysis highlighted significant
differences between the prevalence of clusters 2, 5 and 8 in BCR-ABL and Ph-like samples. Bar
graphs show absence (grey) or presence (black) of each cluster in the top 5 most abundant clusters
in the two subgroups. P values from Fisher’s exact test are shown for comparison. (B) Abundance
of selected clusters between BCR-ABL and Ph-like samples. Bar graphs show the % of cells (out
of total live singlets) in each cluster per subgroup (BCR-ABL=white, Ph-like=grey). The line in the
middle of the boxplot represents the mean. In both A and B the FDR-adjusted Q-values from
multiple T-test are displayed. (C) Phenotypic differences in class distinguishing clusters. Graph
compares the mean MMI of phenotypic markers from the 7 BCR-ABL samples in cluster 5 (BC-
ABL class distinguishing) to the mean MMI from the 4 Ph-like samples in cluster 8 (Ph-like
specific). The top and bottom of each box highlights the 25th and 75th MMI percentile, the line
within each box represents the mean MMI and the whiskers indicate the minimum and maximum
MMI present. (D) Secondary class distinguishing clusters differed significantly in CD14
expression. Graphs compare mean MMI of phenotypic markers from 5/7 BCR-ABL samples in
cluster 2 (excluded samples 9407 and 827 because cluster was not present in their top 5 most
abundant) to the mean MMI of phenotypic markers from 3/4 Ph-like samples in cluster 4 (excluded
sample 285035) or cluster 6 (excluded sample 100513). In both Fig C and D and C *s are
indicative of FDR-adjusted Q-values from multiple t-tests. *** Q<0.001, ** Q=0.002, * Q=0.02.

46
3.5 Conclusions and Summary
In conclusion, I successfully built and optimized a 36-marker CyTOF panel and assay
which I used to identify Ph-like associated signaling and phenotypic marker expression. After
titrating each antibody, my final validation experiment, a BCR-ABL pilot, revealed surprising
heterogeneity in phenotypic marker expression and basal signaling activity in the BCR-ABL
subgroup. Following validation and optimization I profiled 7 BCR-ABL, 2 Ph-CRLF2, 1 Ph-like
JAK2 and 1 Ph-like Other, a 3 non-leukemic PBMC samples. Comparison of signaling activity
and phenotypic marker expression between the Ph-like and BCR-ABL subgroups revealed
significant differences. First, analysis of the signaling patterns suggested that this CyTOF
phospho-assay can identify leukemic blasts with activating ABL or JAK2 mutations based on
higher expression of pSTAT5 and its reduction by ABL- versus JAK2-selective TKis. Second,
BCR-ABL and Ph-like samples clustered distinctly from one another and mapped to opposite sides
of tSNE graphs suggesting phenotypic differences between the two subgroups. Cluster enrichment
and cluster abundance analysis identified BCR-ABL and Ph-like defining clusters which
significantly differed in expression of CD34, CD19, CD14, CD127 and HLA-DR. This analysis
demonstrates how CyTOF and unsupervised clustering algorithms can be used to identify
significant phenotypic differences between Ph-like and BCR-ABL B-ALL.

47
Chapter 4 Discussion
48
4.1 Overview
My thesis work focused on determining if CyTOF could be used to identify Ph-like specific
signaling patterns and/or phenotypic marker expression. To achieve this goal, I developed and
optimized a 36 marker CyTOF panel which included Abs specific for 12 phenotypic markers and
24 phosphorylated or intracellular markers. I chose the markers in the panel in order to identify
leukemic B cells, major cell lineages and downstream targets of key signaling pathways in B-ALL.
After building the panel, I titrated each antibody to their optimal dilution using cell lines or primary
samples. Before profiling Ph-like samples I wanted to ensure the assay and panel worked in
leukemic samples. Thus, I completed a pilot experiment with 3 BCR-ABL samples, a non-leukemic
PBMC control and the K-562 cell line +/- DAS and PV. Importantly, this pilot confirmed that my
panel could identify leukemic cells (CD45loCD34+) in viably frozen diagnostic PBMC samples
from leukemia patients. Interestingly, it also highlighted a surprising phenotypic heterogeneity in
the BCR-ABL samples. For example, intensity of CD45, CD34, CD19 and HLA-DR expression on
the leukemic blasts differed between the three samples. This pilot also showed variability in the
basal signaling activity in the 3 samples. For example, I observed different intensities of pSYK
and pSRC in the VEH-treated samples. However, in the three samples, DAS treatment
significantly decreased pSTAT5, pSRC and pSYK expression. I next used this validation panel and assay to profile signaling and phenotypic markers in
4 additional BCR-ABL samples (7 total), 2 Ph-like CRLF2, 1 Ph-like JAK2 and 1 Ph-like Other,
and 2 non-leukemic PBMC samples (3 total). As expected, the CD34+ leukemic cells in the BCR-
ABL samples exhibited high pSTAT5, as well high pSYK and pMTOR. pSTAT5 was more highly
expressed by CD34+ cells in the Ph-like JAK2 sample compared to the Ph-like CRLF2 samples.
Next, I assessed whether basal phosphorylation of STAT5 required active signaling via ABL or
JAK kinases. As expected, DAS treatment decreased pSTAT5 more robustly in the BCR-ABL
samples than in the Ph-like samples. While RUX treatment decreased pSTAT5 significantly more
robustly in Ph-like CRFL2/JAK2 samples than in BCR-ABL. These results confirm that basal
phosphorylation in more ABL or JAK2 dependent in BCR-ABL and Ph-like CRLF2/JAK2 samples
respectively.
Second, I used the unsupervised clustering algorithm PG to determine if Ph-like and BCR-
ABL samples expressed a different phenotypic profile. Analysis of this clustering revealed Ph-like
and BCR-ABL class and secondary class defining clusters which interestingly were often not the
49
most abundant cluster in each sample. The BCR-ABL samples expressed higher levels of CD14,
CD34, and CD19 in their class defining clusters compared to the Ph-like samples in their defining
cluster. In contrast, the Ph-like samples expressed higher levels of CD127 and HLA-DR in their
defining cluster. Overall, my thesis work demonstrates how CyTOF, and unsupervised clustering
algorithms, including PG, can be used to identify Ph-like specific patterns.
4.2 BCR-ABL Phenotypic and Signaling Heterogeneity My pilot BCR-ABL experiment revealed surprising heterogeneity in surface marker
expression of the leukemic blasts in BCR-ABL samples. For example, in sample 100709 I observed
a gradient of CD34 expression on the leukemic cell population. In contrast, the leukemic blasts in
sample 795 were uniformly CD34+. I also observed variation in expression of major lineage
markers including CD19. For example, the leukemic blasts in sample 90124 expressed overall low
levels of CD19 compared to samples 795 and 100709 whose blasts varied in CD19 intensity but
were both uniformly positive. Surface marker variability might be reflective of potential genetic
heterogeneity in the samples as the BCR-ABL subgroup is known to be quite genetically
heterogeneous. Multiple studies have identified non-prognostic secondary cytogenetically
abnormalities in BCR-ABL patients including hyperdiploidy (>50 chromosomes), loss of
chromosome 7 or 9, trisomy of chromosome 4 and supernumerary Ph71-72. Also, interstitial
chromosomal deletions are common in BCR-ABL samples and are undetectable by cytogenetic
analysis71-72. These additional alterations have been associated with variation in surface marker
expression. Primo et al. described a correlation between supernumerary Ph or trisomy 8 and higher
CD19, CD34, CD45 and HLA-DR expression on BCR-ABL leukemic blasts73. Conversely,
monosomy 7 correlated with lower CD19, CD34 and intracellular CD79a expression73. However,
as these additional mutations are either cytogenetically silent or non-prognostic they are often not
detected or reported in adult B-ALL. Despite all belonging to the same genetic subtype, the BCR-
ABL samples showed variation in expression of phenotypic markers which could be potentially
explained by undetectable additional genetic alterations. In additional to surface marker heterogeneity I also observed variation in the basal
signaling activity in the 3 BCR-ABL samples. First, as expected all three samples expressed high
levels of pSTAT5 comparable to the K-562 cell line33. In contrast, I observed variability in the
basal levels of pSYK and pSRC between the three samples. For example, my CyTOF phospho-
50
assay detected low levels of pSRC in sample 90124 but high expression in sample 795. One
plausible explanation for this variation is the genetic heterogeneity associated with BCR-ABL B-
ALL. Various additional cytogenetic abnormalities or mutations could be causing this diversity in
basal signaling. A second interesting explanation is epigenetic modification which are also
common in B-ALL. One example of an epigenetic modification common in ALL is DNA
methylation. Interestingly, hypermethylation of both SYK and SRC family genes has been found
in patients with B-ALL74-75. This hypermethylation results in silencing of genes and thus a decrease
in the protein levels. In conclusion, the signaling and phenotypic heterogeneity I observed in BCR-
ABL B-ALL could be associated with additional genetic alterations or epigenetic modifications.
4.3 RUX Sensitive pSTAT5 as a Ph-like CRLF2/JAK2 B-ALL Marker
My phospho-CyTOF assay identified higher levels of basal pSTAT5 in a Ph-like JAK2
sample compared to Ph-like CRLF2 samples. Previous studies have also identified elevated
pSTAT5 in Ph-like samples with PAX5-JAK2 fusions76. However, my study is the first to my
knowledge to directly compare basal phosphorylation in Ph-like CRLF2 and Ph-like JAK2
samples. My results suggest that a gene fusion involving JAK2 results in more potent basal
JAK/STAT signaling opposed to overexpression of the TSLPR heterodimer. My study is the first
to show that STAT5 is phosphorylated to a greater degree in a Ph-like JAK2 sample compared to
Ph-like CRLF2 samples.
Despite lower basal pSTAT5 in the two Ph-like CRLF2 samples, RUX-treatment still
significantly decreased pSTAT5 expression more potently than DAS-treatment in the Ph-like
CRLF2/JAK2 subgroup. This suggests that RUX-sensitive basal pSTAT5 could be used as a
biomarker for Ph-like CRLF2/JAK2 samples. This conclusion is in concordance with previous
work that has described inhibition of basal pSTAT5 in samples with the PAX5-JAK2 fusion. For
example, Roberts at al demonstrated, in a primary PAX5-JAK2 sample, that pSTAT5 decreased
more potently following RUX pre-treatment compared to DAS44. In contrast, previous studies with
Ph-like CRLF2 samples have focused largely on increased pSTAT5 following stimulation with the
TSLP cytokine77. For example, Brown et al. established that TSLP stimulation of cell lines
engineered with the TSLPR heterodimer results in phosphorylation of STAT578. However, my
study agrees with the only other study to my knowledge to describe RUX-sensitive pSTAT5 as a
marker for Ph-like CRLF2 samples. In a study by Tasian et al., the group treated 22 CRLF2+ adult
51
samples with RUX and quantified levels of phospho-proteins, including pSTAT5, by flow
cytometry79. This group also reported inhibition of pSTAT5 following RUX treatment which was
sustained following TSLP stimulation77. In conclusion, my work is in accordance with other
studies describing RUX-sensitive pSTAT5 as a marker for Ph-like CRLF2/JAK2 samples.
4.4 BCR-ABL Specific Clusters Expressed Significantly Higher CD14, CD34 and CD19
Analysis of the PG clustering revealed significant differences between BCR-ABL and Ph-
like samples in their respective class defining clusters, including higher CD14 in the BCR-ABL
specific clusters. Aberrant expression of myeloid markers in B-ALL has been observed in several
studies, with reports of up to 36% of B-ALL cases express myeloid markers80-81. Interestingly the
prognostic value of myeloid marker expression remains controversial. Some reports cite a lack of
impact80. In contrast, other groups have reported correlations between myeloid expression and
chemotherapy resistance83. However, there are likely two explanations as to why myeloid markers
are expressed on B-ALL blasts. First, the leukemic blasts stem from a progenitor cell that has not
yet differentiated into lymphoid or myeloid cells. Second, leukemic blasts are lymphoid cells or
progenitor cells that express both myeloid or lymphoid features, a phenomenon known as lineage
promiscuity or lineage infidelity84-85. The mean MMI of CD19 was also significantly higher in the
BCR-ABL class defining cluster, suggesting that this is a case of lineage infidelity. Interestingly,
the BCR-ABL subtype is associated with a high frequency of PAX5 and IKZF1 deletions84.
Deficiencies in the TFs encoded by these two genes results in an arrest in development at the pro-
B cell stage. Leukemic blasts arrested at this stage in development retain the capacity to lineage
reprogram into myeloid cells, including macrophages which are CD14+ 86-87. Furthermore, PAX5
deletions are less common in Ph-like (5%) compared to BCR-ABL (30%) B-ALL, which could
contribute to higher CD14 expression in BCR-ABL B-ALL88. In conclusion, aberrant myeloid
antigen expression is common in B-ALL and is a prime example of lineage infidelity.
In addition to CD14, the BCR-ABL samples expressed higher levels of CD34 in their class
defining cluster comparatively. In recent years, the prognostic value of CD34 in B-ALL has been
explored89-90. For example, Thomas et al. examined 75 B-ALL adult patients and concluded that
higher CD34 positivity was associated with features of poor prognosis in adult B-ALL91. In the
same study, higher CD34 expression was also significantly associated with higher expression of
CD19, a trend I also observed in the BCR-ABL specific cluster. In conclusion, the BCR-ABL

52
samples expressed significantly higher CD14, CD34 and CD19 in their class defining cluster
compared to the Ph-like samples in their defining cluster.
4.5 Ph-like Specific Clusters Expressed Significantly Higher CD127 and HLA-DR
The Ph-like specific samples expressed significantly higher CD127 in their class defining
cluster compared to the BCR-ABL samples in their respective cluster. CD127 (IL-7Ra) pairs with
the CRLF2 monomer to form the heterodimeric TSLPR which is present in approximately 50% of
Ph-like B-ALL92. As 2/4 of my Ph-like samples were CRLF2+ it is not overly surprisingly that
CD127 expression would be elevated in clusters abundant in Ph-like. It is unexpected that TSLPR
is not significantly different between the Ph-like and BCR-ABL significant clusters. However, this
variability is explained by the fact the not all my Ph-like samples were CRLF2+. It is interesting
that the 2 CRLF2- samples expressed higher levels of CD127 than the BCR-ABL samples. This
expression could be contributing to leukemogenesis, as it has been reported that CD127+ B-ALL
cells have higher expression of the anti-apoptotic protein Bcl-293-95. The 4 Ph-like samples, despite
their genetic subgrouping, expressed higher CD127 in their class defining cluster compared to the
BCR-ABL samples.
In addition to CD127, in their respective class defining clusters Ph-like samples expressed
higher HLA-DR comparatively. It has been reported that in up to 97% of B-ALL cases blasts
express HLA-DR on their surface96. Thus, HLA-DR expression on Ph-like blasts is unsurprising.
However, it is surprising that the BCR-ABL samples express such low levels of this marker.
Interestingly, a few cases of HLA-DR- B-ALL have been reported97. In conclusion, HLA-DR
expression on Ph-like leukemic blasts is in accordance with general phenotyping of B-ALL.
4.6 Class Defining Clusters Could be Subclones Present at Diagnosis
It is compelling that these class and secondary class distinguishing clusters are often not
the most abundant cluster in each sample. One potential explanation for this is that the class
defining clusters could be representative of sub-populations present at diagnosis. To date multiple
studies have reported the presence of subclones at diagnosis in B-ALL. For example, Obro et al.
reported that in a pediatric cohort of 41 BM diagnostic B-ALL samples, 15 expressed distinct
subclones98. Furthermore, using flow cytometry and a panel of phenotypic markers, Li et al.
identified 192 subpopulations in 23 B-ALL adult patients99. In this study, the group also profiled
53
paired samples from diagnosis and after the 1st course of induction therapy. Interestingly, following
induction therapy they detected new subclones not present at diagnosis in 22 of 23 patients99. Based
on this study I think in future experiments it would be interesting to include paired diagnostic and
relapse samples. It would be fascinating to track if new clusters (or subclones) appeared at relapse
or less predominant clusters at diagnosis increased in prevalence in the relapse sample. In previous
studies the capability of subclones to survive therapy, expand and cause future relapse has been
shown. For example, Notta et al. exhibited that often minor subclones outcompete the predominant
diagnostic clone in repopulation of mouse models xenografted with BCR-ABL diagnostic
samples100. Therefore, using CyTOF and clustering algorithms would be an interesting way to
further track the persistence of diagnostic subclones into relapse.
4.7 Conclusion and Future Direction In conclusion, I identified signaling pathway activation and a phenotypic profile associated
with Ph-like B-ALL. My CyTOF assay and panel, which I optimized in my first aim, revealed
surprisingly phenotypic and signaling heterogeneity in the BCR-ABL subgroup. This variability
could be explained by additional cytogenetic abnormalities or epigenetic modifications.
Furthermore, my CyTOF assay identified leukemic blasts with activating ABL or JAK2 mutations
based on their higher expression of basal pSTAT5 and its reduction by ABL- or JAK2-selective
tyrosine kinase inhibitors. My conclusion of RUX sensitive pSTAT5 as a marker for Ph-like
CRLF2/JAK2 samples is in concordance with previous studies published by Roberts et al. and
Taisan et al44,79.
PG clustering affirmed Ph-like and BCR-ABL specific phenotypic clusters which differed
significantly in expression of phenotypic markers such as CD14, CD34, CD19, CD127 and HLA-
DR. CD14 expression was significantly more intense in the BCR-ABL samples in their class
defining clusters compared to the Ph-like samples in theirs. This is an example of lineage infidelity
which is often observed in B-ALL. One explanation for this could be due to the high prevalence
of concurrent PAX5 mutations in BCR-ABL B-ALL. Higher CD127 expression in the Ph-like
specific cluster is expected as 2/4 of the Ph-like samples I profiled were CRLF2+. These significant
differences could also have prognostic value. For example, higher CD34 expression in B-ALL
blasts has been associated with poor prognosis in adults91. Lastly, these class defining PG clusters
were often not the most abundant cluster in each sample and could potentially be representative of
54
subclones present at diagnosis. In conclusion, my work demonstrates how CyTOF can be used to
identify Ph-like specific signaling and phenotypic patterns.
However, future experiments must be done to expand on these results. First, the sample
number must be expanded. Specifically, more Ph-like samples must be profiled. Importantly, Ph-
like ABL samples should be included in future studies. Unfortunately, these samples are quite rare
and difficult to find. Furthermore, samples that have complex or normal cytogenetics should also
be included for comparison. Second, I think the surface marker portion of my panel should be
expanded to include markers important in B cell development such as CD10 and CD20. I also
think more myeloid markers known to be aberrantly expressed in B-ALL, including CD13, should
be added. Expansion of the surface markers in the panel could help to further classify Ph-like
samples. Ultimately, if 4 to 5 markers could be identified as Ph-like specific, they could be used
clinically to rapidly identify Ph-like samples. Third, I think it would be interesting to compare
diagnostic and relapse samples to track if any clusters present at diagnosis either increased in
abundance or persisted to relapse. In conclusion, this work demonstrated how my CyTOF assay
along with unsupervised clustering algorithms can be used to classify specific phosphorylated
signatures and phenotypic expression in Ph-like B-ALL. This method could be further applied to
other HR genetic subtypes of B-ALL to improve our understanding of this heterogeneous
malignancy.

55
References
56
1. Pui, C.-H., Robison, L.L., and Look, A.T. (2008). Acute lymphoblastic leukaemia. The
Lancet 371, 1030–1043.
2. Zhang, X., Rastogi, P., Shah, B., and Zhang, L. (2017). B lymphoblastic
leukemia/lymphoma: new insights into genetics, molecular aberrations, subclassification
and targeted therapy. Oncotarget 8, 66728.
3. Campos-Sanchez, E., Toboso-Navasa, A., Romero-Camarero, I., Barajas-Diego, M.,
Sánchez-García, I., and Cobaleda, C. (2011). Acute lymphoblastic leukemia and
developmental biology: A crucial interrelationship. Cell Cycle 10, 3473–3486.
4. Pui, C.-H., Relling, M.V., and Downing, J.R. (2004). Acute Lymphoblastic Leukemia. The
New England Journal of Medicine 350, 1535-1548.
5. Sellars, M., Kastner, P., and Chan, S. (2011). Ikaros in B cell development and function.
World Journal of Biological Chemistry 2, 132.
6. Gupta, S.K., Bakhshi, S., Kumar, L., Seth, R., and Kumar, R. (2016). IKZF1 (IKAROS)
deletions in B-ALL and its clinical correlation: A prospective study from a tertiary care
centre in Northern India. Leukemia Research 41, 7–11.
7. Somasundaram, R., Prasad, M.A., Ungerbäck, J., and Sigvardsson, M. (2015).
Transcription factor networks in B-cell differentiation link development to acute lymphoid
leukemia. Blood 126, 144–152.
8. Cobaleda, C., Schebesta, A., Delogu, A., and Busslinger, M. (2007). Pax5: the guardian of
B cell identity and function. Nature Immunology 8, 463–470.
9. Prasad, M.A.J., Ungerback, J., Ahsberg, J., Somasundaram, R., Strid, T., Larsson, M.,
Mansson, R., De Paepe, A., Lilljebjorn, H., Fioretos, T., et al. (2015). Ebf1 heterozygosity
results in increased DNA damage in pro-B cells and their synergistic transformation by
Pax5 haploinsufficiency. Blood 125, 4052–4059.
10. O’Riordan, M., and Grosschedl, R. (1999). Coordinate regulation of B cell differentiation
by the transcription factors EBF and E2A. Immunity 11, 21–31.
11. Hagman, J. (2015). Transcriptional Regulation of Early B Cell Development. In Molecular
Biology of B Cells, (Elsevier), pp. 35–53.
12. Zhang, Z., Espinoza, C.R., Yu, Z., Stephan, R., He, T., Williams, G.S., Burrows, P.D.,
Hagman, J., Feeney, A.J., and Cooper, M.D. (2006). Transcription factor Pax5 (BSAP)
57
transactivates the RAG-mediated VH-to-DJH rearrangement of immunoglobulin genes.
Nature Immunology 7, 616–624.
13. Shochat, C., Tal, N., Bandapalli, O.R., Palmi, C., Ganmore, I., te Kronnie, G., Cario, G.,
Cazzaniga, G., Kulozik, A.E., Stanulla, M., et al. (2011). Gain-of-function mutations in
interleukin-7 receptor-α ( IL7R ) in childhood acute lymphoblastic leukemias. The Journal
of Experimental Medicine 208, 901–908.
14. Perez-Garcia, A., Ambesi-Impiombato, A., Hadler, M., Rigo, I., LeDuc, C.A., Kelly, K.,
Jalas, C., Paietta, E., Racevskis, J., Rowe, J.M., et al. (2013). Genetic loss of SH2B3 in
acute lymphoblastic leukemia. Blood 122, 2425–2432.
15. Herzog, S., Reth, M., and Jumaa, H. (2009). Regulation of B-cell proliferation and
differentiation by pre-B-cell receptor signalling. Nature Reviews Immunology 9, 195–205.
16. Corfe, S.A., and Paige, C.J. (2012). The many roles of IL-7 in B cell development;
Mediator of survival, proliferation and differentiation. Seminars in Immunology 24, 198–
208.
17. Isaksen, D.E., Baumann, H., Trobridge, P.A., Farr, A.G., Levin, S.D., and Ziegler, S.F.
(1999). Requirement for Stat5 in Thymic Stromal Lymphopoietin-Mediated Signal
Transduction. Journal of Immunology 163, 5971-5977.
18. Muschen, M. (2015). Rationale for targeting the pre-B-cell receptor signaling pathway in
acute lymphoblastic leukemia. Blood 125, 3688–3693.
19. Perova, T., Grandal, I., Nutter, L.M.J., Papp, E., Matei, I.R., Beyene, J., Kowalski, P.E.,
Hitzler, J.K., Minden, M.D., Guidos, C.J., et al. (2014). Therapeutic Potential of Spleen
Tyrosine Kinase Inhibition for Treating High-Risk Precursor B Cell Acute Lymphoblastic
Leukemia. Science Translational Medicine 6, 236ra62-236ra62.
20. Mullighan, C.G. (2012). Molecular genetics of B-precursor acute lymphoblastic leukemia.
Journal of Clinical Investigation 122, 3407–3415.
21. Montaño, A., Forero-Castro, M., Marchena-Mendoza, D., Benito, R., and Hernández-
Rivas, J. (2018). New Challenges in Targeting Signaling Pathways in Acute Lymphoblastic
Leukemia by NGS Approaches: An Update. Cancers 10, 110.
22. Mohseni, M., Uludag, H., and Brandwein, J.M. (2018). Advances in biology of acute
lymphoblastic leukemia (ALL) and therapeutic implications. American Journal of Blood
Research 8, 29.
58
23. Chiaretti, S., Zini, G., and Bassan, R. (2014). Diagnosis and Subclassification of Acute
Lymphoblastic Leukemia. Mediterranean Journal of Hematology and Infectious Diseases
6, 2014073.
24. Terwilliger, T., and Abdul-Hay, M. (2017). Acute lymphoblastic leukemia: a
comprehensive review and 2017 update. Blood Cancer Journal 7, e577.
25. Bhojwani, D., Howard, S.C., and Pui, C.-H. (2009). High-Risk Childhood Acute
Lymphoblastic Leukemia. Clinical Lymphoma and Myeloma 9, S222–S230.
26. Roberts, K.G. (2018). Genetics and prognosis of ALL in children vs adults. Hematology
2018 1, 137-145.
27. Pui, C.-H., and Evans, W.E. (1998). Acute Lymphoblastic Leukemia. Drug Therapy 339,
605-615.
28. Geyer, M.B., Hsu, M., Devlin, S.M., Tallman, M.S., Douer, D., and Park, J.H. (2017).
Overall survival among older US adults with ALL remains low despite modest
improvement since 1980: SEER analysis. Blood 129, 1878–1881.
29. Leoni, V., and Biondi, A. (2015). Tyrosine kinase inhibitors in BCR-ABL positive acute
lymphoblastic leukemia. Haematologica 100, 295–299.
30. Reckel, S., Hamelin, R., Georgeon, S., Armand, F., Jolliet, Q., Chiappe, D., Moniatte, M.,
and Hantschel, O. (2017). Differential signaling networks of Bcr–Abl p210 and p190
kinases in leukemia cells defined by functional proteomics. Leukemia 31, 1502–1512.
31. Tabernero, M., Bortoluci, A.M., Alaejos, I., Lopez-Berges, M.C., Rasillo, A., Garcia-Sanz,
R., Garcia, M., Sayagues, J.M., Gonzalez, M., and Mateo, G. (2001). Adult precursor B-
ALL with BCR/ABL gene rearrangements displays a unique immunophenotype based on
the pattern of CD10, CD34, CD13 and CD38 expression. Leukemia 15, 406.
32. Ayatollahi, H., Keramati, M., Shirdel, A., Kooshyar, M., Raeiszadeh, M., Shakeri, S.,
Sadeghian, M., and Shams, F. (2018). BCR-ABL fusion genes and laboratory findings in
patients with chronic myeloid leukemia in northeast Iran. Caspian J Intern Med 9, 65-70.
33. Cilloni, D., and Saglio, G. (2012). Molecular Pathways: BCR-ABL. Clinical Cancer
Research 18, 930–937.
34. Hantschel, O. (2012). Structure, Regulation, Signaling, and Targeting of Abl Kinases in
Cancer. Genes & Cancer 3, 436–446.

59
35. Yilmaz, M., Kantarjian, H., Ravandi-Kashani, F., Short, N.J., and Jabbour, E. (2018).
Philadelphia chromosome-positive acute lymphoblastic leukemia in adults: current
treatments and future perspectives. Clin Adv Hematol Oncol 16, 216–23.
36. Daver, N., Thomas, D., Ravandi, F., Cortes, J., Garris, R., Jabbour, E., Garcia-Manero, G.,
Borthakur, G., Kadia, T., Rytting, M., et al. (2015). Final report of a phase II study of
imatinib mesylate with hyper-CVAD for the front-line treatment of adult patients with
Philadelphia chromosome-positive acute lymphoblastic leukemia. Haematologica 100,
653–661.
37. Schultz, K.R., Bowman, W.P., Aledo, A., Slayton, W.B., Sather, H., Devidas, M., Wang,
C., Davies, S.M., Gaynon, P.S., Trigg, M., et al. (2009). Improved Early Event-Free
Survival With Imatinib in Philadelphia Chromosome–Positive Acute Lymphoblastic
Leukemia: A Children’s Oncology Group Study. Journal of Clinical Oncology 27, 5175–
5181.
38. Pui, C.-H., Roberts, K.G., Yang, J.J., and Mullighan, C.G. (2017). Philadelphia
Chromosome–like Acute Lymphoblastic Leukemia. Clinical Lymphoma Myeloma and
Leukemia 17, 464–470.
39. Den Boer, M.L., van Slegtenhorst, M., De Menezes, R.X., Cheok, M.H., Buijs-Gladdines,
J.G., Peters, S.T., Van Zutven, L.J., Beverloo, H.B., Van der Spek, P.J., and Escherich, G.
(2009). A subtype of childhood acute lymphoblastic leukaemia with poor treatment
outcome: a genome-wide classification study. The Lancet Oncology 10, 125–134.
40. Mullighan, C.G., Su, X., Zhang, J., Radtke, I., Phillips, L.A., Miller, C.B., Ma, J., Liu, W.,
Cheng, C., and Schulman, B.A. (2009). Deletion of IKZF1 and prognosis in acute
lymphoblastic leukemia. New England Journal of Medicine 360, 470–480.
41. Jain, N., Roberts, K.G., Jabbour, E., Patel, K., Eterovic, A.K., Chen, K., Zweidler-McKay,
P., Lu, X., Fawcett, G., Wang, S.A., et al. (2017). Ph-like acute lymphoblastic leukemia: a
high-risk subtype in adults. Blood 129, 572–581.
42. Roberts, K.G., Gu, Z., Payne-Turner, D., McCastlain, K., Harvey, R.C., Chen, I.-M., Pei,
D., Iacobucci, I., Valentine, M., Pounds, S.B., et al. (2017). High Frequency and Poor
Outcome of Philadelphia Chromosome–Like Acute Lymphoblastic Leukemia in Adults.
Journal of Clinical Oncology 35, 394–401.

60
43. Tran, T.H., and Loh, M.L. (2016). Ph-like acute lymphoblastic leukemia. ASH Education
Program Book 2016, 561–566.
44. Roberts, K.G., Li, Y., Payne-Turner, D., Harvey, R.C., Yang, Y.-L., Pei, D., McCastlain,
K., Ding, L., Lu, C., Song, G., et al. (2014). Targetable Kinase-Activating Lesions in Ph-
like Acute Lymphoblastic Leukemia. New England Journal of Medicine 371, 1005–1015.
45. Roberts, K.G., Yang, Y.-L., Payne-Turner, D., Lin, W., Files, J.K., Dickerson, K., Gu, Z.,
Taunton, J., Janke, L.J., and Chen, T. (2017). Oncogenic role and therapeutic targeting of
ABL-class and JAK-STAT activating kinase alterations in Ph-like ALL. Blood Advances
1, 1657–1671.
46. Loh, M.L., and Mullighan, C.G. (2012). Advances in the Genetics of High-Risk Childhood
B-Progenitor Acute Lymphoblastic Leukemia and Juvenile Myelomonocytic Leukemia:
Implications for Therapy. Clinical Cancer Research 18, 2754–2767.
47. Roberts, K.G. (2018). Why and how to treat Ph-like ALL? Best Practice & Research
Clinical Haematology 31, 351–356.
48. Iacobucci, I., Li, Y., Roberts, K.G., Dobson, S.M., Kim, J.C., Payne-Turner, D., Harvey,
R.C., Valentine, M., McCastlain, K., Easton, J., et al. (2016). Truncating Erythropoietin
Receptor Rearrangements in Acute Lymphoblastic Leukemia. Cancer Cell 29, 186–20
49. Kobayashi, K., Miyagawa, N., Mitsui, K., Matsuoka, M., Kojima, Y., Takahashi, H.,
Ootsubo, K., Nagai, J., Ueno, H., Ishibashi, T., et al. (2015). TKI dasatinib monotherapy
for a patient with Ph-like ALL bearing ATF7IP/PDGFRB translocation: TKI Dasatinib
Monotherapy for Ph-like ALL Bearing PDGFRB Translocation. Pediatric Blood & Cancer
62, 1058–1060.
50. Wesston, B.W., Hayden, M.A., Roberts, K.G., Bowyer, S., Hsu, J, Fedoriw, G., Rao, K.W.,
Mullighan, C.G. (2013). Tyrosine Kinase Inhibitor Therapy Induces Remission in a Patient
with Refractory EBF1-PDGFRB Positive Acute Lymphoblastic Leukemia. Diagnosis in
Oncology 31, 413-416.
51. Maese, L., Tasian, S.K., and Raetz, E.A. (2017). How is the Ph-like signature being
incorporated into ALL therapy? Best Practice & Research Clinical Haematology 30, 222–
228.
61
52. Maude, S.L., Tasian, S.K., Vincent, T., Hall, J.W., Sheen, C., Roberts, K.G., Seif, A.E.,
Barrett, D.M., Chen, I.-M., Collins, J.R., et al. (2012). Targeting JAK1/2 and mTOR in
murine xenograft models of Ph-like acute lymphoblastic leukemia. Blood 120, 3510–3518.
53. Loh, M.L., Tasian, S.K., Rabin, K.R., Brown, P., Magoon, D., Reid, J.M., Chen, X., Ahern,
C.H., Weigel, B.J., and Blaney, S.M. (2015). A phase 1 dosing study of ruxolitinib in
children with relapsed or refractory solid tumors, leukemias, or myeloproliferative
neoplasms: A Children’s Oncology Group phase 1 consortium study (ADVL1011): Phase
1 Study of Ruxolitinib in Pediatric Cancers. Pediatric Blood & Cancer 62, 1717–1724.
54. Roberts, K.G., and Mullighan, C.G. (2015). Genomics in acute lymphoblastic leukaemia:
insights and treatment implications. Nature Reviews Clinical Oncology 12, 344–357.
55. Ma, X., Edmonson, M., Yergeau, D., Muzny, D.M., Hampton, O.A., Rusch, M., Song, G.,
Easton, J., Harvey, R.C., Wheeler, D.A., et al. (2015). Rise and fall of subclones from
diagnosis to relapse in pediatric B-acute lymphoblastic leukaemia. Nature
Communications 6.
56. Spitzer, M.H., and Nolan, G.P. (2016). Mass Cytometry: Single Cells, Many Features. Cell
165, 780–791.
57. Atkuri, K.R., Stevens, J.C., and Neubert, H. (2014). Mass Cytometry: A Highly
Multiplexed Single-Cell Technology for Advancing Drug Development. Drug Metabolism
and Disposition 43, 227–233.
58. Zunder, E.R., Finck, R., Behbehani, G.K., Amir, E.D., Krishnaswamy, S., Gonzalez, V.D.,
Lorang, C.G., Bjornson, Z., Spitzer, M.H., Bodenmiller, B., et al. (2015). Palladium-based
mass tag cell barcoding with a doublet-filtering scheme and single-cell deconvolution
algorithm. Nature Protocols 10, 316–333.
59. Levine, J.H., Simonds, E.F., Bendall, S.C., Davis, K.L., Amir, E.D., Tadmor, M.D., Litvin,
O., Fienberg, H.G., Jager, A., Zunder, E.R., et al. (2015). Data-Driven Phenotypic
Dissection of AML Reveals Progenitor-like Cells that Correlate with Prognosis. Cell 162,
184–197.
60. Weber, L.M., and Robinson, M.D. (2016). Comparison of clustering methods for high-
dimensional single-cell flow and mass cytometry data: Comparison of High-Dim.
Cytometry Clustering Methods. Cytometry Part A 89, 1084–1096.
62
61. Maaten, L. van der, and Hinton, G. (2008). Visualizing data using t-SNE. Journal of
Machine Learning Research 9, 2579–2605.
62. Amir, E.D., Davis, K.L., Tadmor, M.D., Simonds, E.F., Levine, J.H., Bendall, S.C.,
Shenfeld, D.K., Krishnaswamy, S., Nolan, G.P., and Pe’er, D. (2013). viSNE enables
visualization of high dimensional single-cell data and reveals phenotypic heterogeneity of
leukemia. Nature Biotechnology 31, 545–552.
63. Good, Z., Sarno, J., Jager, A., Samusik, N., Aghaeepour, N., Simonds, E.F., White, L.,
Lacayo, N.J., Fantl, W.J., Fazio, G., et al. (2018). Single-cell developmental classification
of B cell precursor acute lymphoblastic leukemia at diagnosis reveals predictors of relapse.
Nature Medicine 24, 474–483.
64. Warmuth, M., Kim, S., Gu, X., Xia, G., and Adrián, F. (2007). Ba/F3 cells and their use in
kinase drug discovery: Current Opinion in Oncology 19, 55–60.
65. Fluidigm. (2019). Cell-ID 20-Plex Pd Barcoding Kit.URL
https://www.fluidigm.com/binaries/content/documents/fluidigm/resources/cell-id-20-
plex-pd-barcoding-kit-ug-prd023/cell-id-20-plex-pd-barcoding-kit-ug-
prd023/fluidigm%3Afile
66. R Core Team (2019). R: A language and environment for statistical computing. R
Foundation for Statistical Computing, Vienna, Austria. URL https://www.R-project.org/.
67. Gregory R. Warnes, Ben Bolker, Lodewijk Bonebakker, Robert Gentleman, Wolfgang
Huber Andy Liaw, Thomas Lumley, Martin Maechler, Arni Magnusson, Steffen Moeller,
Marc Schwartz and Bill Venables (2019). gplots: Various R Programming Tools for
Plotting Data. R package version 3.0.1.1. https://CRAN.R-project.org/package=gplots
68. Konoplev, S., Lu, X., Konopleva, M., Jain, N., Ouyang, J., Goswami, M., Roberts, K.G.,
Valentine, M., Mullighan, C.G., Bueso-Ramos, C., et al. (2017). CRLF2-Positive B-Cell
Acute Lymphoblastic Leukemia in Adult Patients. American Journal of Clinical Pathology
147, 357–363.
69. Stern, A.D., Rahman, A.H., and Birtwistle, M.R. (2017). Cell size assays for mass
cytometry: Cell Size Assays for Mass Cytometry. Cytometry Part A 91, 14–24.
70. Hantschel, O., Warsch, W., Eckelhart, E., Kaupe, I., Grebien, F., Wagner, K.-U., Superti-
Furga, G., and Sexl, V. (2012). BCR-ABL uncouples canonical JAK2-STAT5 signaling in
chronic myeloid leukemia. Nature Chemical Biology 8, 285–293.
63
71. Ko, B.-S., Tang, J.-L., Lee, F.-Y., Liu, M.-C., Tsai, W., Chen, Y.-C., Wang, C.-H., Sheng,
M.-C., Lin, D.-T., Lin, K.-H., et al. (2002). Additional chromosomal abnormalities and
variability of BCR breakpoints in Philadelphia chromosome/BCR-ABL-positive acute
lymphoblastic leukemia in Taiwan. American Journal of Hematology 71, 291–299.
72. For the Acute Lymphoblastic Leukemia Study Groups: ALL-BFM and CoALL
(Germany), AIEOP (Italy), DCLSG (Netherlands), FRALLE (France), CCG, DFCI, POG
and St Jude (USA), and UKALL (UK), Heerema, N.A., Harbott, J., Galimberti, S., Camitta,
B.M., Gaynon, P.S., Janka-Schaub, G., Kamps, W., Basso, G., Pui, C.-H., et al. (2004).
Secondary cytogenetic aberrations in childhood Philadelphia chromosome positive acute
lymphoblastic leukemia are nonrandom and may be associated with outcome. Leukemia
18, 693–702.
73. Primo, D., Tabernero, M.D., Perez, J.J., Rasillo, A., Sayagués, J.M., Espinosa, A.B.,
Lopez-Berges, M.C., García-Sanz, R., Gutierrez, N.C., Hernandez, J.M., et al. (2005).
Genetic heterogeneity of BCR/ABL+ adult B-cell precursor acute lymphoblastic leukemia:
impact on the clinical, biological and immunophenotypical disease characteristics.
Leukemia 19, 713–720.
74. Navarrete-Meneses, M. del P., and Pérez-Vera, P. (2017). Epigenetic alterations in acute
lymphoblastic leukemia. Boletín Médico Del Hospital Infantil de México (English
Edition) 74, 243–264.
75. Hoshino, K., Quintás-Cardama, A., Yang, H., Sanchez-Gonzalez, B., and Garcia-Manero,
G. (2007). Aberrant DNA methylation of the Src kinase Hck, but not of Lyn, in
Philadelphia chromosome negative acute lymphocytic leukemia. Leukemia 21, 906–911.
76. Schinnerl, D., Fortschegger, K., Kauer, M., Marchante, J.R.M., Kofler, R., Den Boer,
M.L., and Strehl, S. (2015). The role of the Janus-faced transcription factor PAX5-JAK2
in acute lymphoblastic leukemia. Blood 125, 1282–1291.
77. Tasian, S., and Loh, M.L. (2011). Understanding the Biology of CRLF2-Overexpressing
Acute Lymphoblastic Leukemia. Critical ReviewsTM in Oncogenesis 16, 13–24.
78. Brown, V.I., Hulitt, J., Fish, J., Sheen, C., Bruno, M., Xu, Q., Carroll, M., Fang, J.,
Teachey, D., and Grupp, S.A. (2007). Thymic Stromal-Derived Lymphopoietin Induces

64
Proliferation of Pre-B Leukemia and Antagonizes mTOR Inhibitors, Suggesting a Role
for Interleukin-7R Signaling. Cancer Research 67, 9963–9970.
79. Tasian, S.K., Doral, M.Y., Borowitz, M.J., Wood, B.L., Chen, I.-M., Harvey, R.C., Gastier-
Foster, J.M., Willman, C.L., Hunger, S.P., Mullighan, C.G., et al. (2012). Aberrant STAT5
and PI3K/mTOR pathway signaling occurs in human CRLF2-rearranged B-precursor acute
lymphoblastic leukemia. Blood 120, 833–842.
80. Supriyadi, E., Veerman, A.J.P., Sutaryo, Purwanto, I., vd Ven, P.M., and Cloos, J. (2012).
Myeloid Antigen Expression in Childhood Acute Lymphoblastic Leukemia and Its
Relevance for Clinical Outcome in Indonesian ALL-2006 Protocol. Journal of Oncology
2012, 1–7.
81. Nakase, K., Kita, K., Shiku, H., Tanaka, I., Nasu, K., Dohy, H., Kyo, T., Tsutani, H., and
Kamada, N. (1996). Myeloid Antigen, CD13, CD14, and/or CD33 Expression Is Restricted
to Certain Lymphoid Neoplasms. American Journal of Clinical Pathology 105, 761–768.
82. Putti, M.C., Rondelli, R., Cocito, M.G., Arico, M., Sainati, L., Conter, V., Guglielmi, C.,
Zanesco, L., Masera, G., Biondi, A., et al. Expression of Myeloid Markers Lacks
Prognostic Impact in Children Treated for Acute Lymphoblastic Leukemia: Italian
Experience in AIEOP-ALL 88-91 Studies. 8.
83. Wiersam, S.R., Ortega, J., Sobel, E., and Weinberg, K.I. (1991). Clinical Importance of
Myeloid-Antigen Expression in Acute Lymphoblastic Leukemia of Childhood.
84. Greaves, M.F., Chan, L.C., Furley, A.J.W., Watt, S.M., and Molgaard, H.V. (1986).
Lineage Promiscuity in Hemopoietic Differentiation and Leukemia. The Journal of The
American Society of Hematology 67, 1-11.
85. Smith, L.J., Curtis, J.E., Messner, H.A., Senn, J.S., Furthmayr, H., and McCulloch, E.A.
(1983). Lineage Infidelity in Acute Leukemia. Bloood 61, 1138-1145.
86. McClellan, J.S., Dove, C., Gentles, A.J., Ryan, C.E., and Majeti, R. (2015).
Reprogramming of primary human Philadelphia chromosome-positive B cell acute
lymphoblastic leukemia cells into nonleukemic macrophages. Proceedings of the National
Academy of Sciences 112, 4074–4079.
87. Nutt, S.L., Heavey, B., Rolink, A.G., and Busslinger, M. (1999). Commitment to the B-
lymphoid lineage depends on the transcription factor Pax5. 401, 7.
65
88. Jain, N., Roberts, K.G., Jabbour, E., Patel, K., Eterovic, A.K., Chen, K., Zweidler-McKay,
P., Lu, X., Fawcett, G., Wang, S.A., et al. (2017). Ph-like acute lymphoblastic leukemia: a
high-risk subtype in adults. Blood 129, 572–581.
89. Seegmiller, A.C., Kroft, S.H., Karandikar, N.J., and McKenna, R.W. (2009).
Characterization of Immunophenotypic Aberrancies in 200 Cases of B Acute
Lymphoblastic Leukemia. American Journal of Clinical Pathology 132, 940–949.
90. Jiang, Z., Wu, D., Lin, S., and Li, P. (2016). CD34 and CD38 are prognostic biomarkers
for acute B lymphoblastic leukemia. Biomarker Research 4.
91. Thomas, X., Archimbaud, E., Charrin, C., Magaud, J.P., and Fiere, D. (1995). CD34
expression in associated with major adverse prognostic factor in adult acute lymphoblastic
leukemia. Leukemia 9, 249-253.
92. Tasian, S.K., Loh, M.L., and Hunger, S.P. (2017). Philadelphia Chromosome-like Acute
Lymphoblastic Leukemia. Blood 35, 1-29.
93. Yu, J.-H., Dong, J.-T., Jia, Y.-Q., Jiang, N.-G., Zeng, T.-T., Xu, H., Mo, X.-M., and Meng,
W.-T. (2013). Individualized leukemia cell-population profiles in common B-cell acute
lymphoblastic leukemia patients. Chinese Journal of Cancer 32, 213–223.
94. Tsujimoto, Y. (1998). Role of Bcl-2 family proteins in apoptosis: apoptosomes or
mitochondria? Genes to Cells 3, 697–707.
95. Sasson, S.C., Smith, S., Seddiki, N., Zaunders, J.J., Bryant, A., Koelsch, K.K., Weatherall,
C., Munier, M.-L., McGinley, C., Yeung, J., et al. (2010). IL-7 receptor is expressed on
adult pre-B-cell acute lymphoblastic leukemia and other B-cell derived neoplasms and
correlates with expression of proliferation and survival markers. Cytokine 50, 58–68.
96. Khalidi, H.S., Chang, K.L., Medeiros, L.J., Brynes, R.K., Slovak, M.L., Murata-Collins,
J.L., and Arber, D.A. (1999). Acute Lymphoblastic Leukemia: Survey of
Immunophenotype, French-American-British Classification, Frequency of Myeloid
Antigen Expression, and Karyotypic Abnormalities in 210 Pediatric and Adult Cases.
American Journal of Clinical Pathology 111, 467–476.
97. Giotopoulu, S., Dokou, E., Tzoufi, M., Kolaitis, N., and Vartholomatos, G. (2003). A case
of HLA-DR negative B-precurosor acute lymphoblastic leukemia. Journal of Experimental
Clinical Cancer Research 22, 637-640.

66
98. Øbro, N.F., Marquart, H.V., Madsen, H.O., Ryder, L.P., Andersen, M.K., Lausen, B.,
Albertsen, B.K., Wehner, P.S., Helgestad, J., and Schmiegelow, K. (2011).
Immunophenotype-defined sub-populations are common at diagnosis in childhood B-cell
precursor acute lymphoblastic leukemia. Leukemia 25, 1652–1657.
99. Li, H.-F., Meng, W.-T., Jia, Y.-Q., Jiang, N.-G., Zeng, T.-T., Jin, Y.-M., Huang, Q.-R.,
Li, X., Xu, H., and Mo, X.-M. (2016). Development-associated immunophenotypes
reveal the heterogeneous and individualized early responses of adult B-acute
lymphoblastic leukemia: Medicine 95, e4128.
100. Notta, F., Mullighan, C.G., Wang, J.C.Y., Poeppl, A., Doulatov, S., Phillips, L.A.,
Ma, J., Minden, M.D., Downing, J.R., and Dick, J.E. (2011). Evolution of human BCR–
ABL1 lymphoblastic leukaemia-initiating cells. Nature 469, 362–367.