single-cell functional and chemosensitive profiling of
TRANSCRIPT

Single-cell functional and chemosensitive profilingof combinatorial colorectal therapy inzebrafish xenograftsRita Fiora,b,1, Vanda Póvoaa,2, Raquel V. Mendesa,2, Tânia Carvalhoc, António Gomesd, Nuno Figueiredoe,and Miguel Godinho Ferreiraa,b,1,3
aChampalimaud Centre for the Unknown, 1400-038 Lisbon, Portugal; bInstituto Gulbenkian de Ciência, 2780-156 Oeiras, Portugal; cInstituto de MedicinaMolecular, Universidade de Lisboa, 1649-028 Lisboa, Portugal; dHospital Prof. Doutor Fernando Fonseca, 2720-276 Amadora, Portugal; and eChampalimaudClinical Center, 1400-038 Lisboa, Portugal
Edited by Douglas Hanahan, Swiss Federal Institute of Technology Lausanne, Lausanne, Switzerland, and approved July 21, 2017 (received for reviewNovember 6, 2016)
Cancer is as unique as the person fighting it. With the exception ofa few biomarker-driven therapies, patients go through roundsof trial-and-error approaches to find the best treatment. Usingpatient-derived cell lines, we show that zebrafish larvae xeno-transplants constitute a fast and highly sensitive in vivo model fordifferential therapy response, with resolution to reveal intratumorfunctional cancer heterogeneity. We screened international colorec-tal cancer therapeutic guidelines and determined distinct functionaltumor behaviors (proliferation, metastasis, and angiogenesis) anddifferential sensitivities to standard therapy. We observed a generalhigher sensitivity to FOLFIRI [5-fluorouracil(FU)+irinotecan+folinicacid] than to FOLFOX (5-FU+oxaliplatin+folinic acid), not only be-tween isogenic tumors but also within the same tumor. We directlycompared zebrafish xenografts with mouse xenografts and showthat relative sensitivities obtained in zebrafish are maintained inthe rodent model. Our data also illustrate how KRAS mutations canprovide proliferation advantages in relation to KRASWT and howchemotherapy can unbalance this advantage, selecting for a minorclone resistant to chemotherapy. Zebrafish xenografts provide re-markable resolution to measure Cetuximab sensitivity. Finally, wedemonstrate the feasibility of using primary patient samples to gen-erate zebrafish patient-derived xenografts (zPDX) and provide proof-of-concept experiments that compare response to chemotherapy andbiological therapies between patients and zPDX. Altogether, our re-sults suggest that zebrafish larvae xenografts constitute a promisingfast assay for precision medicine, bridging the gap between genotypeand phenotype in an in vivo setting.
zebrafish xenograft | chemotherapy functional screening |colorectal cancer | KRAS | patient derived xenografts
Chemotherapy regimens are developed and approved accordingto a demonstration of average efficacy and safety. However,
efficacy rates are averages of individual responses. As a result ofthis “one-size-fits-all” approach, treatments may prove to besuccessful for some patients but not for others. This is especiallyrelevant in the metastatic scenario where oncology therapyguidelines reach branch points and clinicians face equivalent validcompounds, i.e., with similar average response rates. Conse-quently, many patients go through inefficient treatments, beingsubjected to unnecessary toxicity.The current gold standard in cancer biology for personalized
screening is direct primary tumor transplantation into immune-compromised mice, also known as patient-derived xenografts(PDX). PDX can generally maintain both interindividual andgenetic heterogeneity of original tumors, mimicking disease re-sponses in patients and thus reflecting the uniqueness of eachpatient (1). However, mouse PDX present two major drawbacksfor routine clinical assays: the amount of patient sample requiredand the time frame for engraftment and expansion of colonies(months), rendering them unviable for clinical practice.
Zebrafish xenografts offer speed, cellular resolution, and theability to perform large numbers of transplants (2–4). They alsoallow evaluation of crucial hallmarks of cancer, such as meta-static (5, 6) and angiogenic potentials (5, 7, 8). Even though drugpharmacodynamics in zebrafish may differ from mammals, manycompounds have been shown to block disease in a similar way.This has led to an increasing amount of compounds discoveredin zebrafish screens that are entering into human clinical trials(2–4). However, for zebrafish xenografts to be used as clinicalassays, it is crucial that they provide sufficient resolution to revealintertumor and intratumor functional heterogeneity, includingdifferential response to therapy. Reliable methods to visualizeand quantify human cells and induced cell death upon treatmentand direct validation with mouse xenografts are also still lacking.With the aim of testing zebrafish xenotransplants as a screening
platform for cancer therapy, we used a panel of patient-derivedhuman colorectal cancer (CRC) cell lines to screen the NationalComprehensive Cancer Network (NCCN)/European Society forMedical Oncology (ESMO) treatment guidelines for advancedCRC. We selected independent cell lines to investigate intertumor
Significance
Despite advances in targeted cancer treatments, we still lackmethods to predict how a specific cancer will respond to agiven therapy. As a consequence, patients go through roundsof trial-and-error approaches based on guidelines to find thebest treatment, often subjected to unnecessary toxicity. Usingcell lines, we used zebrafish larvae xenografts as sensors forcancer behavior and therapy guideline screening. Our datashow not only sufficient resolution to distinguish functionaltumor behaviors in just 4 days but also differential sensitivityto colorectal cancer therapy. As proof-of-principle, we provideevidence for similar behavior response to therapies in patientsas in zebrafish patient-derived xenografts. Altogether, our re-sults suggest zebrafish larvae xenografts as a promising in vivoscreening platform for precision medicine.
Author contributions: R.F. and M.G.F. conceptualized and supervised research; R.F., V.P.,and R.V.M. performed research; T.C. performed histological evaluation of mouse xeno-grafts and zPDX; A.G. and N.F. provided primary tumor samples; R.F. and M.G.F. wrote thepaper; and M.G.F. was the principal investigator.
The authors declare no conflict of interest.
This article is a PNAS Direct Submission.
See Commentary on page 10306.1To whom correspondence may be addressed. Email: [email protected] [email protected].
2V.P. and R.V.M. contributed equally to this work.3Present address: Institute for Research on Cancer and Aging of Nice, INSERM U 1081 -CNRS 7284 - UNS, 06107 Nice Cedex 2, France.
This article contains supporting information online at www.pnas.org/lookup/suppl/doi:10.1073/pnas.1618389114/-/DCSupplemental.
E8234–E8243 | PNAS | Published online August 23, 2017 www.pnas.org/cgi/doi/10.1073/pnas.1618389114
Dow
nloa
ded
by g
uest
on
Dec
embe
r 1,
202
1

heterogeneity and isogenic clones to examine intratumor heterogeneity.In just 4 days, we could detect in vivo differential behaviors withsingle-cell resolution, namely differential proliferation rates, met-astatic and angiogenic potentials. These differences were presentnot only in tumors derived from different patients but also be-tween different clones from the same tumor, even when mixedinto a polyclonal tumor. We showed that early readouts of responseto treatment in zebrafish closely mirror the results obtained in mice.We also found that the zebrafish xenograft model revealed a re-markable sensitivity to detect differential responses to Cetuximabtreatment according to the KRAS mutational status.Finally, as a proof-of-principle, we generated CRC zebrafish
PDX (zPDX) derived from surgery-resected human samples andtreated them with the same treatment administered to the patient.Altogether, our results suggest that zebrafish xenografts are a fastand highly sensitive assay that can be used to display multiplebiological tumor traits and assess tumor response to treatment.We propose that this model can be used, not only in the researchsetting, but also possibly in the future for precision medicine.
ResultsHuman CRCs Display Diverse Implantation and Proliferation Potentialsin Zebrafish Xenografts.Our strategy relies on the ability of zebrafishxenotransplants to unravel intertumor and intratumor functionalheterogeneity. To address this question, we selected several hu-man CRC cell lines isolated from different patients (intertumorheterogeneity) and isogenic pairs (intratumor heterogeneity) de-scribed in Table S1. SW480 was derived from the primary tumorand SW620 from the lymph node metastasis (6 mo later) of thesame patient, illustrating a history of clonal selection (9). HCT116KRASG13D tumor cells were isolated from a patient with colorectalcarcinoma. Hke3 cells were generated from HCT116 by a somaticdeletion of the KRASG13D allele, reverting the oncogenic KRASphenotype (10). This pair is considered isogenic and constitutesan ideal setting to study phenotypic heterogeneity derived fromone single mutation (intratumor heterogeneity). Finally, HT29cells were isolated from a well-differentiated metastatic tumor,belonging to the goblet-like subtype (11), serving as an outgroup.To determine the implantation potential of these five human
CRC cell lines, cells were labeled with a lipophilic dye (DiI) andinjected into the periviteline space (PVS) of 48-h-postfertilization(hpf) zebrafish embryos (8). At 4 days postinjection (dpi), wescored the efficiency of implantation (Fig. 1 A–E and Fig. S1).With the exception of SW480 cells, we observed high implantationefficiency in all cell lines (>70%) (Fig. S1).One of the most fundamental hallmarks of cancer is the ca-
pacity to proliferate with no constrains (12). To measure pro-liferation in vivo, we quantified mitotic figures and the Ki-67 index(which specifically recognizes human cells, with no cross-reactivitywith zebrafish) (Fig. 1 F–J′′). We found that the Ki-67 and mitoticindex varied between cells derived from different patients (Fig. 1 Zand Z′). Direct comparison between isogenic pairs (intratumorheterogeneity) revealed that SW620 and HCT116 have higherproliferation rates in relation to their isogenic pairs SW480 (Ki-67P < 0.0001; mitosis P = 0.0063) and Hke3 (Ki-67 P < 0.0001; mitosisP = 0.0003) (Fig. 1 Z and Z′). To further confirm that human CRCcells are actively proliferating in the zebrafish host, we delivered a2-h pulse of 5-ethynyl-2′-deoxyuridine (EdU) prior fixation, labelingspecifically cells that were undergoing DNA replication (Fig. 1 P–T).EdU incorporation demonstrates that human cells can activelyproliferate in the zebrafish xenograft model.We also investigated whether the immunohistochemical profile
and typical morphological features described for these cell lineswere maintained in the zebrafish xenografts (Fig. S2). As expectedfor more-differentiated cells, HT29 formed tubular structures(Fig. S2 E′, O, T, and T′), whereas tumors originating from theother cell lines showed a solid pattern with rare tubule formation,consistent with their “stem cell-like” character (11) (Fig. S2).
We next examined angiogenesis, another essential hallmarkof cancer (12). The five cancer cell lines were injected intoTg(fli:eGFP) zebrafish line with GFP-labeled vasculature (13). At4 dpi, xenografts were imaged by confocal microscopy to studyvessel 3D architecture (Fig. 1 U–Y). SW480, SW620, HCT116, andHke3 tumors showed a well-vascularized periphery, composed oflarge vessels that generally do not infiltrate the tumor (Fig. 1 U–Y,Z′′, and Z′′′ and Movies S1–S4). In contrast, HT29 are highlyvascularized tumors, with formation of a dense vessel networkthat infiltrates into the core of the tumor (Fig. 1 Y, Z′′, and Z′′′and Movies S5 and S6). This is consistent with HT29 expressinghigh levels of VEGF and high angiogenic potential in othermodels (14, 15).Our data conclusively show that human CRC cells can sustain
proliferation in zebrafish and present different proliferation dy-namics in CRC tumors derived from different patients andisogenic tumors. In addition, human CRC cells maintain theirgeneral cellular characteristics and angiogenic potential in thezebrafish xenografts.
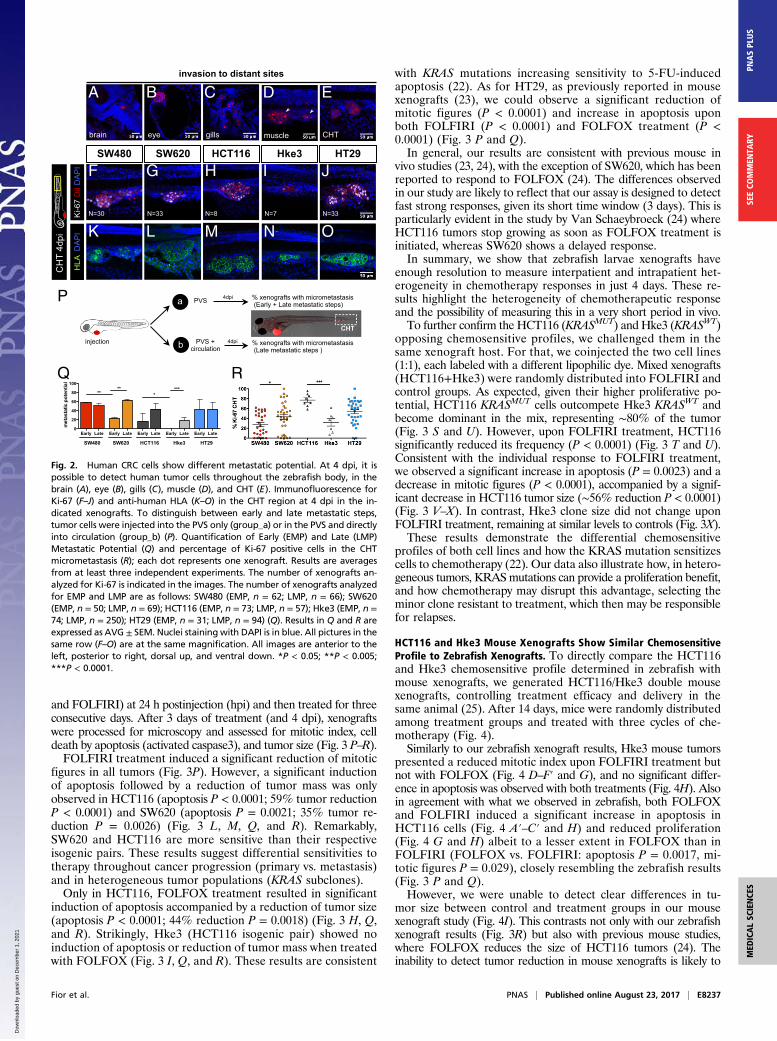
Isogenic Human CRC Cells Present Different Metastatic Potentials.Another essential hallmark of cancer is the ability of cells to formmetastasis (12). At 4 dpi, we could detect several small groups ofcells in the brain, optic cup, gills, and skeletal muscle and in thecaudal hematopoietic tissue (CHT) region (Fig. 2 A–E). Cells inthe CHT often extravasate from vessels (Movie S7) and invadeadjacent tissues, frequently the muscle (Fig. 2D, arrows). This “hotspot” region for tumor cell colonization provides an ideal locationfor quantification of metastatic potential (6). Immunofluorescencefor HLA (anti-human MHC class I subunit) identifies unequivo-cally cells of human origin and delineates the cellular architectureof the micrometastasis (Fig. 2 K–O). Ki-67 positive cells and mi-totic figures at 4 dpi suggest that colonization has been achieved(Fig. 2 F–J and R).Metastatic efficiency may vary and depends on whether a tu-
mor cell can detach from the primary tumor, enter and survive incirculation, and go on to seed cells at distant sites. We designed asimple assay to distinguish between early stages (invasion of sur-rounding tissues and intravasation into blood vessels) and laterstages of the metastatic cascade (survival in circulation, extrava-sation, and colonization) (16, 17) by comparing the micrometa-stasis efficiency when cells were placed directly into circulation vs.when not. For that, we injected CRC cell lines either into the PVSalone (group_a) or directly into circulation (group_b) (Fig. 2P). At4 dpi, we analyzed the number of xenografts that presented a tumorcell mass (>20 cells) away from the PVS injection site (CHT).For tumor cells in group_a to efficiently establish metastasis,
they would have to go through all of the metastatic steps (fromearly to late steps), whereas cells in group_b only have to gothrough the later-stage ones. Thus, considering that maximummetastatic efficiency is achieved when cells are placed in circu-lation (group_b), the reduction of colonization in group_a wouldreflect the effort to undergo the early metastatic steps. There-fore, we converted our frequency of CHT colonization into EarlyMetastatic Potential (EMP) and Late Metastatic Potential (LMP)(Fig. 2P and SI Materials and Methods).Overall, our data show that tumors differed both in their EMP
(ANOVA P = 0.0044) and LMP (ANOVA P = 0.028) (Fig. 2Q).When comparing isogenic lines, we observed that SW480 cellshave a higher EMP than SW620 (P = 0.004) even though theyexhibit similar LMP (Fig. 2Q). These results agree with previousobservations that SW480 cells are more invasive and migratorythan SW620 in vitro and show higher extravasation potential invivo (9, 18).The isogenic pair HCT116/Hke3 showed different EMP (Fig.
2 H, I, and Q, ***P < 0.0001); i.e., in Hke3 KRASWT xenografts,we could only find metastasis when cells were directly injectedinto circulation (Fig. 2 I, N, and Q, P < 0.0001), highlighting the
Fior et al. PNAS | Published online August 23, 2017 | E8235
MED
ICALSC
IENCE
SPN
ASPL
US
SEECO
MMEN
TARY
Dow
nloa
ded
by g
uest
on
Dec
embe
r 1,
202
1

reported roles for activated KRAS in early metastatic events(17–19).Finally, HT29 cells showed high EMP and LMP, frequently
forming organized masses in the eye and CHT (Fig. 2 A, J, O,and Q). This high metastatic potential is consistent with the oneobserved in mouse xenograft models (20).Our results show that it is possible to further discriminate the
cellular metastatic potential by comparing the efficiency of cellsin metastasizing when placed directly into circulation or not.Importantly, we found that the measurement of metastatic po-tential in our model matches that previously described.
Zebrafish Xenografts Discriminate Different Chemosensitivities in4 days. To test whether zebrafish xenografts can measure responsesto therapy, we first assessed the main therapeutic options in ad-vanced CRC guidelines: 5-fluorouracil(FU)+oxaliplatin+folinicacid (FOLFOX) and 5-FU+irinotecan+folinic acid (FOLFIRI)(ref. 19 and Table S2). These protocols are considered as balancedalternatives, since both treatments have shown equivalent averageresponse rates (∼35%) in clinical trials performed on naïve pa-tients (21).To assess chemotherapeutic responses, all xenografts were ran-
domly distributed between treatment groups (control, FOLFOX,
N=46 N=70
DE
SW480 SW620 HCT116 Hke3 HT290
20
40
60
80
100 *** ***
% K
i-67
PVS
SW480 SW620 HCT116 Hke3 HT290
2
4
6
8** ***
% m
itotic
figu
res
PVS
SW480
SW620
HCT116
Hke3
HT290
5
10
15
ns
ns
*** ** *** ***
Tota
l Ves
sel D
ensi
ty
(tota
l GFP
per
tum
or a
rea
%)
SW480
SW620
HCT116
Hke3
HT290
2
4
6
8
10
12
ns
ns
Vess
el In
filtra
tion
(% G
FP in
the
tum
or c
entre
)
DA
PI
Ki-6
7 D
iI H
LA E
dUK
i-67
4dpi
DiI
fli:e
GFP
K
P
F
N=26
SW480
AVG=46%, N=307
A
N=24
L
Q
G
G'
N=22
SW620
AVG=88%, N=243
B
N=28
N
S
I
N=38
Hke3
AVG=84%, N=250
D
N=27
M
R
H
N=58
HCT116C
N=35
AVG=93%, N=414
N=63
HT29
AVG=76%, N=172
N=63
O
W
T
J
E
U V X Y
Z Z’ Z’’ Z’’’N=18 N=46 N=70N=24 N=75
F’ H’ I’ J’
F’’ G’’ H’’ I’’ J’’
Fig. 1. Implantation and histological analysis of human CRC zebrafish-xenografts. Human CRC cells (SW480; SW620; HCT116; Hke3 and HT29) were labeledwith DiI dye (red) and injected into the PVS of 48-hpf zebrafish. At 4 dpi, the number of xenografts with a tumor implanted was quantified (A–E), and theaverage (AVG) implantation rate was determined from at least three independent experiments. Immunohistochemistry for Ki-67 in paraffin sections at 4-dpixenografts (F–J′). Images were obtained using a Zeiss AxioScan Z1, generating tiled images. Note that a fine line of agarose inclusion might be detectedaround the xenograft due to the agarose embedding step prior to paraffin inclusion. Whole-mount immunofluorescence staining at 4 dpi, for Ki-67 (F′′–J′′).Representative images of mitotic figures in the corresponding xenografts (K–O), nuclei staining with DAPI in blue, anti-human HLA in red and EdU staining ingreen (P–T). Quantification of percentage of Ki-67 positive cells per xenograft (Z, ***P < 0.0001) and mitotic figures (Z′, ***P < 0.0001) in correspondingtumors (each dot represents one xenograft). Human CRC xenografts were generated in Tg(fli:eGFP) zebrafish to visualize blood vessels. Images representativeof 4 dpi xenografts induced neovasculature: SW480 (U); SW620 (V); HCT116 (W); Hke3 (X) and HT29 xenografts (Y). Quantification of total vessel density (Z′′)and vessel infiltration (Z′′′); **/*** refers to comparison with HT29. HT29 tumors displayed significantly higher vessel density and infiltration than any othertumor, SW480 vs. HT29 (P = 0.0264); SW620 vs. HT29 (P = ns); HCT116 vs. HT29 (P < 0.0001); and Hke3 vs. HT29 (P < 0.0001). Infiltration potential SW480 vs.HCT116 (P = 0.0482); SW480 vs. HT29 (P = 0.0025); HCT116 vs. HT29 (P < 0.0001). Results in Z, Z′, Z′′, and Z′′′ are expressed as average (AVG) ± SEM. Thenumber of xenografts analyzed for Ki-67; mitotic index and angiogenesis is indicated in the figures. All images in the same row are at the same magnification.*P < 0.05; **P < 0.005; ns, nonsignificant.
E8236 | www.pnas.org/cgi/doi/10.1073/pnas.1618389114 Fior et al.
Dow
nloa
ded
by g
uest
on
Dec
embe
r 1,
202
1
and FOLFIRI) at 24 h postinjection (hpi) and then treated for threeconsecutive days. After 3 days of treatment (and 4 dpi), xenograftswere processed for microscopy and assessed for mitotic index, celldeath by apoptosis (activated caspase3), and tumor size (Fig. 3 P–R).FOLFIRI treatment induced a significant reduction of mitotic
figures in all tumors (Fig. 3P). However, a significant inductionof apoptosis followed by a reduction of tumor mass was onlyobserved in HCT116 (apoptosis P < 0.0001; 59% tumor reductionP < 0.0001) and SW620 (apoptosis P = 0.0021; 35% tumor re-duction P = 0.0026) (Fig. 3 L, M, Q, and R). Remarkably,SW620 and HCT116 are more sensitive than their respectiveisogenic pairs. These results suggest differential sensitivities totherapy throughout cancer progression (primary vs. metastasis)and in heterogeneous tumor populations (KRAS subclones).Only in HCT116, FOLFOX treatment resulted in significant
induction of apoptosis accompanied by a reduction of tumor size(apoptosis P < 0.0001; 44% reduction P = 0.0018) (Fig. 3 H, Q,and R). Strikingly, Hke3 (HCT116 isogenic pair) showed noinduction of apoptosis or reduction of tumor mass when treatedwith FOLFOX (Fig. 3 I, Q, and R). These results are consistent
with KRAS mutations increasing sensitivity to 5-FU-inducedapoptosis (22). As for HT29, as previously reported in mousexenografts (23), we could observe a significant reduction ofmitotic figures (P < 0.0001) and increase in apoptosis uponboth FOLFIRI (P < 0.0001) and FOLFOX treatment (P <0.0001) (Fig. 3 P and Q).In general, our results are consistent with previous mouse in
vivo studies (23, 24), with the exception of SW620, which has beenreported to respond to FOLFOX (24). The differences observedin our study are likely to reflect that our assay is designed to detectfast strong responses, given its short time window (3 days). This isparticularly evident in the study by Van Schaeybroeck (24) whereHCT116 tumors stop growing as soon as FOLFOX treatment isinitiated, whereas SW620 shows a delayed response.In summary, we show that zebrafish larvae xenografts have
enough resolution to measure interpatient and intrapatient het-erogeneity in chemotherapy responses in just 4 days. These re-sults highlight the heterogeneity of chemotherapeutic responseand the possibility of measuring this in a very short period in vivo.To further confirm the HCT116 (KRASMUT) and Hke3 (KRASWT)
opposing chemosensitive profiles, we challenged them in thesame xenograft host. For that, we coinjected the two cell lines(1:1), each labeled with a different lipophilic dye. Mixed xenografts(HCT116+Hke3) were randomly distributed into FOLFIRI andcontrol groups. As expected, given their higher proliferative po-tential, HCT116 KRASMUT cells outcompete Hke3 KRASWT andbecome dominant in the mix, representing ∼80% of the tumor(Fig. 3 S and U). However, upon FOLFIRI treatment, HCT116significantly reduced its frequency (P < 0.0001) (Fig. 3 T and U).Consistent with the individual response to FOLFIRI treatment,we observed a significant increase in apoptosis (P = 0.0023) and adecrease in mitotic figures (P < 0.0001), accompanied by a signif-icant decrease in HCT116 tumor size (∼56% reduction P < 0.0001)(Fig. 3 V–X). In contrast, Hke3 clone size did not change uponFOLFIRI treatment, remaining at similar levels to controls (Fig. 3X).These results demonstrate the differential chemosensitive
profiles of both cell lines and how the KRAS mutation sensitizescells to chemotherapy (22). Our data also illustrate how, in hetero-geneous tumors, KRASmutations can provide a proliferation benefit,and how chemotherapy may disrupt this advantage, selecting theminor clone resistant to treatment, which then may be responsiblefor relapses.
HCT116 and Hke3 Mouse Xenografts Show Similar ChemosensitiveProfile to Zebrafish Xenografts. To directly compare the HCT116and Hke3 chemosensitive profile determined in zebrafish withmouse xenografts, we generated HCT116/Hke3 double mousexenografts, controlling treatment efficacy and delivery in thesame animal (25). After 14 days, mice were randomly distributedamong treatment groups and treated with three cycles of che-motherapy (Fig. 4).Similarly to our zebrafish xenograft results, Hke3 mouse tumors
presented a reduced mitotic index upon FOLFIRI treatment butnot with FOLFOX (Fig. 4 D–F′ and G), and no significant differ-ence in apoptosis was observed with both treatments (Fig. 4H). Alsoin agreement with what we observed in zebrafish, both FOLFOXand FOLFIRI induced a significant increase in apoptosis inHCT116 cells (Fig. 4 A′–C′ and H) and reduced proliferation(Fig. 4 G and H) albeit to a lesser extent in FOLFOX than inFOLFIRI (FOLFOX vs. FOLFIRI: apoptosis P = 0.0017, mi-totic figures P = 0.029), closely resembling the zebrafish results(Fig. 3 P and Q).However, we were unable to detect clear differences in tu-
mor size between control and treatment groups in our mousexenograft study (Fig. 4I). This contrasts not only with our zebrafishxenograft results (Fig. 3R) but also with previous mouse studies,where FOLFOX reduces the size of HCT116 tumors (24). Theinability to detect tumor reduction in mouse xenografts is likely to
Early Late Early Late Early Late Early Late Early Late0
20
40
60
80
100
SW480 SW620 HCT116 Hke3 HT29
****
****
met
asta
tic p
oten
tial
SW480 SW620 HCT116 Hke3 HT29
Ki-6
7
F
K
G
L
H
M
I
N
J
O
invasion to distant sites
brain eye gills muscle
A B C D E
CHT
N=30 N=33 N=8 N=7 N=33
CH
T 4d
pi
Q R
injection
CHT
PVSa
PVS + circulationb
% xenografts with micrometastasis(Early + Late metastatic steps)
% xenografts with micrometastasis(Late metastatic steps )
4dpi
4dpi
P
DiI
DA
PI
HLA
DA
PI
Fig. 2. Human CRC cells show different metastatic potential. At 4 dpi, it ispossible to detect human tumor cells throughout the zebrafish body, in thebrain (A), eye (B), gills (C), muscle (D), and CHT (E). Immunofluorescence forKi-67 (F–J) and anti-human HLA (K–O) in the CHT region at 4 dpi in the in-dicated xenografts. To distinguish between early and late metastatic steps,tumor cells were injected into the PVS only (group_a) or in the PVS and directlyinto circulation (group_b) (P). Quantification of Early (EMP) and Late (LMP)Metastatic Potential (Q) and percentage of Ki-67 positive cells in the CHTmicrometastasis (R); each dot represents one xenograft. Results are averagesfrom at least three independent experiments. The number of xenografts an-alyzed for Ki-67 is indicated in the images. The number of xenografts analyzedfor EMP and LMP are as follows: SW480 (EMP, n = 62; LMP, n = 66); SW620(EMP, n = 50; LMP, n = 69); HCT116 (EMP, n = 73; LMP, n = 57); Hke3 (EMP, n =74; LMP, n = 250); HT29 (EMP, n = 31; LMP, n = 94) (Q). Results in Q and R areexpressed as AVG ± SEM. Nuclei staining with DAPI is in blue. All pictures in thesame row (F–O) are at the same magnification. All images are anterior to theleft, posterior to right, dorsal up, and ventral down. *P < 0.05; **P < 0.005;***P < 0.0001.
Fior et al. PNAS | Published online August 23, 2017 | E8237
MED
ICALSC
IENCE
SPN
ASPL
US
SEECO
MMEN
TARY
Dow
nloa
ded
by g
uest
on
Dec
embe
r 1,
202
1

rely on different experimental designs (treatment initiation 3 daysvs. 14 days postinoculation) that may lead to different tumor growthkinetics. Thus, with the exception of long-term tumor size decline,our results in mouse xenografts show a higher response to treatmentin HCT116 than in Hke3 cells, closely matching zebrafish xenografts.
Differential Sensitivity to Cetuximab and Regorafenib in CRC Tumorsin Zebrafish Xenografts. Our results suggest that Hke3 KRASWT
tumors were refractory to FOLFOX and FOLFIRI standardchemotherapy. CRC guidelines further recommend that KRASWT
patients should be treated with a combination of chemother-
apy and Cetuximab, a monoclonal antibody anti-epidermal growthfactor receptor (EGFR) (19, 26). KRASWT status is an establishedbiomarker for Cetuximab treatment (19, 26). Consequently, pa-tients with metastatic CRC who present a mutated KRAS profile(KRASMUT), such as in HCT116, are generally excluded fromCetuximab treatment (19).To test whether Cetuximab therapy could induce cell death
and reduce tumor mass in Hke3 tumors, we treated Hke3 KRASWT
and HCT116 KRASMUT xenografts (as a negative control) withCetuximab, with FOLFIRI, and with a combination of FOLFIRIand Cetuximab. Surprisingly, Cetuximab alone could significantly
P Q R
SW480 HT29
CO
NTR
OL
FOLF
OX
FOLF
IRI
SW620 HCT116 Hke3
Act
. cas
pase
3D
AP
I 4dp
i 3dp
T
A
F
K
B
G
L
C
H
M
D
I
N
E
J
O
contro
l
FOLFOX
FOLFIRI
contro
l
FOLFOX
FOLFIRI
contro
l
FOLFOX
FOLFIRI
contro
l
FOLFOX
FOLFIRI
contro
l
FOLFOX
FOLFIRI
0
510
15
20
25
30SW480 SW620 HCT116 Hke3 HT29
*****
***
******ns ns ns
*
***
*
ns ns
Act
. cas
pase
3 (f
old
indu
ctio
n)
contro
l
FOLFOX
FOLFIRI
contro
l
FOLFOX
FOLFIRI
contro
l
FOLFOX
FOLFIRI
contro
l
FOLFOX
FOLFIRI
contro
l
FOLFOX
FOLFIRI
0.0
0.5
1.0
1.5
2.0
2.5
**
ns
***
***
**
*** ***
ns
ns
ns
SW480 SW620 HCT116 Hke3 HT29
% m
itotic
figu
res
contro
l
FOLFOX
FOLFIRI
contro
l
FOLFOX
FOLFIRI
contro
l
FOLFOX
FOLFIRI
contro
l
FOLFOX
FOLFIRI
contro
l
FOLFOX
FOLFIRI
0.0
0.5
1.0
1.5
**
SW480 SW620 HCT116 Hke3 HT29
***
ns ns ** ns
ns
*
AVG
tum
or s
ize
(nor
mal
ized
)
HCT116 Hke3 HCT116 Hke30
2
4
6 CONTROL FOLFIRI
*** **% m
itotic
figu
res
HCT116 Hke3 HCT116 Hke30
5
10
15
20 CONTROL FOLFIRI
**
*
% A
ct. c
aspa
se3
HCT116 Hke3 HCT116 Hke30
500
1000
1500
2000
2500CONTROL FOLFIRI
***ns
HCT116 Hke3 HCT116 Hke30
20
40
60
80
100CONTROL FOLFIRI
******
% e
ach
clon
e / t
umor
N=11
CO
NTR
OL
FOLF
IRI
Act
. cas
pase
3D
AP
I 4dp
i
HCT116 + Hke3 polyclonal xenografts
S
TN=12
U V
W X
Fig. 3. CRC xenografts show different sensitivities to standard chemotherapy. Human CRC zebrafish xenografts were treated in vivo with FOLFOX (F–J)and FOLFIRI (K–O) compared with nontreated controls (A–E ). Zebrafish were killed and fixed at 4 dpi, 3 days posttreatment (3 dpT). Mitotic index (P) (DAPIin blue) and cell death by apoptosis (Q) (activated caspase3 in green) were analyzed and quantified. Average tumor size (number of DAPI cells), nor-malized to respective controls, was also quantified to compare between different xenografts in different conditions (R). All pictures are at the samemagnification (A–O). Results in P–R are expressed as AVG ± SEM. Results are averages from at least three independent experiments, and the total numberof xenografts analyzed is indicated in the images; ns, nonsignificant; P values are indicated in the text, ***P < 0.001. HCT116 and Hke3 polyclonal xe-nografts (1:1) were generated and randomly treated with FOLFIRI (T) and compared with untreated controls (S ). Xenografts were fixed at 4 dpi, 3 dpT.The percentages of each clone (U), cell death by apoptosis (V ) (activated caspase3), mitotic index (W ), and the size of each clone per xenograft (X ), wereanalyzed and quantified. Each dot represents a xenograft, Hke3_caspase3 **P = 0.041, Hke3_mitosis **P = 0.006, remaining P values are indicated in thetext, and *P < 0.05; **P < 0.005; ***P < 0.001. The total number of xenografts analyzed is indicated in the images. HCT116 was labeled with DiI (red) andHke3 with DeepRed (green, false color).
E8238 | www.pnas.org/cgi/doi/10.1073/pnas.1618389114 Fior et al.
Dow
nloa
ded
by g
uest
on
Dec
embe
r 1,
202
1

induce apoptosis in both Hke3 and HCT116 tumors (Fig. 5 B, F,and J). Combination of Cetuximab and FOLFIRI resulted in in-creased sensitivity of individual treatments in HCT116 tumors(Fig. 5 D, H, and J). This synergistic effect was also observed inthe reduction of mitotic figures, but not in the reduction of tumorsize (Fig. 5 I and K).We were surprised to observe the effect of Cetuximab in
HCT116 (Fig. 5 I–K), given the status of KRASMUT. However, it wasrecently reported that a proportion of patients with KRASG13D
mutations, but not with KRASG12V mutations, benefit fromtreatment with Cetuximab (27). Thus, to further test the sensi-tivity of our in vivo assay, we treated SW620 KRASG12V tumorswith Cetuximab (Fig. S3 E–G). In contrast to HCT116 KRASG13D,but as expected for KRASG12V tumors, no significant effect wasobserved with Cetuximab treatment in SW620 KRASG12V tumors(Fig. S3). These results demonstrate that the zebrafish xenograftassay has a remarkable resolution to detect sensitivity to Cetuximabtreatment, even in KRASG13D tumors.Although Cetuximab treatment of Hke3 KRASWT tumors in-
duced apoptosis, this was not accompanied by a significant re-duction of tumor mass (Fig. 5 J and K), suggesting that Cetuximabis not very effective in Hke3 cells.Regorafenib is a small-molecule multikinase inhibitor recom-
mended in refractory metastatic CRC, usually used as a last al-ternative in the guidelines (19, 28). Regorafenib has been shownnot only to induce apoptosis (28) but also to have antiangiogenicactivity (29). Thus, to test whether regorafenib could be moreeffective for Hke3 refractory and less proliferative tumors, xe-nografts were treated with regorafenib for three consecutivedays. Although we could not observe changes in the mitoticindex of Hke3 (Fig. S4G), regorafenib was able to induce ap-optosis in Hke3 cells (P < 0.0001) accompanied by a significantreduction of tumor size (Fig. S4 A, B, H, and I, P = 0.0041).These results highlight the possibility of detecting response totherapy even in low proliferative and refractory tumors.In addition, since regorafenib is also considered antiangiogenic,
we also examined this effect in HT29 xenografts (which we pre-viously showed were highly angiogenic). We detected a reductionon the total vessel density in HT29 tumors (Fig. S4 J, C′, and D′,
P < 0.0001) but not in Hke3 or SW620 (Fig. S4 J, A′, B′, E′,and F′). Regorafenib also induces apoptosis in HT29 tumors;however, this induction is not accompanied by a reduction oftumor mass as in Hke3 (Figs. S4H, P = 0.0083, and I). Theseresults suggest that regorafenib is efficient as a third line oftreatment for Hke3 refractory tumors and that regorafenib isalso able to block tumor-derived neovascularization in highlyangiogenic tumors.Overall, we show that it is possible to perform an in vivo
screening of the main current options of the international CRCtreatment guidelines from first to third line, by using thezebrafish larvae xenograft model.
Zebrafish PDX Can Be Efficiently Established Using Human CRCPrimary Samples. Next, to test whether zebrafish larvae can beefficiently used to generate zebrafish PDX (zPDX), we injectedcell suspensions derived from surgically resected human colontumors into zebrafish. We developed a protocol based on pro-cedures for human CRC organoids derivation to maintainstemness and cell viability during processing (30, 31) (SI Materialsand Methods and Table S4).Selected primary tumors corresponded to adenocarcinomas of
diverse tumor stages (Table S3). We selected 24-hpi zPDX forthe presence of a DiI stained mass in the PVS and left them todevelop for three more days. At 4 dpi, percentage of implanta-tion was scored as previously (Fig. 6F). We observed implanta-tion rates ranging from 47% (zPDX#3) to 89% (zPDX#4) (Fig.6 A–F). For large primary tumor samples (zPDX#2, zPDX#4and zPDX#5), injections were repeated and gave rise to similarengraftment rates (Fig. 6F), demonstrating the reproducibility ofthe procedure.The zPDX were processed for whole-mount immunofluo-
rescence to assess angiogenesis (Fig. 6 A′–E′), tumor size (Fig.6G), mitotic figures (Fig. 6H), expression of CRC markers(carcinoembryonic antigen, CEA), and human-associated antigens
contro
l
FOLFOX
FOLFIRI
contro
l
FOLFOX
FOLFIRI
0
1
2
3
4HCT116 Hke3
ns ns
ns nstum
or a
rea
(cm
2 )
contro
l
FOLFOX
FOLFIRI
contro
l
FOLFOX
FOLFIRI
0
5
10
15
*
***
ns ns
HCT116 Hke3
**
% A
ct. c
aspa
se3
contro
l
FOLFOX
FOLFIRI
contro
l
FOLFOX
FOLFIRI
0.0
0.5
1.0
1.5
2.0 HCT116 Hke3
******
ns
**
*
% m
itotic
figu
res
HC
T116
Hke
3CONTROL FOLFOX FOLFIRI
A A’
D D’ E E’N=5 N=5
N=5 N=5
B B’ C C’
F F’N=5
N=5
DAPI caspase3 H&E H&E H&EDAPI caspase3 DAPI caspase3
HG IN=5
Fig. 4. HCT116 and Hke3 mouse xenografts validate zebrafish chemo-sensitive profile. HCT116 and Hke3 double mouse xenografts were gener-ated and randomly treated with FOLFOX (n = 5) and FOLFIRI (n = 5) andcompared with PBS-treated controls (n = 5). H&E (A–F) staining, as well asimmunofluorescence to detect apoptotic cells (activated caspase3) (A′–F′),was performed in paraffin sections. Mitotic index (G) (DAPI in blue) and celldeath by apoptosis (H) (activated caspase3 in green) were quantified in fieldsdistant from the necrotic center of the tumor. Quantification of tumor area(cm2) was also determined (I); ns, nonsignificant; P values are indicated in thetext, and *P < 0.05; **P < 0.005; ***P < 0.001. Results in G and H areexpressed as AVG ± SEM.
contro
l
cetuxi
FOLFIRI
cetuxi
+ Fi
contro
l
cetuxi
FOLFIRI
cetuxi
+ Fi 0
2
4
6
HCT116 Hke3
**
***
***
***
***
*** ns***
Act
. cas
pase
3 (fo
ld in
duct
ion)
HC
T116
Hke
3
CONTROL cetuximab cetuxi + FIFOLFIRI
A B C D
E F G H
I J K
N=57
N=33
N=33
N=29
N=48
N=35
N=29
N=42
Act. caspase3 DAPI 4dpi
contro
l
cetuxi
FOLFIRI
cetuxi
+ Fi
contro
l
cetuxi
FOLFIRI
cetuxi
+ Fi 0.0
0.5
1.0
1.5
****** ***
**ns
nsns ns
HCT116 Hke3
AVG
tum
orsi
ze(n
orm
aliz
ed)
contro
l
cetuxi
FOLFIRI
cetuxi
+ Fi
contro
l
cetuxi
FOLFIRI
cetuxi
+ Fi 0.0
0.5
1.0
1.5
2.0
ns
*** **** ns
*** ***
HCT116 Hke3
% m
itotic
figu
res
Fig. 5. Differential sensitivity to Cetuximab in human CRC in zebrafish-xenografts. HCT116 (A–D) and Hke3 (E–H) xenografts were treated forthree consecutive days, with Cetuximab (B and F), FOLFIRI (C and G) andCetuximab in combination with FOLFIRI (cetuxi + FI) (D and H) and comparedwith control nontreated xenografts (A and E). Mitotic index (I) (DAPI inblue), cell death by apoptosis (J) (activated caspase3 in green), and AVGtumor size (K) (number of DAPI cells per tumor) were analyzed and quan-tified at 4 dpi and 3 dpT. Average tumor size and the percentage of acti-vated caspase3 were normalized to respective controls to compare betweendifferent xenografts. Results are expressed as AVG ± SEM. *P < 0.05; **P <0.005; ***P < 0.0001; ns, nonsignificant.
Fior et al. PNAS | Published online August 23, 2017 | E8239
MED
ICALSC
IENCE
SPN
ASPL
US
SEECO
MMEN
TARY
Dow
nloa
ded
by g
uest
on
Dec
embe
r 1,
202
1
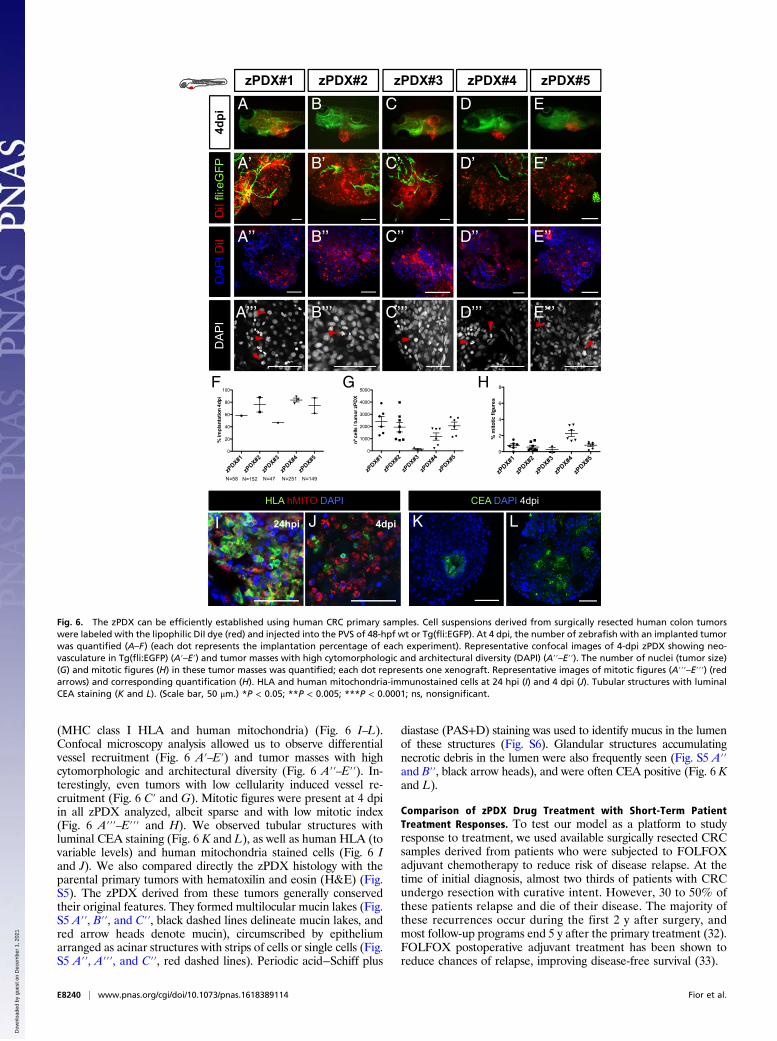
(MHC class I HLA and human mitochondria) (Fig. 6 I–L).Confocal microscopy analysis allowed us to observe differentialvessel recruitment (Fig. 6 A′–E′) and tumor masses with highcytomorphologic and architectural diversity (Fig. 6 A′′–E′′). In-terestingly, even tumors with low cellularity induced vessel re-cruitment (Fig. 6 C′ and G). Mitotic figures were present at 4 dpiin all zPDX analyzed, albeit sparse and with low mitotic index(Fig. 6 A′′′–E′′′ and H). We observed tubular structures withluminal CEA staining (Fig. 6 K and L), as well as human HLA (tovariable levels) and human mitochondria stained cells (Fig. 6 Iand J). We also compared directly the zPDX histology with theparental primary tumors with hematoxilin and eosin (H&E) (Fig.S5). The zPDX derived from these tumors generally conservedtheir original features. They formed multilocular mucin lakes (Fig.S5 A′′, B′′, and C′′, black dashed lines delineate mucin lakes, andred arrow heads denote mucin), circumscribed by epitheliumarranged as acinar structures with strips of cells or single cells (Fig.S5 A′′, A′′′, and C′′, red dashed lines). Periodic acid−Schiff plus
diastase (PAS+D) staining was used to identify mucus in the lumenof these structures (Fig. S6). Glandular structures accumulatingnecrotic debris in the lumen were also frequently seen (Fig. S5 A′′and B′′, black arrow heads), and were often CEA positive (Fig. 6 Kand L).
Comparison of zPDX Drug Treatment with Short-Term PatientTreatment Responses. To test our model as a platform to studyresponse to treatment, we used available surgically resected CRCsamples derived from patients who were subjected to FOLFOXadjuvant chemotherapy to reduce risk of disease relapse. At thetime of initial diagnosis, almost two thirds of patients with CRCundergo resection with curative intent. However, 30 to 50% ofthese patients relapse and die of their disease. The majority ofthese recurrences occur during the first 2 y after surgery, andmost follow-up programs end 5 y after the primary treatment (32).FOLFOX postoperative adjuvant treatment has been shown toreduce chances of relapse, improving disease-free survival (33).
zPDX#1
zPDX#2
zPDX#3
zPDX#4
zPDX#5
0
20
40
60
80
100
N=58 N=152 N=47 N=251 N=149
%im
plan
tatio
n4d
pi
zPDX#1
zPDX#2
zPDX#3
zPDX#4
zPDX#5
0
2
4
6
8
%m
itotic
figur
es
DA
PID
iI D
iIfli
:eG
FP
zPDX#2zPDX#1 zPDX#4zPDX#3 zPDX#5
4dpi
DA
PI
HLA hMITO DAPI CEA DAPI 4dpi
4dpi
A B C D E
A’ B’ C’ D’ E’
A’’ B’’ C’’ D’’ E’’
A’’’ B’’’ C’’’ D’’’ E’’’
J24hpiI LK
zPDX#1
zPDX#2
zPDX#3
zPDX#4
zPDX#5
0
1000
2000
3000
4000
5000F G H
Fig. 6. The zPDX can be efficiently established using human CRC primary samples. Cell suspensions derived from surgically resected human colon tumorswere labeled with the lipophilic DiI dye (red) and injected into the PVS of 48-hpf wt or Tg(fli:EGFP). At 4 dpi, the number of zebrafish with an implanted tumorwas quantified (A–F) (each dot represents the implantation percentage of each experiment). Representative confocal images of 4-dpi zPDX showing neo-vasculature in Tg(fli:EGFP) (A′–E′) and tumor masses with high cytomorphologic and architectural diversity (DAPI) (A′′–E′′). The number of nuclei (tumor size)(G) and mitotic figures (H) in these tumor masses was quantified; each dot represents one xenograft. Representative images of mitotic figures (A′′′–E′′′) (redarrows) and corresponding quantification (H). HLA and human mitochondria-immunostained cells at 24 hpi (I) and 4 dpi (J). Tubular structures with luminalCEA staining (K and L). (Scale bar, 50 μm.) *P < 0.05; **P < 0.005; ***P < 0.0001; ns, nonsignificant.
E8240 | www.pnas.org/cgi/doi/10.1073/pnas.1618389114 Fior et al.
Dow
nloa
ded
by g
uest
on
Dec
embe
r 1,
202
1

Although not the ideal setting to study predictability, wesought to test whether response to FOLFOX treatment in zPDXwould anticipate a delay in relapse in the matching patients, orwhether resistance to drug treatment in our model would asso-ciate with tumor relapse.We generated zPDX from five different tumors and treated
them with FOLFOX over 3 days. Of the five zPDX, we could onlyobserve response to FOLFOX treatment (induction of activatedcaspase3) in two zPDX (Fig. 7A and Fig. S7). These zPDX cor-respond to patients in whom, 6 mo after surgery, the levels of CEAremain stable, with no indication of relapse. In contrast, of thethree zPDX in which we could not detect response to FOLFOXtreatment, two are already in relapse after 3 mo, with increasinglevels of CEA and clinical evidence of recurrence (Fig. 7 A and Band Fig. S7). Thus, we could anticipate relapse/no relapse within3 mo to 6 m after surgery in four out of five patients.Our previous results on the sensitivity to Cetuximab treatment
in detecting responses in tumors with KRASG13D mutationsprompted us to test whether response to Cetuximab in zPDXwould correlate with genomic prediction of response to theEGFR blocking therapy. As a proof of concept, to test this as-sumption, we treated three zPDX with a combination of FOLFIRIwith Cetuximab and with FOLFIRI alone. In the three zPDXgenerated, we could observe no added effect of Cetuximab incombination with FOLFIRI, suggesting that the three tumorstested showed resistance to Cetuximab (Fig. 7D and Fig. S7 F–H′′). We later sequenced the corresponding tumors and observedthat all of them harbored mutations on either KRAS or BRAF(Fig. 7E). All these mutations highly correlated to resistance toCetuximab (34). Thus, our results corroborated the genomic pre-diction (Fig. 7F).
Even though we have not yet gathered sufficient patientnumbers to reach statistical significance, we performed proof-of-concept experiments to set the groundwork for a future clinicalstudy to test the predictiveness of zPDX in the more suitableneoadjuvant setting.
DiscussionRecent genome cancer profile studies exposed unanticipated tu-mor heterogeneity. This heterogeneity has been observed not onlybetween cancers (intertumor) but also within each cancer (intra-tumor) (35, 36). Even identical CRC clones that share the samegenome exhibit multiple functional profiles (including distinctresponses to therapies) (37), implying that the basis for hetero-geneity is not only genetic. Most approved drugs lack known bio-markers, and, even in biomarker-driven therapies, response ratesare not foolproof (36, 38). Thus, in the current scenario, we arecurrently unable to securely forecast which patient is likely to re-spond to a given therapy program.Chemosensitivity tests are not a novel idea. However, the ac-
curacy of in vitro tests has not been robust enough to support itsuse in oncology practice (39). Recently, Letai and colleagues(40) showed a promising in vitro assay that bypasses serial pas-sages and directly challenges tumor cells with therapeutic drugs,using BH3 profiling as a proxy of cell death. In this assay, there isa direct measurement of mitochondrial stress upon the applieddrug (40, 41). In addition, in vitro organoids constitute a majortechnological breakthrough for the study of tumor biology, drugdiscovery, and, possibly, personalized medicine (42).Although promising, in vitro tests will always lack the com-
plexity of interactions of tumor cells with their microenviron-ment in the in vivo setting. The current gold standard for in vivoassessment of tumor heterogeneity and response to therapy ismouse PDX (1). However, mouse PDX are not practical forclinical advice due to the time it takes to implant tumors andexpand colonies, and the costs they entail. Here, we have takenan intermediate approach—a fast in vivo assay with unprece-dented cellular resolution—the zebrafish larvae xenograft model.We set out to test whether the zebrafish larvae xenografts have
enough resolution to uncover functional cancer heterogeneityto screen in vivo international treatment guidelines. Our studyshows that zebrafish xenografts are capable of discriminating, withsingle-cell resolution, distinct proliferation dynamics and differ-ential metastatic potentials, not only between tumors derived fromdifferent patients but also between isogenic pairs.Our ultimate goal was to screen the major therapeutic options
present in the international guidelines for advanced CRC (19)using the zebrafish xenograft assay. We analyzed the response offive zebrafish xenografts (cell line-derived) to the two mostcommon and equivalent chemotherapy options FOLFOX andFOLFIRI (21) and observed an overall higher sensitivity toFOLFIRI than to FOLFOX. This is in agreement with the studyby Sadanandam et al. (11) that found that 70% of stem-likesubtype tumors were associated with a clinical benefit withFOLFIRI treatment. Remarkably, we could also observe aclear differential response to therapy between isogenic tumors,illustrating differential therapy responses between primary andmetastatic tumors (SW480/SW620) and subclonal tumor pop-ulations (HCT116/Hke3). We also reproduced polyclonal tumorscenarios and show differential responses to chemotherapy in thesame xenograft and how therapy can select for minor resistantclones.Following the next recommended therapy in the guidelines,
we tested for Cetuximab sensitivity. Cetuximab treatment is abiomarker-driven therapy, recommended specifically for KRASWT
tumors. Although not effective in all patients with KRASWT tumors(only ∼12.8%), the probability of response to Cetuximab treatmentis still significantly higher (26). To our surprise, Cetuximab waseffective on HCT116 KRASG13D. Consistent with our results, recent
A
B
C
D
E
F
Fig. 7. The zPDX treatment response may predict relapse and correlatewith known genomic biomarkers of Cetuximab resistance. Five zPDX, cor-responding to patients subjected to curative surgery and postoperativeFOLFOX adjuvant treatment, were treated with FOLFOX for 3 days andprocessed for immunofluorescence. Cell death by apoptosis (A) (activatedcaspase3) was analyzed and quantified. The zPDX#7 control vs. FOLFOXP = 0.037; zPDX#9 control vs. FOLFOX P = 0.016. (B) Relapse and CEA levelsinformation for the five patients analyzed. (C ) Confusion matrix displaysthe number of patients with actual and predicted responses in zPDX, i.e., re-sponders are patients that did not relapse (R), and patients that relapse are thenonresponders (NR). (D) Three zPDX were treated with FOLFIRI and withFOLFIRI in combination with Cetuximab, and cell death by apoptosis (activatedcaspase3) was analyzed. The zPDX#5 control vs. FOLFIRI P = 0.0043, and controlvs. FOLFIRI+Cetuximab P = 0.0084; zPDX#9 control vs. FOLFIRI P = 0.001, andcontrol vs. FOLFIRI+Cetuximab P = 0.012. (E) Genomic information of theanalyzed patients. (F) Confusion matrix displays the number of patients withmutations predicted of resistance with predicted responses in zPDX. *P < 0.05;**P < 0.005; ***P < 0.0001; ns, nonsignificant.
Fior et al. PNAS | Published online August 23, 2017 | E8241
MED
ICALSC
IENCE
SPN
ASPL
US
SEECO
MMEN
TARY
Dow
nloa
ded
by g
uest
on
Dec
embe
r 1,
202
1
clinical reports revealed that a significant portion of patients withKRASG13D mutations, but not KRASG12V, benefit from Cetuximabtreatment (27). Thus, our results suggest that zebrafish xenograftscan measure responsiveness to therapy of tumors with differentKRAS point mutations. Our study also illustrates the relevanceof functional assays even in biomarker-driven therapies to fur-ther select the patients that may benefit from specific therapies,specifically in ones that do not have 100% efficacy and are ex-pensive or toxic.Although Hke3 KRASWT tumors responded to Cetuximab treat-
ment, this was not accompanied by a reduction of tumor size. Thus,we tested the third-line option for refractory metastatic CRC—regorafenib. In contrast to previous treatments, Hke3 tumors nowresponded to therapy with an induction of apoptosis accompaniedby reduction of tumor size. Our results illustrate the possibility ofscreening treatment guidelines from first to third line.We also validated our results obtained in zebrafish in mouse
xenografts. This study directly compares zebrafish and mousexenograft chemosensitivity. As in zebrafish, HCT116 respondedto both treatments, but FOLFIRI produced a significantly higherinduction of apoptosis than FOLFOX, and Hke3 seemed refractoryto both treatments. Our results suggest that using apoptosis andreduction of mitotic index as a surrogate as a response to treatmentin zebrafish xenografts (4 days from injection to analysis) can beused as a proxy of the response to treatment in mouse xenografts(minimal 1 mo since injection to analysis). The disparity in timebetween models is likely to reflect the difference in scale of themodels (>10,000 fold). On one hand, zebrafish larvae allow forvisualization of single cells and their response to treatment in multi-ple xenografts, improving statistical power. In contrast, mouse PDXgenerally rely on large palpable tumors, long treatments to visualizeresponses, and multiple rounds of expansion to provide statisticalpower. On the other hand, this longer assay permits the study oftumor evolution, emergence of resistance clones, and overall progres-sion of disease (1, 37). Thus, we envisage that zebrafish and mousexenograft models may complement each other: zebrafish as a fastscreening platform, and mouse xenografts to accompany tumorevolution and relapse.Lastly, we also demonstrate the feasibility of using primary
patient samples to generate zPDX with similar implantationrates as tumor cell lines. We show that zPDX can form tumormasses, induce vascularization, and present multilocular mucinlakes, glandular structures, and CEA expression. As observedwith cell lines (SW480), patient samples (e.g., zPDX#3) alsovary in their engraftment efficiency (being as low as <50%). Toovercome possible low implantation rates, we may increase thenumber of injected fish and use immune-compromised strains (43,44) to dampen the possibility of rejection. As a proof of conceptexperiments, we also treated zPDX with FOLFOX and were ableto anticipate relapse/no relapse within 3 m to 6 m after surgery infour out of five patients. In addition, we sequenced tumors whosematching zPDX did not respond to Cetuximab, and found that all
harbored mutations highly linked to Cetuximab resistance, cor-roborating our zPDX results with genomic data.In summary, we performed proof-of-concept experiments that
show that it is possible to screen the available therapeutic optionspresent in the international CRC guidelines by using zebrafishxenografts. We show that zebrafish larvae xenografts constitute arapid model with high sensitivity to unravel human tumor func-tional heterogeneity. We also performed proof-of-concept exper-iments using patient samples to set the groundwork for a clinicalstudy to test the predictiveness of zPDX as a rapid in vivo screen-ing platform for personalized cancer treatments.
Materials and MethodsAnimal Care and Handling. Zebrafish (Danio rerio) casper, nacre, and Tg(fli1:eGFP)fish were handled according to European animal welfare regulations and stan-dard protocols.
Human Tissue. All samples used for zPDX establishment were obtained fromChampalimaud Hospital or Prof. Doutor Fernando Fonseca Hospital withwritten informed consent. The study was approved by the Ethics Committeesof both hospitals.
Cell Lines and Culture. Colon cancer cell lines, SW480, SW620, and HT29,originally from American Type Culture Collection, were authenticatedthrough short tandem repeat profiling karyotyping isoenzyme analysis.HCT116 and Hke3 isogenic cell lines were donated by Angela Relógio andanalyzed. All cell lines were tested for mycoplasma. All cells were culturedin DMEM (Biowest) supplemented with 10% FBS (Biochrom) and 1%Penicillin−Streptomycin (HyClone) in a humidified atmosphere containing5% CO2 at 37 °C.
Zebrafish Xenografts Injection. Dil-labeled cells were injected into the PVS ofanesthetized 48-hpf larvae (8). After injection, xenografts were transferredto 34 °C until the end of experiments.
Zebrafish Xenograft Drug Administration. The 24-hpi zebrafish xenograftswith the same tumor size were randomly distributed in the treatment groups:control E3 medium, FOLFIRI in E3, and FOLFOX in E3 (4.2 mM 5-FU, 0.18 mMfolinic acid, 0.08 mM irinotecan, 0.08 mM oxaliplatin) for three consecutivedays. Using, as a reference, the maximum patient’s plasma concentrationof each compound (Table S2), we determined the zebrafish maximum toler-ated concentration. Cetuximab monoclonal antibody was added to the cellsuspension (20 μg/ml) at the time of injection and then to E3 medium at100 μg/ml. Regorafenib was added to E3 to a final concentration of 40 mM.
ACKNOWLEDGMENTS. We thank the Surgery and Histopathology Units ofChampalimaud Clinical Center (A. Beltran, L. G. Madruga, M. Castillo, andDr. J. F. Cunha) and Hospital Prof. Doutor Fernando Fonseca for patientsamples and pathology support; Champalimaud Fish and Rodents Facility(C. Certal and S. Mello) and Instituto Gulbenkian de Ciência (IGC) Fish Facilityfor excellent animal care; and The IGC and Instituto de Medicina Molecular(IMM) histology units. We also thank A. Relógio for the HCT116 and Hke3cell lines. We are grateful to B. Costa-Silva, C. Carvalho, L. Saúde, and L. Pattonfor critically reading of the manuscript and J. Escandell and I. P. Castro forhelpful discussions. We thank the Champalimaud Foundation and HowardHughes Medical Institute (HHMI) for financial support. M.G.F. is an HHMI In-ternational Early Career scientist.
1. Hidalgo M, et al. (2014) Patient-derived xenograft models: An emerging platform for
translational cancer research. Cancer Discov 4:998–1013.2. Zon L, Peterson R (2010) The new age of chemical screening in zebrafish. Zebrafish 7:1.3. White R, Rose K, Zon L (2013) Zebrafish cancer: The state of the art and the path
forward. Nat Rev Cancer 13:624–636.4. Veinotte CJ, Dellaire G, Berman JN (2014) Hooking the big one: The potential of
zebrafish xenotransplantation to reform cancer drug screening in the genomic era.
Dis Model Mech 7:745–754.5. Haldi M, Ton C, Seng WL, McGrath P (2006) Human melanoma cells transplanted into
zebrafish proliferate, migrate, produce melanin, form masses and stimulate angio-
genesis in zebrafish. Angiogenesis 9:139–151.6. Marques IJ, et al. (2009) Metastatic behaviour of primary human tumours in a ze-
brafish xenotransplantation model. BMC Cancer 9:128.7. Nicoli S, Ribatti D, Cotelli F, Presta M (2007) Mammalian tumor xenografts induce
neovascularization in zebrafish embryos. Cancer Res 67:2927–2931.8. Zhao C, et al. (2011) A novel xenograft model in zebrafish for high-resolution in-
vestigating dynamics of neovascularization in tumors. PLoS One 6:e21768.
9. Hewitt RE, et al. (2000) Validation of a model of colon cancer progression. J Pathol192:446–454, and correction (2001) 194:507.
10. Shirasawa S, Furuse M, Yokoyama N, Sasazuki T (1993) Altered growth of humancolon cancer cell lines disrupted at activated Ki-ras. Science 260:85–88.
11. Sadanandam A, et al. (2013) A colorectal cancer classification system that associatescellular phenotype and responses to therapy. Nat Med 19:619–625.
12. Hanahan D, Weinberg RA (2011) Hallmarks of cancer: The next generation. Cell 144:646–674.
13. Lawson ND, Weinstein BM (2002) In vivo imaging of embryonic vascular developmentusing transgenic zebrafish. Dev Biol 248:307–318.
14. Xiao F, et al. (2015) MicroRNA-885-3p inhibits the growth of HT-29 colon cancer cellxenografts by disrupting angiogenesis via targeting BMPR1A and blocking BMP/Smad/Id1 signaling. Oncogene 34:1968–1978.
15. Lai KC, et al. (2015) Diallyl trisulfide inhibits migration, invasion and angiogenesis ofhuman colon cancer HT-29 cells and umbilical vein endothelial cells, and suppressesmurine xenograft tumour growth. J Cell Mol Med 19:474–484.
16. Nguyen DX, Bos PD, Massague J (2009) Metastasis: From dissemination to organ-specific colonization. Nat Rev Cancer 9:274–284.
E8242 | www.pnas.org/cgi/doi/10.1073/pnas.1618389114 Fior et al.
Dow
nloa
ded
by g
uest
on
Dec
embe
r 1,
202
1

17. Valastyan S, Weinberg RA (2011) Tumor metastasis: Molecular insights and evolvingparadigms. Cell 147:275–292.
18. Stoletov K, et al. (2010) Visualizing extravasation dynamics of metastatic tumor cells.J Cell Sci 123:2332–2341.
19. Van Cutsem E, Cervantes A, Nordlinger B, Arnold D; The ESMO Guidelines WorkingGroup (2014) Metastatic colorectal cancer: ESMO clinical practice guidelines for di-agnosis, treatment and follow-up. Ann Oncol 25(Suppl 3):iii1–iii9.
20. Ninomiya I, et al. (2004) Anti-metastatic effect of capecitabine on human colon cancerxenografts in nude mouse rectum. Int J Cancer 112:135–142.
21. Colucci G, et al. (2005) Phase III randomized trial of FOLFIRI versus FOLFOX4 in thetreatment of advanced colorectal cancer: A multicenter study of the Gruppo Onco-logico Dell’Italia Meridionale. J Clin Oncol 23:4866–4875.
22. Klampfer L, et al. (2005) Oncogenic Ras increases sensitivity of colon cancer cells to 5-FU-induced apoptosis. Oncogene 24:3932–3941.
23. Priego S, et al. (2008) Natural polyphenols facilitate elimination of HT-29 colorectalcancer xenografts by chemoradiotherapy: A Bcl-2- and superoxide dismutase 2-de-pendent mechanism. Mol Cancer Ther 7:3330–3342.
24. Van Schaeybroeck S, et al. (2014) ADAM17-dependent c-MET-STAT3 signaling medi-ates resistance to MEK inhibitors in KRAS mutant colorectal cancer. Cell Rep 7:1940–1955.
25. Iwamoto M, et al. (2014) Regulation of 18F-FDG accumulation in colorectal cancercells with mutated KRAS. J Nucl Med 55:2038–2044.
26. Karapetis CS, et al. (2008) K-ras mutations and benefit from cetuximab in advancedcolorectal cancer. N Engl J Med 359:1757–1765.
27. De Roock W, et al. (2010) Association of KRAS p.G13D mutation with outcome inpatients with chemotherapy-refractory metastatic colorectal cancer treated with ce-tuximab. JAMA 304:1812–1820.
28. Chen D, Wei L, Yu J, Zhang L (2014) Regorafenib inhibits colorectal tumor growththrough PUMA-mediated apoptosis. Clin Cancer Res 20:3472–3484.
29. Grothey A, et al. (2016) Regorafenib monotherapy for previously treated metastaticcolorectal cancer (CORRECT): An international, multicentre, randomised, placebo-controlled, phase 3 trial. Lancet 381:303–312.
30. Sato T, et al. (2011) Long-term expansion of epithelial organoids from human colon,adenoma, adenocarcinoma, and Barrett’s epithelium. Gastroenterology 141:1762–1772.
31. Fujii M, et al. (2016) A colorectal tumor organoid library demonstrates progressiveloss of niche factor requirements during tumorigenesis. Cell Stem Cell 18:827–838.
32. Guyot F, et al. (2005) Time trends in the treatment and survival of recurrences fromcolorectal cancer. Ann Oncol 16:756–761.
33. André T, et al.; Multicenter International Study of Oxaliplatin/5-Fluorouracil/Leucovorin in the Adjuvant Treatment of Colon Cancer (MOSAIC) Investigators(2004) Oxaliplatin, fluorouracil, and leucovorin as adjuvant treatment for coloncancer. N Engl J Med 350:2343–2351.
34. Hsu H, et al. (2016) Mutations of KRAS/NRAS/BRAF predict cetuximab resistance inmetastatic colorectal cancer patients. Oncotarget 7:22257–22270.
35. Vogelstein B, et al. (2013) Cancer genome landscapes. Science 339:1546–1558.36. Almendro V, Marusyk A, Polyak K (2013) Cellular heterogeneity and molecular evo-
lution in cancer. Annu Rev Pathol 8:277–302.37. Kreso A, et al. (2013) Variable clonal repopulation dynamics influence chemotherapy
response in colorectal cancer. Science 339:543–548.38. Bailey AM, et al. (2014) Implementation of biomarker-driven cancer therapy: Existing
tools and remaining gaps. Discov Med 17:101–114.39. Burstein HJ, et al. (2011) American society of clinical oncology clinical practice
guideline update on the use of chemotherapy sensitivity and resistance assays. J ClinOncol 29:3328–3330.
40. Montero J, Letai A (2016) Dynamic BH3 profiling-poking cancer cells with a stick. MolCell Oncol 3:e1040144.
41. Montero J, et al. (2015) Drug-Induced death signaling strategy rapidly predicts cancerresponse to chemotherapy. Cell 160:977–989.
42. Young M, Reed KR (2016) Organoids as a model for colorectal cancer. Curr ColorectalCancer Rep 12:281–287.
43. Tang Q, et al. (2014) Optimized cell transplantation using adult rag2 mutant zebra-fish. Nat Methods 11:821–824.
44. Moore JC, et al. (2016) Single-cell imaging of normal and malignant cell engraftmentinto optically clear prkdc-null SCID zebrafish. J Exp Med 213:2575–2589.
45. Ahmed D, et al. (2013) Epigenetic and genetic features of 24 colon cancer cell lines.Oncogenesis 2:e71.
46. Casale F, et al. (2004) Plasma concentrations of 5-fluorouracil and its metabolites incolon cancer patients. Pharmacol Res 50:173–179.
47. GrahamM, et al. (2000) Clinical pharmacokinetics of oxaliplatin: A critical review. ProcAm Assoc Cancer Res 6:1205–1218.
48. Limacher J, et al. (2003) Phase I study of high dose 5-fluorouracil and folinic acid inweekly continuous infusions. Cancer Ther 1:203–208.
49. Chabot G (1997) Clinical pharmacokinetics of irinotecan. Clin Pharmacokinet 33:245–259.
Fior et al. PNAS | Published online August 23, 2017 | E8243
MED
ICALSC
IENCE
SPN
ASPL
US
SEECO
MMEN
TARY
Dow
nloa
ded
by g
uest
on
Dec
embe
r 1,
202
1