singapore’s experience in economic development · 2017-07-14 · singapore’s experience in...
TRANSCRIPT
Singapore’s Experience in Economic Development
Panama Conference
Where the World Meets
24 Feb 2011
by Philip YeoSpecial Advisor for Economic Development,
Prime Minister's Office, Government of Singapore
and
Chairman, SPRING Singapore

• Early accounts showed Singapore has been a trading post since 13th century.
• Modern Singapore was founded in 1819 by Sir Stamford Raffles o Spore became centre of govt for
the British Straits Settlements and later a Crown Colony
o Blossomed as a free port trading with India, China, Europe and US
• Occupied by Japan during WWII from 1942-45
• Continued to be key trading hub through and after the war
• Attained self-government in 1959, joined Malaysia in 1963 and finally became an independent nation in 1965
Singapore: A Free Port from 1819
2
Singapore …Singapore Today
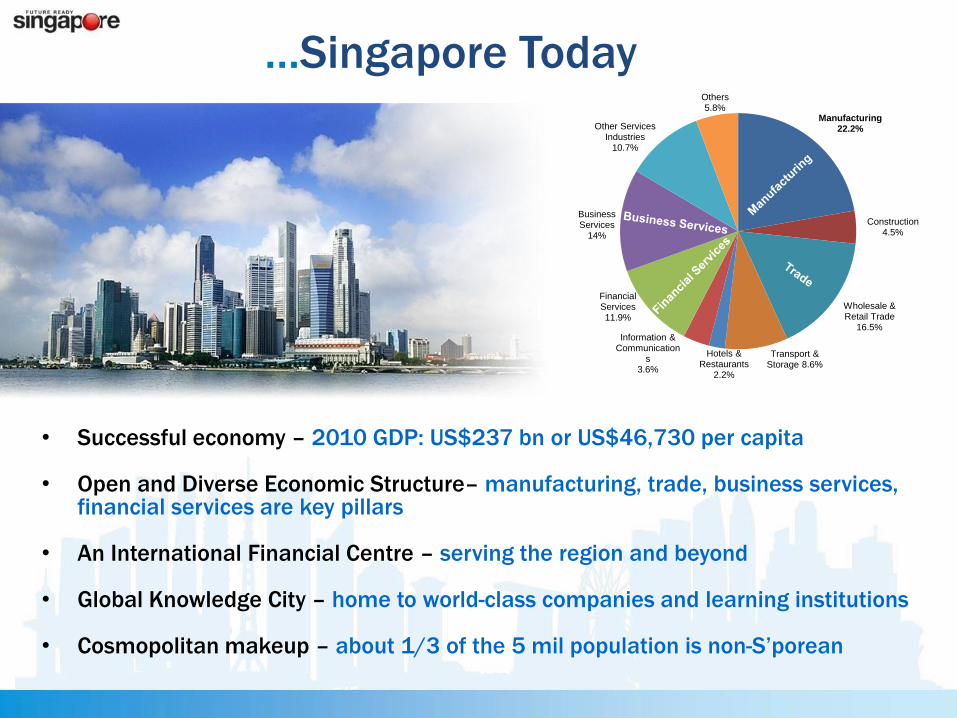
• Successful economy – 2010 GDP: US$237 bn or US$46,730 per capita
• Open and Diverse Economic Structure– manufacturing, trade, business services, financial services are key pillars
• An International Financial Centre – serving the region and beyond
• Global Knowledge City – home to world-class companies and learning institutions
• Cosmopolitan makeup – about 1/3 of the 5 mil population is non-S’porean
Manufacturing 22.2%
Construction 4.5%
Wholesale & Retail Trade
16.5%
Transport & Storage 8.6%
Hotels & Restaurants
2.2%
Information & Communication
s 3.6%
Financial Services 11.9%
Business Services
14%
Other Services Industries
10.7%
Others5.8%
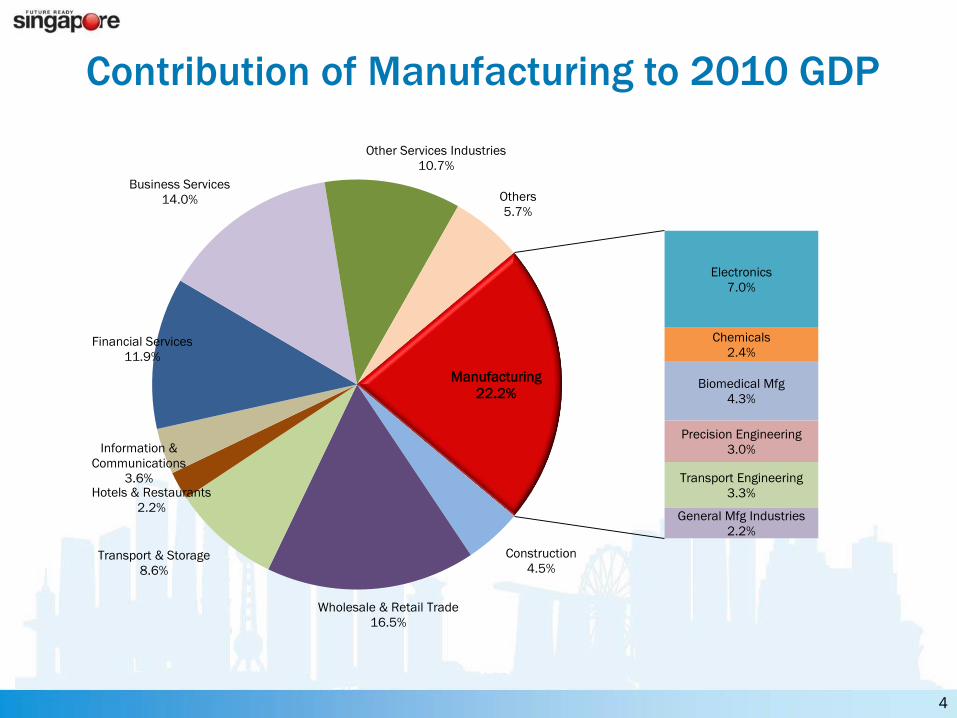
Construction
4.5%
Wholesale & Retail Trade
16.5%
Transport & Storage
8.6%
Hotels & Restaurants
2.2%
Information &
Communications
3.6%
Financial Services
11.9%
Business Services
14.0%
Other Services Industries
10.7%
Others
5.7%
Electronics
7.0%
Chemicals
2.4%
Biomedical Mfg
4.3%
Precision Engineering
3.0%
Transport Engineering
3.3%
General Mfg Industries
2.2%
Manufacturing
22.2%
Contribution of Manufacturing to 2010 GDP
4
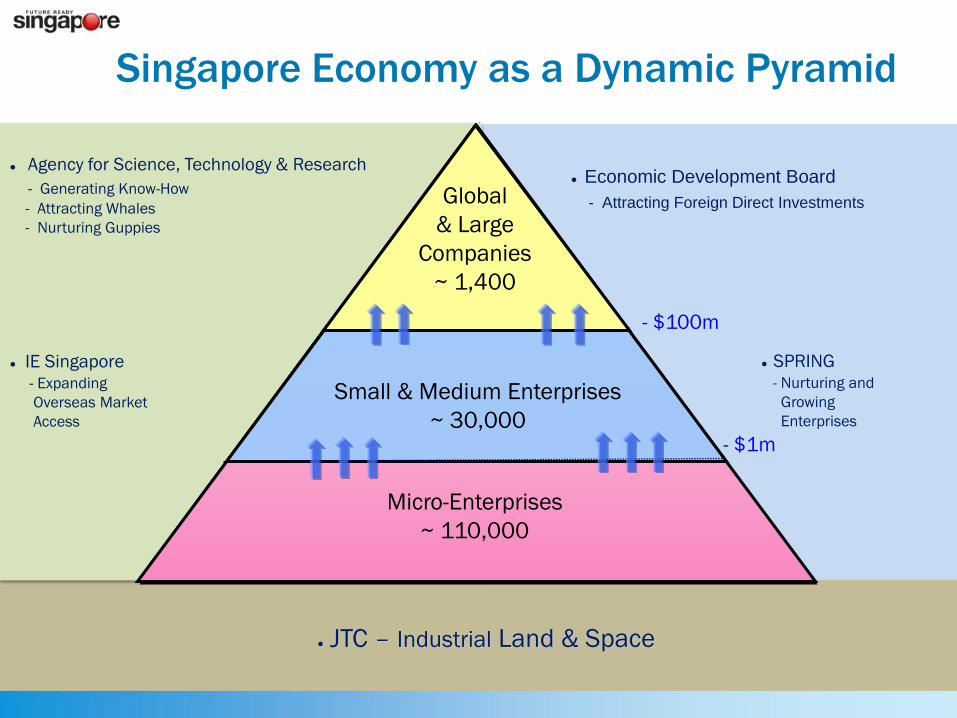
● Agency for Science, Technology & Research
- Generating Know-How
- Attracting Whales
- Nurturing Guppies
● IE Singapore
- Expanding
Overseas Market
Access
● Economic Development Board
- Attracting Foreign Direct Investments
Small & Medium Enterprises
~ 30,000
Micro-Enterprises
~ 110,000
Global
& Large
Companies
~ 1,400
● SPRING
- Nurturing and
Growing
Enterprises
- $1m
- $100m
● JTC – Industrial Land & Space
Singapore Economy as a Dynamic Pyramid
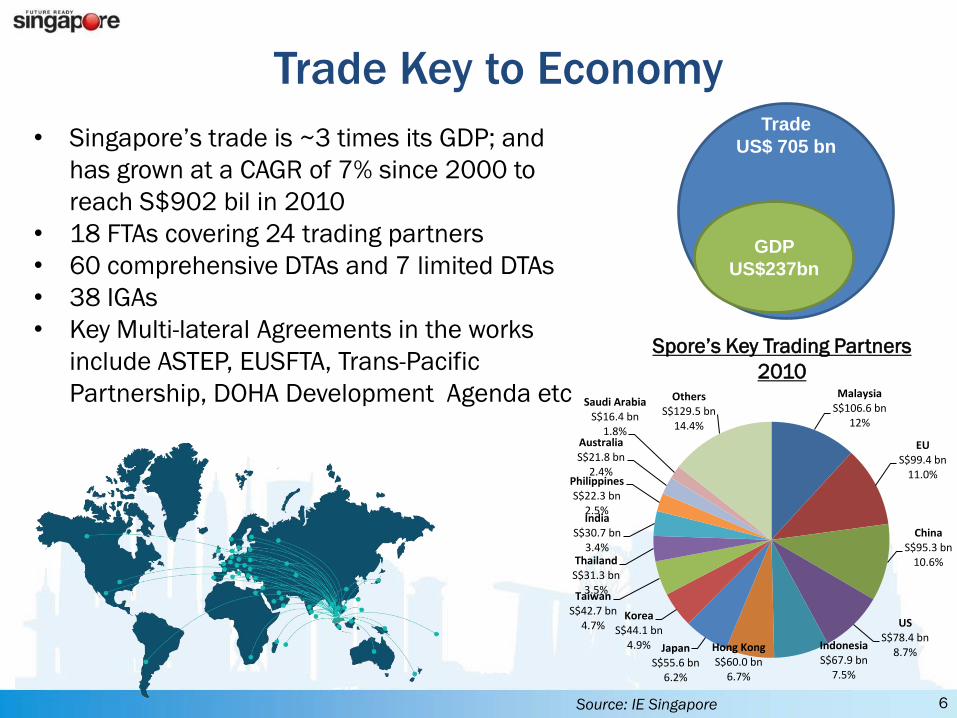
Trade
US$ 705 bn
GDP
US$237bn
• Singapore’s trade is ~3 times its GDP; and
has grown at a CAGR of 7% since 2000 to
reach S$902 bil in 2010
• 18 FTAs covering 24 trading partners
• 60 comprehensive DTAs and 7 limited DTAs
• 38 IGAs
• Key Multi-lateral Agreements in the works
include ASTEP, EUSFTA, Trans-Pacific
Partnership, DOHA Development Agenda etc
Trade Key to Economy
6
MalaysiaS$106.6 bn
12%
EUS$99.4 bn
11.0%
ChinaS$95.3 bn
10.6%
US S$78.4 bn
8.7%IndonesiaS$67.9 bn
7.5%
Hong KongS$60.0 bn
6.7%
Japan S$55.6 bn
6.2%
KoreaS$44.1 bn
4.9%
TaiwanS$42.7 bn
4.7%
ThailandS$31.3 bn
3.5%
IndiaS$30.7 bn
3.4%
PhilippinesS$22.3 bn
2.5%
AustraliaS$21.8 bn
2.4%
Saudi Arabia S$16.4 bn
1.8%
OthersS$129.5 bn
14.4%
Spore’s Key Trading Partners
2010
Source: IE Singapore

Top Container Ports in the World
2009 2010
1 Singapore, 25.9M TEU Shanghai, 29.1M TEU
2 Shanghai, 25.0M TEU Singapore, 28.4M TEU
3 Hong Kong, 20.9M TEU Hong Kong, 23.5M TEU
4 Shenzhen, 18.3M TEU Shenzhen, 22.5M TEU
5 Busan, 12.0M TEU Ningbo, 13.1M TEU
6 Guangzhou, 11.2M TEU Busan, 13.0M TEU
7 Dubai, 11.2M TEU Guangzhou, 12.6M TEU
8 Ningbo, 10.5M TEU Qingdao, 12.0M TEU
9 Qingdao, 10.3M TEU Dubai, 11.6M TEU
10 Rotterdam, 9.8M TEU Rotterdam 11.1M TEU
• The Port of Singapore has prospered in tandem with growth in global trade.
• Ranks amongst the busiest ports in the world:o World's #1 port by shipping tonnage
since 1986
o World's #1 container port in 2005 -2009
o World's #1 trans-shipment port
o World's #1 bunkering port since 1988
o World's #1 port by cargo tonnage until 2005, and in 2008
• Trans-shipment accounts for bulk of Singapore’s volume. Wide variety of cargo types, with multiple destinations
Singapore Port
7
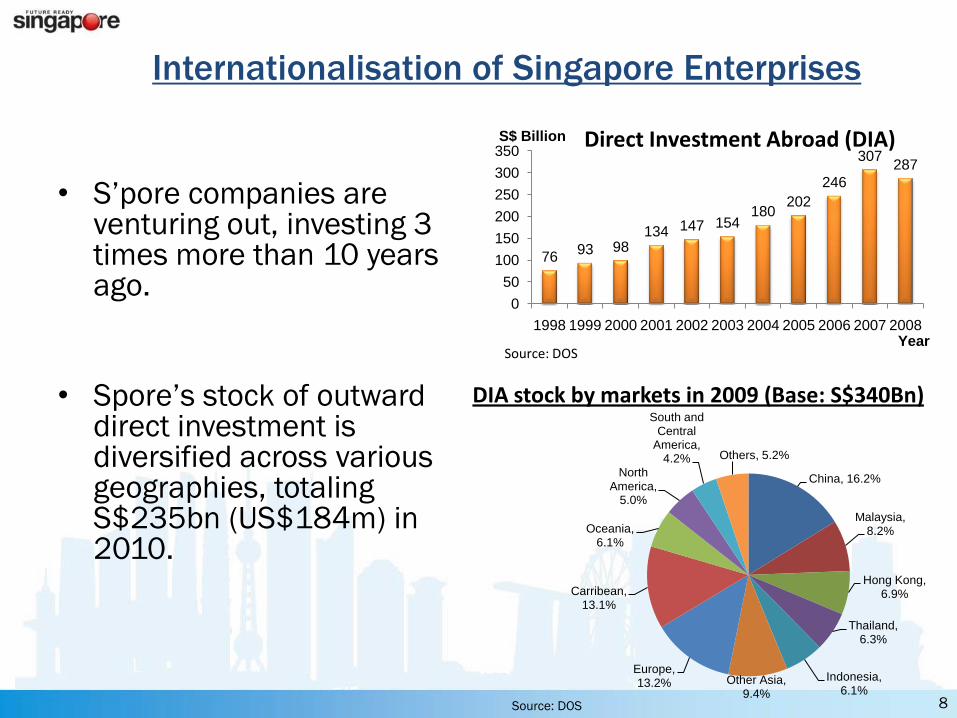
• S’pore companies are venturing out, investing 3 times more than 10 years ago.
• Spore’s stock of outward direct investment is diversified across various geographies, totaling S$235bn (US$184m) in 2010.
Internationalisation of Singapore Enterprises
8
7693 98
134 147 154180
202
246
307287
0
50
100
150
200
250
300
350
1998 1999 2000 2001 2002 2003 2004 2005 2006 2007 2008
S$ Billion
Year
Direct Investment Abroad (DIA)
Source: DOS
China, 16.2%
Malaysia, 8.2%
Hong Kong, 6.9%
Thailand, 6.3%
Indonesia, 6.1%
Other Asia, 9.4%
Europe, 13.2%
Carribean, 13.1%
Oceania, 6.1%
North America,
5.0%
South and Central
America, 4.2% Others, 5.2%
Source: DOS
DIA stock by markets in 2009 (Base: S$340Bn)

Development of Singapore Industries
9
0
1960
5000
10000
15000
20000
25000
30000
35000
40000
1964 1968 1972 1976 1980 1984 1988 1992 1996 2000 2004 2008
GD
P/C
ap
ita
(U
S$
)
2000s:
Innovation Intensive
90s:
Technology Intensive
80s:
Capital Intensive
70s:
Skills Intensive
60s:
Labour Intensive
GDP per capita
80x in 50 years
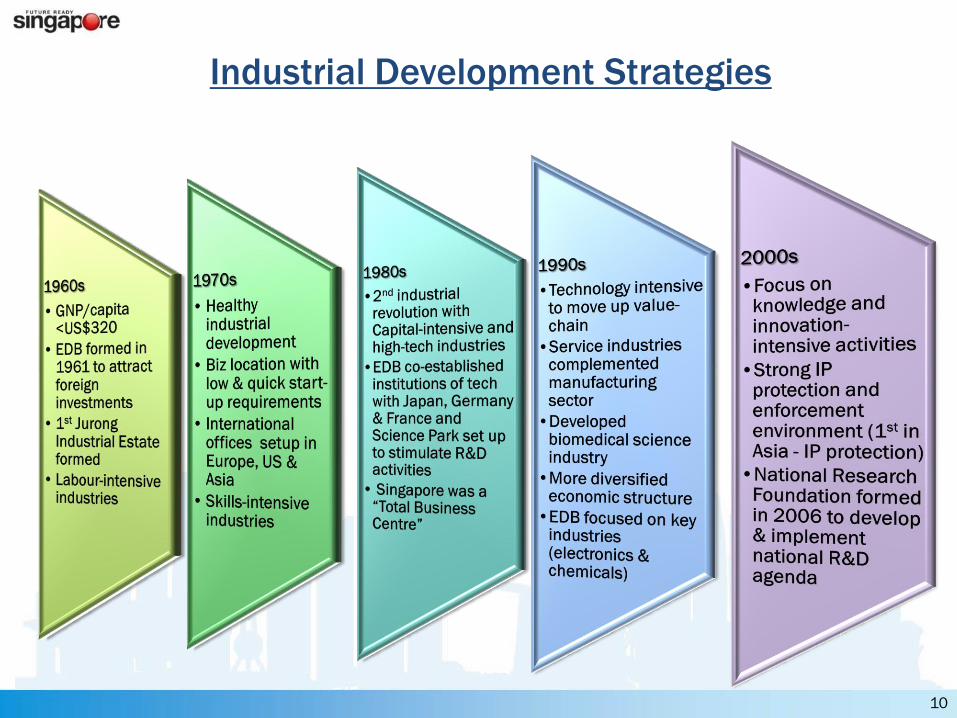
Industrial Development Strategies
10
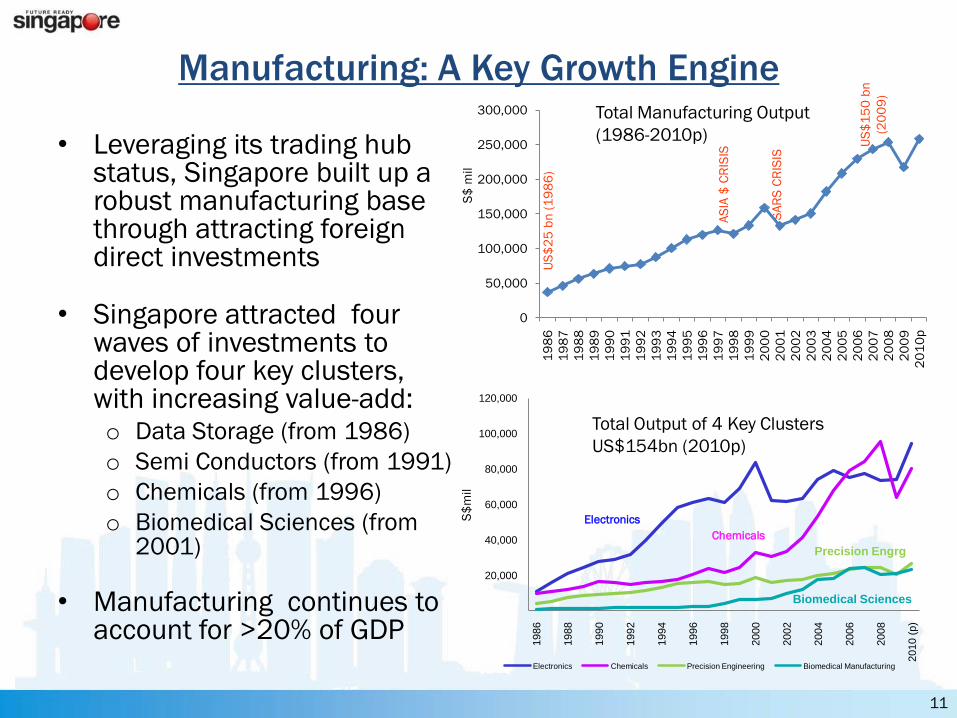
• Leveraging its trading hub status, Singapore built up a robust manufacturing base through attracting foreign direct investments
• Singapore attracted four waves of investments to develop four key clusters, with increasing value-add:o Data Storage (from 1986)
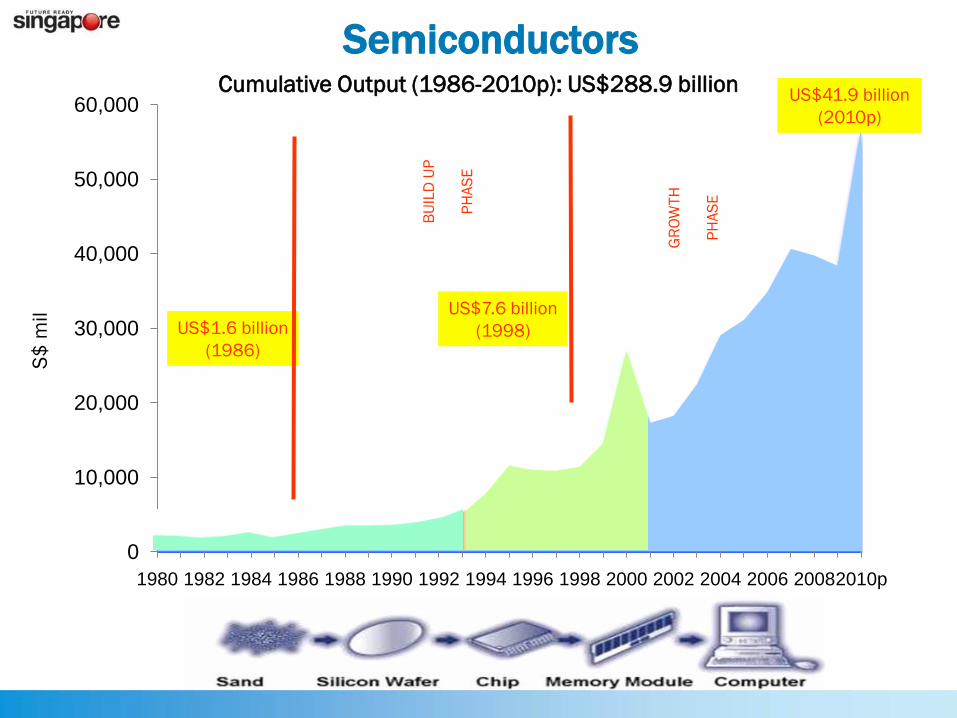
o Semi Conductors (from 1991)
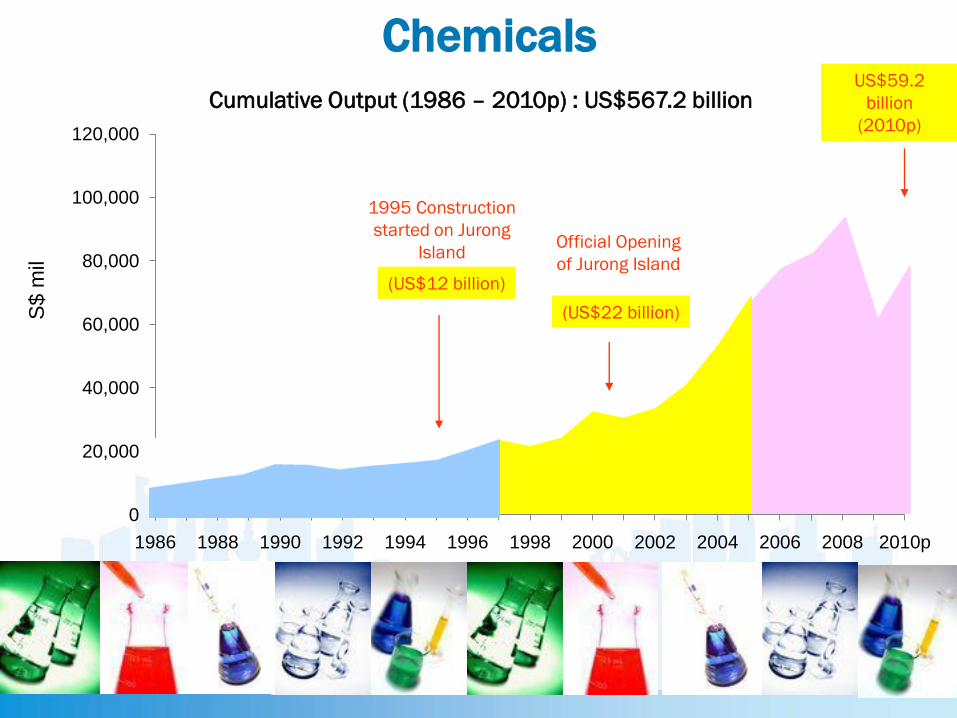
o Chemicals (from 1996)
o Biomedical Sciences (from 2001)
• Manufacturing continues to account for >20% of GDP
Manufacturing: A Key Growth Engine
US
$2
5 b
n (
19
86
)
AS
IA $
CR
ISIS
SA
RS
CR
ISIS
US
$1
50
bn
(20
09
)
S$
mil
Total Manufacturing Output
(1986-2010p)
Total Output of 4 Key Clusters
US$154bn (2010p)
20,000
40,000
60,000
80,000
100,000
120,000
1986
1988
1990
1992
1994
1996
1998
2000
2002
2004
2006
2008
2010 (
p)
Electronics Chemicals Precision Engineering Biomedical Manufacturing
Biomedical Sciences
Precision Engrg
Electronics
Chemicals
S$
mil
11
0
50,000
100,000
150,000
200,000
250,000
300,000
19
86
19
87
19
88
19
89
19
90
19
91
19
92
19
93
19
94
19
95
19
96
19
97
19
98
19
99
20
00
20
01
20
02
20
03
20
04
20
05
20
06
20
07
20
08
20
09
20
10
p
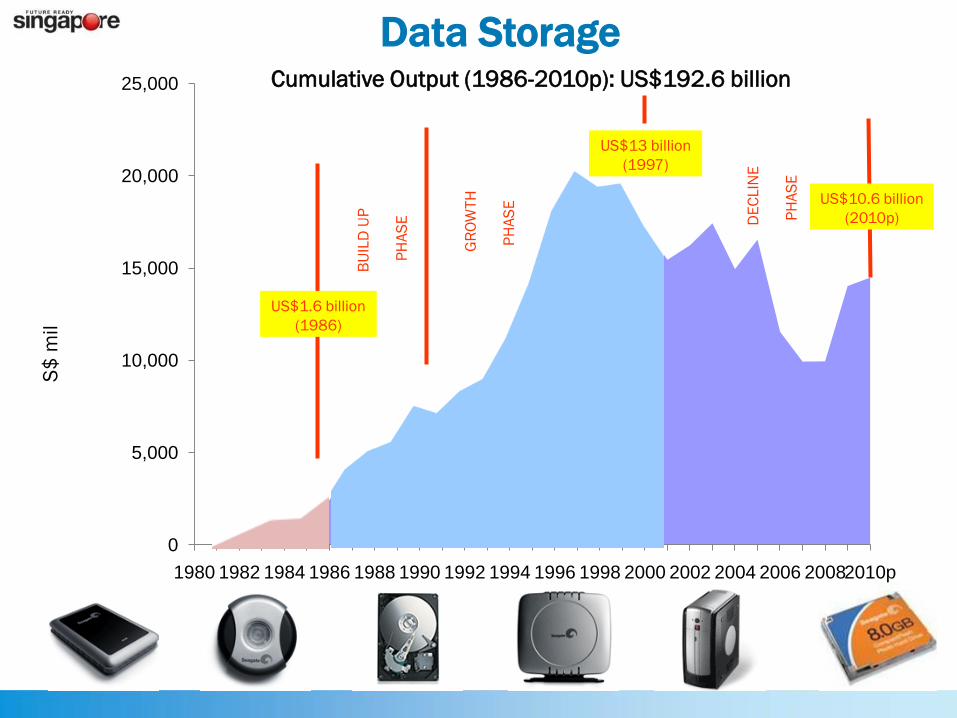
Cumulative Output (1986-2010p): US$192.6 billion
0
5,000
10,000
15,000
20,000
25,000
1980 1982 1984 1986 1988 1990 1992 1994 1996 1998 2000 2002 2004 2006 20082010p
DE
CLIN
E
PH
AS
E
US$10.6 billion
(2010p)
S$
mil
GR
OW
TH
PH
AS
E
BU
ILD
UP
PH
AS
E
US$1.6 billion
(1986)
US$13 billion
(1997)
Data Storage
0
10,000
20,000
30,000
40,000
50,000
60,000
1980 1982 1984 1986 1988 1990 1992 1994 1996 1998 2000 2002 2004 2006 20082010p
Cumulative Output (1986-2010p): US$288.9 billion
S$
mil
US$1.6 billion
(1986)
BU
ILD
UP
PH
AS
E
US$7.6 billion
(1998)
GR
OW
TH
PH
AS
E
US$41.9 billion
(2010p)
Semiconductors
5,000
10,000
15,000
20,000
25,000
30,000
1982 1984 1986 1988 1990 1992 1994 1996 1998 2000 2002 2004 2006 2008 2010p
GR
OW
T
H
PH
AS
E
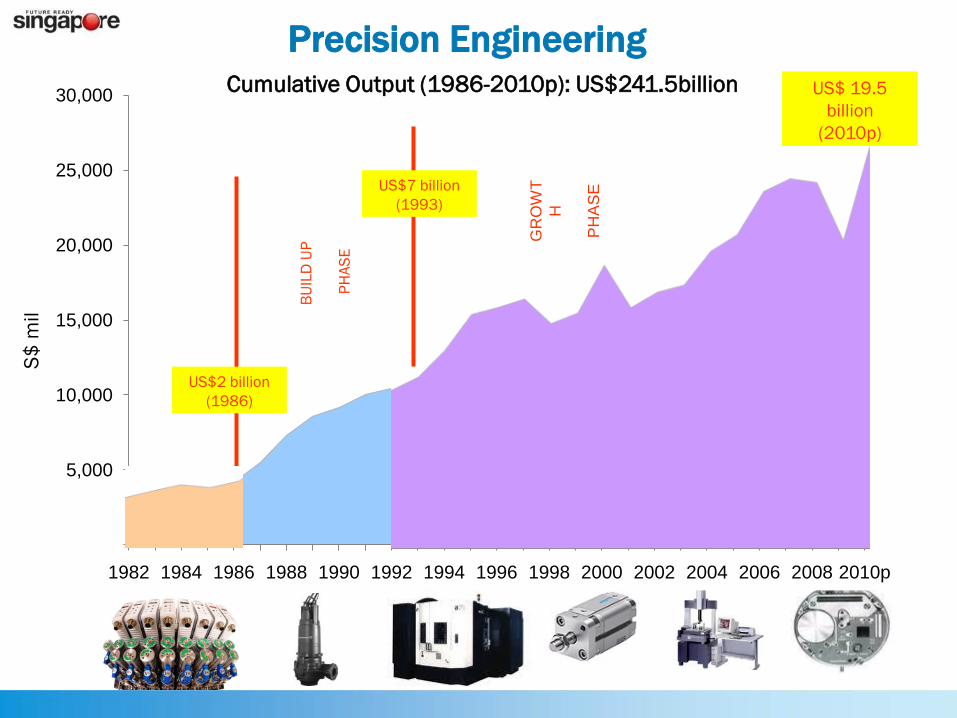
Cumulative Output (1986-2010p): US$241.5billion
US$2 billion
(1986)
BU
ILD
UP
PH
AS
E
US$7 billion
(1993)
US$ 19.5
billion
(2010p)
S$
mil
Precision Engineering
S$ m
il
0
20,000
40,000
60,000
80,000
100,000
120,000
1986 1988 1990 1992 1994 1996 1998 2000 2002 2004 2006 2008 2010p
1995 Construction
started on Jurong
Island
(US$12 billion)
Official Opening
of Jurong Island
(US$22 billion)
US$59.2
billion
(2010p)
Chemicals
Cumulative Output (1986 – 2010p) : US$567.2 billion
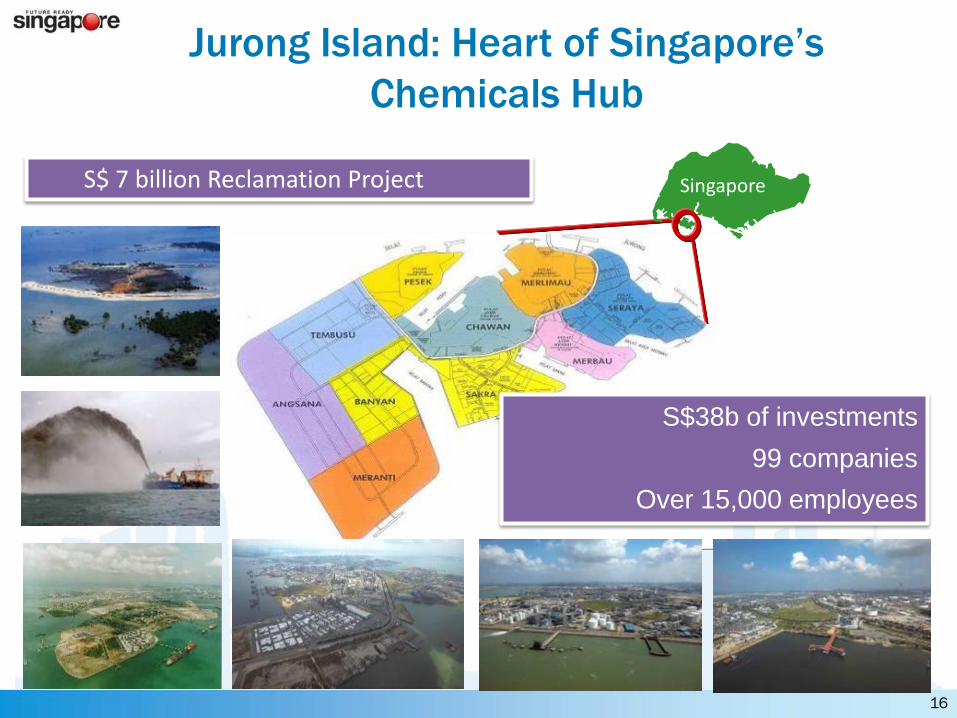
SingaporeS$ 7 billion Reclamation Project
S$38b of investments
99 companies
Over 15,000 employees
Jurong Island: Heart of Singapore’s
Chemicals Hub
16
0
5,000
10,000
15,000
20,000
25,000
30,000
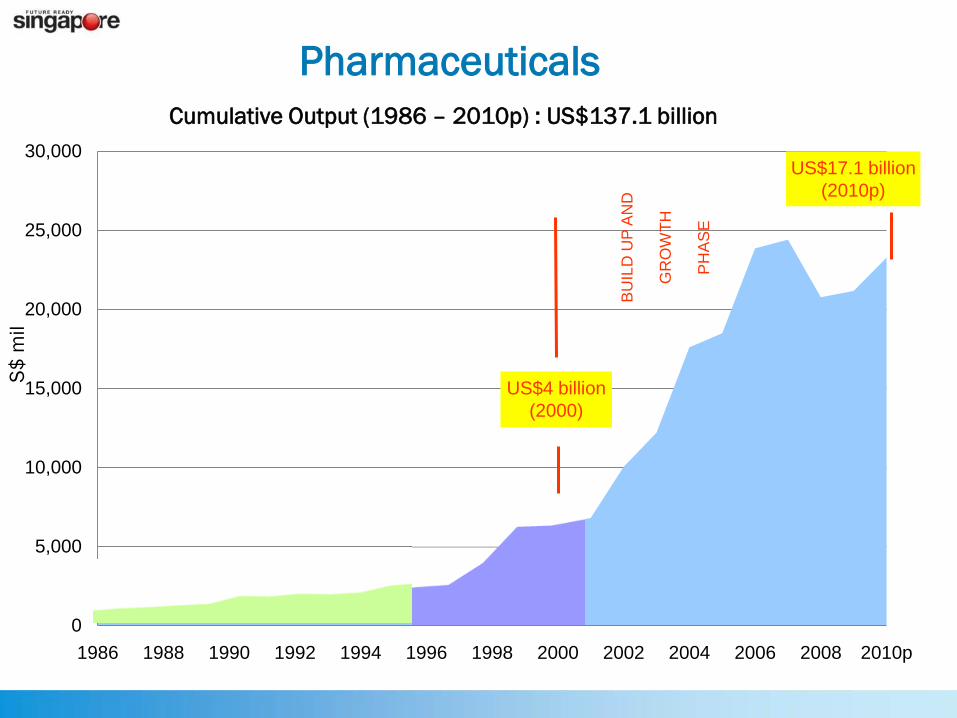
1986 1988 1990 1992 1994 1996 1998 2000 2002 2004 2006 2008 2010p
US$4 billion
(2000)
BU
ILD
UP
AN
D
GR
OW
TH
PH
AS
E
US$17.1 billion
(2010p)
Cumulative Output (1986 – 2010p) : US$137.1 billion
Pharmaceuticals
S$
mil
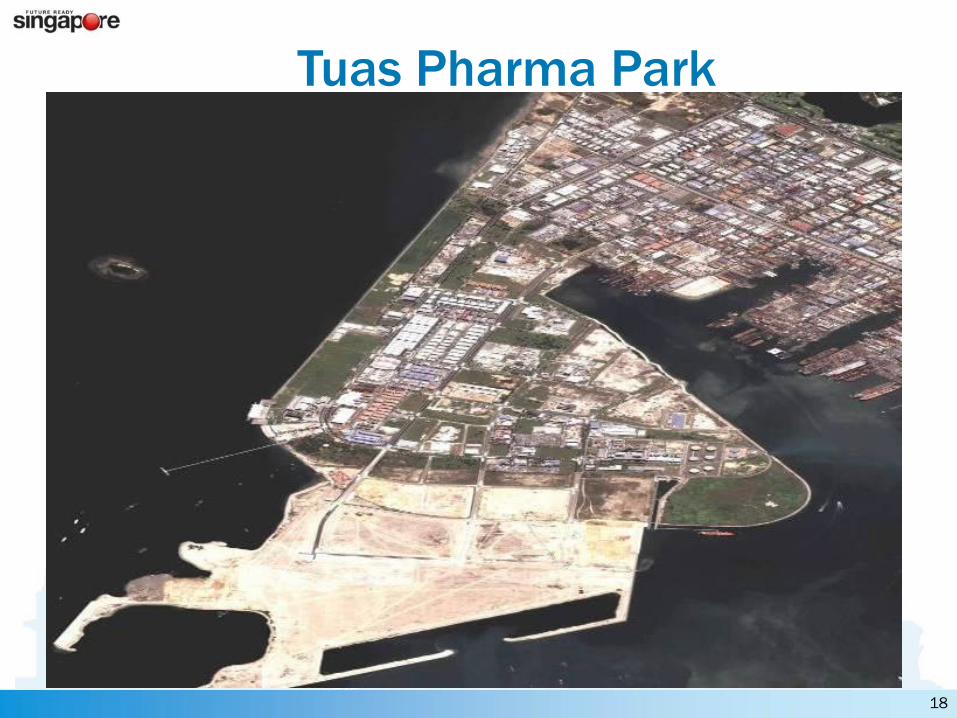
18
Tuas Pharma Park

Developing Singapore as a Global
Hub for Knowledge and Innovation
19
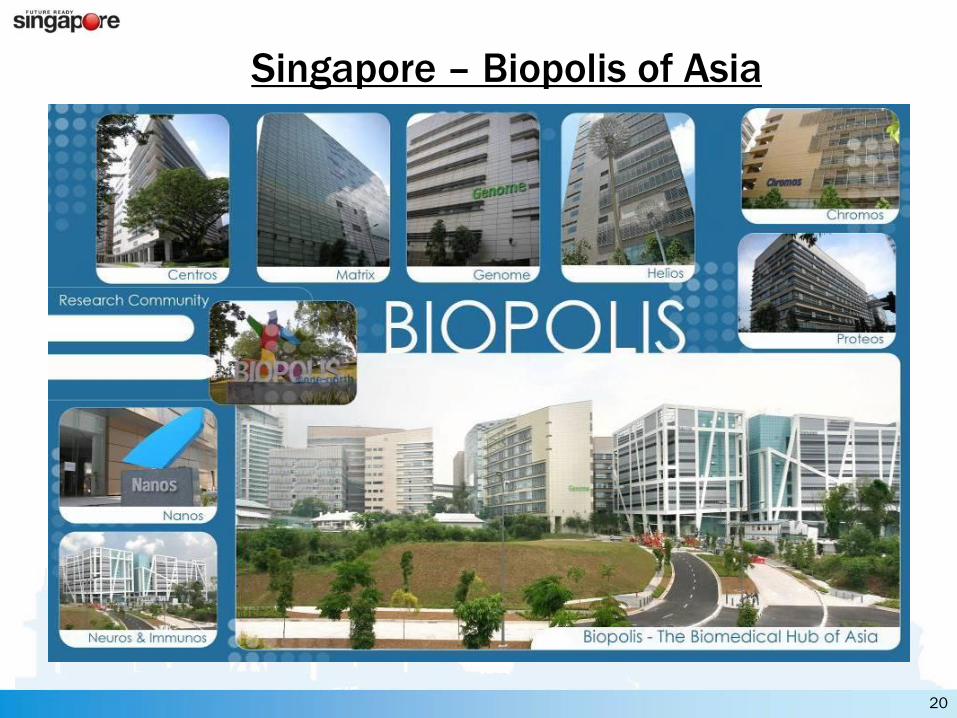
Singapore – Biopolis of Asia
20
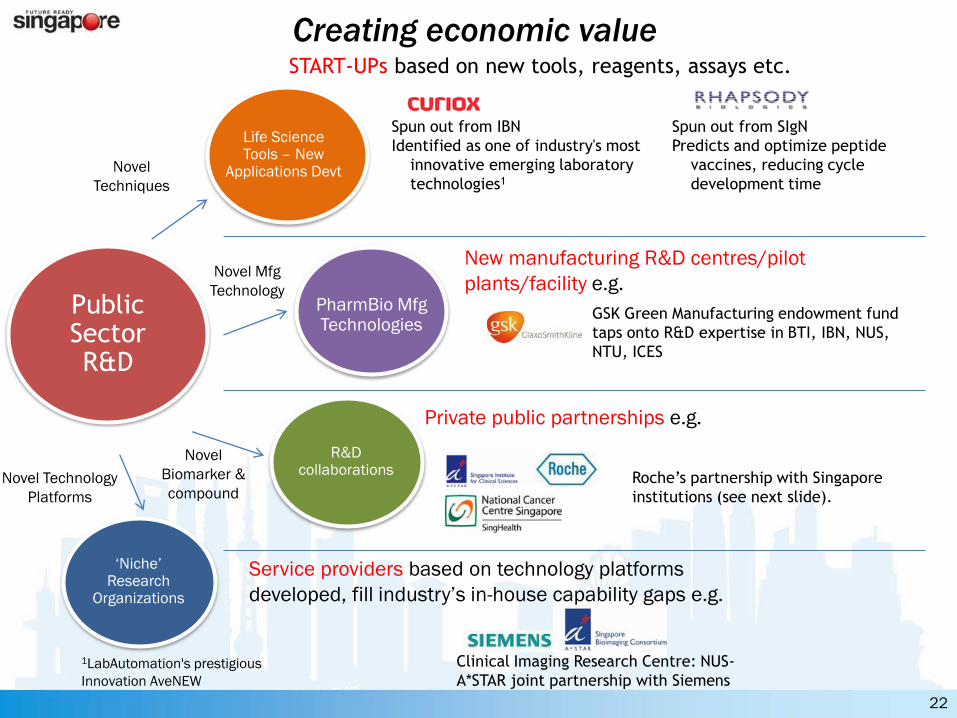
Creating economic value
22
Public Sector R&D
Novel
Techniques
Life Science Tools – New
Applications Devt
‘Niche’ Research
Organizations
Novel Technology
Platforms
New manufacturing R&D centres/pilot
plants/facility e.g. PharmBio Mfg Technologies
Novel Mfg
Technology
1LabAutomation's prestigious
Innovation AveNEW
Spun out from IBN
Identified as one of industry's most
innovative emerging laboratory
technologies1
Spun out from SIgN
Predicts and optimize peptide
vaccines, reducing cycle
development time
GSK Green Manufacturing endowment fund
taps onto R&D expertise in BTI, IBN, NUS,
NTU, ICES
Service providers based on technology platforms
developed, fill industry’s in-house capability gaps e.g.
Roche’s partnership with Singapore
institutions (see next slide).
R&D collaborations
Novel
Biomarker &
compound
START-UPs based on new tools, reagents, assays etc.
Private public partnerships e.g.
Clinical Imaging Research Centre: NUS-
A*STAR joint partnership with Siemens

Fusionopolis Facilities
Fitness Gym & Pool
Retail and F&B Podium
SharedConference Rooms
one-north MRT Station
Business andResearch Space
Skybridges and SkyGardens
Serviced Work-Live Apartments
500-seatExperimental Performance Theatre
23
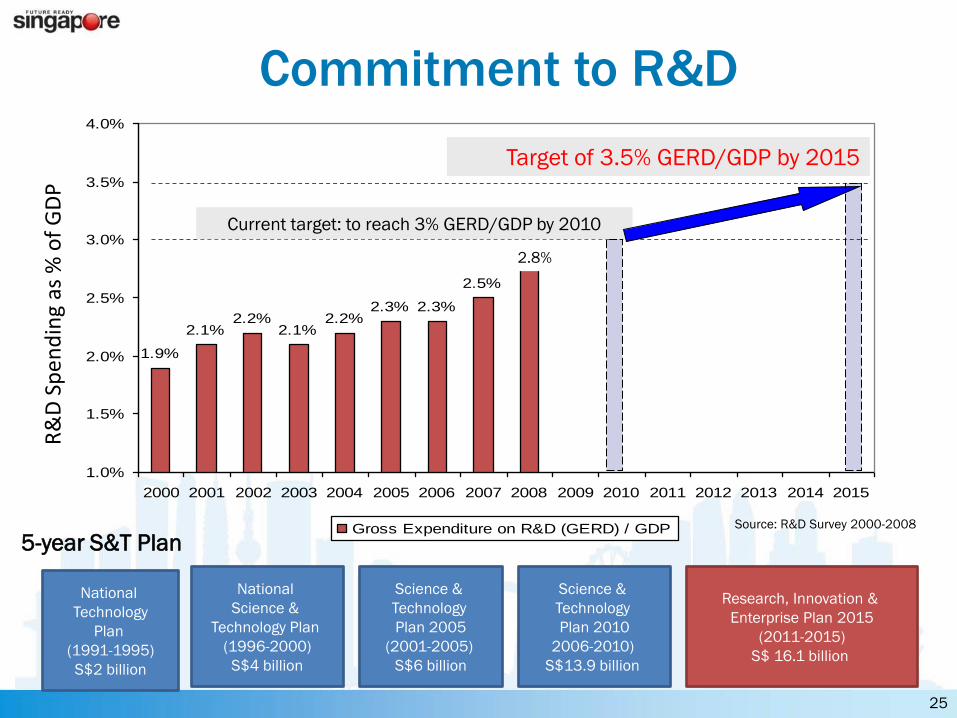
1.9%
2.1%2.2%
2.1%2.2%
2.3% 2.3%
2.5%
2.8%
1.0%
1.5%
2.0%
2.5%
3.0%
3.5%
4.0%
2000 2001 2002 2003 2004 2005 2006 2007 2008 2009 2010 2011 2012 2013 2014 2015
Gross Expenditure on R&D (GERD) / GDP Source: R&D Survey 2000-2008
R&
D S
pe
nd
ing
as %
of
GD
P
Science &
Technology
Plan 2010
2006-2010)
S$13.9 billion
Science &
Technology
Plan 2005
(2001-2005)
S$6 billion
National
Science &
Technology Plan
(1996-2000)
S$4 billion
National
Technology
Plan
(1991-1995)
S$2 billion
5-year S&T Plan
Current target: to reach 3% GERD/GDP by 2010
Research, Innovation &
Enterprise Plan 2015
(2011-2015)
S$ 16.1 billion
Target of 3.5% GERD/GDP by 2015
2.8%
Commitment to R&D
25
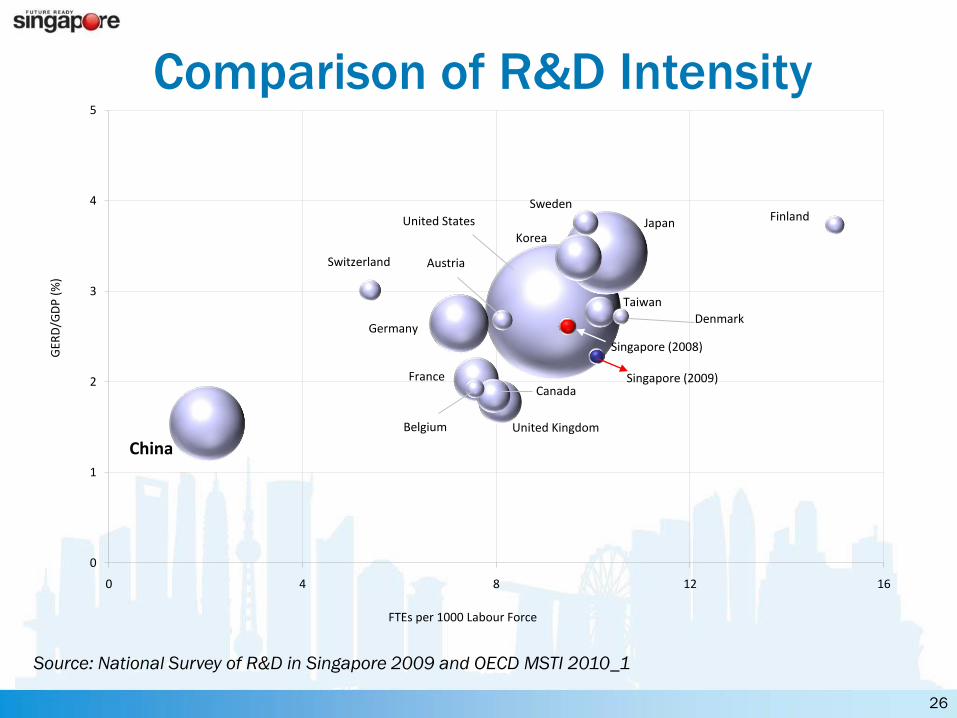
Comparison of R&D Intensity
Source: National Survey of R&D in Singapore 2009 and OECD MSTI 2010_1
United States Japan
Germany
Korea
France
United Kingdom
Canada
Taiwan
Sweden
Switzerland Austria
Belgium
Finland
Singapore (2009)
Denmark
Singapore (2008)
0
1
2
3
4
5
0 4 8 12 16
GER
D/G
DP
(%
)
FTEs per 1000 Labour Force
China
26
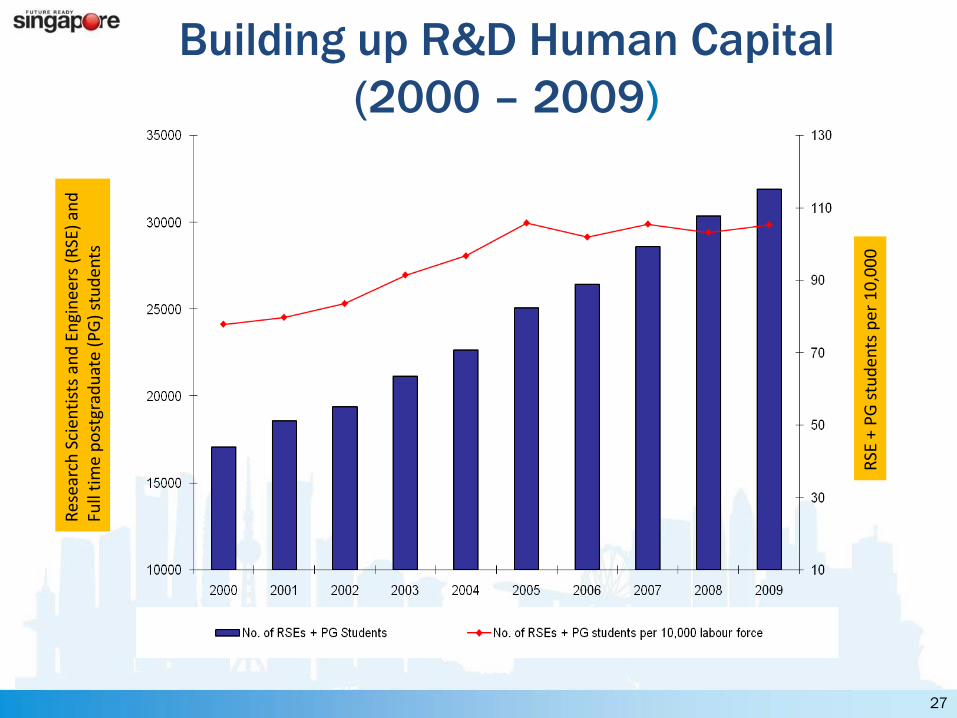
Res
earc
h S
cien
tist
s an
d E
ngi
nee
rs (
RSE
) an
dFu
ll ti
me
po
stgr
adu
ate
(PG
) st
ud
ents
RSE
+ P
G s
tud
ents
per
10
,00
0
Building up R&D Human Capital
(2000 – 2009)
27

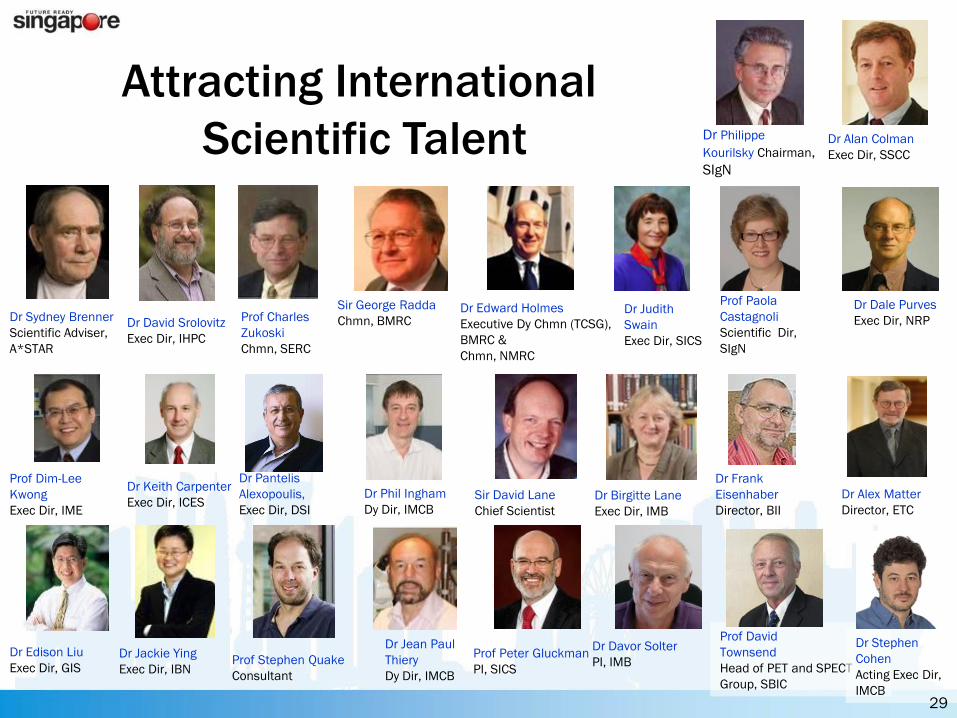
Prof David
Townsend
Head of PET and SPECT
Group, SBIC
Dr Stephen
Cohen
Acting Exec Dir,
IMCB
Attracting International
Scientific Talent
Dr Edison Liu
Exec Dir, GIS
Dr Davor Solter
PI, IMB
Sir David Lane
Chief Scientist
Dr Birgitte Lane
Exec Dir, IMB
Dr Phil Ingham
Dy Dir, IMCB
Dr Jean Paul
Thiery
Dy Dir, IMCB
Dr Edward Holmes
Executive Dy Chmn (TCSG),
BMRC &
Chmn, NMRC
Dr Judith
Swain
Exec Dir, SICS
Dr Philippe
Kourilsky Chairman,
SIgN
Prof Peter Gluckman
PI, SICS
Sir George Radda
Chmn, BMRC
Dr Jackie Ying
Exec Dir, IBN
Dr Alan Colman
Exec Dir, SSCC
Dr Dale Purves
Exec Dir, NRP
Dr Frank
Eisenhaber
Director, BII
Prof Paola
Castagnoli
Scientific Dir,
SIgN
Prof Charles
Zukoski
Chmn, SERC
Dr Sydney Brenner
Scientific Adviser,
A*STAR
Dr Keith Carpenter
Exec Dir, ICES
Prof Dim-Lee
Kwong
Exec Dir, IME
Prof Stephen Quake
Consultant
Dr David Srolovitz
Exec Dir, IHPC
Dr Alex Matter
Director, ETC
Dr Pantelis
Alexopoulis,
Exec Dir, DSI
29
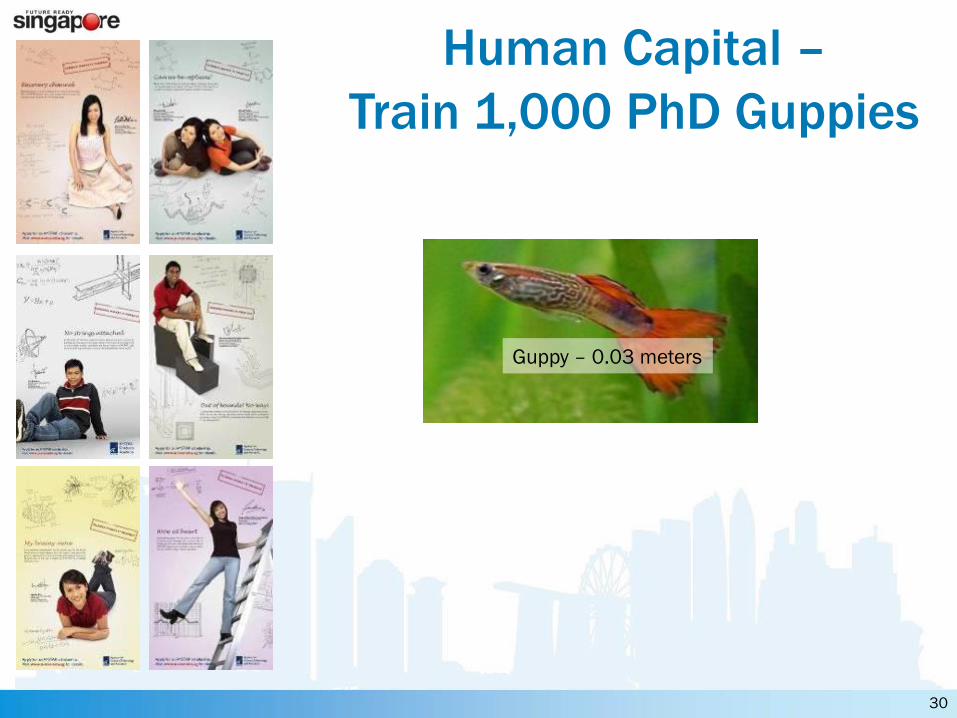
Guppy – 0.03 meters
Human Capital –
Train 1,000 PhD Guppies
30
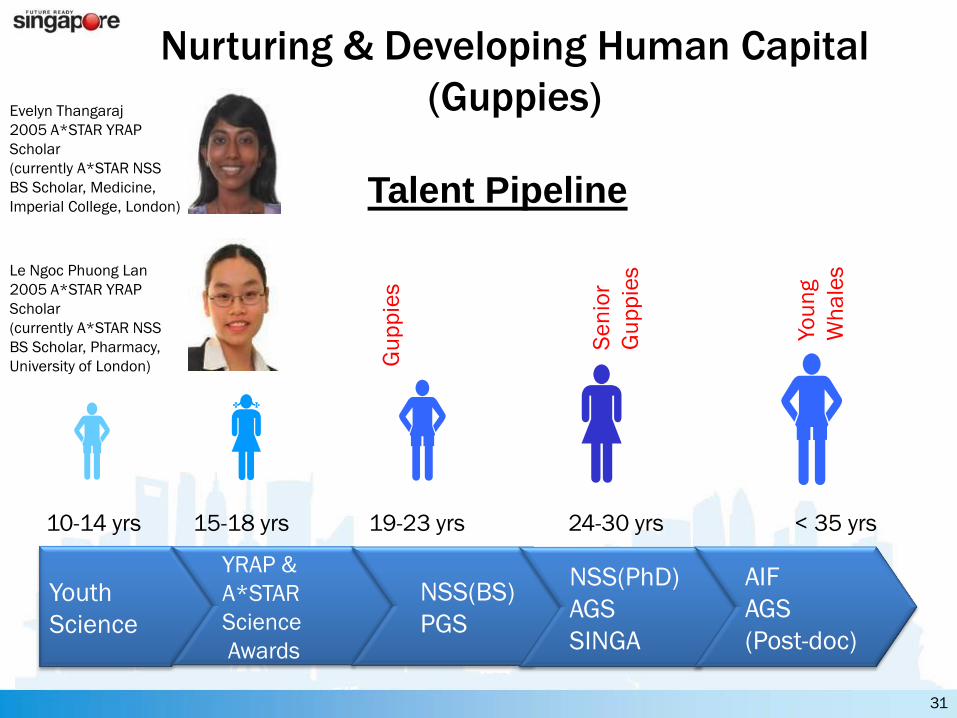
Youth
Science
YRAP &
A*STAR
Science
Awards
NSS(BS)
PGS
NSS(PhD)
AGS
SINGA
AIF
AGS
(Post-doc)
10-14 yrs < 35 yrs15-18 yrs 19-23 yrs 24-30 yrs
Talent Pipeline
Gu
pp
ies
Se
nio
r
Gu
pp
ies
Yo
un
g
Wh
ale
sLe Ngoc Phuong Lan
2005 A*STAR YRAP
Scholar
(currently A*STAR NSS
BS Scholar, Pharmacy,
University of London)
Evelyn Thangaraj
2005 A*STAR YRAP
Scholar
(currently A*STAR NSS
BS Scholar, Medicine,
Imperial College, London)
Nurturing & Developing Human Capital
(Guppies)
31

MIT
Physics
(Malaysia)
Stanford
Chemical Engineering
(Shanghai)
MIT
Bio Engineering
(Hong Kong)
Stanford
Computer Science
(India)
MIT
Chemical Engineering
(Vietnam)
Human Capital: International Guppies
32
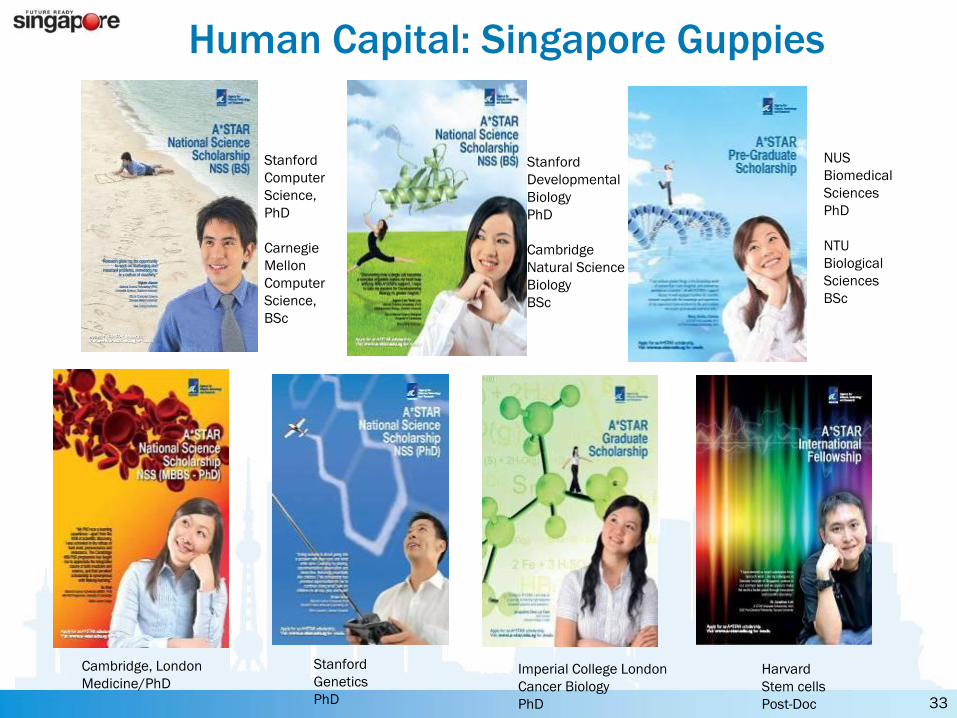
Harvard
Stem cells
Post-Doc
Stanford
Computer
Science,
PhD
Carnegie
Mellon
Computer
Science,
BSc
Stanford
Developmental
Biology
PhD
Cambridge
Natural Science
Biology
BSc
Cambridge, London
Medicine/PhD
Stanford
Genetics
PhD
Imperial College London
Cancer Biology
PhD
NUS
Biomedical
Sciences
PhD
NTU
Biological
Sciences
BSc
Human Capital: Singapore Guppies
33
Singapore as a Financial
Centre for the Region
34
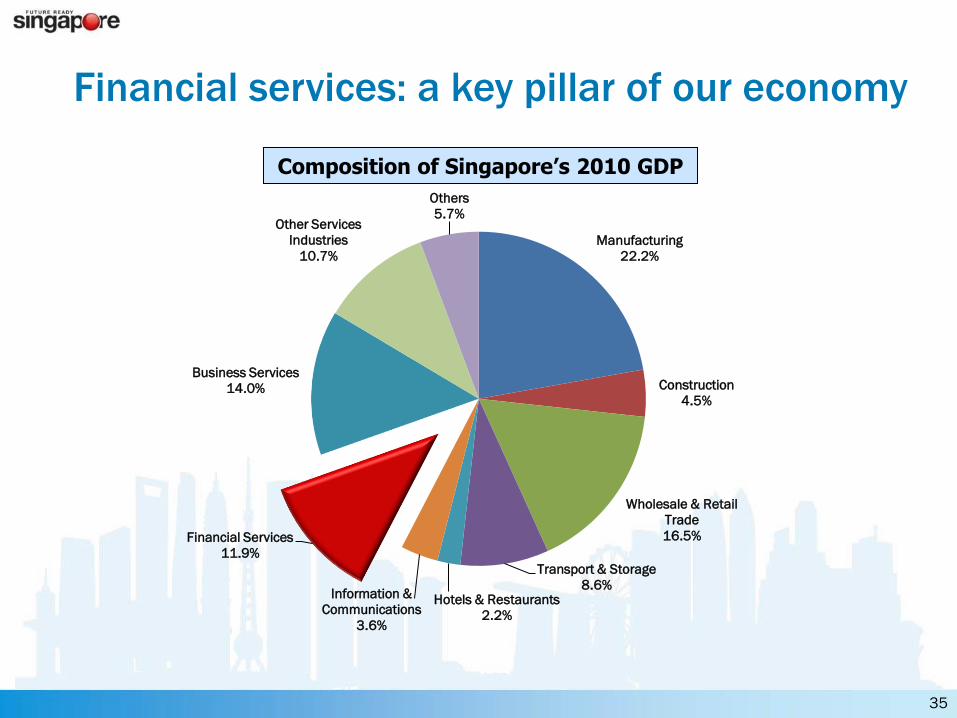
Financial services: a key pillar of our economy
35
Composition of Singapore’s 2010 GDP
Manufacturing
22.2%
Construction
4.5%
Wholesale & Retail
Trade
16.5%
Transport & Storage
8.6%Hotels & Restaurants
2.2%
Information &
Communications
3.6%
Financial Services
11.9%
Business Services
14.0%
Other Services
Industries
10.7%
Others
5.7%
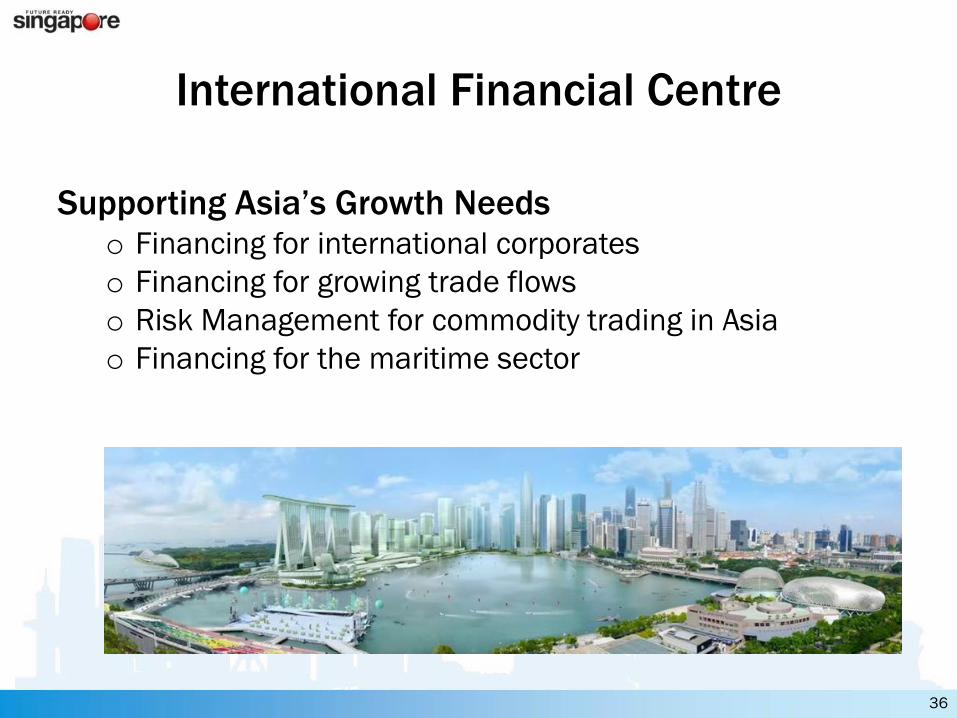
International Financial Centre
Supporting Asia’s Growth Needso Financing for international corporates
o Financing for growing trade flows
o Risk Management for commodity trading in Asia
o Financing for the maritime sector
36
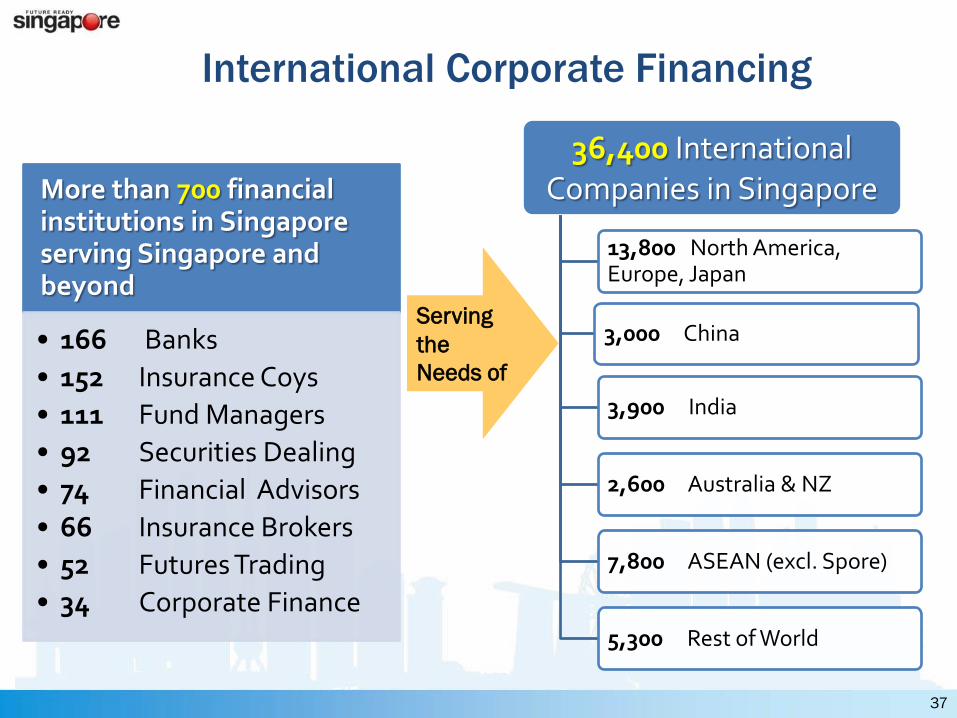
International Corporate Financing
37
Serving
the
Needs of
36,400 InternationalCompanies in Singapore
13,800 North America, Europe, Japan
3,000 China
3,900 India
2,600 Australia & NZ
7,800 ASEAN (excl. Spore)
5,300 Rest of World
More than 700 financial institutions in Singapore serving Singapore and beyond
• 166 Banks
• 152 Insurance Coys
• 111 Fund Managers
• 92 Securities Dealing
• 74 Financial Advisors
• 66 Insurance Brokers
• 52 Futures Trading
• 34 Corporate Finance

38
Source – MAS (assuming SGD/USD of 1.3)
Regional Loan Financing Centre
Total loans extended by Singapore-based banks have tripled over the last 20 years. 2/3 of that is dominated in foreign currencies.
0
200,000
400,000
600,000
800,000
1,000,000
1,200,000
1989 1990 1991 1992 1993 1994 1995 1996 1997 1998 1999 2000 2001 2002 2003 2004 2005 2006 2007 2008 2009 2010
Tota
l lo
an
s (
US
D)
Millio
n

Regional Corporate Treasury & Cash Management Hub
Corporate Treasuries - Demand for Products to Hedge Financial (such as Currency, Interest Rate) Risks
Largest FX and OTC derivatives market
in Asia ex-Japanwith average daily turnover of
> US$300bn
Source: MAS
Leading FX teams in Singapore
39
40
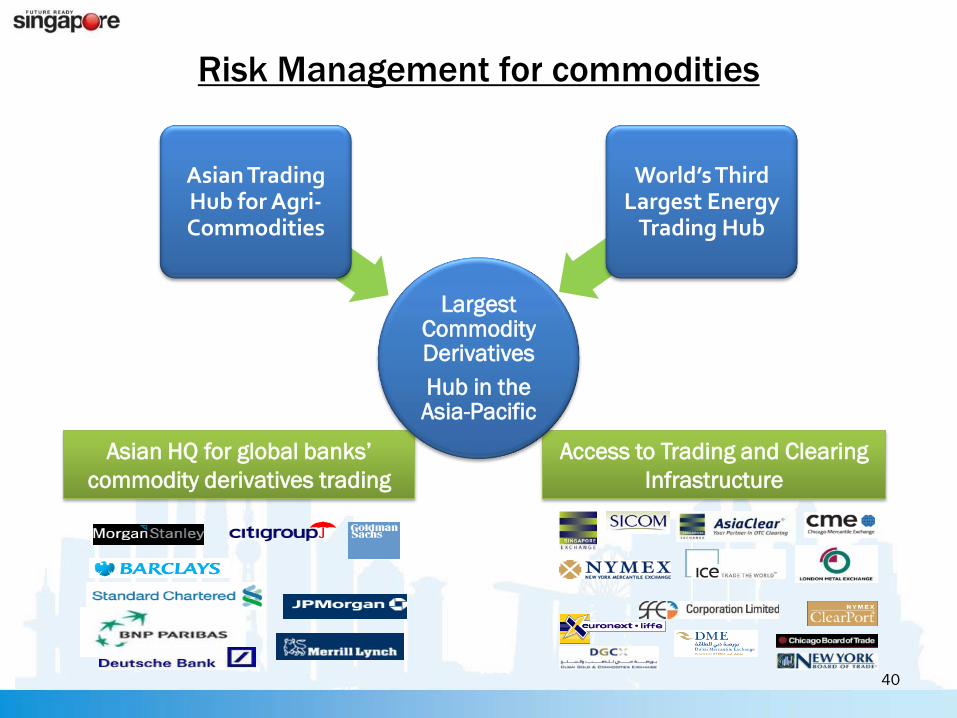
Risk Management for commodities
Asian HQ for global banks’
commodity derivatives trading
Access to Trading and Clearing
Infrastructure
Largest Commodity Derivatives
Hub in the Asia-Pacific
Asian Trading Hub for Agri-Commodities
World’s Third Largest Energy
Trading Hub

Financing Trade Flows
Source: Global Insight, WTO, Oliver Wyman
US$ BN2008 ► 2020(CAGR)1
North America South and Central America Europe Africa Asia
3,702
► 10,763
(9%)
4,479
► 7,171
(4%)
616
► 829
(3%)
1378 ► 2,475
(5%)
998 ► 2.247
(7%)
134 ► 448
(11%)
864 ►1,306
(4%)
204 ► 1,159
(16%)
184 ► 608
(11%)
137 ► 1,574
(23%)
Leading Trade
Finance teams
Growing Trade Flows
41
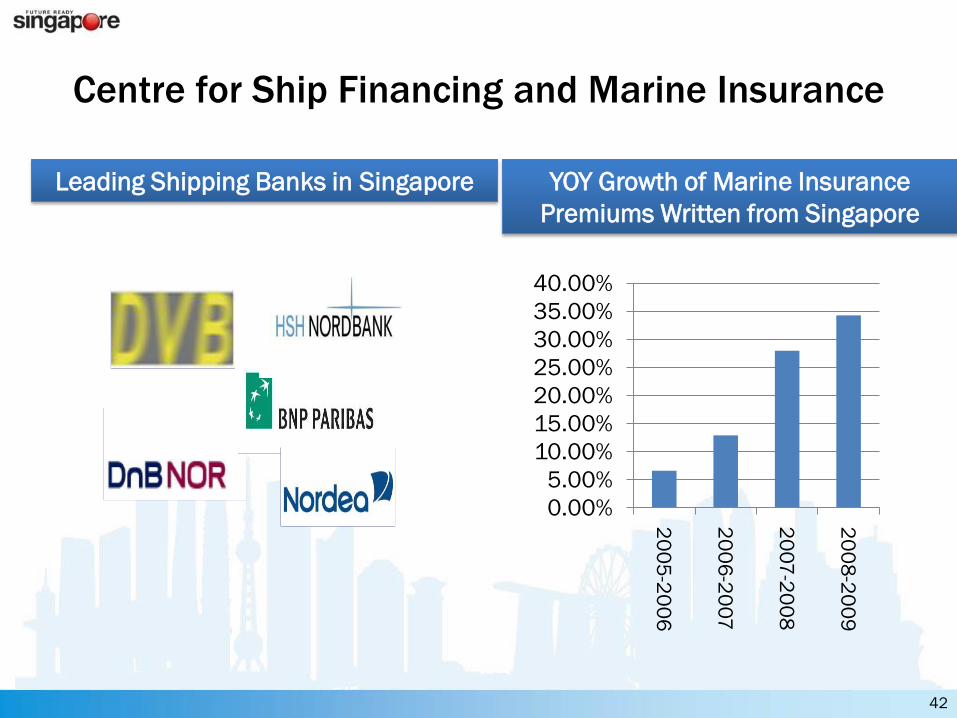
Centre for Ship Financing and Marine Insurance
Leading Shipping Banks in Singapore YOY Growth of Marine Insurance
Premiums Written from Singapore
0.00%
5.00%
10.00%
15.00%
20.00%
25.00%
30.00%
35.00%
40.00%2
00
5-2
00
6
20
06
-20
07
20
07
-20
08
20
08
-20
09
42

Singapore As a Global City
43
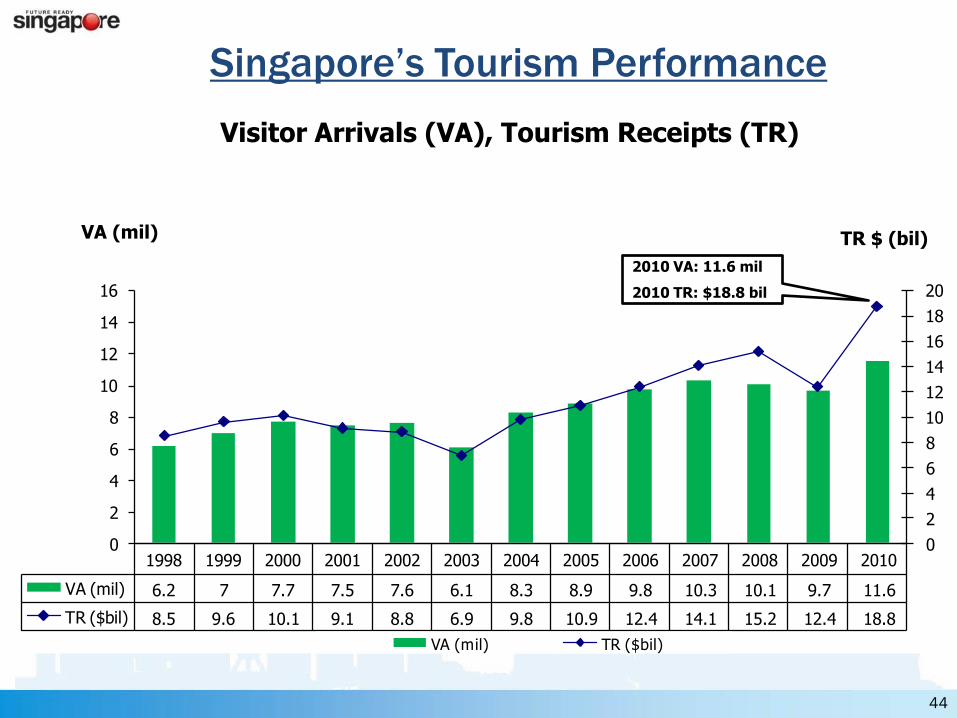
Visitor Arrivals (VA), Tourism Receipts (TR)
1998 1999 2000 2001 2002 2003 2004 2005 2006 2007 2008 2009 2010
VA (mil) 6.2 7 7.7 7.5 7.6 6.1 8.3 8.9 9.8 10.3 10.1 9.7 11.6
TR ($bil) 8.5 9.6 10.1 9.1 8.8 6.9 9.8 10.9 12.4 14.1 15.2 12.4 18.8
0
2
4
6
8
10
12
14
16
18
20
0
2
4
6
8
10
12
14
16
VA (mil) TR ($bil)
VA (mil) TR $ (bil)
Singapore’s Tourism Performance
2010 VA: 11.6 mil
2010 TR: $18.8 bil
44
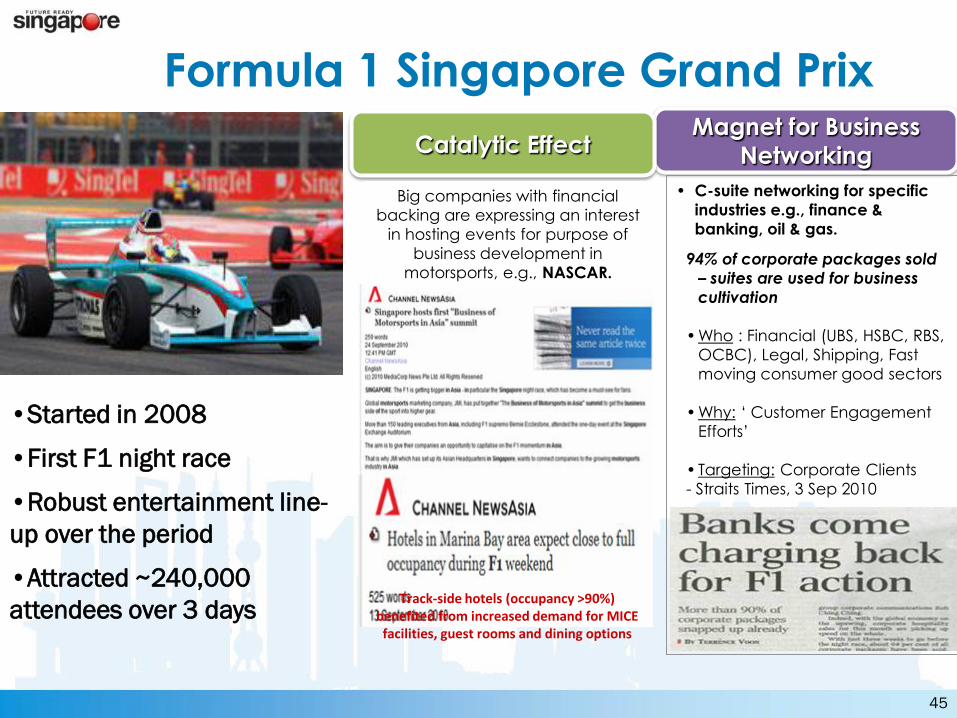
•Started in 2008
•First F1 night race
•Robust entertainment line-
up over the period
•Attracted ~240,000
attendees over 3 days
Formula 1 Singapore Grand PrixMagnet for Business
Networking
• C-suite networking for specific
industries e.g., finance &
banking, oil & gas.
94% of corporate packages sold
– suites are used for business
cultivation
• Who : Financial (UBS, HSBC, RBS,
OCBC), Legal, Shipping, Fast
moving consumer good sectors
• Why: ‘ Customer Engagement
Efforts’
• Targeting: Corporate Clients
- Straits Times, 3 Sep 2010
Catalytic Effect
Big companies with financial
backing are expressing an interest
in hosting events for purpose of
business development in
motorsports, e.g., NASCAR.
Track-side hotels (occupancy >90%) benefited from increased demand for MICE facilities, guest rooms and dining options
45
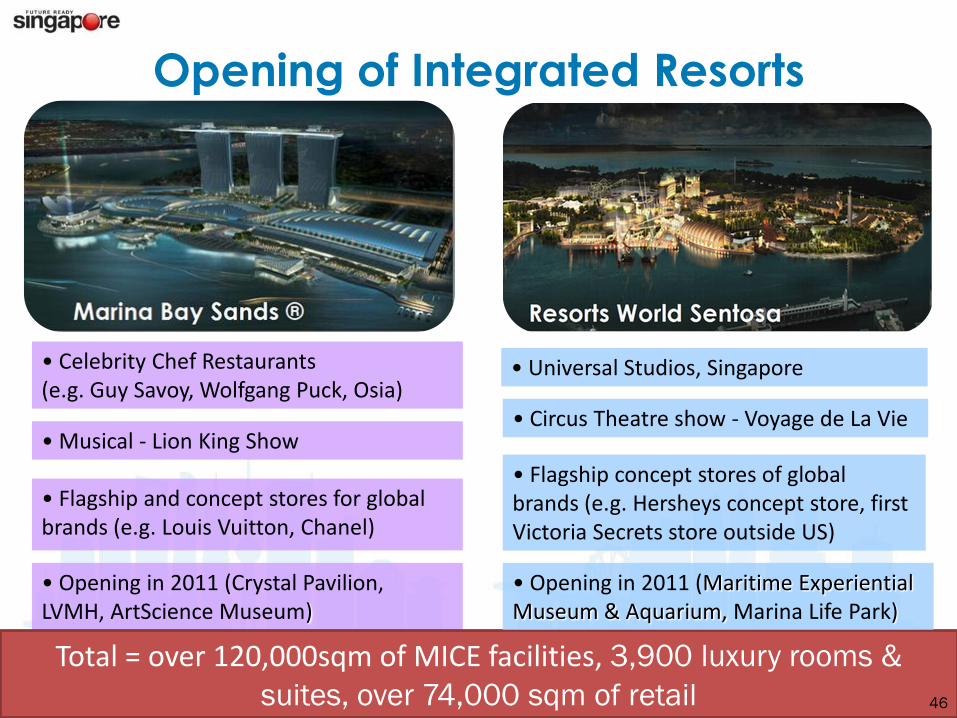
Opening of Integrated Resorts
• Celebrity Chef Restaurants (e.g. Guy Savoy, Wolfgang Puck, Osia)
• Universal Studios, Singapore
• Musical - Lion King Show • Circus Theatre show - Voyage de La Vie
• Opening in 2011 (Crystal Pavilion, LVMH, ArtScience Museum)
Total = over 120,000sqm of MICE facilities, 3,900 luxury rooms &
suites, over 74,000 sqm of retail
• Flagship and concept stores for global brands (e.g. Louis Vuitton, Chanel)
• Opening in 2011 (Maritime Experiential Museum & Aquarium, Marina Life Park)
• Flagship concept stores of global brands (e.g. Hersheys concept store, first Victoria Secrets store outside US)
46

Sharing Singapore’s Experience
in Urban Solutions
47
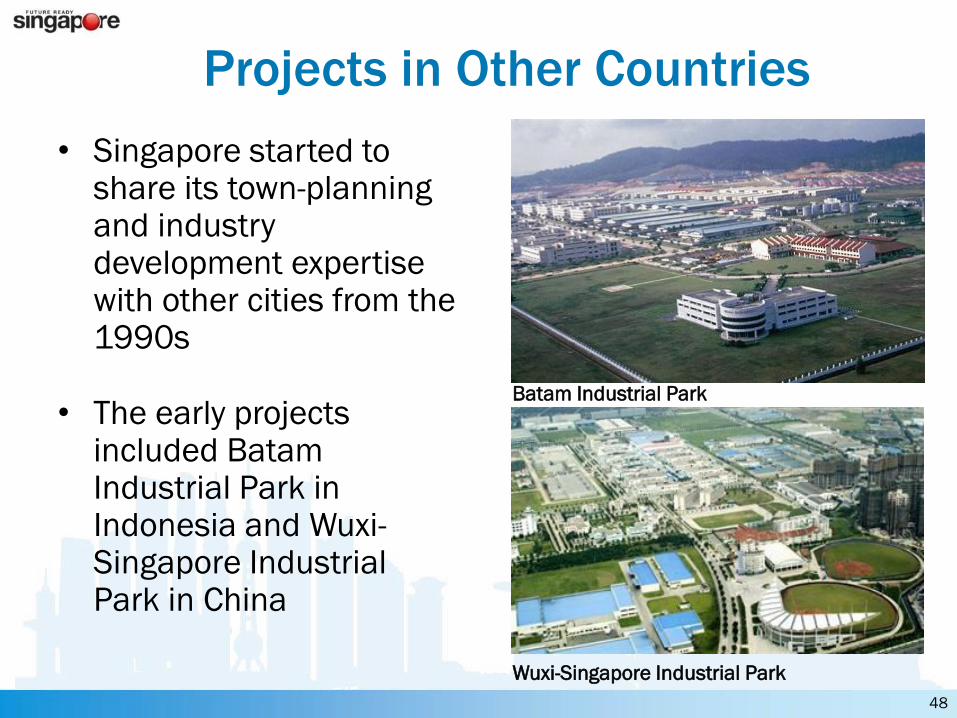
• Singapore started to share its town-planning and industry development expertise with other cities from the 1990s
• The early projects included BatamIndustrial Park in Indonesia and Wuxi-Singapore Industrial Park in China
Projects in Other Countries
48
Batam Industrial Park
Wuxi-Singapore Industrial Park
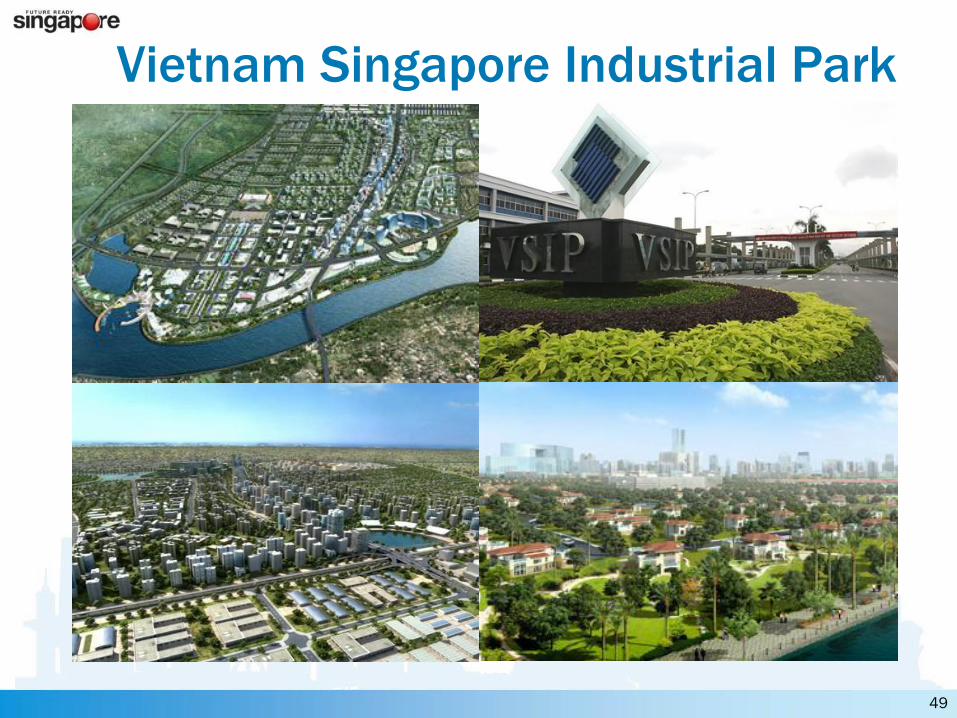
Vietnam Singapore Industrial Park
49
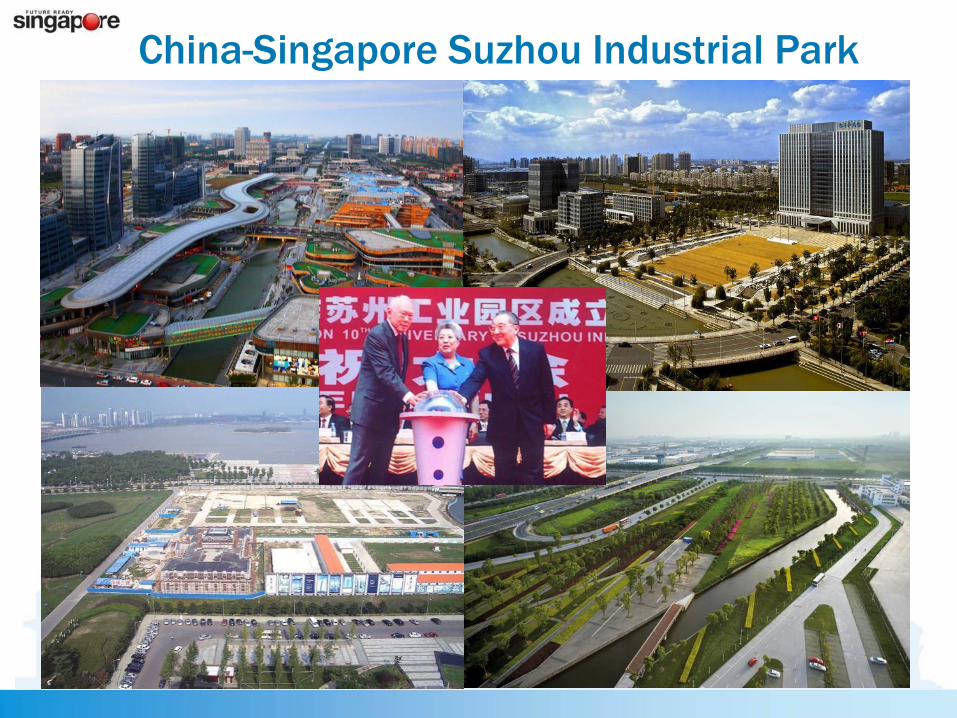
China-Singapore Suzhou Industrial Park
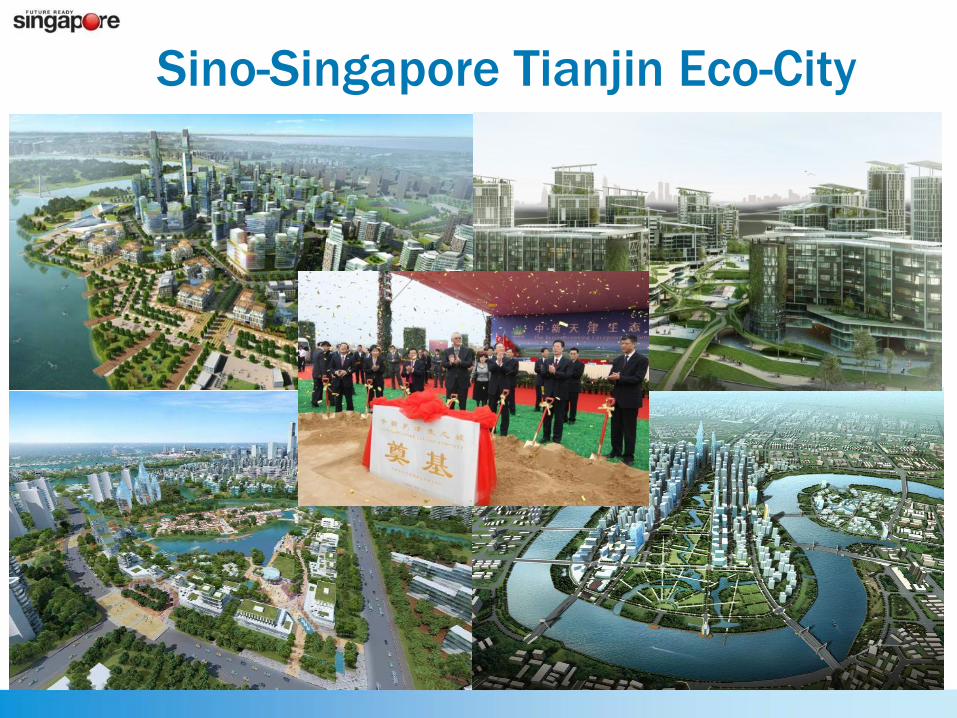
Sino-Singapore Tianjin Eco-City

Bangalore International Technology Park

Key Challenges for Singapore
• Face Global Competition
• Compact and dense urban setting
• Ensuring Economic Competitiveness
• Nurture an Enterprising culture with:
- Passion (Risk taking)
- Determination (Hard work)
- Vision (Global)
- Focus (Operational)
53
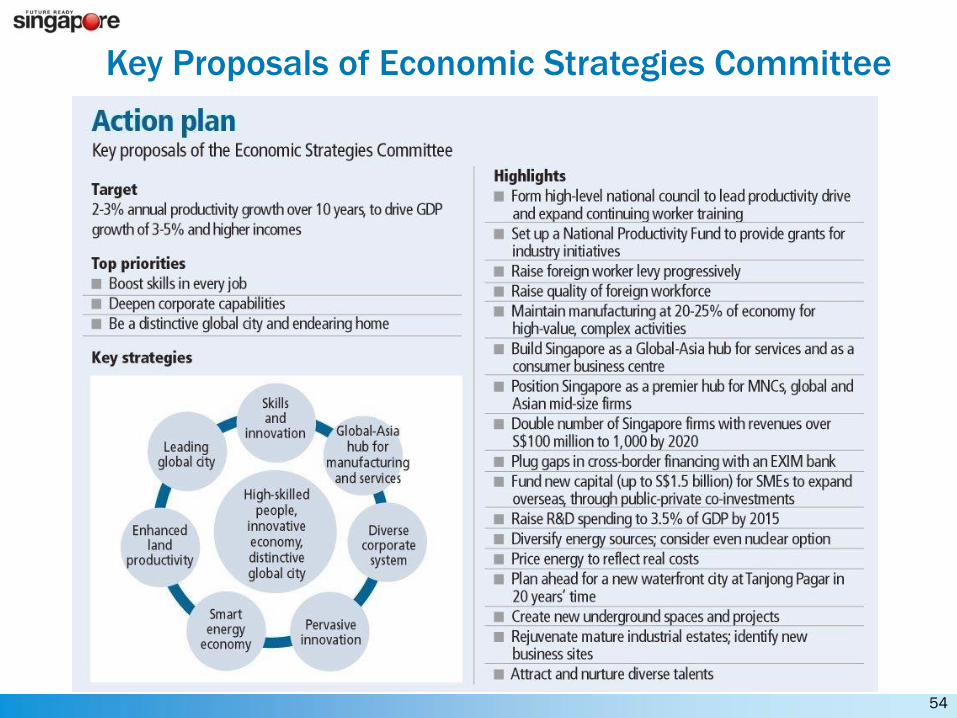
Key Proposals of Economic Strategies Committee
54

• Doubling the National Productivity Fund to S$2 bn (~US$ 1.54 bn)
• Enhanced Productivity and Innovation Credit -- 400% tax deduction for productivity and innovation expenditure , capped at $400,000 for each category
• Further Increases in Foreign Worker Levy, by between $60 and $200
Budget 2011 - Boosting Skills and Productivity
55