singapore company focus silverlake axis 03jan19_ic.pdf · swot analysis . strengths weakness...
TRANSCRIPT

ed: CK / sa: DT, JC, CW, CS
BUY(Re-initiating Coverage)
Last Traded Price ( 2 Jan 2019): S$0.41 (STI : 3,038.89) Price Target 12-mth: S$0.60 (45% upside)
Potential Catalyst: More contract wins; higher dividend payout
Analyst Lee Keng LING +65 6682 3703 [email protected]
Price Relative
Forecasts and Valuation FY Jun (RMm) 2018A 2019F 2020F 2021F Revenue 542 677 734 766 EBITDA 167 245 273 294 Pre-tax Profit 147 225 253 274 Net Profit 134 205 230 249 Net Pft (Pre Ex.) 134 205 230 249 EPS (S cts) 1.64 2.50 2.82 3.04 EPS Pre Ex. (S cts) 1.64 2.50 2.82 3.04 EPS Gth (%) (84) 53 12 8 EPS Gth Pre Ex (%) (84) 53 12 8 Diluted EPS (S cts) 1.64 2.50 2.82 3.04 Net DPS (S cts) 2.87 2.00 2.25 2.43 BV Per Share (S cts) 6.40 6.68 7.31 7.96 PE (X) 25.1 16.4 14.6 13.5 PE Pre Ex. (X) 25.1 16.4 14.6 13.5 P/Cash Flow (X) 23.2 24.3 14.1 12.8 EV/EBITDA (X) 17.3 12.0 10.6 9.6 Net Div Yield (%) 7.0 4.9 5.5 5.9 P/Book Value (X) 6.4 6.2 5.6 5.2 Net Debt/Equity (X) CASH CASH CASH CASH ROAE (%) 16.0 38.3 40.3 39.8
Consensus EPS (S cts): 2.6 2.9 3.0 Other Broker Recs: B: 2 S: 0 H: 0
ICB Industry : Technology ICB Sector: Software & Computer Services Principal Business: Silverlake Axis provides customized software solutions for the Banking, Insurance, Payments, Retail and Logistics industries.
Source of all data on this page: Company, DBS Bank, Bloomberg Finance L.P.
At A Glance Issued Capital (m shrs) 2,649 Mkt. Cap (S$m/US$m) 1,086 / 799 Major Shareholders (%) Peng Ooi Goh 66.4 Ntasian Discovery Master Fund 5.0
Free Float (%) 28.6 3m Avg. Daily Val (US$m) 0.27
DBS Group Research . Equity
3 Jan 2019
Singapore Company Focus
Silverlake Axis Bloomberg: SILV SP | Reuters: SLVX.SI Refer to important disclosures at the end of this report
Fintech accelerator• Leveraging on market leader position to ride on the
Fintech wave
• Turnaround in sight, with growing project orderbook
• High recurring revenue; high margins
• Re-initiate with BUY and TP of S$0.60
Digital economy solutions provider. Silverlake Axis’ (SAL) core banking system platform is used by the top three of the five largest ASEAN financial institutions – CIMB Bank, OCBC Bank and UOB. Over 40% of the top 20 largest banks in South-East Asia that outsourced their core banking solutions run on SAL’s core banking solutions. Its Merimen insurance platform is Asia’s top insurance software-as-a-service (SaaS) company and ranked among the global top 10 in terms of claims processing and management solutions.
Turnaround in sight – growing project orderbook. Orderbook has improved significantly from the <RM50m secured in FY17 to about RM380m currently, with potential for more orders. Silverlake can leverage on its market leader position to secure more contracts as financial institutions upgrade/enhance their systems to avoid being rendered obsolete by the rising Fintech trend. In the past, the peak of contract wins could reach RM500m to RM600m per year. An upcycle typically last for about four to six years while a downcycle is about two years. We are at the beginning of an upcycle now, based on the contracts secured.
High recurring revenue; high margins. Recurring revenue, mainly from software maintenance and enhancement services and insurance processing, accounts for a substantial part, close to 60% of total revenue in the last few years. Gross margins over the FY10-FY18 period were relatively high, coming in at about 60%. We expect this trend to continue, supported by the growing higher-margin software licensing business. Valuation: Re-initiate with BUY and TP of S$0.60. We re-initiate coverage on SAL with a BUY recommendation and TP of S$0.60. Our TP is derived from peers’ average of 21x FY19F PE, based on SAL’s FY Jun 20F earnings, which translates to a potential upside of 45% from the current price. Dividend yield is attractive at c.5%. Key Risks to Our View: Slowdown in IT spending which could lead to lower orderbook; concerns on corporate governance issues.
37
57
77
97
117
137
157
177
197
217
0.4
0.5
0.6
0.7
0.8
0.9
1.0
1.1
1.2
1.3
Jan-15 Jan-16 Jan-17 Jan-18 Jan-19
Relative IndexS$
Silverlake Axis (LHS) Relative STI (RHS)

Page 2
Company Focus
Silverlake Axis
SWOT Analysis
Strengths Weakness • Leader in digital economy solutions providerOver 40% of the top 20 largest banks in South East Asia thatoutsourced their core banking solutions use SAL’s enterprisefinancial technology solutions and services.
• Leader in insurance platformMerimen is Asia’s top insurance software-as-a-service (SaaS)company and ranked among the global top 10 in terms ofclaims processing and management solutions.
• High recurring revenue; high marginsRecurring revenue, mainly from software maintenance andenhancement services and insurance processing, accounts fora substantial part, close to 60% of total revenue over theFY10-FY18 period. Gross margins came in at a high of 60%during the same period. We expect this trend to continue,supported by the growing higher-margin software licensingbusiness.
• Attractive yields; potentially higher dividendsHealthy dividend payout of at least 40% in the past fewyears, supported by healthy net cash level, with potential forhigher dividends, especially if the remaining stake in GIT issold.
• Slowdown in IT spending which could lead to lowerorderbookA slowdown in this industry would lead to financialinstitutions cutting back on their spending on IT.
• Exposure mainly in AsiaMore than 90% of the total revenue is generated fromAsia.
Opportunities Threats • Leveraging on market leader position to ride on the FintechwaveFinancial institutions are going through enhancements toavoid being rendered obsolete by the rising Fintech trend.
• Increasing financial institutions’ capital expenditureTechnology spending by Asian financial institutions andcorporations has shown an improvement in FY18 withincreased targeted expenditure on scalable andtransformative technologies.
• Turnaround in sight; growing project orderbookOrderbook has improved significantly from the <RM50msecured in FY17 to about RM380m currently, with potentialfor more orders.
• M&A to strengthen SAL as Fintech innovation acceleratorSAL has been on a constant lookout for acquisition targets tostrengthen its role as a leading digital economy solutionscompany and to be a leading Fintech company.
• Concerns on corporate governance issuesInterested party transactions with Mr Goh’s privatecompanies over the past few years have raised concerns oncorporate governance.
• Dependent on highly skilled technology professionalsAbout 80% of the total 1,700 employees are from thetechnology team. A high attrition rate and large-scalemovements in the employee base could affect projectcontinuity.
Source: DBS Bank
Page 3
Company Focus
Silverlake Axis
Company Background
Digital economy solutions provider. Silverlake Axis (SAL) is a leading provider of Digital Economy Solutions and Services to major organisations in Banking, Insurance, Payments, Retail and Logistics industries. Founded in 1989 and listed on the Singapore Stock Exchange in 2003, SAL has built a track record of successful core banking implementations, providing services to over 300 customers to address the growing demand for transformational digital banking and insurance offerings from its customers.
Four key segments. SAL’s group structure is divided into four segments – Banking, Insurance, Other Financial Services & Retail, and Investment. SAL has more than 10 entities under the three core business segments, with the bulk in the Banking division.
Banking: The core system platform is used by the top three of the five largest ASEAN financial institutions – CIMB Bank, OCBC Bank and UOB. Over 40% of the top 20 largest banks in South-East Asia that outsourced their core banking solutions use SAL’s enterprise financial technology solutions and services.
SAL has presence in South East Asia, Australia, China, Europe, Japan, the Middle East, New Zealand and South Asia, for the Banking segment.
Insurance: For the Insurance division, its primary markets are Malaysia, Singapore and Indonesia, with growing markets in Thailand, the Philippines, Vietnam and Hong Kong. Over 125 insurers, 5,000 automobile, 25 major automobile brands and
2,000 insurance intermediaries use SAL’s insurance platform, Merimen. In Malaysia and Singapore, all insurers use Merimen. Merimen is now an Insurtech market leader in providing collaborative and information exchange platform for the insurance industry. It helps to improve operational efficiency and also to identify suspicious cases, thus reducing invalid claims paid.
Other Financial Services & Retail: SAL also has over 20 years of experience with proven track record in retail enterprise solutions. It has ventured into cloud-based digital platform to help its retail customers to drive their retail innovation and to provide greater control and flexibility. Some of its key customers include Robinsons, Marks & Spencer, Metro and Aeon.
Investment: In terms of investments, SAL has invested in about five companies, two are which are publicly listed – Global InfoTech and Finzsoft Solutions. SAL has since reduced its shareholding in Global InfoTech Co. Ltd. (GIT) from 20.01% in 2016 to 8.30% currently, recording gains of RM703m. Any subsequent disposal of GIT shares would depend on market conditions. From the sale of GIT shares in FY17 and FY18, SAL has paid five special dividends, totalling 4.1 Scts per share or the approximate equivalent of RM330m, which is about 62% of the total cash inflow from the GIT shares sale. Other uses of the share sale proceeds are share buybacks and acquisitions.

Page 4
Company Focus
Silverlake Axis
Business segment
BANKING INSURANCE • Software LicensingProvides digital economy solutions to banks and corporationsin financial services, retail and logistics industries.
• Software Project ServicesProvides software customisation and implementation servicesto deliver end-to-end core banking, payment and retailsolutions to customers.
• Maintenance and Enhancement ServicesProvides round-the-clock software maintenance supportservices to customers to ensure the smooth running of theirdaily business operations, as well as software enhancementservices to help customers deliver new capabilities forcustomer service excellence and product offering innovations,as well as to address governance, risk and compliancerequirements.
• Sale of Software and Hardware ProductsProvides integrated business solutions to customers thatrequire bundled one-stop solutions to meet their software andhardware needs.
• Insurance ProcessingProvides cloud computing software-as-a-service (SaaS)collaborative platform for policy administration, claimprocessing and data analytics for the insurance industry,connecting stakeholders in the insurance ecosystem includinginsurers, repairers, loss adjusters, parts suppliers, agents,brokers, and direct corporate clients, to ensure fasterprocessing, improved efficiency and easier performanceevaluation.
OTHER FINANCIAL SERVICES & RETAIL INVESTMENT • Credit and Cards ProcessingProvides full-scale processing of a wide range of credit cardsand other credit products on an outsourcing basis. Thisservice is offered to Japanese card issuers in Japan and banksproviding remote service for Japanese card issuers in Asia.
• Retail AutomationProvides cloud-based retail automation solutions with dataanalytics capabilities.
• Strategic Holdings :– Silver Team Technology Limited– Global InfoTech Co. Ltd *– ePetrol Silverswitch Sdn. Bhd.– Silverlake HGH Limited– Finzsoft Solutions Limited *
Source: DBS Bank; Company
*Public-listed company

Page 5
Company Focus
Silverlake Axis
Business Model
Evolution of the business model. The business model of SAL has evolved over the years. In FY05, about 70% of its revenue came from the sale of Branch Banking Solutions. Three years later in FY08, Silverlake Axis Integrated Banking Solution (SIBS) became the core contributor, accounting for 62% of total revenue. Over the past 10 years, the income base of SAL continued to be in expansion mode. In FY18, the maintenance and enhancement services segment was the key contributor to group revenue, accounting for 72%.
High recurring revenue; high margins. The revenue from the maintenance and enhancement services segment is recurring. SAL would usually secure the maintenance contract from its customers, after the installation of the core system. Some of these customers have been with SAL for more than 20 years.
Besides this segment, revenue from the growing insurance processing division is also recurring in nature. Its insurance arm, Merimen, is Asia’s top insurance software-as-a-service
(SaaS) company and ranked among the global top 10 in terms of claims processing and management solutions. It is used by all insurers in Malaysia and Singapore, and also has a presence in Thailand, Vietnam, the Philippines, Hong Kong, China and Taiwan. Overall, recurring income accounts for close to 60% of total revenue over the FY10-FY18 period.
Beginning of up-cycle. Its non-recurring revenue is mainly from project-based contracts, which could be cyclical in nature. One up-cycle typically lasts for about four to six years while a down cycle is about two years. We are currently at the beginning of an up-cycle.
In terms of geographical breakdown, SEA accounts for about two-thirds of its total revenue.
Gross margins over the FY10-FY18 period were at a high of 60%, supported by the relatively stable margins for the maintenance and enhancement services segment.
Revenue, Net Profit and Gross Margins Trend Revenue Breakdown By Segment
FY18 Revenue Breakdown By Geography Recurring vs Non-recurring Revenue
Source: Company, DBS Bank
South East Asia79%
North East Asia6%
South Asia7%
Middle East3% Africa
2%
Europe3%
62.7%59.9%
54.4%60.0%
61.3%65.3%
60.3%54.7%
56.3% 58.0%
58.0%
58.0%
0%
10%
20%
30%
40%
50%
60%
70%
0
100
200
300
400
500
600
700
800
900
10 11 12 13 14 15 16 17 18 19F 20F 21F
Revenue Net profit Gross margin
RMm
0
200
400
600
800
FY15A FY16A FY17A FY18A FY19F FY20F FY21F
Licensing of SIBS Software project servicesMaintenance & Enhancement Services Sale of software and hardware productscredit and cards processing Insurance Processing
RMm
72%
43% 37%45% 46%
59% 58%
83% 78% 83%72%
83%
28%
57% 63%55% 54%
41% 42%
17% 22% 17%28%
17%
0%
10%
20%
30%
40%
50%
60%
70%
80%
90%
100%
10 11 12 13 14 15 16 17 18 19F 20F 21F
Recurring Non recurring

Page 6
Company Focus
Silverlake Axis
Management team
Helmed by industry veterans. Mr Goh Peng Ooi, founder and Group Executive Chairman, founded Silverlake Group in 1989 and has helped develop the company into a leading provider of state-of-the-art universal banking solutions, payment and retail solutions.
Dr Kwong Yong Sin, CEO & Group Managing Director, is an industry veteran, with over 36 years of experience in Information Technology, Business Transformation and Solution Implementation in Financial Services, Utilities and Technology Industries. Together with his management team, SAL is now a leading provider of Digital Economy Solutions and Services to major organisations.
Key Directors & Management Team
Mr Goh Peng Ooi Founder & Group Executive Chairman
Mr. Goh was appointed Group Executive Chairman on 23 May 2006. Prior to that, he had been Non-Executive Chairman since 2002. Mr. Goh has over 30 years of experience in Information Technology. He obtained a Bachelor of Engineering majoring in Electronics Engineering from the University of Tokyo on the Monbusho scholarship. He began his career in IBM Malaysia and held several senior positions over his 9-year tenure, his last being Marketing Manager for Banking and Finance. He founded Silverlake Group in 1989 and has built it to become a leading provider of state-of-the-art universal banking, payment and retail solutions.
Dr. Kwong Yong Sin CEO & Group Managing Director
Dr. Kwong was appointed Group Managing Director on 1 November 2005. He was previously the Managing Director of Silverlake Corporation from 2001-2005 where he completed several key SIBS customer transformation projects. Prior to Silverlake, he was the Partner and Senior Vice President of Ernst & Young and Cap Gemini E&Y Consulting. Dr. Kwong has over 37 years of experience in Information Technology, Business Transformation and Solution Implementation in Financial Services, Utilities and Technology Industries. He has a Bachelor of Commerce (Honours) from the University of New South Wales (Australia) and Ph.D in Information Systems. He is a Certified Practicing Accountant (Australia).
Andrew Tan Teik Wei Managing Director, Core Banking
Mr. Tan joined the group in April 2018 and is responsible to grow and enhance the group’s core banking business. His career spans over 35 years where he held senior positions in the Big 4 professional services firms and in a number of multinational IT companies, serving clients in various industries – predominantly in financial services and in industrial/retail, telecommunications, energy and the public sector.
Fabian Lum Wai Kit Senior EVP, Digital Financial Services
Mr. Lum has 20 years of financial services experience that spans multiple areas including wealth management products, digital marketing, and core banking leadership roles. Since joining the group in 2015, he has been responsible for driving digital financial services in insurance, banking and payments, and has led the business development of SAL's software-as-a-service Insurance ecosystem platform.
Lim Ep Ban CEO, Silverlake Digitale & Silverlake One Paradigm
Mr. Lim is responsible for the overall strategy, operations, and performance of Silverlake Digitale and Silverlake One Paradigm. Both companies were acquired in April 2018. He has over 30 years of experience in information technology.
Tan Soo Cheng Senior EVP, Structured Services
Ms. Tan is responsible for the SIBS Application Maintenance and Enhancement business. Prior to assuming this role, Ms. Tan was a Director in the Silverlake Private Entities in charge of Programme/Project Management, Strategic Planning and Business Process Transformation. She has 29 years of financial services industry experience.
Wong Yok Koon Senior EVP, SIBS Core Solutions
With over 28 years of experience, Ms. Wong is responsible for the core product development of Silverlake Axis Integrated Banking Solution (SIBS), particularly in cards and payments.
Source: DBS Bank; Company

Page 7
Company Focus
Silverlake Axis
Competitive Strengths
Leader in digital economy solutions provider, with >40% of the top 20 largest banks in SEA. Silverlake Axis(SAL) is a leading provider of Digital Economy Solutions andServices to major organisations in the Banking, Insurance,Payments, Retail and Logistics industries. SAL provides coresystem platform for some of the top ASEAN financialinstitutions. It has geographical presence in Southeast Asia,Australia, China, Europe, Japan, the Middle East, NewZealand and South Asia, with over 300 customers. Over40% of the leading Southeast Asian banks that outsourcedtheir core banking solutions use SAL’s enterprise financialtechnology solutions and services.
Leader in insurance platform. Its insurance arm, mainly via wholly-owned subsidiary Merimen, builds insurance platforms for customers to improve efficiency in insurance claims and policy processing of general insurers. SAL's primary markets are Malaysia, Singapore and Indonesia with growing markets in Thailand, the Philippines and Vietnam. Merimen is Asia’s top insurance software-as-a-service (SaaS) company and ranked among the global top 10 in terms of claims processing and management solutions.
Leveraging on market leader position to ride on the Fintech wave. Financial institutions are going through enhancements. They need to beef up their systems to avoid being phased out by the rising Fintech trend. The use of Artificial Intelligence (AI) has become the norm. AI automates tasks like data analysis, thus helping to save a significant amount of time. The technology is also used to create robo-advisors and also to help to detect fraud by monitoring patterns of customer behaviour. Blockchain disrupts the current bank system by being a real-time updating digital ledger that cannot be changed. This takes paper and fraud out of the equation.
The rising popularity of mobile banking has also resulted in a growing number of digital banking transactions. With the digital age, the financial services industry has become vulnerable to cyberattacks. Thus, security has become a top priority. Financial institutions would need to have a robust system to gain customers’ trust and ease of mind to perform transactions online. Against this backdrop, and leveraging on its leadership position, especially in ASEAN, in both the core banking system and Insurtech segment, SAL is able to enable more financial institutions to ride on the Fintech trend in order to become more competitive.
Rising financial institutions’ capex. Financial institutions were conservative in FY16/FY17 amid tough market conditions, and they continued to defer major core IT replacements and upgrades in favour of enhancements to minimise capital outlay. They pursued smaller projects to deliver better customer services or to address specific market needs. This trend is set to reverse, as they beef up their systems to ride on the Fintech wave. Technology spending by Asian financial institutions and corporations has shown an improvement in FY18 with increased targeted expenditure on scalable and transformative technologies. Specifically, innovative enterprises continued to invest in big data and analytic tools while accelerating the adoption of software-as-a-service (SaaS) and cloud-based digital platform. In addition, changing regulatory environment and business landscape have also bolstered the need for IT enhancement as financial institutions and corporations strive to keep pace with regulatory compliance and remain competitive in an increasingly demanding market place.
Worldwide Fintech Spending (US$ bn)
Source: Company
Turnaround in sight; growing project orderbook. The improving market condition has led to a growing orderbook. Its orderbook has surged from the <RM50m secured in FY17. SAL has clinched several significant contracts recently, including three core banking system replacement projects in Thailand, and also from Malaysia and Hong Kong, which have progressively contributed to FY18 revenue. Its current order backlog of about RM380m is expected to be fulfilled in the next 15-18 months, with the bulk of it in FY19. This should lead to an improvement in project-related revenues going forward, while the maintenance and enhancement services and insurance software-as-a-service will continue to expand to generate a healthy increase in recurring revenues.

Page 8
Company Focus
Silverlake Axis
Recent contract wins Date ann’d
Est. duration
Details
11 Jan 2017
16 mths Secured core banking contracts from two financial institutions in Thailand.
12 Apr 2018
12 mths Secured core banking solution contract from an Islamic bank in Malaysia, Malaysia Building Society Bhd, an existing customer for its merged entity as it has recently acquired Asian Finance Bank Bhd.
24 Apr 2018
15 mths Awarded a new core banking system contract by a large ASEAN banking group.
11 May 2018
>2 yrs Awarded by an established consumer credit provider in Hong Kong to assist in the digital transformation of its credit card and lending businesses.
Source: DBS Bank; Company
High recurring revenue; high margins. Recurring revenue, mainly from software maintenance and enhancement services and insurance processing, accounts for a substantial part, close to 60% of total revenue over the FY10-FY18 period. Gross margins were at a high of 60% during the period, supported by the relatively stable margins for the maintenance and enhancement services segment.
Rising recurring revenue, high margins
Source: DBS Bank
Attractive yields; potentially higher dividends. SAL’s dividend payout ratio has been at least 40% in the past few years. The high net cash of about 30% of total equity helps to support the consistent dividend payout. In FY17 SAL paid out a special dividend of 2.3 Scts from the disposal of its investment in Global InfoTech (GIT) which is listed on the ChiNet of the Shenzhen Stock Exchange. SAL has since pared down its stake in GIT to 8.30% from about 20%, recording gains of RM703m. In FY18, SAL declared another special DPS of 1.8 Scts. Overall, about half of the proceeds have been paid out as dividend. SAL could potential pay higher dividend when the remaining stake in GIT is sold.
Historical DPS
(Scts) 1st
Int. 2nd
Int. 3rd
Int. Final
Spe-
cial Total FY14 0.8 0.9 1 1.2 0.6 4.5 FY15 0.8 1.1 1.1 1.2 - 4.2
FY16 0.6 0.75 0.65 1.0 - 3.0
FY17 0.5 0.7 0.7 0.3 2.3 4.5 FY18 0.3 0.3 0.3 0.3 1.8 3.0
Source: DBS Bank
DPS and dividend payout ratio
Source: DBS Bank
4.54.2
3.0
4.5
3.0106%
96%87%
43%
175%
0%20%40%60%80%100%120%140%160%180%200%
0.00.51.01.52.02.53.03.54.04.55.0
FY2014 FY2015 FY2016 FY2017 FY2018
DPS Payout (%)
Scts
0%
10%
20%
30%
40%
50%
60%
70%
0
100
200
300
400
500
600
10 11 12 13 14 15 16 17 18 19F 20F 21F
Recurring revenue
Non- recurring revenue
RM m
Gross Margins

Page 9
Company Focus
Silverlake Axis
Growth Strategies
M&A to strengthen SAL as Fintech innovation accelerator. SAL has been on a constant lookout for acquisition targets to strengthen its role as a leading digital economy solutions company and to be a leading Fintech company. SAL has undertaken several acquisitions in recent years to broaden the suite of business enterprise software solutions and service offerings and strengthen its market position. With expanded capabilities, the group is well positioned to empower its customers to be equipped with the technology to face the challenges of digital disruptions and to compete effectively in the digital economy ecosystem.
Over the years, SAL has been making acquisitions to beef up its services. In FY17, SAL acquired three Silverlake Private Entities from Chairman Mr Goh Peng Ooi, and two of the entities have clinched contracts recently. In November 2018, SAL has also acquired Xinfotech Group, a global provider of software solutions for the issuance and verification of digital identity documents and smart cards.
Digital tech and insurance-related M&A. Going forward, we can expect more M&A, especially in the digital technology area. Insurance-related companies, adjacent to Merimen, is also of interest to SAL.
Acquisitions Made: 2006-2018Company Description Purchase Consideration
2006
Silverlake Adaptive Applications & Continuous Improvement Services * (SAACIS)
Software licensing and the rendering of enhancement services
RM746.3m via issue of 836m new shares; 11.7x and 9.7x on FY06 and FY07 profit warranties.
(KPMG valuation: RM714.6m to RM808.1m)
2009
Silverlake Japan Card & credit processing in Japan n.a.
2010
Silverlake Solutions * Structured software maintenance & project services
RM702m; PE of 13.1x and 11.5x on FY09 and FY10 earnings
QR Technology * Retail & logistics solutions RM118m via issue of 146.2m new shares; PE of 14.7x and 19.7x on FY09 and FY10 earnings
2011
Symmetric Payments & Integration
Enterprise payment & integration platform n.a.
2013
Merimen Group Insurance claims & policies processing software-as-a-service ‘SaaS’ platform
RM61.9m; PE of 8x on average of FY12 to FY14 earnings
Cyber Village Mobile & Internet solutions RM42.3m; PE of 8x on average of FY11 and FY12 earnings

Page 10
Company Focus
Silverlake Axis
Company Description Purchase Consideration
2014
Finzsoft Solutions Solutions for banks & financial institutions in New Zealand and Australia
Takeover offer at NZ$3.00 per share or NZ$25.7m for 100% stake; 48.1% discount to last traded price and 371.1% premium to 1H15 NAV
2015
Silverlake Symmetri Retail banking solutions US$16.8m. Target has negative NTA as at Dec 14.
2017
Silverlake Digital Economy (SDE) *
Owns Silverlake Fintech Banking Platform and offers Banking-as-a-Service capabilities
Base consideration and earn-out based on earnings growth rate.
Silverlake Digitale (SDS) * Owns “IntelliSuite” – a suite of payment solution-related software modules and components
SDE: RM93.9m; 11x PE
SDS: RM46.6m; 8x PE
Silverlake One Paradigm (SOP) * Owns “NowSuite” – a suite of agile rules-based applications & tools such as fraud monitoring, and alerts
SOP: RM14.4m; 8x PE
2018
Xinfotech Group A global provider of software solutions for the issuance and verification of digital identity documents and smart cards.
EUR17.6m; 4.78x FY17 NAV
Source: DBS Bank; Company
*Interested-Party Transaction – acquired from Mr Goh’s Group of Companies
Digital expansion to complement core business In April 2018, SAL expanded its digital capabilities when it completed the acquisition of Silverlake Digital Economy (SDE), Silverlake Digitale (SDS) and Silverlake One Paradigm (SOP), profitable companies with proven digital technologies and a decent customer base.
SDE offers banking-as-a-service capabilities and provides a one-stop solution for banks seeking to transform from a traditional operating model to a digital operating model. SDS specialises in payments solution-related software while SOP helps to add value to existing core systems.
Among its other subsidiaries that offer digital businesses, insurance arm Merimen continues to expand its AI-based SaaS offerings for insurers. Cyber Village, which specialises on digital transformation and Fintech solutions, leveraging on facial biometric recognition for Electronic Know-Your-Customer (eKYC) to perform mass mobile customers onboarding. In addition, QR Retail Automation has ventured into innovative cloud-based retail automation solutions.
Recent Fintech platform successes :
1) Mobile onboarding with facial biometric recognition
A Malaysian-based bank adopted SAL’s facial biometric authentication application for eKYC to perform mass onsite account opening and onboarding for foreign workers.
2) Smart branch with omni-channel capabilities
Using SAL’s digital banking platform with omni-channel capabilities, a Brunei-based bank achieved operational excellence through digitised processes (paperless and integrated) and enhanced customer experience through self-service digital channels.
3) Digital banking transformation
Helped a Malaysian-based bank to accelerate the launch of new and enhanced digital user experience offerings.
4) Digital omni-channel platform
Thanks to SAL’s innovative solutions, a UAE-based bank now delivers financial services anytime, anywhere, and on any device to its customers.

Page 11
Company Focus
Silverlake Axis
Growing market share; healthy project pipeline. The worldwide Fintech spending is expected to continue growing at a CAGR of 4.1% from 2015-2020, buoyed by continuous investments in Information Technology (IT) by financial institutions and corporations to improve their competitive edge. SAL continues to achieve steady growth in market share. In Southeast Asia, SAL has about 40% market share of banks that outsource or use external parties to build their core banking solutions. SAL is particularly strong in regions like Malaysia and Singapore. Other regions like Indonesia, Thailand, Vietnam and Hong Kong offer huge potential. The banking system for some of the bigger banks in the region, for example Indonesia, is long due for upgrading. For Malaysia, the removal of the Goods & Services Tax (GST) could provide contract worth up to about Rm80m. SAL was awarded the contract to implement the GST system back in 2015.
Scaling up the insurance arm. SAL’s insurance arm, Merimen, which has been in business for more than 10 years and was bought over by SAL in 2013, generates high recurring income for the group. Merimen helps to build insurance platforms for customers to improve efficiency. As a result, cost per claim drops and these platforms can also reduce fraudulence and promote transparency.
Furthermore, with the vast amount of data collected in the system, Merimen can also use data analytics to target more new customers. With presence in Singapore (since 2006), Malaysia (2000), Indonesia (2006), Vietnam (2016), Thailand (2015), the Philippines (2016), Hong Kong (2017) and Taiwan (2018), its pay as you use software-as-a-service (SaaS) collaboration platform is a preferred choice for insurers in this region. Merimen has a market share of about 80-90% in Singapore and Malaysia, and about 50% in Indonesia.
Going forward, Merimen would continue to reinforce its branding and expand its geographical presence, customer base and innovative SaaS offerings. As the group deepens its market penetration in new countries, growth is expected in Merimen from increased ecosystem participation and from cross-selling opportunities. A continually changing regulatory and operational landscape in the insurance industry will provide opportunities to support growth for Merimen.
Key Risks
Slowdown in IT spending which could lead to lower orderbook. SAL’s orderbook are mainly from financial institutions. A slowdown in this industry would lead to institutions cutting back on their spending on IT. Customers may opt for enhancement projects to fill in the gap when the need arises instead of a total revamp to their existing system which involves higher capex. A slowdown in new projects would lead to lower maintenance contacts going forward.
Concerns on corporate governance issues. Over the past few years, SAL has been acquiring companies from Chairman Goh’s private entities. These include Silverlake Adaptive Applications & Continuous Improvement Services (SAACIS) in 2006, Silverlake Solutions (SSB) and QR Technology in 2010. The acquisitions resulted in massive dilution to minority stake holders and an increase in Mr Goh’s stake. Mr Goh has subsequently pared down his stake via various placements of shares. This has led to concerns of corporate governance issues. SAL's share price was badly affected in 2015 after an anonymous report raised a red flag on its extensive use of interested-party transactions (IPT) with Mr Goh’s private companies.
In an attempt to clear the air, SAL has engaged auditor Deloitte & Touche to undertake an independent review of the adverse allegations raised against the group in the anonymous report authored by razor99 and titled “The Unbelievable Financial Alchemy of Silverlake Axis”. This report, available online, made various allegations regarding the performance and operations of SAL Group. With regards to IPT, Deloitte has stated that SAL has complied with all of the requirements of the SGX listing rules in a 55-page report dated 6 January 2016.
In terms of post-acquisition performance and returns, both SAACIS and SSB have delivered a strong overall performance with average annual returns on investment in excess of 10%. However, QR has not delivered on the expectations implied by the transaction pricing, in view of its average annual return on investment of 3%.
In 2017, SAL had acquired three more entities – Silverlake Digital Economy Sdn Bhd (SDE), Silverlake Digitale Sdn Bhd (SDS) and Silverlake One Paradigm Sdn Bhd (SOP) – from Mr Goh. The total consideration includes a base consideration of RM154.9m, satisfied by the issue of 70.1m treasury shares at S$0.71 per share, and earn-out consideration based on average growth rate of net profit for each entity.

Page 12
Company Focus
Silverlake Axis
All three units were profitable, recording FY16 adjusted net profits (adjustment for staff expense post acquisition) of about RM8.5m, RM5.8m and RM1.8m, respectively, which works out to PEs of 11x, 8x, and 8x for SDE, SDS and SOP.
Going forward, in order to allay investor concerns on inter-party transactions and related issues, SAL would have to continue to acquire only good assets that can complement the group’s overall business and strategy and bring the group to greater heights.
Exposure mainly in Asia. More than 90% of the total revenue is generated from Asia. SAL is mainly strong in Asia. Its exposure to other parts of the world is still relatively weak, with Europe and the Middle East accounting for 3% each in total revenue, and another 2% from Africa.
Other players in the banking technology space include Infosys and TCS of India, besides global players like Temenos, Oracle, Misys and Fiserv.
Dependent on highly skilled technology professionals. About 80% of the total 1,700 employees are from the technology team. SAL depends heavily on its highly skilled technology professionals. It may be difficult to replace employees with the specialised training and experience. Thus, higher attrition rates and large-scale movements in the employee base could affect project continuity.
Valuation
Re-initiate with BUY, TP: S$0.60. We re-initiate coverage on SAL with a BUY recommendation and TP of S$0.60. Our TP is derived from peers’ average of 21x FY19F PE, based on SAL’s FY Jun 20F earnings, which translates to a potential upside of 45% from the current price.
Four new contracts secured. Since January 2017, SAL has secured four contracts worth a total of RM380m – three core banking contracts from Thailand, Malaysia and ASEAN, and one digital transformation contract for credit cards in Hong Kong. Further mid- to large-sized contracts could be in the pipeline, mainly from Malaysia, Thailand, Indonesia and Singapore. These contracts include digital enhancement and new core banking contracts. In the past, the peak of contract wins could reach RM500m to RM600m per year.
Expect more contacts to be awarded. In FY June 19, the bulk of the RM380m contract that SAL has secured would have been booked in. The group is also currently in the midst of negotiating for more new contracts. Thus, we expect new contract wins to be trending up, as represented by the blue bar shown in the chart below. Going forward, more orders could be in the pipeline as customers move to equip themselves with the technology to face the challenges of digital disruptions and to compete effectively in the digital economy ecosystem.
Share price to move in tandem with contract wins In the chart as shown below, the new contracts secured and booked for the fiscal year are represented by the red bar. These contracts are non-recurring in nature. Generally, the share price tends to move about one year ahead of the new contracts booked as at each fiscal year end. Thus, the two arrows (as represented by each colour pair) moved in the same direction but with about one-year time lag, with the share price as the leading indicator. However, in recent years, the new contracts booked for each year has started to rebound in FY June 18 but nevertheless the share price is still trending down.
Overall, judging by the historical trend, share price should move in tandem with the expected rise in contract wins.

Page 13
Company Focus
Silverlake Axis
Share Price vs New Contracts Booked
Source: DBS Bank

Page 14
Company Focus
Silverlake Axis
Peer comparisons
Source: Bloomberg Finance L.P.; DBS Bank
Name
Eqy Fis ca l Yr
End
Market Cap (USD
mln)PE
(Act)PE
(Yr 1)PE
(Yr 2) Curcy
Sa les FYA ( loca l curr
mln)
Gros s Margin
(%) FYA
Net Debt to Equity
(x)ROE (%)
Div Yld (%)
P/BV (x)
SILVERLAKE AXIS 06/2018 793.4 25.3 16.6 14.7 MYR 541.8 56.3 (89.9) 19.2 5.5 6.2 TEMENOS AG-REG 12/2017 8,450.8 52.4 40.8 34.8 USD 735.4 71.9 71.8 46.8 0.6 36.1 INFOSYS LTD 03/2018 42,512.4 18.2 18.1 16.3 INR 705,220.0 36.0 (40.4) 24.1 3.6 4.4 ORACLE FINANCIAL 03/2018 4,373.8 24.6 20.2 17.4 INR 45,274.7 n.a. (56.0) 31.0 3.3 6.6 FIDELITY NATIONA 12/2017 34,261.8 34.4 20.0 18.1 USD 9,123.0 32.2 74.0 15.3 1.2 3.3 FISERV INC 12/2017 29,781.7 28.1 23.9 21.2 USD 5,696.0 46.9 167.5 57.8 - 11.1 TATA CONSULTANCY 03/2018 106,702.2 26.6 23.6 21.0 INR 1,231,040.0 42.1 (48.4) 36.9 1.8 9.4 SAP SE-SPONS ADR 12/2017 108,568.0 n.a. 19.5 17.8 EUR 23,460.0 69.9 9.6 16.5 1.6 n.a.Ave ra ge (e x Si l ve rla ke ) 30.7 23.7 20.9 49.8 25.5 32.6 1.7 11.8
Page 15
Company Focus
Silverlake Axis
Key Assumptions
FY Jun 2016A 2017A 2018A 2019F 2020F 2021F
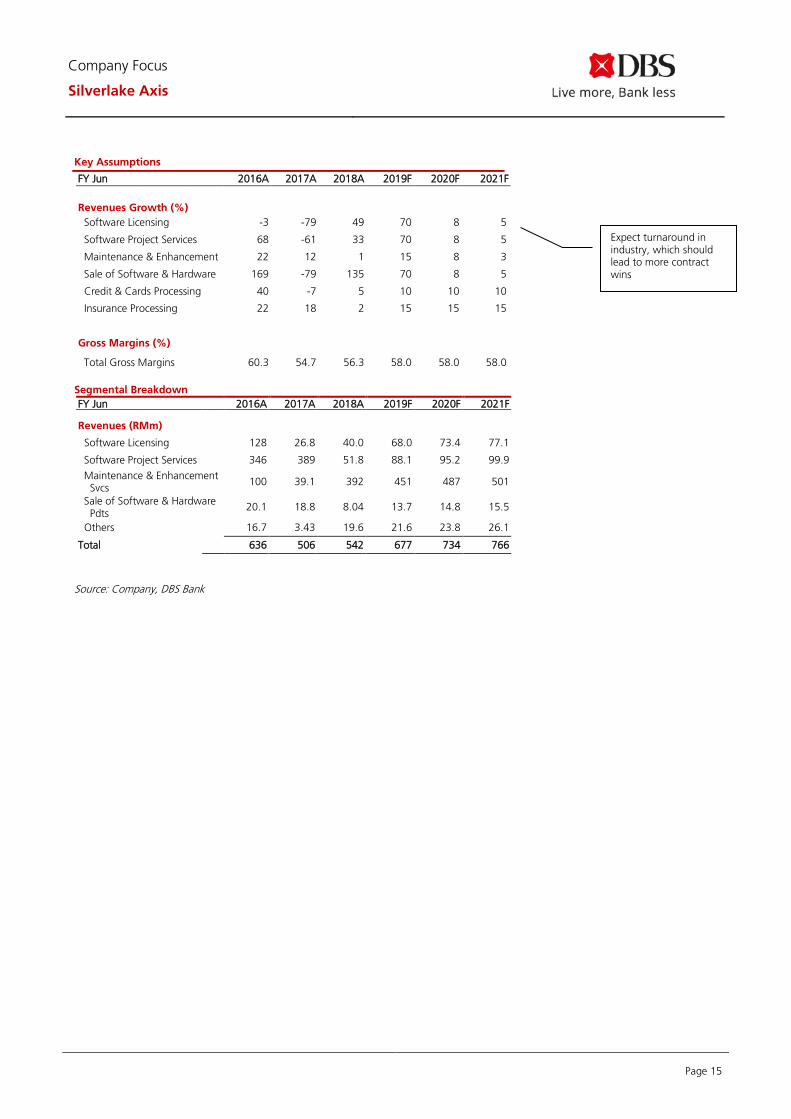
Revenues Growth (%) Software Licensing -3 -79 49 70 8 5
Software Project Services 68 -61 33 70 8 5
Maintenance & Enhancement 22 12 1 15 8 3
Sale of Software & Hardware 169 -79 135 70 8 5
Credit & Cards Processing 40 -7 5 10 10 10
Insurance Processing 22 18 2 15 15 15
Gross Margins (%)
Total Gross Margins 60.3 54.7 56.3 58.0 58.0 58.0
Segmental Breakdown FY Jun 2016A 2017A 2018A 2019F 2020F 2021F
Revenues (RMm)
Software Licensing 128 26.8 40.0 68.0 73.4 77.1
Software Project Services 346 389 51.8 88.1 95.2 99.9
Maintenance & Enhancement Svcs
100 39.1 392 451 487 501
Sale of Software & Hardware Pdts
20.1 18.8 8.04 13.7 14.8 15.5
Others 16.7 3.43 19.6 21.6 23.8 26.1
Total 636 506 542 677 734 766
Source: Company, DBS Bank
Expect turnaround in industry, which should lead to more contract wins

Page 16
Company Focus
Silverlake Axis
Income Statement (RMm)
FY Jun 2016A 2017A 2018A 2019F 2020F 2021F
Revenue 636 506 542 677 734 766
Cost of Goods Sold (252) (229) (237) (284) (308) (322)
Gross Profit 384 277 305 393 426 444
Other Opng (Exp)/Inc (86.5) 675 (143) (169) (174) (173)
Operating Profit 297 952 162 223 251 272
Other Non Opg (Exp)/Inc 0.0 0.0 0.0 0.0 0.0 0.0
Associates & JV Inc 1.85 (7.7) (15.9) 0.0 0.0 0.0
Net Interest (Exp)/Inc 1.03 2.80 1.51 1.51 1.51 1.51
Exceptional Gain/(Loss) 0.0 0.0 0.0 0.0 0.0 0.0
Pre-tax Profit 300 947 147 225 253 274
Tax (26.4) (101) (13.1) (20.0) (22.5) (24.3)
Minority Interest 0.0 0.0 0.0 0.0 0.0 0.0
Preference Dividend 0.0 0.0 0.0 0.0 0.0 0.0
Net Profit 274 846 134 205 230 249
Net Profit before Except. 274 846 134 205 230 249
EBITDA 316 963 167 245 273 294
Growth
Revenue Gth (%) 23.3 (20.4) 7.0 25.0 8.4 4.4
EBITDA Gth (%) (0.9) 205.1 (82.7) 46.5 11.4 7.7
Opg Profit Gth (%) (0.8) 220.3 (83.0) 38.3 12.5 8.0
Net Profit Gth (Pre-ex) (%) (3.1) 208.9 (84.2) 52.8 12.4 8.0
Margins & Ratio
Gross Margins (%) 60.3 54.7 56.3 58.0 58.0 58.0
Opg Profit Margin (%) 46.7 188.1 29.8 33.0 34.3 35.4
Net Profit Margin (%) 43.0 167.1 24.7 30.3 31.4 32.5
ROAE (%) 44.1 96.1 16.0 38.3 40.3 39.8
ROA (%) 34.0 74.4 11.0 20.6 22.8 23.3
ROCE (%) 39.7 85.1 13.9 24.4 26.2 26.7
Div Payout Ratio (%) 87.0 43.0 175.0 80.0 80.0 80.0
Net Interest Cover (x) NM NM NM NM NM NM
Source: Company, DBS Bank
Margins Trend
23.0%
43.0%
63.0%
83.0%
103.0%
123.0%
143.0%
163.0%
183.0%
2017A 2018A 2019F 2020F 2021F
Operating Margin % Net Income Margin %
Mainly from proceeds of GIT sale
High payout ratios in FY18 from proceeds of GIT sale
Expected strong revenue and earnings growth in FY19F on the back of new orders secured
Mainly due to impairment loss by joint venture entity, Silverlake HGH
Page 17
Company Focus
Silverlake Axis
Quarterly / Interim Income Statement (RMm)
FY Jun 4Q2017 1Q2018 2Q2018 3Q2018 4Q2018 1Q2019
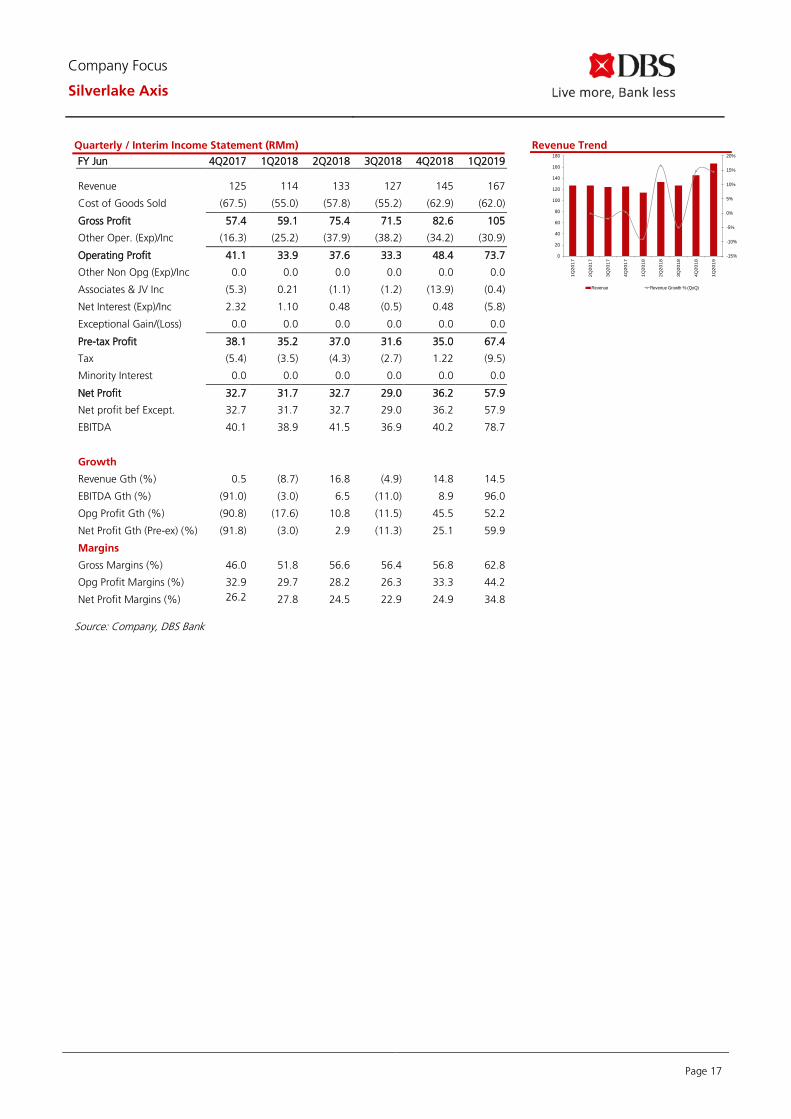
Revenue 125 114 133 127 145 167
Cost of Goods Sold (67.5) (55.0) (57.8) (55.2) (62.9) (62.0)
Gross Profit 57.4 59.1 75.4 71.5 82.6 105
Other Oper. (Exp)/Inc (16.3) (25.2) (37.9) (38.2) (34.2) (30.9)
Operating Profit 41.1 33.9 37.6 33.3 48.4 73.7
Other Non Opg (Exp)/Inc 0.0 0.0 0.0 0.0 0.0 0.0
Associates & JV Inc (5.3) 0.21 (1.1) (1.2) (13.9) (0.4)
Net Interest (Exp)/Inc 2.32 1.10 0.48 (0.5) 0.48 (5.8)
Exceptional Gain/(Loss) 0.0 0.0 0.0 0.0 0.0 0.0
Pre-tax Profit 38.1 35.2 37.0 31.6 35.0 67.4
Tax (5.4) (3.5) (4.3) (2.7) 1.22 (9.5)
Minority Interest 0.0 0.0 0.0 0.0 0.0 0.0
Net Profit 32.7 31.7 32.7 29.0 36.2 57.9
Net profit bef Except. 32.7 31.7 32.7 29.0 36.2 57.9
EBITDA 40.1 38.9 41.5 36.9 40.2 78.7
Growth
Revenue Gth (%) 0.5 (8.7) 16.8 (4.9) 14.8 14.5
EBITDA Gth (%) (91.0) (3.0) 6.5 (11.0) 8.9 96.0
Opg Profit Gth (%) (90.8) (17.6) 10.8 (11.5) 45.5 52.2
Net Profit Gth (Pre-ex) (%) (91.8) (3.0) 2.9 (11.3) 25.1 59.9
Margins
Gross Margins (%) 46.0 51.8 56.6 56.4 56.8 62.8
Opg Profit Margins (%) 32.9 29.7 28.2 26.3 33.3 44.2
Net Profit Margins (%) 26.2 27.8 24.5 22.9 24.9 34.8
Revenue Trend
Source: Company, DBS Bank
-15%
-10%
-5%
0%
5%
10%
15%
20%
0
20
40
60
80
100
120
140
160
180
1Q20
17
2Q20
17
3Q20
17
4Q20
17
1Q20
18
2Q20
18
3Q20
18
4Q20
18
1Q20
19
Revenue Revenue Growth % (QoQ)

Page 18
Company Focus
Silverlake Axis
Balance Sheet (RMm) FY Jun 2016A 2017A 2018A 2019F 2020F 2021F
Net Fixed Assets 16.3 19.1 20.4 21.1 21.7 22.3
Invts in Associates & JVs 106 0.0 9.67 9.67 9.67 9.67
Other LT Assets 233 228 223 213 199 183
Cash & ST Invts 225 701 498 450 504 566
Inventory 0.0 0.0 0.0 0.0 0.0 0.0
Debtors 178 145 139 174 188 197
Other Current Assets 74.8 349 117 117 117 117
Total Assets 833 1,441 1,007 984 1,039 1,095
ST Debt 73.0 89.3 25.4 25.4 25.4 25.4
Creditor 49.4 66.3 68.0 14.8 16.0 16.7
Other Current Liab 81.0 79.7 115 122 125 126
LT Debt 1.42 1.60 2.93 2.93 2.93 2.93
Other LT Liabilities 25.9 46.5 272 272 272 272
Shareholder’s Equity 603 1,158 523 546 598 651
Minority Interests 0.08 0.10 0.08 0.08 0.08 0.08
Total Cap. & Liab. 833 1,441 1,007 984 1,039 1,095
Non-Cash Wkg. Capital 122 348 72.4 153 164 170
Net Cash/(Debt) 150 610 470 422 476 538
Debtors Turn (avg days) 75.2 116.2 95.6 84.4 90.1 91.7
Creditors Turn (avg days) 83.3 100.1 113.7 57.4 19.6 19.9
Inventory Turn (avg days) N/A N/A N/A N/A N/A N/A
Asset Turnover (x) 0.8 0.4 0.4 0.7 0.7 0.7
Current Ratio (x) 2.3 5.1 3.6 4.6 4.9 5.2
Quick Ratio (x) 2.0 3.6 3.1 3.8 4.2 4.5
Net Debt/Equity (X) CASH CASH CASH CASH CASH CASH
Net Debt/Equity ex MI (X) CASH CASH CASH CASH CASH CASH
Capex to Debt (%) 97.7 11.8 10.3 17.7 17.7 17.7
Source: Company, DBS Bank
Asset Breakdown Net Fixed Assets -4.6%
Assocs'/JVs -2.1%
Bank, Cash and Liquid
Assets -55.6%
Inventory -0.0%
Debtors -37.8%
Include software development expenditure, proprietary software and goodwill from acquisitions
Strong cash level
Page 19
Company Focus
Silverlake Axis
Cash Flow Statement (RMm)
FY Jun 2016A 2017A 2018A 2019F 2020F 2021F
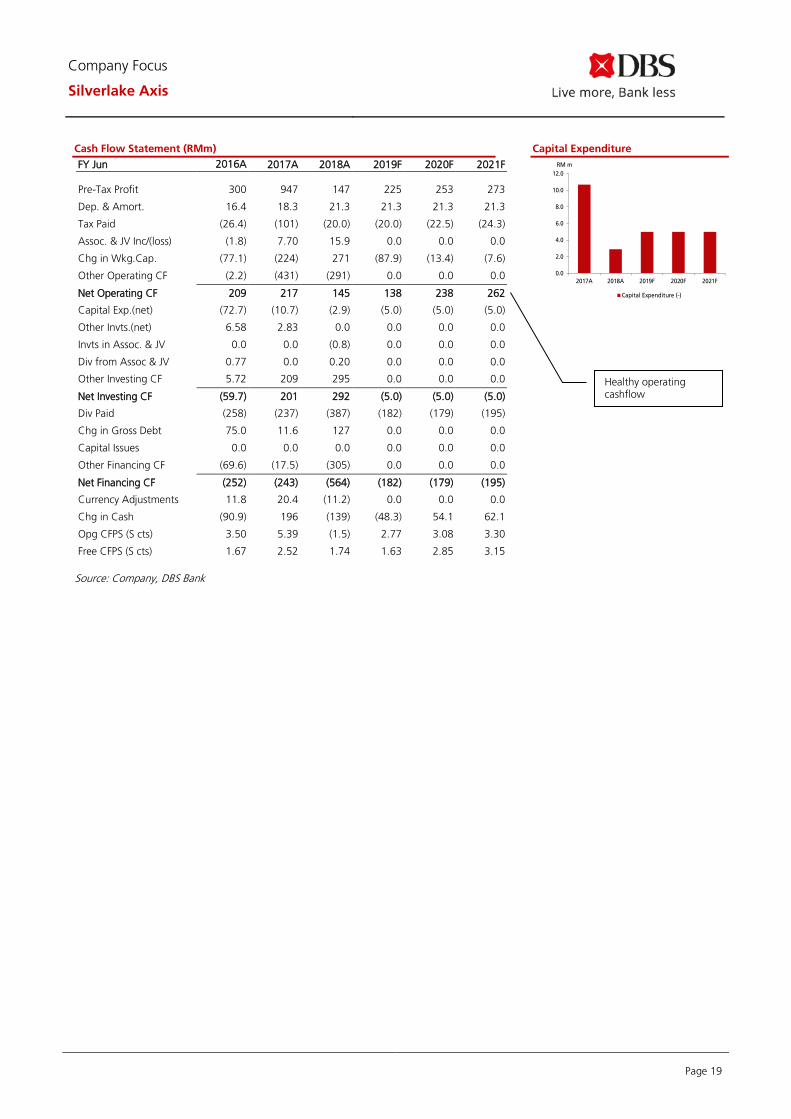
Pre-Tax Profit 300 947 147 225 253 273
Dep. & Amort. 16.4 18.3 21.3 21.3 21.3 21.3
Tax Paid (26.4) (101) (20.0) (20.0) (22.5) (24.3)
Assoc. & JV Inc/(loss) (1.8) 7.70 15.9 0.0 0.0 0.0
Chg in Wkg.Cap. (77.1) (224) 271 (87.9) (13.4) (7.6)
Other Operating CF (2.2) (431) (291) 0.0 0.0 0.0
Net Operating CF 209 217 145 138 238 262
Capital Exp.(net) (72.7) (10.7) (2.9) (5.0) (5.0) (5.0)
Other Invts.(net) 6.58 2.83 0.0 0.0 0.0 0.0
Invts in Assoc. & JV 0.0 0.0 (0.8) 0.0 0.0 0.0
Div from Assoc & JV 0.77 0.0 0.20 0.0 0.0 0.0
Other Investing CF 5.72 209 295 0.0 0.0 0.0
Net Investing CF (59.7) 201 292 (5.0) (5.0) (5.0)
Div Paid (258) (237) (387) (182) (179) (195)
Chg in Gross Debt 75.0 11.6 127 0.0 0.0 0.0
Capital Issues 0.0 0.0 0.0 0.0 0.0 0.0
Other Financing CF (69.6) (17.5) (305) 0.0 0.0 0.0
Net Financing CF (252) (243) (564) (182) (179) (195)
Currency Adjustments 11.8 20.4 (11.2) 0.0 0.0 0.0
Chg in Cash (90.9) 196 (139) (48.3) 54.1 62.1
Opg CFPS (S cts) 3.50 5.39 (1.5) 2.77 3.08 3.30
Free CFPS (S cts) 1.67 2.52 1.74 1.63 2.85 3.15
Source: Company, DBS Bank
Capital Expenditure
0.0
2.0
4.0
6.0
8.0
10.0
12.0
2017A 2018A 2019F 2020F 2021F
Capital Expenditure (-)
RM m
Healthy operating cashflow

Page 20
Company Focus
Silverlake Axis
DBS Bank recommendations are based an Absolute Total Return* Rating system, defined as follows:
STRONG BUY (>20% total return over the next 3 months, with identifiable share price catalysts within this time frame)
BUY (>15% total return over the next 12 months for small caps, >10% for large caps)
HOLD (-10% to +15% total return over the next 12 months for small caps, -10% to +10% for large caps)
FULLY VALUED (negative total return i.e. > -10% over the next 12 months)
SELL (negative total return of > -20% over the next 3 months, with identifiable catalysts within this time frame)
Share price appreciation + dividends
Completed Date: 3 Jan 2019 07:35:41 (SGT) Dissemination Date: 3 Jan 2019 07:49:31 (SGT)
Sources for all charts and tables are DBS Bank unless otherwise specified.
GENERAL DISCLOSURE/DISCLAIMER
This report is prepared by DBS Bank Ltd. This report is solely intended for the clients of DBS Bank Ltd, its respective connected and associated
corporations and affiliates only and no part of this document may be (i) copied, photocopied or duplicated in any form or by any means or (ii)
redistributed without the prior written consent of DBS Bank Ltd.
The research set out in this report is based on information obtained from sources believed to be reliable, but we (which collectively refers to DBS
Bank Ltd, its respective connected and associated corporations, affiliates and their respective directors, officers, employees and agents
(collectively, the “DBS Group”) have not conducted due diligence on any of the companies, verified any information or sources or taken into
account any other factors which we may consider to be relevant or appropriate in preparing the research. Accordingly, we do not make any
representation or warranty as to the accuracy, completeness or correctness of the research set out in this report. Opinions expressed are subject
to change without notice. This research is prepared for general circulation. Any recommendation contained in this document does not have
regard to the specific investment objectives, financial situation and the particular needs of any specific addressee. This document is for the
information of addressees only and is not to be taken in substitution for the exercise of judgement by addressees, who should obtain separate
independent legal or financial advice. The DBS Group accepts no liability whatsoever for any direct, indirect and/or consequential loss (including
any claims for loss of profit) arising from any use of and/or reliance upon this document and/or further communication given in relation to this
document. This document is not to be construed as an offer or a solicitation of an offer to buy or sell any securities. The DBS Group, along with
its affiliates and/or persons associated with any of them may from time to time have interests in the securities mentioned in this document. The
DBS Group, may have positions in, and may effect transactions in securities mentioned herein and may also perform or seek to perform broking,
investment banking and other banking services for these companies.
Any valuations, opinions, estimates, forecasts, ratings or risk assessments herein constitutes a judgment as of the date of this report, and there
can be no assurance that future results or events will be consistent with any such valuations, opinions, estimates, forecasts, ratings or risk
assessments. The information in this document is subject to change without notice, its accuracy is not guaranteed, it may be incomplete or
condensed, it may not contain all material information concerning the company (or companies) referred to in this report and the DBS Group is
under no obligation to update the information in this report.
This publication has not been reviewed or authorized by any regulatory authority in Singapore, Hong Kong or elsewhere. There is no planned
schedule or frequency for updating research publication relating to any issuer.
The valuations, opinions, estimates, forecasts, ratings or risk assessments described in this report were based upon a number of estimates and
assumptions and are inherently subject to significant uncertainties and contingencies. It can be expected that one or more of the estimates on
which the valuations, opinions, estimates, forecasts, ratings or risk assessments were based will not materialize or will vary significantly from
actual results. Therefore, the inclusion of the valuations, opinions, estimates, forecasts, ratings or risk assessments described herein IS NOT TO BE
RELIED UPON as a representation and/or warranty by the DBS Group (and/or any persons associated with the aforesaid entities), that:
(a) such valuations, opinions, estimates, forecasts, ratings or risk assessments or their underlying assumptions will be achieved, and
(b) there is any assurance that future results or events will be consistent with any such valuations, opinions, estimates, forecasts, ratings or risk
assessments stated therein.
Please contact the primary analyst for valuation methodologies and assumptions associated with the covered companies or price targets.

Page 21
Company Focus
Silverlake Axis
Any assumptions made in this report that refers to commodities, are for the purposes of making forecasts for the company (or companies)
mentioned herein. They are not to be construed as recommendations to trade in the physical commodity or in the futures contract relating to the
commodity referred to in this report.
DBSVUSA, a US-registered broker-dealer, does not have its own investment banking or research department, has not participated in any public
offering of securities as a manager or co-manager or in any other investment banking transaction in the past twelve months and does not
engage in market-making.
ANALYST CERTIFICATION
The research analyst(s) primarily responsible for the content of this research report, in part or in whole, certifies that the views about the
companies and their securities expressed in this report accurately reflect his/her personal views. The analyst(s) also certifies that no part of his/her
compensation was, is, or will be, directly or indirectly, related to specific recommendations or views expressed in the report. The research analyst
(s) primarily responsible for the content of this research report, in part or in whole, certifies that he or his associate1 does not serve as an officer
of the issuer or the new listing applicant (which includes in the case of a real estate investment trust, an officer of the management company of
the real estate investment trust; and in the case of any other entity, an officer or its equivalent counterparty of the entity who is responsible for
the management of the issuer or the new listing applicant) and the research analyst(s) primarily responsible for the content of this research report
or his associate does not have financial interests2 in relation to an issuer or a new listing applicant that the analyst reviews. DBS Group has
procedures in place to eliminate, avoid and manage any potential conflicts of interests that may arise in connection with the production of
research reports. The research analyst(s) responsible for this report operates as part of a separate and independent team to the investment
banking function of the DBS Group and procedures are in place to ensure that confidential information held by either the research or investment
banking function is handled appropriately. There is no direct link of DBS Group's compensation to any specific investment banking function of
the DBS Group.
COMPANY-SPECIFIC / REGULATORY DISCLOSURES
1. DBS Bank Ltd, DBS HK, DBS Vickers Securities (Singapore) Pte Ltd (''DBSVS'') or their subsidiaries and/or other affiliates do not have
a proprietary position in the securities recommended in this report as of 30 Nov 2018
2. Neither DBS Bank Ltd nor DBS HK market makes in equity securities of the issuer(s) or company(ies) mentioned in this Research
Report.
Compensation for investment banking services:
3. DBSVUSA does not have its own investment banking or research department, nor has it participated in any public offering of
securities as a manager or co-manager or in any other investment banking transaction in the past twelve months. Any US persons
wishing to obtain further information, including any clarification on disclosures in this disclaimer, or to effect a transaction in any
security discussed in this document should contact DBSVUSA exclusively.
Disclosure of previous investment recommendation produced:
4. DBS Bank Ltd, DBS Vickers Securities (Singapore) Pte Ltd (''DBSVS''), their subsidiaries and/or other affiliates may have published
other investment recommendations in respect of the same securities / instruments recommended in this research report during the
preceding 12 months. Please contact the primary analyst listed in the first page of this report to view previous investment
recommendations published by DBS Bank Ltd, DBS Vickers Securities (Singapore) Pte Ltd (''DBSVS''), their subsidiaries and/or other
affiliates in the preceding 12 months.
1 An associate is defined as (i) the spouse, or any minor child (natural or adopted) or minor step-child, of the analyst; (ii) the trustee of a trust of which the analyst, his spouse, minor child (natural or adopted) or minor step-child, is a beneficiary or discretionary object; or (iii) another person accustomed or obliged to act in accordance with the directions or instructions of the analyst.
2 Financial interest is defined as interests that are commonly known financial interest, such as investment in the securities in respect of an issuer or a new listing applicant, or financial accommodation arrangement between the issuer or the new listing applicant and the firm or analysis. This term does not include commercial lending conducted at arm's length, or investments in any collective investment scheme other than an issuer or new listing applicant notwithstanding the fact that the scheme has investments in securities in respect of an issuer or a new listing applicant.

Page 22
Company Focus
Silverlake Axis
RESTRICTIONS ON DISTRIBUTION
General This report is not directed to, or intended for distribution to or use by, any person or entity who is a citizen or resident of or located in any locality, state, country or other jurisdiction where such distribution, publication, availability or use would be contrary to law or regulation.
Australia This report is being distributed in Australia by DBS Bank Ltd, DBSVS or DBSV HK. DBS Bank Ltd holds Australian Financial Services Licence no. 475946.
DBSVS and DBSV HK are exempted from the requirement to hold an Australian Financial Services Licence under the Corporation Act 2001 (“CA”) in respect of financial services provided to the recipients. Both DBS Bank Ltd and DBSVS are regulated by the Monetary Authority of Singapore under the laws of Singapore, and DBSV HK is regulated by the Hong Kong Securities and Futures Commission under the laws of Hong Kong, which differ from Australian laws.
Distribution of this report is intended only for “wholesale investors” within the meaning of the CA.
Hong Kong This report has been prepared by a person(s) who is not licensed by the Hong Kong Securities and Futures Commission to carry on the regulated activity of advising on securities in Hong Kong pursuant to the Securities and Futures Ordinance (Chapter 571 of the Laws of Hong Kong). This report is being distributed in Hong Kong and is attributable to DBS Bank (Hong Kong) Limited, a registered institution registered with the Hong Kong Securities and Futures Commission to carry on the regulated activity of advising on securities pursuant to the Securities and Futures Ordinance (Chapter 571 of the Laws of Hong Kong).
For any query regarding the materials herein, please contact Carol Wu (Reg No. AH8283) at [email protected]
Indonesia This report is being distributed in Indonesia by PT DBS Vickers Sekuritas Indonesia.
Malaysia This report is distributed in Malaysia by AllianceDBS Research Sdn Bhd ("ADBSR"). Recipients of this report, received from ADBSR are to contact the undersigned at 603-2604 3333 in respect of any matters arising from or in connection with this report. In addition to the General Disclosure/Disclaimer found at the preceding page, recipients of this report are advised that ADBSR (the preparer of this report), its holding company Alliance Investment Bank Berhad, their respective connected and associated corporations, affiliates, their directors, officers, employees, agents and parties related or associated with any of them may have positions in, and may effect transactions in the securities mentioned herein and may also perform or seek to perform broking, investment banking/corporate advisory and other services for the subject companies. They may also have received compensation and/or seek to obtain compensation for broking, investment banking/corporate advisory and other services from the subject companies.
Wong Ming Tek, Executive Director, ADBSR
Singapore This report is distributed in Singapore by DBS Bank Ltd (Company Regn. No. 196800306E) or DBSVS (Company Regn No. 198600294G), both of which are Exempt Financial Advisers as defined in the Financial Advisers Act and regulated by the Monetary Authority of Singapore. DBS Bank Ltd and/or DBSVS, may distribute reports produced by its respective foreign entities, affiliates or other foreign research houses pursuant to an arrangement under Regulation 32C of the Financial Advisers Regulations. Where the report is distributed in Singapore to a person who is not an Accredited Investor, Expert Investor or an Institutional Investor, DBS Bank Ltd accepts legal responsibility for the contents of the report to such persons only to the extent required by law. Singapore recipients should contact DBS Bank Ltd at 6327 2288 for matters arising from, or in connection with the report.

Page 23
Company Focus
Silverlake Axis
Thailand This report is being distributed in Thailand by DBS Vickers Securities (Thailand) Co Ltd.
United Kingdom
This report is produced by DBS Bank Ltd which is regulated by the Monetary Authority of Singapore.
This report is disseminated in the United Kingdom by DBS Vickers Securities (UK) Ltd, ("DBSVUK"). DBSVUK is authorised and regulated by the Financial Conduct Authority in the United Kingdom.
In respect of the United Kingdom, this report is solely intended for the clients of DBSVUK, its respective connected and associated corporations and affiliates only and no part of this document may be (i) copied, photocopied or duplicated in any form or by any means or (ii) redistributed without the prior written consent of DBSVUK. This communication is directed at persons having professional experience in matters relating to investments. Any investment activity following from this communication will only be engaged in with such persons. Persons who do not have professional experience in matters relating to investments should not rely on this communication.
Dubai International Financial Centre
This research report is being distributed by DBS Bank Ltd., (DIFC Branch) having its office at units 608 - 610, 6th Floor, Gate Precinct Building 5, PO Box 506538, DIFC, Dubai, United Arab Emirates. DBS Bank Ltd., (DIFC Branch) is regulated by The Dubai Financial Services Authority. This research report is intended only for professional clients (as defined in the DFSA rulebook) and no other person may act upon it.
United Arab Emirates
This report is provided by DBS Bank Ltd (Company Regn. No. 196800306E) which is an Exempt Financial Adviser as defined in the Financial Advisers Act and regulated by the Monetary Authority of Singapore. This report is for information purposes only and should not be relied upon or acted on by the recipient or considered as a solicitation or inducement to buy or sell any financial product. It does not constitute a personal recommendation or take into account the particular investment objectives, financial situation, or needs of individual clients. You should contact your relationship manager or investment adviser if you need advice on the merits of buying, selling or holding a particular investment. You should note that the information in this report may be out of date and it is not represented or warranted to be accurate, timely or complete. This report or any portion thereof may not be reprinted, sold or redistributed without our written consent.
United States This report was prepared by DBS Bank Ltd. DBSVUSA did not participate in its preparation. The research analyst(s) named on this report are not registered as research analysts with FINRA and are not associated persons of DBSVUSA. The research analyst(s) are not subject to FINRA Rule 2241 restrictions on analyst compensation, communications with a subject company, public appearances and trading securities held by a research analyst. This report is being distributed in the United States by DBSVUSA, which accepts responsibility for its contents. This report may only be distributed to Major U.S. Institutional Investors (as defined in SEC Rule 15a-6) and to such other institutional investors and qualified persons as DBSVUSA may authorize. Any U.S. person receiving this report who wishes to effect transactions in any securities referred to herein should contact DBSVUSA directly and not its affiliate.
Other jurisdictions
In any other jurisdictions, except if otherwise restricted by laws or regulations, this report is intended only for qualified, professional, institutional or sophisticated investors as defined in the laws and regulations of such jurisdictions.

Page 24
Company Focus
Silverlake Axis
DBS Regional Research Offices
HONG KONG DBS (Hong Kong) Ltd Contact: Carol Wu 11th Floor The Center 99 Queen’s Road Central Central, Hong Kong Tel: 852 3668 4181 Fax: 852 2521 1812 e-mail: [email protected]
MALAYSIA AllianceDBS Research Sdn Bhd Contact: Wong Ming Tek (128540 U) 19th Floor, Menara Multi-Purpose, Capital Square, 8 Jalan Munshi Abdullah 50100 Kuala Lumpur, Malaysia. Tel.: 603 2604 3333 Fax: 603 2604 3921 e-mail: [email protected]
SINGAPORE DBS Bank Ltd Contact: Janice Chua 12 Marina Boulevard, Marina Bay Financial Centre Tower 3 Singapore 018982 Tel: 65 6878 8888 Fax: 65 65353 418 e-mail: [email protected] Regn. No. 196800306E
THAILAND DBS Vickers Securities (Thailand) Co Ltd Contact: Chanpen Sirithanarattanakul 989 Siam Piwat Tower Building, 9th, 14th-15th Floor Rama 1 Road, Pathumwan, Bangkok Thailand 10330 Tel. 66 2 857 7831 Fax: 66 2 658 1269 e-mail: [email protected] Regn. No 0105539127012Securities and Exchange Commission, Thailand
INDONESIA PT DBS Vickers Sekuritas (Indonesia) Contact: Maynard Priajaya Arif DBS Bank Tower Ciputra World 1, 32/F Jl. Prof. Dr. Satrio Kav. 3-5 Jakarta 12940, Indonesia Tel: 62 21 3003 4900 Fax: 6221 3003 4943 e-mail: [email protected]