since 1927 fy2022.3 2027
TRANSCRIPT

(Ticker code: 7995)
20271927 FY2022.3 Since
Hard & Seal Engineering ServiceTech & ElectronicsGeneral Machinery
Transportation SystemChemical & Energy Plant
Financial Results for the Second Quarter of the Fiscal Year Ending March 31, 2022
November 11, 2021
*This report contains forecasts and plan numbers which are based on information currently available to the Company on the day this report was created and actual results may differ.
*The fluctuation rates (%) in this material are calculated using the unit of Yen, to the extent possible, so they may differ from values calculated using the unit of Millions of yen.

1-2Q (1H) of the Fiscal Year Ending March 31, 2022 Consolidated Performance and Business Overview
2H of the fiscal Year Ending March 31, 2022 and Full-year Forecast and Forward-looking Statements

1Q-2Q of FY2020.3
1Q-2Q of FY2021.3
1Q-2Q ofFY2022.3
(YoY)
Main Change Factor in Income Compared with the Previous Fiscal Year
Net Sales 24,915 21,630 24,740(+14.4%)
--Sales increased due to expanded sales of strategic products (high-performance seal products and specialty high performance plastic tank products).
--Operating profit increased significantly due to increased sales and efficiency measures.
--Restructuring the Business Structure for “Post-COVID-19”
--Continue to invest in corporate infrastructure development
==Development to promote DX==Reform of domestic sales process and
review of bases
Operating Profit 2,545 1,685 2,696(+60.0%)
Profit Attributable to
Owners of Parent
1,816 1,803 1,916(+6.3%)
Gross Profit Margin 37.9% 39.9% 39.6%
Operating Profit Margin 10.2% 7.8% 10.9%
Net ProfitMargin 7.3% 8.3% 7.7%
3
■ Business performance recovered significantly due to the favorable business environment and the effects of offensive and defensive strategies.
■ Full-Year Earnings Forecast (p. 19) and Year-End Dividend Forecast (p. 15) revised upward
(Unit : Millions of yen)
1-2Q of FY 2022.3Consolidated Performance
and Business OverviewOverview

1Q-2Q of FY2019.3
3Q-4Q of FY2019.3
1Q-2Q of FY2020.3
3Q-4Q of FY2020.3
1Q-2Q ofFY2021.3
3Q-4Q ofFY2021.3
1Q-2Q of FY2022.3
Net Sales 26,084 25,159 24,915 23,296 21,630 23,086 24,740
Gross Profit 9,884 9,209 9,447 8,527 8,624 8,893 9,801Selling, General & Administration
Expenses6,677 6,806 6,902 6,857 6,938 7,103 7,104
Operating Profit 3,207 2,402 2,545 1,669 1,685 1,789 2,696Profit Attributable
to Owners of Parent
2,354 1,733 1,816 1,101 1,803 1,287 1,916
Gross Profit Margin 37.9% 36.6% 37.9% 36.6% 39.9% 38.5% 39.6%
Operating Profit Margin 12.3% 9.5% 10.2% 7.2% 7.8% 7.8% 10.9%
4(Millions of yen)
1-2Q of FY 2022.3Consolidated Performance
and Business OverviewConsolidated Financial Results by Half yearly
Total Amount of
Change
of G
ross Profit
Personnel Expenses
General Expenses
Total Amount of
Change
ofSG
A expenses
Depreciation Included
In SGA expenses
5
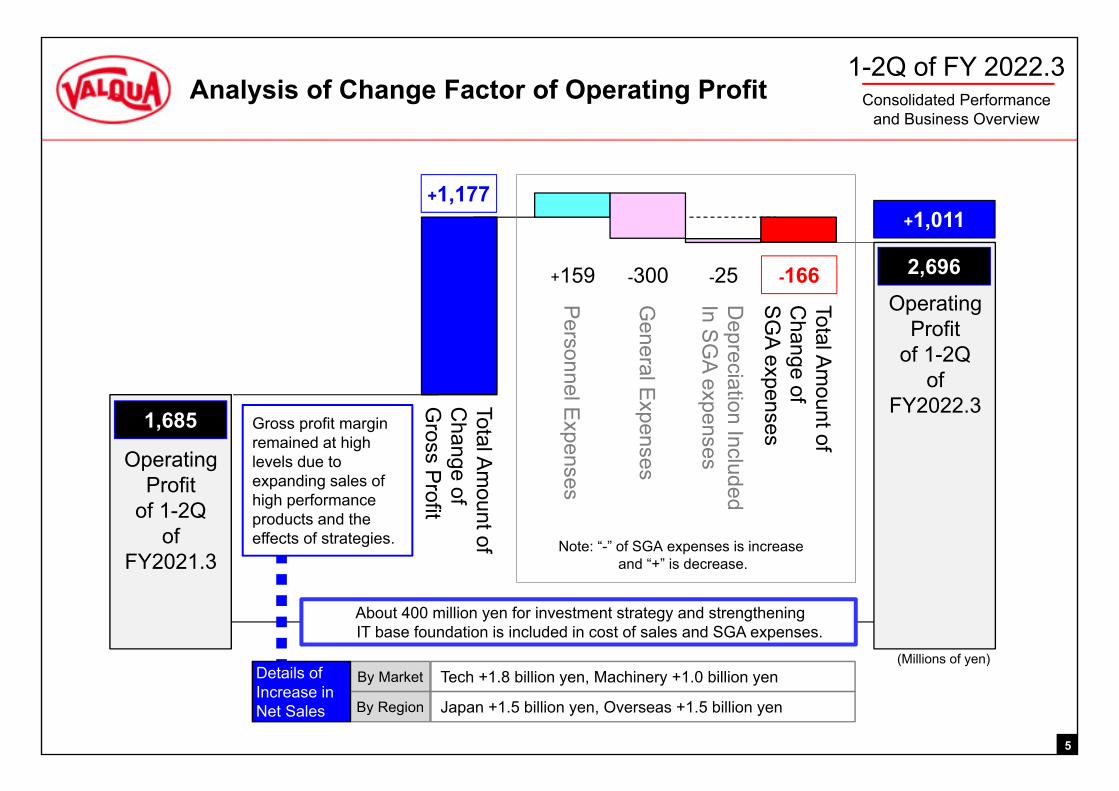
+1,177
+159 -300 -25 -166
+1,011
2,696
1,685
About 400 million yen for investment strategy and strengtheningIT base foundation is included in cost of sales and SGA expenses.
Gross profit margin remained at highlevels due to expanding sales of high performance products and the effects of strategies.
Tech +1.8 billion yen, Machinery +1.0 billion yenBy Market
Japan +1.5 billion yen, Overseas +1.5 billion yenBy Region
Details of Increase in Net Sales
Operating Profit
of 1-2Qof
FY2021.3
Operating Profit
of 1-2Qof
FY2022.3
Note: “-” of SGA expenses is increase and “+” is decrease.
(Millions of yen)
1-2Q of FY 2022.3Consolidated Performance
and Business OverviewAnalysis of Change Factor of Operating Profit

Strengthening supply capacity towards the growing market.Strengthening R&D and expanding business area.Remarkable improvement in production efficiency and quality.Promoting DX
6
Balance Sheet (Summary)
End of FY2020.3
End of FY2021.3
End of 2Q ofFY2021.3
Total Liabilities 13,197 15,417 17,936
Total Net Assets 34,930 37,274 39,474Total
Liabilities and Net Assets
48,128 52,691 57,411
Equity Capital Ratio 69.3% 67.7% 65.7%
Interest-Bearing Debt 3,071 4,153 5,172
Net Interest-Bearing Debt -3,572 -3,946 -2,552
Cash Flows (Summary)
1Q-2Q of FY2020.3
1Q-2Q of FY2021.3
1Q-2Q ofFY2022.3
(YoY)
Operating CF 2,349 2,118 1,443
Investment CF -1,405 -388 -1,916
Free CF 943 1,730 -473
Planning active usage towards accomplishing the “NF2022” strategy and achievement of long-term business aim
(Millions of yen)
Balance Sheet and Cash Flows1-2Q of FY 2022.3
Consolidated Performanceand Business Overview

7
Sales by Industrial Market
1Q-2Q of FY2020.3
1Q-2Q of FY2021.3
1Q-2Q ofFY2022.3
(YoY)
Tech Market 8.1 BY 8.1 BY 9.9 BY(+22.2%)
Machinery Market 8.5 BY 6.9 BY 7.9 BY
(+14.5%)
Plant Market 8.0 BY 6.5 BY 6.7 BY(+3.1%)
Sales by Region
1Q-2Q of FY2020.3
1Q-2Q of FY2021.3
1Q-2Q ofFY2022.3
(YoY)
Japan 17,520 15,045 16,595(+10.3%)
Sales Ratio 70.3% 69.6% 67.1%
Oversea 7,394 6,585 8,145(+23.7%)
Sales Ratio 29.7% 30.4% 32.9%
Asia 5,060 4,373 5,642(+29.0%)
North America 2,259 2,130 2,419
(+13.6%)
Other Area 74 81 82(+1.4%)
• Tech Market : Semiconductor Processing Equipment, Semiconductor Device Maker/Foundries
• Machinery Market : Auto, Mother Machine, Factory Machine, Construction Machine, Heavy Electrical Machine, Vessel, Aircraft
• Plant Market : Petroleum Refining & Chemical, Steel Manufacturing, Electric Power, Plant Construction
(Remarks) In addition to the above three industrial markets, there are fractions and “Other Market.”
(BY=Billions of yen)
Sales by Industrial Market/Sales by Region
(Millions of yen)
1-2Q of FY 2022.3Consolidated Performance
and Business Overview

8
1Q-2Q of FY2020.3
1Q-2Q of FY2021.3
1Q-2Q ofFY2022.3
(YoY)
Sales by Industrial Market (Billions of yen)
Tech Market 4.45 BY 5.00 BY 5.70 BY(+14.0%)
Machinery Market 6.60 BY 5.45 BY 6.60 BY
(+21.1%)
Plant Market 5.20 BY 4.90 BY 4.50 BY(-8.2%)
Sales by Region
Japan 12,306 11,225 12,033(+7.2%)
Oversea 4,009 4,173 4,860(+16.5%)
Sales Ratio 24.6% 27.1% 28.8%
Result by Segment
1Q-2Q of FY2020.3
1Q-2Q of FY2021.3
1Q-2Q ofFY2022.3
(YoY)
Net Sales 16,316 15,398 16,894(+9.7%)
Segment Profit 1,887 2,095 2,305
(+10.0%)
Profit Margin 11.6% 13.6% 13.6%
Half yearly
1-2Q of FY2020.3
3-4Q of FY2020.3
1-2Q of FY2021.3
3-4Q of FY2021.3
1-2Q of FY2022.3
Net Sales 16,316 15,755 15,398 15,951 16,894Segment
Profit 1,887 1,472 2,095 2,065 2,305
Orders Received 15,490 15,932 15,503 15,947 17,859Term-end
Order Backlog
3,406 3,583 3,688 3,684 4,649
Growth in Tech Market in Japan and overseasRecovery in a wide range of Machinery Market
(Millions of yen)
Results by SegmentSeal Products Business
1-2Q of FY 2022.3Consolidated Performance
and Business Overview

9
1Q-2Q of FY2020.3
1Q-2Q of FY2021.3
1Q-2Q ofFY2022.3
(YoY)
Sales by Industrial Market (Billions of yen)
Tech Market 2.15 BY 1.90 BY 2.95 BY(+55.3%)
Machinery Market 1.85 BY 1.40 BY 1.30 BY
(-7.1%)
Plant Market 2.80 BY 1.60 BY 2.20 BY(+37.5%)
Sales by Region
Japan 4,420 3,149 3,844(+22.1%)
Oversea 2,445 1,787 2,660(+48.9%)
Sales Ratio 35.6% 36.2% 40.9%
Result by Segment
1Q-2Q of FY2020.3
1Q-2Q of FY2021.3
1Q-2Q ofFY2022.3
(YoY)
Net Sales 6,865 4,936 6,504(+31.8%)
Segment Profit 409 -339 483
(-→+)
Profit Margin 6.0% -6.9% 7.4%
Half yearly
1-2Q of FY2020.3
3-4Q of FY2020.3
1-2Q of FY2021.3
3-4Q of FY2021.3
1-2Q of FY2022.3
Net Sales 6,865 6,223 4,936 5,805 6,504
Segment Profit 409 145 -339 -249 483
Orders Received 6,814 5,909 4,461 6,841 8,214Term-end
Order Backlog
3,550 3,236 2,762 3,797 5,506(Millions of yen)
Results by SegmentHigh Performance Plastics Products Business
1-2Q of FY 2022.3Consolidated Performance
and Business Overview
Expansion of Tech Market to domestic SPE and overseas device manufacturersImproved profitability through business structural reforms

10
1Q-2Q of FY2020.3
1Q-2Q of FY2021.3
1Q-2Q ofFY2022.3
(YoY)
Sales by Industrial Market (Billions of yen)
Tech Market 1.45 BY 1.15 BY 1.20 BY(+4.3%)
Other Market 0.20 BY 0.10 BY 0.10 BY(ー)
Sales by Region
Japan 793 670 717(+6.9%)
Oversea 939 624 623(-0.2%)
Sales Ratio 54.2% 48.2% 46.5%
Result by Segment
1Q-2Q of FY2020.3
1Q-2Q of FY2021.3
1Q-2Q ofFY2022.3
(YoY)
Net Sales 1,733 1,295 1,341(+3.5%)
Segment Profit 248 -69 -91
(-→-)
Profit Margin 14.3% -5.4% -6.9%
Half yearly
1-2Q of FY2020.3
3-4Q of FY2020.3
1-2Q of FY2021.3
3-4Q of FY2021.3
1-2Q of FY2022.3
Net Sales 1,733 1,317 1,295 1,329 1,341Segment
Profit 248 51 -69 -26 -91
Orders Received 1,772 1,219 1,266 1,316 1,496Term-end
Order Backlog
323 225 196 183 339
High demand for silicon wafer reclaim businessCOVID-19 slows sales of H&S and other new businesses
(Millions of yen)
Results by SegmentSilicon Wafer Reclaim and Other Businesses
1-2Q of FY 2022.3Consolidated Performance
and Business Overview

11
1Q of FY2021.3
2Q of FY2021.3
3Q of FY2021.3
4Q ofFY2021.3
1Q of FY2022.3
2Q of FY2022.3
Orders R
eceived
Consolidated 10,475 10,756 11,092 13,013 14,506 13,063Seal 7,843 7,660 7,429 8,518 8,774 9,084HPP 1,957 2,503 2,970 3,870 5,015 3,198
SWR & Other 674 592 692 624 716 779
Net Sales
Consolidated 10,960 10,670 11,117 11,968 12,151 12,588Seal 7,916 7,482 7,726 8,224 8,488 8,405HPP 2,342 2,593 2,742 3,063 2,994 3,510
SWR & Other 702 593 649 680 668 672
Ord
er Back
log
Consolidated 6,560 6,646 6,620 7,665 10,020 10,495Seal 3,510 3,688 3,390 3,684 3,970 4,649HPP 2,852 2,762 2,990 3,797 5,818 5,506
SWR & Other 197 196 239 183 231 339
<Seal Products Business> Continued high level of demand for the Tech Market
< High Performance Plastics Products Business>
Reflecting large orders for special tank products
Order Backlog
<Seal Products Business> Continued high level of demand for the Tech Market
<High Performance Plastics Products Business>
Rebound from large projects for the Tech Market and Plant Market
Orders Received
Change Factor Compared to Previous Quarter
Results by SegmentQuarterly Orders Received/Net Sales/Order Backlog
*HPP=High Performance Plastics Businesses*SWR & Other=Silicon Wafer Reclaim and Other Businesses
(Millions of yen)
1-2Q of FY 2022.3Consolidated Performance
and Business Overview
1Q-2Q of FY2020.3
1Q-2Q of FY2021.3
1Q-2Q ofFY2022.3
(YoY)
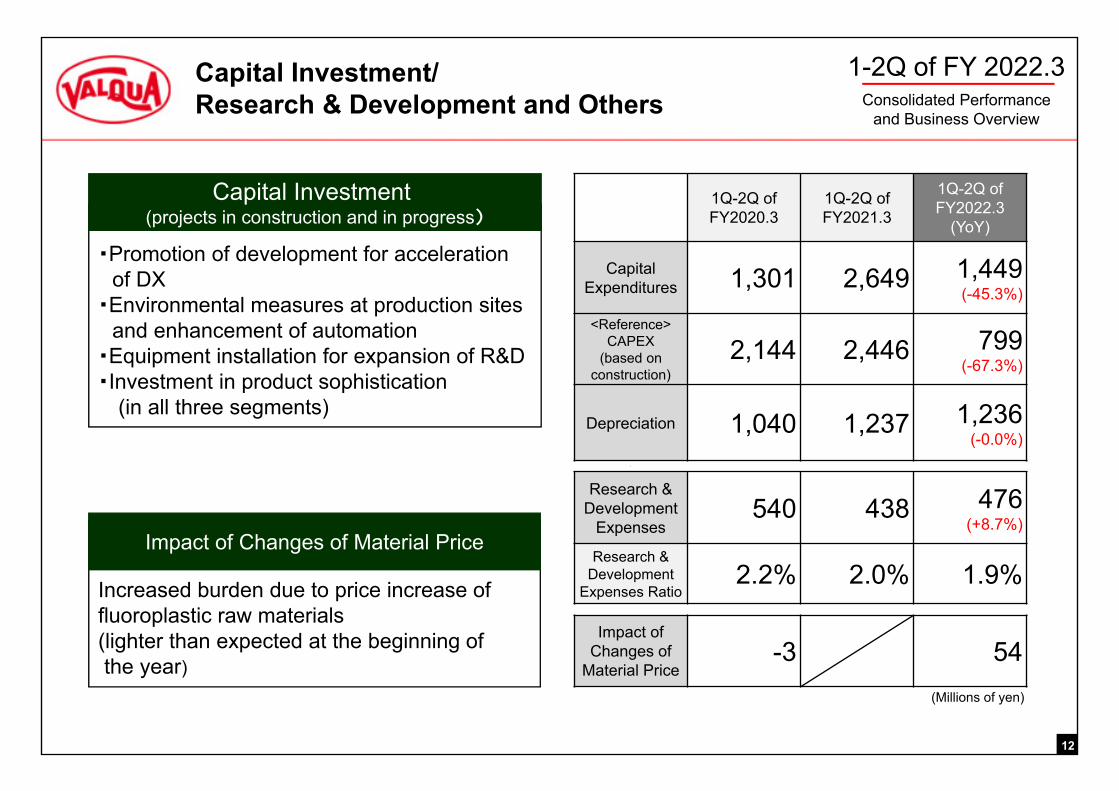
Capital Expenditures 1,301 2,649 1,449
(-45.3%)
<Reference>CAPEX
(based on construction)
2,144 2,446 799 (-67.3%)
Depreciation 1,040 1,237 1,236(-0.0%)
1
Research & Development
Expenses540 438 476
(+8.7%)
Research & Development
Expenses Ratio 2.2% 2.0% 1.9%
Impact of Changes of
Material Price-3 54
12
・Promotion of development for accelerationof DX
・Environmental measures at production sitesand enhancement of automation
・Equipment installation for expansion of R&D・Investment in product sophistication
(in all three segments)
Capital Investment (projects in construction and in progress)
Increased burden due to price increase of fluoroplastic raw materials (lighter than expected at the beginning ofthe year)
Impact of Changes of Material Price
Capital Investment/ Research & Development and Others
1-2Q of FY 2022.3Consolidated Performance
and Business Overview
(Millions of yen)

Influence on Results of 1Q-2Q of FY2022.3Influence on Company Activities such as Production・Operating rates at ASEAN production sites due to suspension of employees' attendance ・There were no particular changes in the procurement of raw materials and parts in
Japan and overseas ・Continued remote work and staggered working hours at all domestic sites ・Working according to local conditions at overseas sites
Influence on Sales due to Outside Company Factors・There was a slight negative impact on sales to the Machinery Market due to problems in
the supply chain on the customer side (parts shortage) ・Demand continued in the Tech Market against the background of the global increase in
remote work
Strengthening Business Continuity with the Post-COVID-19 Outlook・Increase engagement in remote work systems and expand measures related to
communication activation ・Further increase flexibility and mobility of production systems ・Further promote diversification of raw material suppliers
13
Impact of the Spread of the COVID-191-2Q of FY 2022.3
Consolidated Performanceand Business Overview

Efforts to Create Value
Received an award from Lam Research Corp., a U.S. semiconductor production equipmentmanufacturer
New Plant in Taiwan, New Core Base forStrategic Product “Special Fluorocarbon Plastic Tank”
Capital and Business Alliance with CONNECTEC JAPAN Corp.Started joint development of semiconductor packaging technology
■ Received the 2021 Supplier Excellence Award 2021"General Excellence"
■ Highly evaluated for development and customer response capabilities
■ Manufacturing the “World's Cleanest Tank”■ Meeting global demand for semiconductors and high-purity chemicals
CEO Toshikazu Takisawaholding the trophy
14
1-2Q of FY 2022.3Consolidated Performance
and Business Overview

Stockholders Return
End of 2Q (Interim) Dividend
Year-endDividend
AnnualDividend
Treasury Stock Acquisitions Total Return Ratio
FY2020.3 50.0 yen 50.0 yen 100.0 yen 60.3%
FY2021.3 45.0 yen 50.0 yen 95.0 yen 54.2%
FY2022.3 50.0 yen 55.0 yen(Forecast)
105.0 yen(Forecast)
―50.1%
(Only Dividend Forecast)
15
Set the total amount of dividend and treasury stock acquisitions as a “Stockholders Return,” aim for 50% “Total Return Ratio” (total return amount ratio to profit attributable to owners of parent), and implement stockholders return with the below items in consideration.• Need for capital investment, research & development investment as well as investment strategy for future
maximization of enterprise value.• Importance of creating the Company’s base foundation such as strengthening risk management system and
expansion of personnel development as well as preparation for change of business environment.
Our Group adopts the following standard for consolidated stockholders total return ratioConsolidated Stockholders Total Return Ratio=(Total Dividend of Current FY+Treasury Stock Acquisitions Based on Current FY’s Results) ÷Current FY’s Earnings
1-2Q of FY 2022.3Consolidated Performance
and Business Overview

1-2Q (1H) of the Fiscal Year Ending March 31, 2022 Consolidated Performance and Business Overview
2H of the fiscal Year Ending March 31, 2022 and Full-year Forecast and Forward-looking Statements
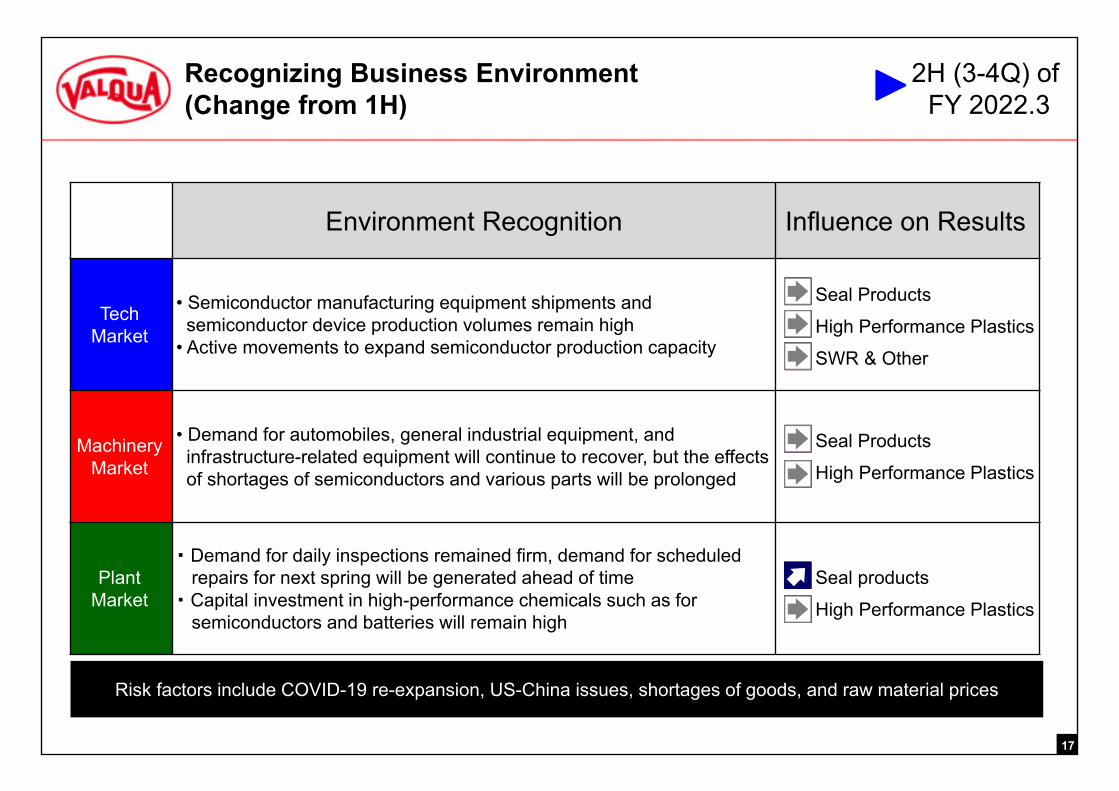
Environment Recognition Influence on Results
Tech Market
• Semiconductor manufacturing equipment shipments and semiconductor device production volumes remain high
• Active movements to expand semiconductor production capacity
Seal Products
High Performance Plastics
SWR & Other
Machinery Market
• Demand for automobiles, general industrial equipment, and infrastructure-related equipment will continue to recover, but the effects of shortages of semiconductors and various parts will be prolonged
Seal Products
High Performance Plastics
Plant Market
・ Demand for daily inspections remained firm, demand for scheduled repairs for next spring will be generated ahead of time
・ Capital investment in high-performance chemicals such as for semiconductors and batteries will remain high
Seal products
High Performance Plastics
Risk factors include COVID-19 re-expansion, US-China issues, shortages of goods, and raw material prices
17
Recognizing Business Environment (Change from 1H)
2H (3-4Q) ofFY 2022.3
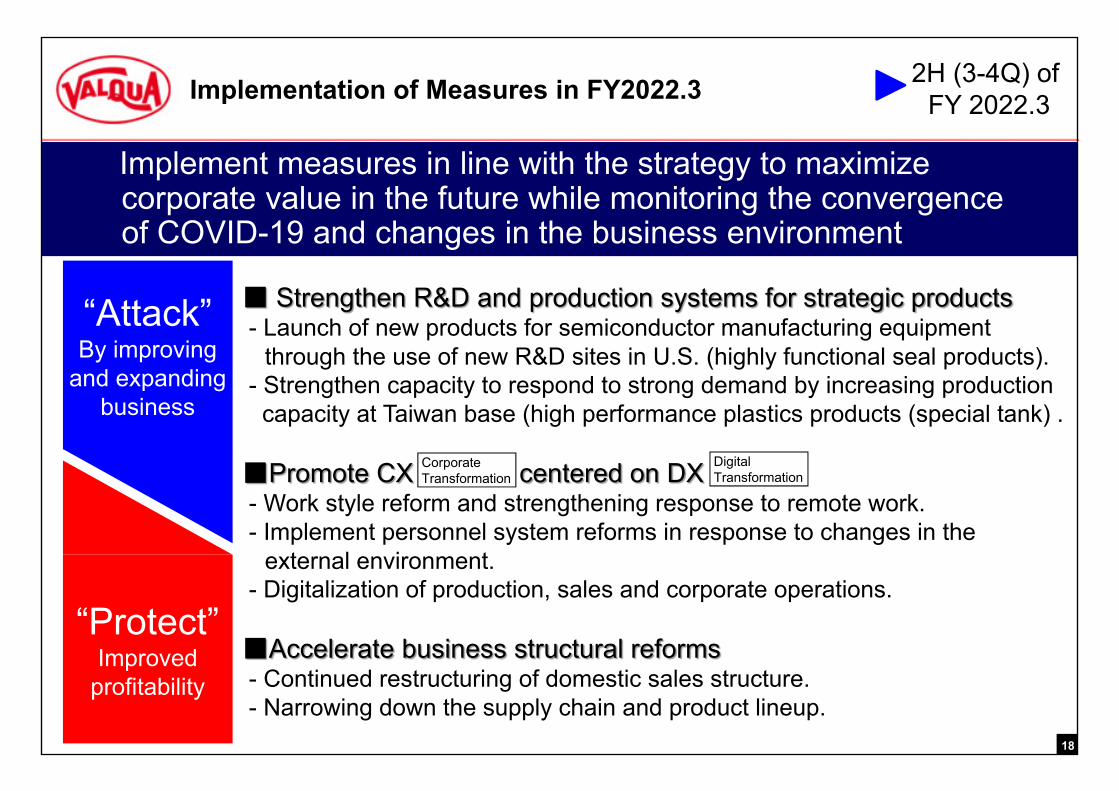
■ Strengthen R&D and production systems for strategic products- Launch of new products for semiconductor manufacturing equipment
through the use of new R&D sites in U.S. (highly functional seal products).- Strengthen capacity to respond to strong demand by increasing production
capacity at Taiwan base (high performance plastics products (special tank) .
■Promote CX centered on DX- Work style reform and strengthening response to remote work.- Implement personnel system reforms in response to changes in the
external environment.- Digitalization of production, sales and corporate operations.
■Accelerate business structural reforms- Continued restructuring of domestic sales structure.- Narrowing down the supply chain and product lineup.
Implement measures in line with the strategy to maximizecorporate value in the future while monitoring the convergenceof COVID-19 and changes in the business environment
“Protect”Improved
profitability
“Attack”By improving
and expanding business
DigitalTransformation
CorporateTransformation
Implementation of Measures in FY2022.3
18
2H (3-4Q) ofFY 2022.3
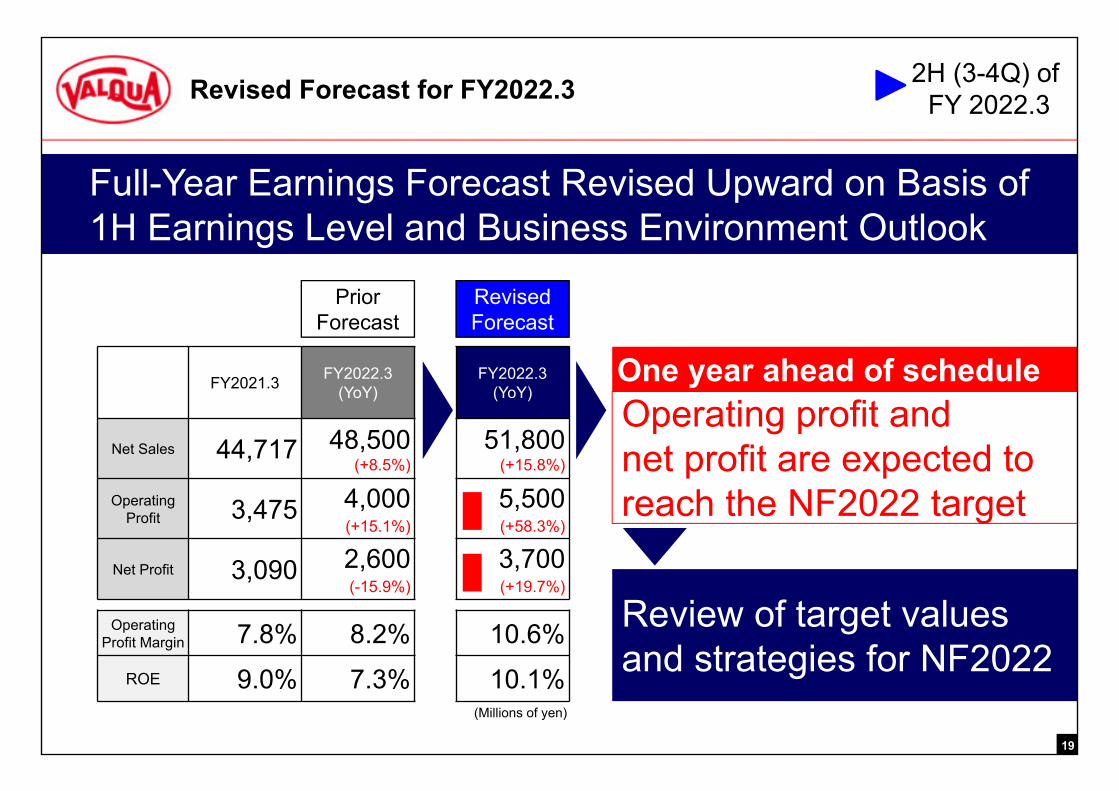
FY2021.3 FY2022.3(YoY)
FY2022.3(YoY)
Net Sales 44,717 48,500(+8.5%)
51,800(+15.8%)
Operating Profit 3,475 4,000
(+15.1%)5,500(+58.3%)
Net Profit 3,090 2,600(-15.9%)
3,700(+19.7%)
Operating Profit Margin 7.8% 8.2% 10.6%
ROE 9.0% 7.3% 10.1%
19
Full-Year Earnings Forecast Revised Upward on Basis of 1H Earnings Level and Business Environment Outlook
PriorForecast
RevisedForecast
Operating profit andnet profit are expected toreach the NF2022 target
One year ahead of schedule
Review of target valuesand strategies for NF2022
Revised Forecast for FY2022.3
(Millions of yen)
2H (3-4Q) ofFY 2022.3

Sales by Industrial Market
FY2021.3<Prior>
FY2022.3(YoY)
<Revised>FY2022.3
(YoY)
Tech Market 16.5 BY 18.3 BY
(+10.9%)21.1 BY
(+27.9%)
Machinery Market 14.6 BY 15.5 BY
(+6.2%)16.4 BY
(+12.3%)
Plant Market 13.3 BY 14.2 BY
(+6.8%)14.1 BY
(+6.0%)
Sales by Region
Japan 30,483 31,850(+4.5%)
34,100(+11.9%)
Sales Ratio 68.2% 65.7% 65.8%
Oversea 14,233 16,650(+17.0%)
17,700(+24.4%)
Sales Ratio 31.8% 34.3% 34.2%
Sales & Profit by Segment
FY2021.3<Prior>
FY2022.3(YoY)
<Revised>FY2022.3
(YoY)
Seal Products Business
Net Sales 31,349 32,000(+2.1%)
34,900(+11.3%)
Segment Profit 4,160 3,600
(-13.5%)4,500
(+8.2%)
Profit Ratio 13.3% 11.3% 12.9%
High Performance
Plastics Products Business
Net Sales 10,742 13,300(+23.8%)
13,700(+27.5%)
Segment Profit -588 300
(-→+)900(-→+)
Profit Ratio -5.5% 2.3% 6.6%
SWR & Other
Businesses
Net Sales 2,625 3,200(+21.9%)
3,200(+21.9%)
Segment Profit -96 100
(-→+)100(-→+)
Profit Ratio -3.7% 3.1% 3.1%20
(Remarks) The combination of fields that don’t fall under the above is “Other Market.”
Details of Revised Forecast 2H (3-4Q) ofFY 2022.3
(Millions of yen)
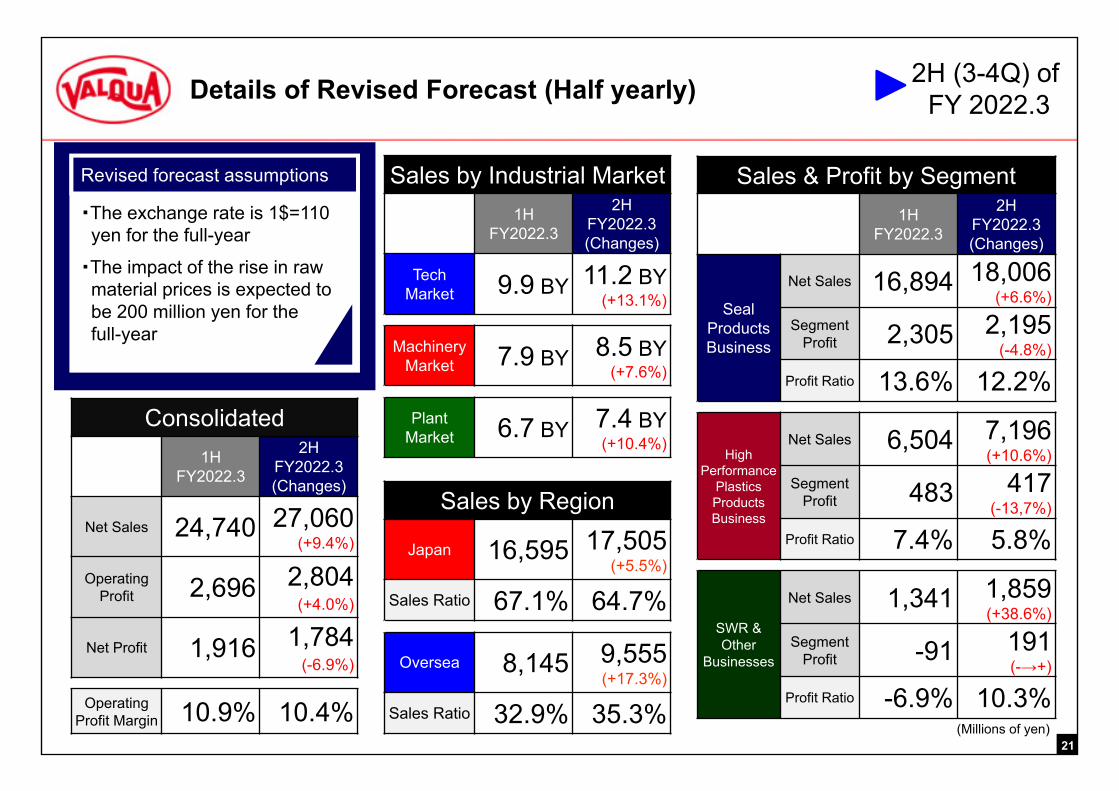
・The exchange rate is 1$=110 yen for the full-year
・The impact of the rise in raw material prices is expected to be 200 million yen for thefull-year
Revised forecast assumptions Sales by Industrial Market1H
FY2022.3
2HFY2022.3(Changes)
Tech Market 9.9 BY 11.2 BY
(+13.1%)
Machinery Market 7.9 BY 8.5 BY
(+7.6%)
Plant Market 6.7 BY 7.4 BY
(+10.4%)
Sales by Region
Japan 16,595 17,505(+5.5%)
Sales Ratio 67.1% 64.7%
Oversea 8,145 9,555(+17.3%)
Sales Ratio 32.9% 35.3%
Sales & Profit by Segment1H
FY2022.3
2HFY2022.3(Changes)
Seal Products Business
Net Sales 16,894 18,006(+6.6%)
Segment Profit 2,305 2,195
(-4.8%)
Profit Ratio 13.6% 12.2%
High Performance
Plastics Products Business
Net Sales 6,504 7,196(+10.6%)
Segment Profit 483 417
(-13,7%)
Profit Ratio 7.4% 5.8%
SWR & Other
Businesses
Net Sales 1,341 1,859(+38.6%)
Segment Profit -91 191
(-→+)
Profit Ratio -6.9% 10.3%21
Consolidated1H
FY2022.3
2HFY2022.3(Changes)
Net Sales 24,740 27,060(+9.4%)
Operating Profit 2,696 2,804
(+4.0%)
Net Profit 1,916 1,784(-6.9%)
Operating Profit Margin 10.9% 10.4%
Details of Revised Forecast (Half yearly) 2H (3-4Q) ofFY 2022.3
(Millions of yen)

Medium-term Business Plan“NF2022”
Focusing on the Coming100th Anniversary
<References>

We will become one as a Group and work on reconstructing the Company’s base foundation under “THE VALQUA WAY” to implement further sound and sustainable growth of the Company beyond the 100th anniversary and into the next age.
NF(New Frontier)2022
23
• Establishing a system that can resist environment change• Acquiring value creation capacity that will work in the next age
Reform for the Coming 100th Year
Basic Policy (1)
We will improve and continue part of strategies from the previous medium-term plan “NV・S8” and will build up cases of success facing challenges in “NF2022.”

Respond to the movement of the industrial map influenced by the spread of the COVID-19and changes in Japan-Foreign Countries, US-China relations flexibly and dynamically.
1.Expanding profitability of existing business area andacquisition of new business area by selection and concentration
Implement concentrated investment on strategy for growing market.Acquire new business opportunity through penetration of H&S* concept.
2.Strong Implementation of Open Innovation(Accelerate Partnership, M&A and such)
Strengthen development capabilities of new fields and new productswithout being influenced by old viewpoints.
3.Accelerate Aggressive Investment (Research Development and Personnel Development)
Improve value creation capacity by expansion of R&D andvaluing each employee as “human capital.”
4.Thoroughly utilize IT to improve efficiency of all divisions and improving customer service
Improve product quality by work quality of the new infrastructure system and new production technique.
5.Implement dynamic measures that will lead to active global human resourcesPromote borderless human resource by making Group managers multinational.
24
Basic Policy (2)
*Hard & Seal engineering service

Management Target Value
25
As the first step to achieving the long-term management target, work on recovering operating profit margin to 10% and becoming a resilient company
Final FY of “NV・S8”
Final FY of “NF2022”
FY2020.3 FY2023.3 % Change
Net Sales 48,212 55,000 +14.1%Operating
Profit 4,214 5,500 +30.5%Profit
Attributable to Owners of
Parent2,918 3,700 +26.8%
Operating Profit Margin 8.7% 10.0% +1.3pt
ROE 8.8%More than
10.0%More than
+1.2pt
Important factors and issues for achievement
Expansion of sales for strategic market.Contribution to results with H&S concept products.Creation of new value by strengthening R&D and implementing M&A.Swift response towards business environment change post COVID-19.Swift implementation of “selection and concentration” without sanctuaries.
(Millions of yen)

15.7 billion yen 20.8 billion yen
Net Sales for Tech Market
Final FY of “NV S8”Sales by Industrial Market
Tech 15.7
Machinery 16.9
Plant 15.2
Other 0.2
Final FY of “NF2022”Sales by Industrial Market
Tech 20.8Machinery 17.3
Plant 16.5Other 0.4
High performance seal products for Tech Market・・・Increase in market share in the US Established an exclusive R&D base ・・・Expansion of production capacity Full operation of base in China and
upgrading other bases
Strategic Product (1)
Strategic Product (2)
High performance plastics products (special tank) for Tech and Plant Market ・・・Respond to increase in demand in US, China, and Taiwan
Capacity increase of core base ・・・Improve enterprise value by related service such as life diagnosis
Machinery 35.1%
Plant 31.5%
Tech 32.6%
Tech37.8%
Machinery 31.5%
Plant30.0%
FY2023.3
FY2020.3
Main Strategy Theme (1)Strategic Products for Growing Markets
26
(Billions of yen)
(Billions of yen)
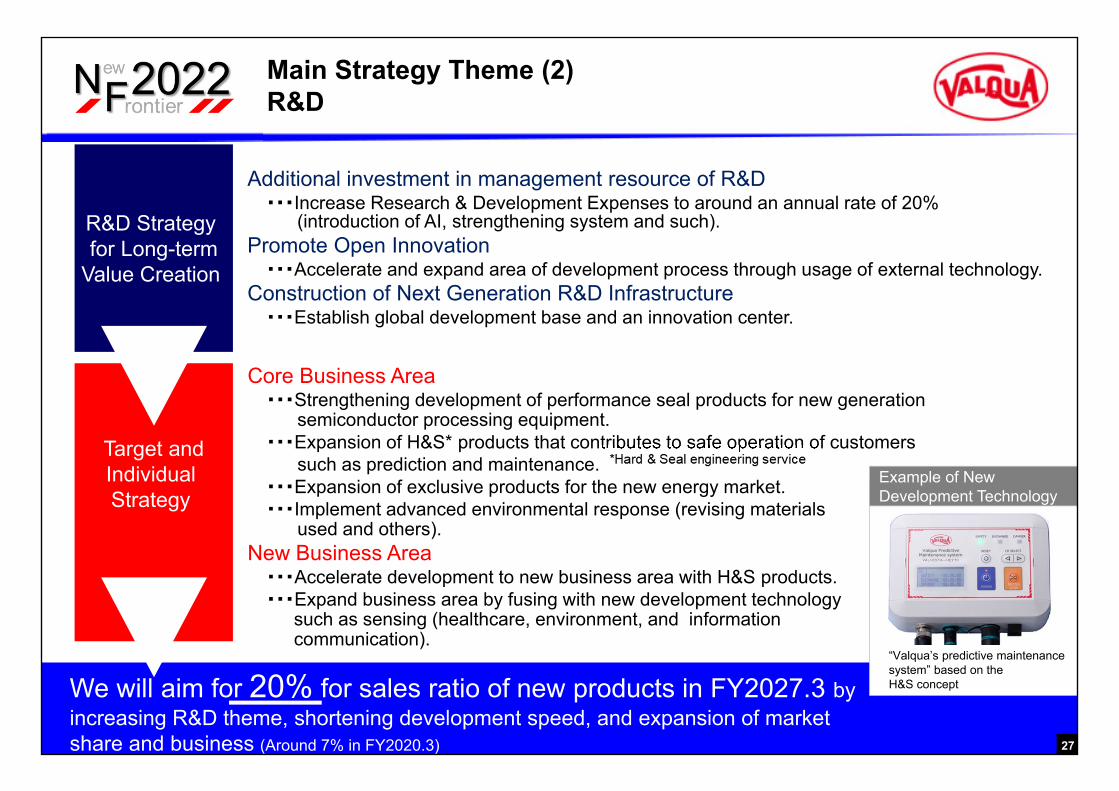
Main Strategy Theme (2)R&D
27
Additional investment in management resource of R&D・・・Increase Research & Development Expenses to around an annual rate of 20%
(introduction of AI, strengthening system and such).Promote Open Innovation
・・・Accelerate and expand area of development process through usage of external technology.Construction of Next Generation R&D Infrastructure
・・・Establish global development base and an innovation center.
R&D Strategy for Long-term
Value Creation
Core Business Area・・・Strengthening development of performance seal products for new generation
semiconductor processing equipment.・・・Expansion of H&S* products that contributes to safe operation of customers
such as prediction and maintenance.・・・Expansion of exclusive products for the new energy market.・・・Implement advanced environmental response (revising materials
used and others).New Business Area
・・・Accelerate development to new business area with H&S products.・・・Expand business area by fusing with new development technology
such as sensing (healthcare, environment, and information communication).
Target andIndividual Strategy
We will aim for 20% for sales ratio of new products in FY2027.3 by increasing R&D theme, shortening development speed, and expansion of market share and business (Around 7% in FY2020.3)
“Valqua’s predictive maintenance system” based on the H&S concept
Example of New Development Technology

Promote a strategy that anticipates future sustainable growth and maximization of corporate value
・・・Improve efficiency and security by reforming infrastructure.・・・Eradicate human error by introducing AI in the SGA, production, and quality management process.
・・・Implement investment of management resource for strategic products and distinguish low profit products.・・・Focus on improving efficiency by optimum arrangement of bases and improvement of quality of indirect sales
network.
・・・Introducing company-wide teleworking.・・・Improving employee motivation by reforming personnel and evaluation system.
Growth of Company and Employee through Engagement
Responding to Work-style Reform
Implementing Business Reform
Promoting adoption of IT and automation
Improve Business Competitiveness by Focusing on “Selection and Concentration”
Strengthen Risk Resilience by Improving Efficiencyand Security
Working towards FY2027.3
Working towards FY2027.3
Working towards FY2027.3
28
Main Strategy Theme (3)Creating Base Foundation and Improving Efficiency

Final FY of “NV S8” Final FY of “NF2022”
FY2020.3 FY2023 % Change
Tech Market 15.7 20.8 +32.5%
Machinery Market 16.9 17.3 +2.4%
Plant Market 15.2 16.5 +8.6%
Final FY of “NV S8” Final FY of “NF2022”
FY2020.3 FY2023 % Change
Japan 33,958 37,000 +9.0%
Sales Ratio 70.4% 67.3% -3.1pt
Oversea 14,254 18,000 +26.3%
Sales Ratio 29.6% 32.7% +3.1pt
• Tech Market : Semiconductor Processing Equipment, Semiconductor Device Maker/Foundries
• Machinery Market : Auto, Mother Machine, Factory Machine, Construction Machine, Heavy Electrical Machine, Vessel, Aircraft
• Plant Market : Petroleum Refining & Chemical, Steel Manufacturing, Electric Power, Plant Construction
(Remarks) In addition to the above three industrial markets, the combination of fields that don’t fall under the above is “Other Market.”
Management Target and Planning Target Value (1)Sales by Industrial Market/Sales by Region
Net sales for oversea has not been set since change in the customer's supply chain is assumed.
29
(Billions of yen) ( Millions of yen)

Final FY of “NV・S8”
Final FY of “NF2022”
FY2020.3 FY2023.3 % Change
Seal Products Business
Net Sales 32,071 36,200 +12.9%
Segment Profit 3,360 4,500 +34.0%
High Performance
Plastics Products Business
Net Sales 13,089 15,400 +17.7%
Segment Profit 554 1,000 +80.5%
SWR & Other Businesses
Net Sales 3,051 3,400 +11.4%
Segment Profit 299 0 ー
Management Target and Planning Target Value (2)Results by Segment/Capital Investment
2 Years Total of
“NV・S8”
3 Years Total of
“NF2022”Capital
Expenditures(based on
construction)
6.4billion yen
12.0billion yen
<Production Related>• Capacity increase and upgrading
production capacity of strategic products・・・ High performance seal products
(Japan, China, and Korea)・・・ High performance plastic special tank
products (Taiwan)<R&D>• Newly establish exclusive R&D base for
strategic products・・・ High performance seal products (US)
<Creating Base Foundation>• Reforming the infrastructure system• Development of teleworking system• Strengthening information security
Main Investment Projects
30
(Millions of yen)

Medium-term Business Plan“NF2022”
Focusing on the Coming100th Anniversary
<References>

Corporate Image we aim to become in the coming 100th anniversary
A Challenging Company that Challenges the Future and the Unknown
- To contribute to the richness of human race and global environment -
1. Endless pursuit and monitoring of growth strategy.2. Strengthening management foundation that will
solidify company growth.3. Active engagement in “environment, society, and
corporate governance” in becoming a better global citizen.
32
Focusing on the Coming 100th Anniversary- Corporate Image We Aim for -

FY2020.3 FY2027.3Change
Average Annual Change
Net Sales
48.2billion yen
80.0billion yen
65.9%7.5%
ROE 8.8% 15.0% +6.2pt+0.9pt
33
Setting high level targets that cannot be reached without a challenge
Focusing on the Coming 100th Anniversary- Long-term Management Target -
Ambitious development towards new business and fields.
Active implementation of M&A and Partnership.
Pursuit of best balance of capital efficiency and financial solvency.
Practicing corporate activities that is strongly conscious of SDGs.
R&D
H&S
M&AChallenge
++ ×
+ = 2 0 2 7
