simultaneous wind and solar energy harvesting with
TRANSCRIPT

The University of Manchester Research
Simultaneous wind and solar energy harvesting withinverted flagsDOI:10.1016/j.apenergy.2019.01.246
Document VersionAccepted author manuscript
Link to publication record in Manchester Research Explorer
Citation for published version (APA):Silva Leon, J., Cioncolini, A., Nabawy, M., Revell, A., & Kennaugh, A. (2019). Simultaneous wind and solar energyharvesting with inverted flags. Applied Energy, 239, 846-858. https://doi.org/10.1016/j.apenergy.2019.01.246
Published in:Applied Energy
Citing this paperPlease note that where the full-text provided on Manchester Research Explorer is the Author Accepted Manuscriptor Proof version this may differ from the final Published version. If citing, it is advised that you check and use thepublisher's definitive version.
General rightsCopyright and moral rights for the publications made accessible in the Research Explorer are retained by theauthors and/or other copyright owners and it is a condition of accessing publications that users recognise andabide by the legal requirements associated with these rights.
Takedown policyIf you believe that this document breaches copyright please refer to the University of Manchester’s TakedownProcedures [http://man.ac.uk/04Y6Bo] or contact [email protected] providingrelevant details, so we can investigate your claim.
Download date:19. Mar. 2022

1
Simultaneous wind and solar energy harvesting with inverted flags
Jorge Silva-Leona,b, Andrea Cioncolinia, Mostafa R. A. Nabawya, Alistair Revella, Andrew
Kennaugha
a School of Mechanical, Aerospace and Civil Engineering, University of Manchester, George Begg
Building, Sackville Street, M1 3BB, Manchester, United Kingdom.
b Escuela Superior Politécnica del Litoral, ESPOL, Facultad de Ingeniería en Mecánica y Ciencias
de la Producción, Campus Gustavo Galindo Km 30.5 Vía Perimetral, P.O. Box 09-01-5863,
Guayaquil, Ecuador.
Abstract
This paper presents a novel wind/solar energy-harvesting device based on the inverted flag
concept that combines flexible piezoelectric strips with flexible photovoltaic cells to
simultaneously harvest both wind and solar energy. Three inverted flags built using off-the-
shelf components were experimentally investigated under controlled wind and illumination
conditions to analyse their dynamics and electrical power generation capability. Our results
provide an improved understanding of the dynamics of inverted flags that incorporate flexible
piezoelectric strips and flexible solar panels, and indicate that the piezoelectric strips mainly
increase the damping of the flags, while the solar panels act as an added mass. The power
measurements show that the wind/solar energy-harvesting device proposed here is a viable
concept that is capable of generating up to 3-4 mW of total power, enough to meet the
demand of remote sensors and small-scale portable electronics, for wind speeds varying
from 0 m/s (calm) to about 26 m/s (storm/whole gale) and 1.8 kLux constant light exposure,
suggesting a rather diversified range of potential practical applications.
1. Introduction
Environmental energy harvesting is emerging as an effective technology for powering
remote sensors, data-loggers, data-transmitters and small-scale portable electronics for use
in environmental sensing, equipment and process monitoring, internet of things, and smart
city applications where data collection sensors are used to optimize assets and resources
management [1–5]. Remote sensors and portable electronic devices typically operate in the
micro-Watt to milli-Watt power range and cannot be deployed using conventional batteries
as the primary power source, irrespective of the progress achieved in recent years in
reducing the power demand of micro-electronic systems and in designing high-energy

2
density batteries. Conventional batteries have limited operational life and require frequent
replacement, while their safe disposal poses environmental challenges. This is in conflict
with the sustainable, deploy-and-forget strategy that is anticipated for remote sensors.
Moreover, conducting battery maintenance for a large-scale sensor network which could
conceivably comprise very large numbers of sensor nodes would be prohibitive. Energy
harvesting technologies allow converting ambient energy into usable electrical energy and
can therefore replace batteries as the main power source, thus allowing remote sensors and
small electronic devices to be self-powered and therefore completely self-sustaining.
Environmental energies present as ambient background that may be scavenged for low-
power applications include kinetic energy from wind [6-16], waves [17], water flows [18–20]
and vibration [21–27], thermal energy in the form of temperature variations in space or time
[28]–[30], solar radiant energy [31], electromagnetic energy from radio and television
broadcasting [32], and chemical energy from salinity or other concentration gradients [33].
Wind energy harvesting with piezoelectric materials is emerging as an effective alternative
that is particularly suited for low-power and portable applications [9]. Piezoelectric wind
energy harvesters typically comprise a beam, plate or other structural element that is
designed to undergo flow-induced motion when exposed to wind flow [34–50]. The harvester
can be realized either by using an integrated piezoelectric material or can be bonded with a
piezoelectric patch, so that the flow-induced motion periodically bends the piezoelectric
material, which in turn converts mechanical strain into electric energy. Due to their high
flexibility, light weight, long endurance in cyclic operation, low cost and widespread
availability, flexible piezoelectric polymers such as PVDF [51] are particularly attractive for
wind energy harvesting. To maximise the output power, these materials should undergo
large amplitude deformations and sustained periodic motion, such as a large-amplitude limit-
cycle oscillation [52], [53]. A large amplitude deformation yields large strain levels, and
therefore large electrical output, while a continuous periodic motion assures a sustained
electrical output without interruptions.
A particularly attractive configuration for wind energy harvesters that incorporate flexible
piezoelectric polymers is the inverted flag, schematically shown in Fig. 1(a). Different from a
regular flag, which is fixed at the leading edge located upstream and free to flap at the
trailing edge located downstream, the inverted flag is free to flap at the upstream leading
edge and fixed at the downstream trailing edge. Depending on the mechanical properties of
the flag constitutive material, on their geometry and on the wind velocity, inverted flags may
exhibit three main dynamic responses, as schematically shown in Fig. 1(b-d): 1) static
aligned with the incoming flow, or undergoing small-amplitude vibration around the
equilibrium configuration aligned with the incoming flow; 2) a large-amplitude limit-cycle

3
flapping oscillation; and 3) a small vibration around a fully deflected configuration [54–58].
Among these dynamic responses, the most appropriate for energy scavenging is the large-
amplitude limit-cycle flapping oscillation: the amplitude of motion is much larger than that
achieved with regular flags and can span up to ± 90-100 degrees, yielding particularly high
strain levels that are ideal for the operation of flexible piezoelectric polymers. During limit-
cycle flapping, the motion of inverted flags is periodic with one dominant frequency, as
required to yield sustained electrical output without interruptions. Finally, the instantaneous
configuration of inverted flags during limit-cycle flapping is a cylindrical surface that is
entirely concave or entirely convex. This is particularly important because it ensures no
electrical charge cancellation during operation with flexible piezoelectric polymers.
Figure 1. (a) Schematic representation of an inverted flag. (b,c,d) Schematic representation of the three main dynamic responses of inverted flags: (b) static aligned with the incoming flow or undergoing small-amplitude vibration around the equilibrium configuration aligned with the incoming flow; (c) large-amplitude limit-cycle flapping oscillation (θ represents the angular amplitude of motion); and (d) small vibration around a fully deflected configuration (wind direction is from left to right).
Orrego and co-workers [45] recently demonstrated the feasibility and the potential of inverted
flags realized with flexible piezoelectric polymers as wind energy harvesters. In particular,
they constructed inverted flags by stacking together single-poled PVDF strips, and
experimentally investigated twelve flag configurations with different geometry. In controlled
flow conditions inside a wind tunnel their flags exhibited large-amplitude limit-cycle flapping
at wind velocities in the range of about 2 m/s to 9 m/s, producing up to 5 mW/cm3 of
electrical power density (power density evaluated based on the active volume of the flag

4
only). Using a purpose-built self-alignment mechanism that kept the inverted flag in line with
the wind direction, they were also able to harvest energy from ambient wind, notably enough
energy to power a temperature sensor.
In this work, we propose a novel approach to simultaneously harvest both wind and solar
energy that can be considered a step-change evolution of the concept proposed by Orrego
and co-workers [45] previously discussed. The new harvester that we describe in what
follows is an inverted flag that, in addition to flexible piezoelectric strips, also incorporates
flexible solar panels, so that it can simultaneously harvest both wind and solar energy. To
the best of our knowledge, this is the first attempt to simultaneously harvest wind and solar
energy using inverted flags. As is well known, ambient background energy sources are
inherently intermittent. A viable strategy for accommodating such variability is found in
diversifying the energy source by aiming to harvest multiple ambient energies at the same
time [59], an approach already successfully used to simultaneously harvest wind and wave
energies [60], and wind and structural vibration energies [61]. Wind and solar energies, in
particular, happen to have intermittencies that tend to compensate each other. In fact, the
wind typically blows during stormy conditions when the sun does not shine, while conversely
the sun often shines on calm days with little wind. This makes wind and solar energies
particularly well suited for simultaneous harvesting, with a view at compensating for their
inherent intermittency. In particular, we tested three inverted flag harvesters (in three
different configurations) in a total of nine configurations in controlled wind and light
conditions. We constructed the inverted flag harvesters presented in this paper using
exclusively off-the-shelf components. The main objective of this work was to experimentally
explore the feasibility of simultaneous wind and solar energies harvesting using inverted
flags. The optimization of the proposed inverted flag energy harvester via custom-made
components, or via the development of new energy-harvesting materials, is not considered
here and will be addressed in future studies. Our piezo/solar inverted flags demonstrate a
total power output of up to 3-4 mW, corresponding to maximum power densities up to about
5 mW/cm3 (power density evaluated based on the total volume of the PVDF and solar
element components). This is sufficient to meet the demand of remote sensors and small-
scale portable electronics that operate in the micro-Watt to milli-Watt power range, thus
proving the feasibility of the proposed piezo/solar inverted flag energy-harvesting concept.
2. Experiments and methods
2.1. Inverted flags description
The inverted flags were constructed using off-the-shelf components for the flexible PVDF
piezoelectric strips (TE Connectivity LDT2-028K/L (www.te.com); length/width/thickness:

5
73/16/0.22 mm; density: 1780 kg/m3) and for the flexible solar panels (Powerfilm SP3-37
(www.powerfilmsolar.com); length/width/thickness: 36.5/64/0.2 mm; density: 1245 kg/m3).
Relying on off-the-shelf components was deemed appropriate for the scope of the present
study, which is limited to a proof-of-concept, but clearly poses limitations to the geometry
and mechanical properties of the inverted flags that can be realized. A future optimization
study will take full advantage of the possibility of having both flexible PVDF piezoelectric
strips and flexible solar panels custom-made to more systematically explore the parameter
space and optimize the design. In their study, Orrego et al. [45] realized the inverted flags by
stacking together flexible PVDF piezoelectric strips. As a first step, we therefore realized a
first batch of dual wind-solar inverted flags by stacking together flexible PVDF piezoelectric
strips and adding two flexible solar panels, one for each side of the flag. A representative
example is provided in Fig. 2, which shows an inverted flag realized with four flexible PVDF
piezoelectric strips (Fig. 2a), and an inverted flag realized with four flexible PVDF
piezoelectric strips and two flexible solar panels (Fig. 2b).
Figure 2. (a) Inverted flag realized with four flexible PVDF piezoelectric strips and (b) dual wind-solar inverted flag realized with four flexible PVDF piezoelectric strips and two flexible solar panels; wind direction is left to right (the red coloring of the flag top edge enhanced the contrast and improved the subsequent image tracking).
As shown in Fig. 2, the flexible solar panels are located close to the upstream leading edge
of the inverted flag, so that their inclusion does not constrain the deformation of the flexible
piezoelectric strips close to the fixed trailing edge of the flag. As evident from Fig. 1(c), the
region of the inverted flag undergoing largest deformation is in the vicinity of the clamped
trailing edge; where the flexible piezoelectric strips experience the largest strain and
therefore generate most of the piezoelectric power output. The solar panels used in these
tests were somewhat less flexible than the piezoelectric strips, and so would have
constrained the deformation of the flexible piezoelectric strips if located too close to the

6
clamped trailing edge of the inverted flag. Clearly, solar panels custom-made to the desired
flexibility could overcome this limitation, but this goes beyond the proof-of-concept scope of
the present work. As shown in Fig. 2, the flags were connected to a purpose-built support
clamp designed to provide a cantilever boundary condition at the flag trailing edge while
rigidly fixing the flag to a vertical metallic pole located midway through the wind tunnel.
Fabrication details and a CAD drawing of the support clamp are provided in the Appendix.
Preliminary tests carried out with this first batch of dual wind-solar inverted flags indicated
the potential of this concept but also highlighted a structural limitation of this design [62] in
the form of a material memory effect that prevented the flags from resuming their flapping
motion after been fully deflected to one side at high wind speeds. Specifically, during these
preliminary tests the wind velocity was first step-wise gradually increased from zero up to a
value large enough to yield a fully deflected configuration of the inverted flag, and then the
wind velocity was step-wise gradually decreased to zero. After the flag reached a fully
deflected configuration at high wind speeds, the limited elasticity of the flexible piezoelectric
strips prevented the flag from resuming its flapping motion once the wind velocity was
decreased. The flapping motion observed while increasing the wind velocity was therefore
not recovered when decreasing wind velocity; instead, a small vibration around a fully-
deflected configuration was observed. This memory effect, which was attributed to the
mechanical properties of the flexible piezoelectric strips, is clearly not appropriate for energy
scavenging applications which must offer long-term robustness and endurance.
To overcome this weakness, we modified the design of the inverted flags to include a metal
shim substrate to increase the elasticity of the flags. As a first iteration we carried out
preliminary tests with off-the-shelf stainless-steel shims (Precision Brand; Young modulus:
180 GPa; Poisson ratio: 0.34; density: 7700 kg/m3) of different thicknesses (0.05 mm, 0.1
mm, and 0.2 mm) in order to determine the best thickness for the present application. While
the 0.05 mm thick shim did not provide enough structural support to overcome memory
effects, the 0.2 mm thick shim was too rigid and required either flags too large to fit the
available setup, or very high wind speeds to achieve the flapping motion required for power
generation. On the other hand, the 0.1 mm thick shim was found appropriate for the present
experimental conditions as it provided enough structural support and elasticity without
making the flags too rigid. Evidently, the thickness of the metal shim substrate is critical in
determining the elasticity of the inverted flag. The possibility of having the metal shim
custom-made to the desired thickness will be crucial in a future optimization stage to tailor
the mechanical properties of the inverted flags to the intended applications, but is not further
considered at this stage. An additional advantage of incorporating a metal shim substrate
into the inverted flags is that it is now possible to attach PVDF strips to both faces of the

7
flags, thus increasing the piezoelectric power generation as compared to the previous flags
realized without any substrate. As shown in Fig. 3, the metal shim was first cut down to the
desired size, before the flexible piezoelectric strips were attached to both sides, and finally
the flexible solar panels were incorporated- one for each side of the flag. As identified in Fig.
3, the positioning of the PVDF strips and of the solar panels onto the inverted flag is the
same as with the previous flags shown in Fig. 2. In particular, PVDF strips are located
proximal to the clamped trailing edge where the inverted flag undergoes the largest
deformations, while the solar panels are located close to the free leading edge so that their
inclusion does not constrain the deformation of the flexible piezoelectric strips. The solar
panels were wired using a small drop of conductive glue to cables that ran along the upper
and lower edges of the flags. As shown in Fig. 3(c), the cables were taped to the flag edges
and were bent into a pigtail configuration close to the flag fixed trailing edge, so that they
could follow the flag motion without restraining the flag deformation.
Figure 3. (a) Bare metal flag: inverted flag realized with bare metal shim; (b) Piezo-only flag: inverted flag realized with metal shim and 8 PVDF strips (4 per side); (c) Piezo/solar flag: inverted flag realized with metal shim, 8 PVDF strips (4 per side) and 2 solar panels (1 per side).
Overall, we constructed and tested three geometries of inverted piezo/solar flags which
incorporated eight PVDF strips and two solar panels each, and which differed in the
horizontal dimension, L, as indicated in Table 1, where a summary of the geometric details
and mechanical properties of these flags is provided. For the case of Flag 3 (shown in Fig.
3), the PVDF strips and the solar panels do not overlap. While in the case of Flags 1 and 2,
the solar panels were allowed to partially cover the PVDFs. In order to separately assess
how the inclusion of the piezoelectric strips and of the solar panels affects the mechanical
response of the inverted flags, we tested each flag from Table 1 in three different
configurations, as illustrated in Fig. 3. First, we tested the bare-metal flag without any
piezoelectric strips or solar panels (Fig. 3(a)). Then, we tested the piezo-only flag that
included eight piezoelectric strips (Fig 3(b)), and finally we tested the piezo/solar flag that
included eight piezoelectric strips and two solar panels (Fig 3(c)), thus resulting in a total of
nine sets of experiments. As discussed later on, the critical comparison of these sets of

8
experimental results provides a deeper understanding of the dynamics of inverted flags that
incorporate flexible piezoelectric strips and solar panels, which will be instrumental in future
optimization studies.
Table 1. Geometrical and mechanical properties of the inverted flags. Flag 1 Flag 2 Flag 3
L(mm)/H(mm) 57/64 80/64 100/64 Aspect ratio (L/H) 0.89 1.25 1.56 Lp/L 1 0.71 0.57 Ls/L 0.57 0.41 0.33
Free-vibration frequency (Hz) Bare-metal 25±1 13±1 7±1 Piezo-only 22±1 14±1 9±1 Piezo/solar 18±1 13±1 8±1
Damping ratio Bare-metal 0.03±0.01 0.03±0.01 0.06±0.01 Piezo-only 0.08±0.01 0.08±0.01 0.09±0.01 Piezo/solar 0.10±0.01 0.07±0.01 0.07±0.01
Free vibration frequencies and damping ratios of the inverted flags included in Table 1 were
determined from preliminary free-vibration tests (see Appendix for details). As can be seen
in Table 1, the inclusion of the flexible piezoelectric strips increases the damping ratio of the
inverted flags. On the other hand, the free-vibration frequencies are not affected by the
inclusion of the flexible piezoelectric strips and solar panels, except for the shortest flag
(Flag 1) whose free-vibration frequency decreases once piezoelectric strips and solar panels
are included. This suggests that the solar panels act as an added-mass which makes the
flag heavier, although the effect is mild and only noticeable with the shortest flag (Flag 1).
The mode-1 free-vibration frequencies of the three bare metal flags (1-3) predicted via Euler-
Bernoulli slender-beam theory are 23.7 Hz, 12.0 Hz, and 7.7 Hz respectively, and compare
favourably with the measurements in Table 1, thus validating the present experimental
approach.
2.2. Test rig description and data analysis
During the tests, the inverted flags were secured to a vertical metallic pole located midway
through the wind tunnel using a purpose-built support clamp designed to provide a cantilever
boundary condition at the flag trailing edge, as shown in Fig. 4(a) (see Appendix for details
on the support clamp). The tests were carried out in a commercial open-circuit wind tunnel of
octagonal cross section (Armfield) with height and width of 350 mm. Before testing the
inverted flags, the airflow velocity profile within the wind tunnel was characterised using a
calibrated hotwire anemometer: the boundary layer thickness was within 5 mm at all wind
speed tested, the turbulence intensity was on average 0.6% in the range of free stream
velocities of 1.5 m/s to 30 m/s of interest here, while the velocity profile (excluding the

9
boundary layer) was uniform to within 1%, thus assuring that the inverted flags were always
exposed to a fully-developed velocity profile during the tests. The airflow average velocity
through the wind tunnel was measured during the tests via static/dynamic pressure ports
connected to a calibrated pressure transducer (Sensirion SDP816) to within ±5% error. The
ambient conditions during the tests were 293±1 K and 101±1 kPa.
As shown in Fig. 4(b), four LED lights (Vibesta Capra 12 Daylight; 144 bulbs) were located
on both sides of the wind tunnel test section. In order to achieve a more uniform lighting, two
LED lights were located perpendicular to the rest position of the inverted flag, while two LED
lights were positioned at 45 degrees pointing from behind the flag. The light intensity that
could be achieved with the present setup was of 1.8 kLux, as measured with a portable light
meter inside the wind tunnel in the same plane as the flags in rest position with no airflow.
The light intensity was not varied during the tests, nor was the layout of the LED lights.
Daylight intensity typically varies in the range of 102 Lux (fully overcast day, or sunset-
sundown) to 105 Lux (bright sunlight), with mid-range light intensities of about 1-2 kLux
corresponding to a typical overcast day. The present results for solar power generation,
therefore, can be regarded as indicative of the solar energy harvesting potential of the
proposed dual piezo/solar flag during an overcast day.
Figure 4. (a) Close-up of clamping method, and (b) wind tunnel setup.
The motion of the inverted flags was recorded with a digital camera (Panasonic Lumix DMC-
FZ200; recording frequency: 200 frames per second; resolution: 480x640 pixels) located
atop of the wind tunnel as shown in Fig. 4(a). The recorded videos were post-processed with
standard tools from the Image Processing Toolbox of MATLAB, using a tracking
methodology previously developed for flow-induced vibration and flexible fluid-structure
interaction studies [63–65]. The motion of the flag was characterized using the angular
amplitude of motion θ (measured to within ±2-3o) described between the two extreme

10
positions spanned by the flag observed from the top, as schematically indicated in Fig. 1(c).
Locally, the flags possess a variable curvature when deflected due to the action of the wind,
so that the angular amplitude of motion θ gives a representative measure of the
displacement for the whole flag. In addition to the angular amplitude of motion, the dynamics
of the inverted flags were characterized using the frequency of oscillation corresponding to
the dominant peak in the power spectrum of the flag angular amplitude of motion time-series
(uncertainty within 0.2-0.3 Hz, estimated from the full width at half maximum of the dominant
peak in the power spectrum). A representative example is provided in Fig. 5, which includes
a 2s time-series of the inverted flag angular amplitude of motion during limit-cycle periodic
flapping (Fig. 5(a)), together with its power spectral density (Fig. 5(b)).
Figure 5. (a) Inverted flag angular amplitude of motion time-series, and (b) Flag power spectral density PSD as function of frequency. This figure is shown for Flag 3 incorporating piezo and solar elements at a wind speed of 15 m/s.
For each flag, measurements were repeated several (5-10) times with increasing and
decreasing wind flow velocity, observing good repeatability, i.e. no noticeable change in
dynamic response.
0 0.5 1 1.5 2 2.5 3Time (s)
0
50
100
150
200
Angu
lar a
mpl
itude
(°)
0 10 20 30 40 50 60 70 80 90 100Frequency(Hz)
100
102
104
106
PSD
11
The power output from the piezoelectric strips and from the solar panels was recorded using
a DAQ system (National Instruments NI-USB-6225; sampling rate: 1 kHz) connected to
LabVIEW. The optimal load resistances that maximized the total power output from the solar
panels and piezoelectric strips were 2.2 kΩ and 1.6 MΩ, respectively, and were not changed
during the tests.
3. Results and Discussion
3.1 Bare-metal flags
The results for the bare-metal flags are presented in Fig. 6, where the maximum angular
amplitude of motion and the frequency of oscillation are displayed as functions of the wind
speed, for both increasing and decreasing wind velocity. As can be seen in Fig. 6, all three
main dynamic responses of inverted flags observed in previous research [54–58] and
previously discussed are clearly recognizable as the wind velocity is gradually varied. In
particular, at low wind velocities the inverted flags remain static in their equilibrium
configuration aligned with the incoming flow. As soon as the wind velocity reaches a large
enough threshold value, the inverted flags become unstable and undergo a large-amplitude
flapping oscillation. In particular, this motion is a highly periodic limit-cycle oscillation (Fig.
5(a)), and is characterized by a side-to-side symmetrical excursion of the flags. The
threshold value for the wind velocity at the onset of the large-amplitude limit-cycle flapping
clearly depends on the flag geometry, and is higher the shorter the flag. This is a consistent
outcome, as a shorter cantilever is generally more stable, and therefore more difficult to
destabilize, with respect to a longer one. The flapping frequency is increased as the flag
length decreases, consistently indicating that a longer, and therefore heavier, flag flaps at a
lower frequency with respect to a shorter and lighter one.
As the wind velocity is further increased beyond the flapping threshold, the flag dynamics
remain qualitatively the same. However, the flapping amplitude gradually increases with
increasing wind velocity, whilst the flapping frequency gradually decreases with increasing
wind velocity except for the shortest flag (Flag 1), whose flapping frequency is rather
insensitive to the wind speed. The dynamic motion of the flapping flag results from the
competition between the destabilizing fluid pressure force and the restoring elastic force of
the flag. The destabilizing fluid pressure force depends on the wind speed (via the dynamic
pressure) and on the projected area that the flag exposes to the incoming flow, which is
proportional to the flag amplitude of motion. On the other hand, the restoring elastic force
depends on the elasticity of the flag, which is unaffected by the wind speed, and on the
deformation of the flag. This latter is proportional to the flag amplitude of motion, analogous
12
to a spring which generates a restoring elastic force proportional to its compression. As the
wind velocity is gradually increased, so then the dynamic pressure increases and so does
the fluid pressure force, thus increasing the flag amplitude of motion. In turn, the increase of
the flag amplitude of motion triggers a further increase of the destabilizing pressure force, via
the larger projected area that the flag exposes to the incoming flow, and simultaneously
infers an increase of the restoring elastic force. The results in Fig. 6 clearly show that the
flapping amplitude gradually increases with increasing wind velocity, indicating that the
destabilizing fluid pressure force increases with wind speed faster than the restoring elastic
force. The decrease in flapping frequency with increasing wind velocity that can be observed
in Fig. 3 with the longest flags (Flags 2 and 3) can be the consequence of dynamic damping,
which would be more pronounced with longer flags that experience wider motion.
For a given wind-flow velocity the flapping amplitude is larger for a longer flag. For the
flapping frequency the converse is true; i.e. it is lower for a longer flag. The increase in
flapping amplitude can be traced back to the projected area that the flags expose to the
incoming flow, which is larger for a longer flag. At any given wind speed, therefore, a longer
flag experiences a stronger destabilizing fluid pressure force, yielding larger amplitude of
motion. A longer flag is also heavier, and therefore flaps, at any given wind speed, at a lower
frequency with respect to a shorter and lighter one.
Importantly, the range of wind velocities that sustain large-amplitude limit-cycle flapping is
wider for a shorter flag, suggesting that shorter flags might be more promising for wind
energy harvesting applications. However, as discussed later on, this is no longer necessarily
the case once flexible piezoelectric strips and solar panels are added onto the flag, on
account of changing mass distribution and mechanical properties. This highlights the
importance of conducting an incremental study, starting with the bare-metal flags and
analysing the effect of including piezoelectric strips and solar panels in two successive
separate steps.
At sufficiently large wind velocity the flag dynamics change again from a large-amplitude
limit-cycle flapping to a smaller amplitude vibration around a fully-deflected configuration.
The threshold value for the wind velocity at the transition from the large-amplitude limit-cycle
flapping to the fully-deflected configuration depends on the flag geometry, and is higher the
shorter the flag. Notably, this transition could not be observed with the shortest flag (Flag 1)
because the required wind velocity was beyond the capability of the wind tunnel.
Interestingly, while the transition from the equilibrium configuration to the large-amplitude
limit-cycle flapping was rather abrupt, the transition from the limit-cycle flapping to the fully
deflected configuration was more gradual. During this latter transition, the flag was deflected

13
to one side but still underwent large-amplitude flapping; with flapping amplitude rapidly
decreasing and flapping frequency rapidly increasing as the wind velocity was gradually
increased, until the flapping evolved into a small-amplitude vibration. Apparently, this
asymmetric flapping transition mode was not reported in previous research on inverted flags.
Apart from the asymmetric flapping mode just discussed, the observations on the bare metal
flag dynamics are in qualitative agreement with the existing literature on inverted flags
dynamics [54–58], and this provides further validation to the present experimental setup.
In stark contrast with earlier tests, there are no observable material memory effects that
prevent the flags from resuming their flapping motion after been fully deflected to one side at
high wind speeds, once the wind velocity is gradually decreased, supporting the case for
including a metal shim substrate to increase the elasticity of the flags. However, there is a
noticeable hysteresis at the transition between the static configuration aligned with the
incoming flow and the large-amplitude flapping oscillation. This suggests that the static
equilibrium configuration where the inverted flags are aligned with the incoming flow might
be unstable for finite-amplitude perturbations, so that the wind velocity required to trigger the
transition from the equilibrium configuration to the flapping oscillation is slightly larger than
that observed at the opposite transition from the flapping oscillation to the equilibrium
configuration. Numerical simulations would be useful in analysing the flags dynamics.
Unfortunately, carrying out coupled fluid-structure simulations at the present operating
conditions goes beyond our current capabilities, and is also beyond the scope of the present
study that is an experimental proof of concept. In this respect, the data provided herein
represent a quite challenging benchmark test case for future numerical simulations.

14
Figure 6. Bare-metal flags response: (a) maximum angular amplitude of motion vs. wind speed, and (b) flapping frequency vs. wind speed.
3.2. Piezo-only inverted flags
The results for the piezo-only flags are presented in Fig. 7, where the maximum angular
amplitude of motion and the frequency of oscillation are displayed as functions of the wind
speed, for both increasing and decreasing wind velocity. As can be seen in Fig. 7, all three
main dynamic responses of inverted flags previously discussed are clearly recognizable as
the wind velocity is gradually varied, although with some quantitative differences with respect
to the bare-metal flags results presented in Fig. 6 and previously discussed. The wind
velocity required to trigger the transition from the equilibrium configuration to the flapping
oscillation is increased with respect to the bare-metal flags, and the increase is inversely
proportional to the flag length: from about 14 m/s to 24 m/s for Flag 1, from 13 m/s to 16 m/s
for Flag 2, and from 9 m/s to 10 m/s for Flag 3. Similarly for the inverse transition from the
flapping oscillation to the equilibrium configuration, the wind velocity is increased with
respect to the bare-metal flags although the effect of the flag geometry is now milder: from
about 13 m/s to 17 m/s for Flag 1, from 9 m/s to 12 m/s for Flag 2, and from 7 m/s to 9 m/s
for Flag 3. As a consequence of these changes in threshold wind velocities, the hysteresis

15
observed at the transition between the static configuration and the large-amplitude flapping
oscillation is much wider for Flag 1, slightly wider for Flag 2, while it is slightly reduced for
Flag 3. The threshold value for the wind velocity at the transition from the large-amplitude
limit-cycle flapping to the fully deflected configuration is slightly increased with respect to the
bare-metal flag: from about 20 m/s to 22 m/s for Flag 2 and from 13 m/s to 15 m/s for Flag 3,
although this transition could not be observed with the shortest flag (Flag 1) because the
required wind velocity was beyond the capability of the wind tunnel.
The flapping amplitude of the three flags is now limited to about 200°, whereas the bare-
metal flags reached slightly larger amplitudes. The flapping frequencies of Flags 2 and 3 are
practically unaffected by the inclusion of the piezoelectric strips, while the flapping frequency
of Flag 1 is lower with respect to its bare-metal counterpart. Consistent with what was
previously discussed regarding free-vibration frequencies and damping ratios from Table 1,
these observations suggest that from a mechanical point of view the main consequence of
including the piezoelectric strips is to increase the damping of the inverted flags. All
transitions between different dynamic modes are delayed to higher wind velocities, and the
amplitude and frequency of flapping are slightly decreased, with respect to the bare-metal
flags.

16
Figure 7. Piezo-only flags response (metal substrate plus eight piezoelectric strips): (a) maximum angular amplitude of motion vs. wind speed, and (b) flapping frequency vs. wind speed.
The piezoelectric rms power output of the piezo-only flags is presented in Fig. 8 as a
function of the wind speed. As expected, the piezoelectric power output is significant only
during the large-amplitude flapping oscillation. Moreover, the piezoelectric power output
clearly depends on the flag geometry, and is inversely proportional to the flag length. Since
flapping amplitudes are comparable, and the power magnitude is not affected by the flapping
frequency, this suggests that a shorter flag generates a more pronounced curvature close to
the fixed leading edge, so that the flexible piezoelectric strips experience larger strain and
therefore generate more power.

17
Figure 8. Piezoelectric rms power output of piezo-only flags vs. wind speed.
3.3 Piezo/solar inverted flags
The results for the piezo/solar flags are presented in Fig. 9, where the maximum angular
amplitude of motion and the frequency of oscillation are displayed as functions of the wind
speed, for both increasing and decreasing wind velocity. As can be seen from comparing
Figs 7 and 9, the amplitude of motion appears rather insensitive to the inclusion of the solar
panels, whilst the frequency of flapping is slightly decreased with respect to the piezo-only
flags previously discussed. This suggests that from a mechanical point of view the solar
panels act as an added mass on the inverted flag, so that their inclusion slightly reduces the
flapping frequency with respect to the piezo-only flags, even though the effect is rather small.
This confirms the previous observations regarding free-vibration frequencies and damping
ratios from Table 1.

18
Figure 9. Piezo/solar flags response (metal substrate plus eight piezoelectric strips and two solar panels): (a) maximum angular amplitude of motion vs. wind speed, and (b) flapping frequency vs. wind speed.
The piezoelectric, solar and total power output of the piezo/solar flags is presented in Fig. 10
as a function of the wind speed, while the corresponding power densities are presented in
Fig. 11. In particular, the PVDF and solar power densities in Fig. 11(a-b) are evaluated with
reference to the total PVDF and solar panel volume, respectively, while the total power
density in Fig. 11(c) is the sum of the power densities in Fig. 11(a-b). As can be noticed from
comparing Fig. 10(a) with Fig 8, the piezoelectric rms power generated by the piezo/solar
flags is slightly larger than that generated by the piezo-only flags. This suggests that the
added mass of the solar panels increases the curvature of the flags close to the fixed leading
edge during flapping, so that the flexible piezoelectric strips experience slightly larger strain
and therefore generate a little more power. As seen in Fig. 10(b), the average solar power is
highest when the flags are in the equilibrium configuration aligned with the incoming wind
flow, indicating that during flapping, or when fully deflected to one side, the inverted flags do
not receive as much light as when in equilibrium configuration. This is due to the lighting

19
configuration adopted here, which was deemed appropriate for a proof-of-concept study, but
that could be clearly improved.
It is evident from the total peak power values presented in Fig. 10(c) that the proposed
inverted flag design for simultaneous piezo/solar energy harvesting is a viable concept that
within the limits of the present study is capable of generating up to about 3.5 mW
(corresponding to a total power density of about 3.8 mW/cm3), quite enough to power remote
sensors or small-scale portable electronics. Importantly, the total power output of Flags 1
and 3 is rather insensitive to the wind speed, indicating that the piezoelectric power and the
solar power tend to compensate their respective variability thus yielding a rather flat power
curve, a quite attractive feature for practical applications. Depending on the flag geometry,
the range of wind speeds capable of sustaining large-amplitude flapping spans from about 8
m/s (moderate breeze) to about 26 m/s (storm/whole gale), suggesting a rather diversified
range of potential practical applications.
It is instructive to compare the power density of our concept against previous results
available in the literature. For consistency, the comparison here will be limited to studies that
employed PVDF elements within a wind tunnel set-up. Vatansever et al. [66] measured the
power output of a longer PVDF strip (part number: LDT4-028K/L) whilst fixing one end of the
PVDF to the wind tunnel wall. The maximum reported power density was 0.16 mW/cm3 at a
wind speed of 10 m/s. Li et al. [34] used the same PVDF strips as in the current study
(LDT2-028K/L) but in a cross-flow stalk arrangement. They reported an energy density of
0.87 mW/cm3 at a wind speed of 8 m/s. Hobeck and Inman [41] presented an in-line
piezoelectric harvester array made of 6 PVDF strips (LDT2-028K/L) in a so-called artificial
piezoelectric grass arrangement. The arrangement produced 1.2 µW per cantilever at 7 m/s
meaning a power density of around 0.005 mW/cm3. Note that all previous studies whilst
employing PVDF strips in wind flow, are different in terms of the PVDF arrangement. As
discussed previously, Orrego et al. [45] demonstrated a maximum power density for their
inverted flag configuration of 5 mW/cm3 at a wind speed of 9 m/s. However, their power
density calculation used the active volume of the flag only (i.e. piezo film without Mylar
covering). If we employ the active volume of the piezo film only (55/12/0.028 mm), our PVDF
power density will increase to values of around 5.4 mW/cm3 (as in case of Flag 1). Clearly, if
the solar panels contribution is added on top, then our proposed concept demonstrates
higher power density values. Note that employing the active volume of the PVDF would
allow a fairer comparison when power density values of the PVDF and Solar elements are
compared; however, for consistency with the majority of the previous literature, the total
PVDF volume is adopted here when calculating the PVDF power density values. That said
the conversion between the two is straightforward and in our case would be through
multiplying the total volume-based PVDF power density values by a factor of 10.86. For the
20
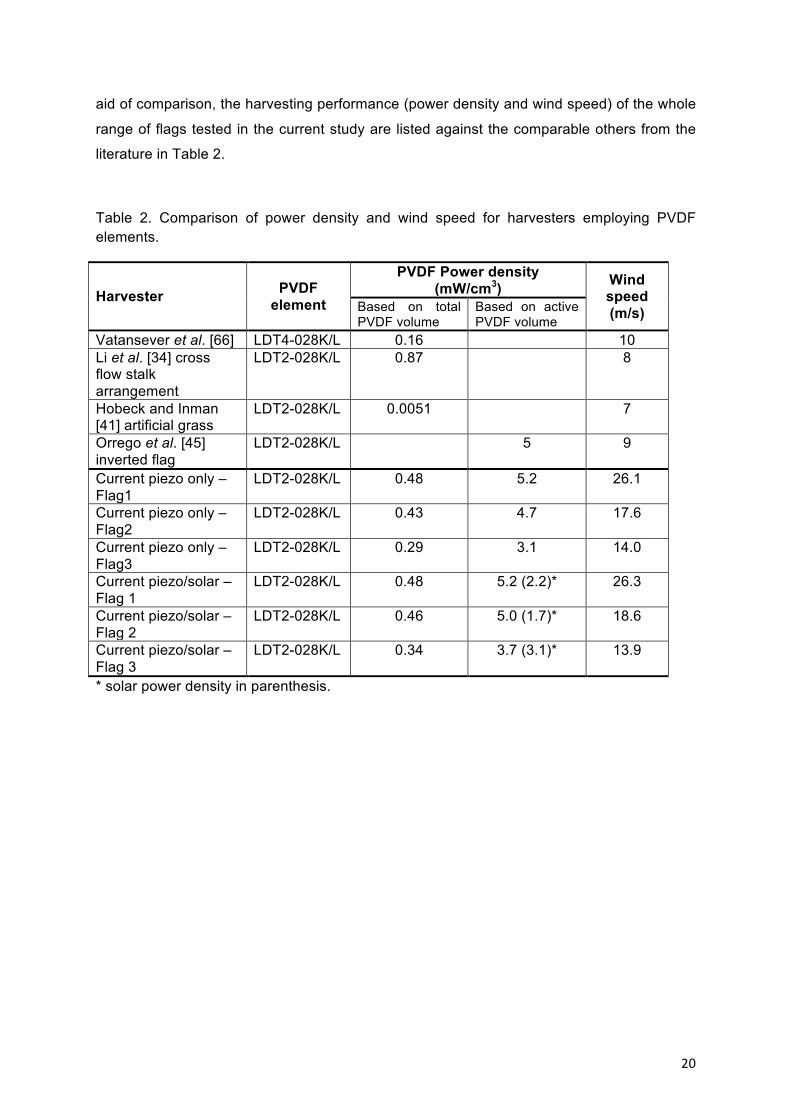
aid of comparison, the harvesting performance (power density and wind speed) of the whole
range of flags tested in the current study are listed against the comparable others from the
literature in Table 2.
Table 2. Comparison of power density and wind speed for harvesters employing PVDF elements.
Harvester PVDF element
PVDF Power density (mW/cm3) Wind
speed (m/s) Based on total
PVDF volume Based on active PVDF volume
Vatansever et al. [66] LDT4-028K/L 0.16 10 Li et al. [34] cross flow stalk arrangement
LDT2-028K/L 0.87 8
Hobeck and Inman [41] artificial grass
LDT2-028K/L 0.0051 7
Orrego et al. [45] inverted flag
LDT2-028K/L 5 9
Current piezo only – Flag1
LDT2-028K/L 0.48 5.2 26.1
Current piezo only – Flag2
LDT2-028K/L 0.43 4.7 17.6
Current piezo only – Flag3
LDT2-028K/L 0.29 3.1 14.0
Current piezo/solar – Flag 1
LDT2-028K/L 0.48 5.2 (2.2)* 26.3
Current piezo/solar – Flag 2
LDT2-028K/L 0.46 5.0 (1.7)* 18.6
Current piezo/solar – Flag 3
LDT2-028K/L 0.34 3.7 (3.1)* 13.9
* solar power density in parenthesis.

21
Figure 10. Power output of piezo/solar flags vs. wind speed: (a) rms piezoelectric power, (b) average solar power, and (c) total piezoelectric plus solar power.

22
Figure 11. Power density of piezo/solar flags vs. wind speed: (a) PVDF power density, (b) solar power density, and (c) total power density.

23
4. Concluding remarks
The novel piezo/solar energy-harvesting device proposed here is a viable concept that is
capable of generating up to 3-4 mW of total power, enough to meet the demand of remote
sensors and small-scale portable electronics that operate in the micro-Watt to milli-Watt
power range. The harvesting device is based on the inverted flag concept and combines
flexible piezoelectric strips with flexible photovoltaic cells to simultaneously harvest both
wind and solar energy. The harvesting device also incorporates a metal shim substrate that
increases the elasticity of the inverted flag, thus eliminating material memory effects
observed with inverted flags realized entirely with flexible piezoelectric strips. The harvesting
device was operated under controlled illumination (1.8 kLux light intensity) and for wind
speeds varying from 0 m/s (calm) to about 26 m/s (storm/whole gale), suggesting a rather
diversified range of potential practical applications in avionics, land/sea remote locations,
and smart cities. The novel piezo/solar energy-harvesting device was realized entirely with
off-the-shelf components, so that a significantly enhanced performance can be anticipated
once all components are custom-made to tailor the device to the final intended application.
We envision that, in a real application, a harvester could combine several inverted flags
properly tuned (via optimization of their mechanical properties) to yield the desired
performance over the whole range of wind speeds of interest for that particular application.
Acknowledgements
The financial support of BAE Systems is gratefully acknowledged. The technical support of
Amir Rezai and Matthew Stevens from BAE Systems-Air is gratefully acknowledged.
References
[1] C. Ó. Mathúna, T. O’Donnell, R. V. Martinez-Catala, J. Rohan, and B. O’Flynn,
“Energy scavenging for long-term deployable wireless sensor networks,” Talanta, vol.
75, no. 3, pp. 613–623, 2008.
[2] Z. L. Wang, G. Zhu, Y. Yang, S. Wang, and C. Pan, “Progress in nanogenerators for
portable electronics,” Mater. Today, vol. 15, no. 12, pp. 532–543, 2012.
[3] J. A. Paradiso and T. Starner, “Energy scavenging for mobile and wireless
electronics,” IEEE Pervasive Comput., vol. 4, no. 1, pp. 18–27, 2005.
[4] Y. Hu, Y. Zhang, C. Xu, L. Lin, R. L. Snyder, and Z. L. Wang, “Self-powered system
with wireless data transmission,” Nano Lett., vol. 11, no. 6, pp. 2572–2577, 2011.
[5] G. P. Hancke, B. de C. de Silva, and G. P. Hancke, The role of advanced sensing in
24
smart cities, vol. 13, no. 1. 2013.
[6] A. Truitt and S. N. Mahmoodi, “A review on active wind energy harvesting designs,”
Int. J. Precis. Eng. Manuf., vol. 14, no. 9, pp. 1667–1675, 2013.
[7] J. M. McCarthy, S. Watkins, A. Deivasigamani, and S. J. John, “Fluttering energy
harvesters in the wind: A review,” J. Sound Vib., vol. 361, pp. 355–377, 2016.
[8] Y. S. W. Yu, D. Sun, J. Zhang, Y. Xu, and Y. Qi, “Study on a Pi-type mean flow
acoustic engine capable of wind energy harvesting using a CFD model,” Appl.
Energy, vol. 189, pp. 602–612, 2017.
[9] S. Nabavi and L. Zhang, “Portable wind energy harvesters for low-power applications:
A survey,” Sensors (Switzerland), vol. 16, no. 7, 2016.
[10] S. Hassanli, G. Hu, K. C. S. Kwok, and D. F. Fletcher, “Utilizing cavity flow within
double skin façade for wind energy harvesting in buildings,” J. Wind Eng. Ind.
Aerodyn., vol. 167, no. February, pp. 114–127, 2017.
[11] S. Hassanli, G. Hu, D. F. Fletcher, and K. C. S. Kwok, “Potential application of double
skin façade incorporating aerodynamic modifications for wind energy harvesting,” J.
Wind Eng. Ind. Aerodyn., vol. 174, no. January, pp. 269–280, 2018.
[12] D. Zhao and N. Han, “Optimizing overall energy harvesting performances of miniature
Savonius-like wind harvesters,” Energy Convers. Manag., vol. 178, no. October, pp.
311–321, 2018.
[13] R. V. Bethi, P. Laws, P. Kumar, and S. Mitra, “Modified Savonius wind turbine for
harvesting wind energy from trains moving in tunnels,” Renew. Energy, vol. 135, pp.
1056–1063, 2018.
[14] D. Kim, I. W. Tcho, and Y. K. Choi, “Triboelectric nanogenerator based on rolling
motion of beads for harvesting wind energy as active wind speed sensor,” Nano
Energy, vol. 52, no. July, pp. 256–263, 2018.
[15] Y. Feng, L. Zhang, Y. Zheng, D. Wang, F. Zhou, and W. Liu, “Leaves based
triboelectric nanogenerator (TENG) and TENG tree for wind energy harvesting,” Nano
Energy, vol. 55, no. October 2018, pp. 260–268, 2019.
[16] H. Lin, M. He, Q. Jing, W. Yang, S. Wang, Y. Liu, Y. Zhang, J. Li, N. Li, Y. Ma, L.
Wang, and Y. Xie, “Angle-shaped triboelectric nanogenerator for harvesting
environmental wind energy,” Nano Energy, vol. 56, no. October 2018, pp. 269–276,

25
2019.
[17] D. Younesian and M. R. Alam, “Multi-stable mechanisms for high-efficiency and
broadband ocean wave energy harvesting,” Appl. Energy, vol. 197, pp. 292–302,
2017.
[18] D. Hoffmann, A. Willmann, R. Göpfert, P. Becker, B. Folkmer, and Y. Manoli, “Energy
harvesting from fluid flow in water pipelines for smart metering applications,” J. Phys.
Conf. Ser., vol. 476, no. 1, 2013.
[19] Y. Wang, J. Duan, Y. Zhao, B. He, and Q. Tang, “Harvest rain energy by polyaniline-
graphene composite films,” Renew. Energy, vol. 125, pp. 995–1002, 2018.
[20] M. Mariello, F. Guido, V. M. Mastronardi, M. T. Todaro, D. Desmaele, and M. De
Vittorio, “Nanogenerators for harvesting mechanical energy conveyed by liquids,”
Nano Energy, vol. 57, no. October 2018, pp. 141–156, 2018.
[21] H. Wang, C. He, S. Lv, and H. Sun, “A new electromagnetic vibrational energy
harvesting device for swaying cables,” Appl. Energy, vol. 228, no. July, pp. 2448–
2461, 2018.
[22] M. A. A. Abdelkareem, L. Xu, M. K. A. Ali, A. Elagouz, J. Mi, S. Guo, Y. Liu, and L.
Zuo, “Vibration energy harvesting in automotive suspension system: A detailed
review,” Appl. Energy, vol. 229, no. July, pp. 672–699, 2018.
[23] C. Wei and X. Jing, “A comprehensive review on vibration energy harvesting:
Modelling and realization,” Renew. Sustain. Energy Rev., vol. 74, no. December
2016, pp. 1–18, 2017.
[24] H. A. Sodano, D. J. Inman, and G. Park, “A review of power harvesting from vibration
using piezoelectric materials,” Shock Vib. Dig., vol. 36, no. 3, pp. 197–205, 2004.
[25] S. Roundy and P. K. Wright, “A piezoelectric vibration based generator for wireless
electronics,” Smart Mater. Struct., vol. 13, no. 5, pp. 1131–1142, 2004.
[26] H. Roshani, S. Dessouky, A. Montoya, and A. T. Papagiannakis, “Energy harvesting
from asphalt pavement roadways vehicle-induced stresses: A feasibility study,” Appl.
Energy, vol. 182, pp. 210–218, 2016.
[27] H. Xiong and L. Wang, “Piezoelectric energy harvester for public roadway: On-site
installation and evaluation,” Appl. Energy, vol. 174, pp. 101–107, 2016.
26
[28] G. Sebald, D. Guyomar, and A. Agbossou, “On thermoelectric and pyroelectric energy
harvesting,” Smart Mater. Struct., vol. 18, no. 12, 2009.
[29] A. Cuadras, M. Gasulla, and V. Ferrari, “Thermal energy harvesting through
pyroelectricity,” Sensors Actuators, A Phys., vol. 158, no. 1, pp. 132–139, 2010.
[30] Z. Lu, H. Zhang, C. Mao, and C. M. Li, “Silk fabric-based wearable thermoelectric
generator for energy harvesting from the human body,” Appl. Energy, vol. 164, pp.
57–63, 2016.
[31] M. Grätzel, “Solar energy conversion by dye-sensitized photovoltaic cells,” Inorg.
Chem., vol. 44, no. 20, pp. 6841–6851, 2005.
[32] A. Bakkali, J. Pelegri-Sebastia, T. Sogorb, A. Bou-Escriva, and A. Lyhyaoui, “Design
and simulation of dual-band RF energy harvesting antenna for WSNs,” Energy
Procedia, vol. 139, pp. 55–60, 2017.
[33] Y. He, Z. Huang, B. Chen, M. Tsutsui, X. Shui Miao, and M. Taniguchi, “Electrokinetic
Analysis of Energy Harvest from Natural Salt Gradients in Nanochannels,” Sci. Rep.,
vol. 7, no. 1, pp. 1–15, 2017.
[34] S. Li, J. Yuan, and H. Lipson, “Ambient wind energy harvesting using cross-flow
fluttering,” J. Appl. Phys., vol. 109, no. 2, p. 026104, 2011.
[35] M. Bryant and E. Garcia, “Modeling and Testing of a Novel Aeroelastic Flutter Energy
Harvester,” J. Vib. Acoust., vol. 133, no. 1, p. 011010, 2011.
[36] A. I. Aquino, J. K. Calautit, and B. R. Hughes, “Evaluation of the integration of the
Wind-Induced Flutter Energy Harvester (WIFEH) into the built environment:
Experimental and numerical analysis,” Appl. Energy, vol. 207, pp. 61–77, 2017.
[37] R. Naseer, H. L. Dai, A. Abdelkefi, and L. Wang, “Piezomagnetoelastic energy
harvesting from vortex-induced vibrations using monostable characteristics,” Appl.
Energy, vol. 203, pp. 142–153, 2017.
[38] L. Zhao and Y. Yang, “An impact-based broadband aeroelastic energy harvester for
concurrent wind and base vibration energy harvesting,” Appl. Energy, vol. 212, no.
September 2017, pp. 233–243, 2018.
[39] M. Bryant, E. Wolff, and E. Garcia, “Aeroelastic flutter energy harvester design: The
sensitivity of the driving instability to system parameters,” Smart Mater. Struct., vol.
20, no. 12, 2011.

27
[40] J. A. Dunnmon, S. C. Stanton, B. P. Mann, and E. H. Dowell, “Power extraction from
aeroelastic limit cycle oscillations,” J. Fluids Struct., vol. 27, no. 8, pp. 1182–1198,
Nov. 2011.
[41] J. D. Hobeck and D. J. Inman, “Artificial piezoelectric grass for energy harvesting from
turbulence-induced vibration,” Smart Mater. Struct., vol. 21, no. 10, 2012.
[42] A. Abdelkefi, M. R. Hajj, and A. H. Nayfeh, “Piezoelectric energy harvesting from
transverse galloping of bluff bodies,” Smart Mater. Struct., vol. 22, no. 1, 2013.
[43] Y. Yang, L. Zhao, and L. Tang, “Comparative study of tip cross-sections for efficient
galloping energy harvesting,” Appl. Phys. Lett., vol. 102, no. 6, 2013.
[44] Y. Yu and Y. Liu, “Flapping dynamics of a piezoelectric membrane behind a circular
cylinder,” J. Fluids Struct., vol. 55, pp. 347–363, May 2015.
[45] S. Orrego, K. Shoele, A. Ruas, K. Doran, B. Caggiano, R. Mittal, and S. H. Kang,
“Harvesting ambient wind energy with an inverted piezoelectric flag,” Appl. Energy,
vol. 194, pp. 212–222, 2017.
[46] Y. Yu and Y. Liu, “Energy harvesting with two parallel pinned piezoelectric
membranes in fluid flow,” J. Fluids Struct., vol. 65, pp. 381–397, 2016.
[47] J. Wang, S. Zhou, Z. Zhang, and D. Yurchenko, “High-performance piezoelectric wind
energy harvester with Y-shaped attachments,” Energy Convers. Manag., vol. 181, no.
September 2018, pp. 645–652, 2019.
[48] G. Hu, K. T. Tse, M. Wei, R. Naseer, A. Abdelkefi, and K. C. S. Kwok, “Experimental
investigation on the efficiency of circular cylinder-based wind energy harvester with
different rod-shaped attachments,” Appl. Energy, vol. 226, no. April, pp. 682–689,
2018.
[49] J. Zhang, Z. Fang, C. Shu, J. Zhang, Q. Zhang, and C. Li, “A rotational piezoelectric
energy harvester for efficient wind energy harvesting,” Sensors Actuators, A Phys.,
vol. 262, pp. 123–129, 2017.
[50] M. H. Raouadi and O. Touayar, “Harvesting wind energy with pyroelectric
nanogenerator PNG using the vortex generator mechanism,” Sensors Actuators, A
Phys., vol. 273, pp. 42–48, 2018.
[51] K. S. Ramadan, D. Sameoto, and S. Evoy, “A review of piezoelectric polymers as
functional materials for electromechanical transducers,” Smart Mater. Struct., vol. 23,

28
no. 3, 2014.
[52] O. Doaré and S. Michelin, “Piezoelectric coupling in energy-harvesting fluttering
flexible plates: linear stability analysis and conversion efficiency,” J. Fluids Struct., vol.
27, no. 8, pp. 1357–1375, Nov. 2011.
[53] S. Michelin and O. Doaré, “Energy harvesting efficiency of piezoelectric flags in axial
flows,” J. Fluid Mech., vol. 714, pp. 489–504, Jan. 2013.
[54] D. Kim, J. Cossé, C. Huertas Cerdeira, and M. Gharib, “Flapping dynamics of an
inverted flag,” J. Fluid Mech., vol. 736, p. R1, 2013.
[55] P. S. Gurugubelli and R. K. Jaiman, “Self-induced flapping dynamics of a flexible
inverted foil in a uniform flow,” J. Fluid Mech., vol. 781, pp. 657–694, 2015.
[56] K. Shoele and R. Mittal, “Flutter instability of a thin flexible plate in a channel,” J. Fluid
Mech., vol. 786, no. 2016, pp. 29–46, 2016.
[57] K. Shoele and R. Mittal, “Energy harvesting by flow-induced flutter in a simple model
of an inverted piezoelectric flag,” J. Fluid Mech., vol. 790, pp. 582–606, 2016.
[58] C. Huertas-Cerdeira, B. Fan, and M. Gharib, “Coupled motion of two side-by-side
inverted flags,” J. Fluids Struct., vol. 76, pp. 527–535, 2018.
[59] M. Z. Jacobson and M. A. Delucchi, “Sustainable Energy by 2030,” Sci. Am., vol. 301,
pp. 58–65, 2009.
[60] M. N. Haji, J. M. Kluger, T. P. Sapsis, and A. H. Slocum, “A symbiotic approach to the
design of offshore wind turbines with other energy harvesting systems,” Ocean Eng.,
vol. 169, no. October, pp. 673–681, 2018.
[61] M. Iqbal and F. U. Khan, “Hybrid vibration and wind energy harvesting using
combined piezoelectric and electromagnetic conversion for bridge health monitoring
applications,” Energy Convers. Manag., vol. 172, no. July, pp. 611–618, 2018.
[62] M. R. A. Nabawy, J. Silva-Leon, J. O’Connor, A. Kennaugh, A. Cioncolini, and A.
Revell, “Simultaneous Energy Harvesting Using Dual Piezo-Solar Devices,” in IUTAM
Symposium on Critical flow dynamics involving moving/deformable structures with
design applications, 2018.
[63] A. Cioncolini, J. Silva-Leon, D. Cooper, M. K. Quinn, and H. Iacovides, “Axial-flow-
induced vibration experiments on cantilevered rods for nuclear reactor applications,”

29
Nucl. Eng. Des., vol. 338, no. May, pp. 102–118, 2018.
[64] J. Silva-Leon, A. Cioncolini, A. Filippone, and M. Domingos, “Flow-induced motions of
flexible filaments hanging in cross-flow,” Exp. Therm. Fluid Sci., vol. 97, no.
December 2017, pp. 254–269, 2018.
[65] J. Silva-Leon and A. Cioncolini, “Modulation of flexible filaments dynamics due to
attachment angle relative to the flow,” Exp. Therm. Fluid Sci., vol. 102, pp. 232–244,
Apr. 2019.
[66] D. Vatansever, R. L. Hadimani, T. Shah, and E. Siores, “An investigation of energy
harvesting from renewable sources with PVDF and PZT,” Smart Mater. Struct., vol.
20, no. 5, 2011.

30
Appendix:
Inverted flags support clamp
The inverted flags were supported with a purpose-built support clamp, which was designed
to provide a cantilever boundary condition at the flag trailing edge while rigidly fixing the flag
to a vertical metallic pole located midway through the wind tunnel. The support clamp was
realized with 3.0 mm clear cast Perspex, model AC.CLR0000.03.3020 purchased from
Hobarts Laser Supplies (Little Market Row, Leybourne, West Malling, ME19 5QL, UK). The
Perspex was cut using a HPC Laser model LS 6840 laser cutter having a cutting bed of
nominally 600mm x 400mm.
The design of the clamping mechanism incorporates C-shape profile elements to sit between
the PVDF and the main mounting plates, as shown in Fig. A1. This way, contact of the upper
and lower plates to the electrical terminals of the PVDFs is avoided allowing a strong
restraint of the flag when experiencing high levels of vibration. The small holes in the lower
plate shown in Fig. A1 are for clamping the upper and lower plates together through
matching holes in the upper plate. The larger holes are for attaching the whole unit to the
wind tunnel pole. The smaller holes are spaced so that the trailing wires from the PVDFs can
pass between them.
Figure A1. CAD drawing of the support clamp. Upper plate has been removed for clarity

31
Determination of the natural frequencies and damping ratios
Natural frequencies and damping ratios of the flags provided in Table 1 were determined
from preliminary free-decay vibration tests. Each flag was clamped and fixed onto the
vertical pole inside the wind tunnel with no airflow. The flag tip was then manually deflected
of about 10°-20° from its rest position and then released (see Fig. A2). The oscillation of the
flag was tracked via the overhead digital camera recording at 200 frames per second. The
instantaneous positions of the flag were extracted from the videos via standard image
processing techniques (Matlab), thus providing displacement time-series of the free-end of
the flag.
Figure A2. Top view of a manually-deflected metal-only flag (Flag 2 from Table 1) during a free
vibration test.
A representative example of a free-vibration time-series is provided in Fig. A3, which shows
the evolution of the displacement from equilibrium of the flag free-end. The natural frequency
was determined from the period between peaks on the free-decay amplitude (dominant peak
in the corresponding power spectral density), while the damping ratio was determined from
the logarithmic decrement of the free-decay amplitudes of motion.
Figure A3. Example of tip displacement for metal-only flag (Flag 2 from Table 1) during a free-
vibration test.