simultaneous prediction of the critical and sub-critical phase behavior in mixtures using equations...
TRANSCRIPT

Chemical Engineering Science 58 (2003) 4363–4376www.elsevier.com/locate/ces
Simultaneous prediction of the critical and sub-critical phase behavior inmixtures using equations of state III. Methane–n-alkanes
Ilya Polishuka ;∗, Jaime Wisniakb, Hugo Segurab
aDepartment of Chemical Engineering, Ben-Gurion University of the Negev, Beer-Sheva, IsraelbDepartment of Chemical Engineering, Universidad de Concepci�on, Concepci�on, Chile
Received 26 January 2003; received in revised form 8 June 2003; accepted 25 June 2003
Abstract
The present study compares the ability of three semi-predictive approaches, namely, the Global Phase Diagram-based semi-predictiveapproach (GPDA), the Predictive Soave-Redlich-Kwong (PSRK) and the Linear Combination of the Vidal and Mixing rules (LCVM), todescribe the phase equilibrium data in the homologous series methane–n-alkanes. The results obtained for the series under considerationdemonstrate, similarly as shown before for the homologue series carbon dioxide–n-alkanes, that GPDA predicts the data more accuratelythan the GE-based models correlate them. In particular, GPDA predicts the critical points very accurately and yields a qualitatively correctpicture of the global phase behavior in the series. In contrast, both PSRK and LCVM overestimate the critical pressures and generatefalse liquid–liquid split in the system methane–n-pentane. Although, the GE-based models yield more accurate results for dew-point dataat high temperatures, GPDA predicts these data better at the moderated and low temperatures. In addition, it is clearly better in predictingthe bubble-point data. PSRK is more accurate than LCVM in description of the homologues lighter than methane–n-decane, however itfails to predict the data of the heavier ones.? 2003 Elsevier Ltd. All rights reserved.
Keywords: Phase equilibria; Supercritical :uid; Methane; Alkanes; Parameter identi;cation; Equation of state
1. Introduction
Prediction of phase equilibria data in mixtures withoutpreliminary resource to experimental results is a very impor-tant problem in modern chemical engineering science. Themost promising solution to this problem seems developmentof semi-predictive approaches that use some experimentaldata to predict the missing ones. Classical semi-predictivemodels, such as UNIFAC (Fredenslund, Gmehling, &Rasmussen, 1977), are based on the activity coeBcientapproach. The main disadvantage of these models, namely,their inability to treat supercritical mixtures, was removedby Huron and Vidal (1979), who proposed connectingthem with cubic EOSs through the equivalence of theGibbs energy obtained by both methods at certain referencestate.
∗ Corresponding author. Current address: The Department of ChemicalEngineering and Biotechnology, the College of Judea and Samaria, Ariel,Israel. Tel.: +972-8-646-1479; fax: +972-8-64729-16.
E-mail address: [email protected] (I. Polishuk).
The most successful GE-based models seem to bethe Predictive Soave-Redlich-Kwong (PSRK) and theLinear Combination of the Vidal and Michelsen mix-ing rules (LCVM). PSRK was proposed by Holderbaumand Gmehling (1991) and then adjusted for a widevariety of systems by Fischer and Gmehling (1996),Gmehling, Jiding, and Fischer (1997), and Horstmann,Fisher, and Gmehling (2000). LCVM was proposedby Boukouvalas, Spiliotis, Coutsikos, Tzouvaras, andTassios (1994), and its parameter matrix was extended bySpiliotis, Boukouvalas, Tzouvaras, and Tassios (1994a),Spiliotis, Magoulas, and Tassios (1994b), Voutsas, Boukou-valas, Kalospiros, and Tassios (1996) and Yakoumis et al.(1996).However, our previous studies (Polishuk, Stateva,
Wisniak, & Segura, 2002; Polishuk, Wisniak, & Segura,2003a,b) have demonstrated that these models can hardlypredict accurate results simultaneously for the sub-criticaland critical regions in asymmetric mixtures. This resulthas been explained by the complex and multidimen-sional structure of GE-based models, which consider-ably hinders consideration of the overall picture of phase
0009-2509/$ - see front matter ? 2003 Elsevier Ltd. All rights reserved.doi:10.1016/S0009-2509(03)00318-X

4364 I. Polishuk et al. / Chemical Engineering Science 58 (2003) 4363–4376
behavior. As a result, parameter evaluation for such mod-els is usually done considering particular sets of data,such as bubble-points, and neglecting other very impor-tant data such as critical points and liquid–liquid equilibria(LLE). This approach tends to ignore the fact that diMer-ent regions of the thermodynamic phase space created bythe EOS are closely inter-related. Thus, GE-based modelsmay generate not only non-realistic phase diagrams, butwill usually predict an incorrect topology of phase be-havior, as well as yield inaccurate results for the criticallines.In order to overcome the shortcomings of the GE-based
semi-predictive models, recently we have proposed thequantitative Global Phase Diagram-based semi-predictiveapproach (GPDA; Polishuk, Wisniak, & Segura, 2001).Nowadays the idea of the Global Phase Diagram (GPD),has received a signi;cant development (Boshkov, Deiters,Kraska, & Lichtenthaler, 2002). GPDA is based on the factsthat the con;guration of vapor–liquid equilibria (VLE)phase boundaries at any temperature is de;ned by: (1) theposition of the vapor–liquid critical point and (2) the dis-tance from any particular temperature to the upper criticalsolution temperature (UCST) of the system. In addition, itis justi;ed by the fact that the in:ections of bubble-pointcurves always change continuously from VLE to LLE.Hence, the accuracy in describing VLE is determined bythe exactness with which the model predicts LLE, a factthat is not always evident when dealing with the local ;tof numerous data points. In other words, diMerent kinds ofphase equilibria, such as VLE and LLE, are inter-relatednot only qualitatively but also quantitatively.Thus, it appears that an appropriate description of phase
equilibria in the system can be achieved by the accuratecorrelation of only two experimental points that character-ize VLE and LLE in the system. The ;rst point is an uppercritical endpoint (UCEP). At this point two liquid phases ofthe three-phase line become identical. The second point isthe critical pressure maximum (CPM), which presents thehighest pressure reached by VLE (Deiters and Pegg, 1989).In addition, it has been demonstrated that the experimen-tal values of these key points in diMerent homologues canbe correlated by EOSs using the same values of the binaryparameters k12 and l12. In other words, each homologuesseries has its own characteristic balance between VLE andLLE. This observation has allowed us to formulate the novelsemi-predictive GPD-based approach (GPDA) involving es-timation of the binary interaction parameters for a certain ho-mologue using klGPD (Polishuk, Wisniak, Segura, Yelash,& Kraska, 2000), followed with by its implementation forpredicting the data of other homologues. In other words, thepresent approach needs only 2 to 3 experimental points ofone system in order to yield a reasonable prediction of thecomplete thermodynamic phase space of the whole homol-ogous series. Thus, GPDA is characterized by a very highestimation ability, which makes it advantageous in compar-ison with the GE-based semi-predictive models that require
a large base of experimental data for evaluation of theirparameters, and, therefore, appear as correlative rather thanpredictive.Thus, GPDA may be considered as a reliable model for
estimating of data, which are not available experimentally.However, the only way to evaluate the robustness and relia-bility of diMerent predictive models is to compare their pre-dictions with the available experimental data. The presentstudy continues such a comparison, initiated in the previ-ous paper for the series carbon dioxide–n-alkanes (Polishuket al., 2003b) Here we consider the homologue series ofmethane–n-alkanes.The practical importance of this series is diBcult to over-
estimate because methane and heavier hydrocarbons con-stitute the main components of natural gas obtained fromunderground reservoirs. Condensation of heavier hydrocar-bons causes operational problems during transmission of gasalong pipelines, its storage, and processing. Hence, the natu-ral gas appropriate for sale should be free of liquids heavierthan pentanes (Elvers, Hawkins, & Schulz, 1991).Phase behavior in the methane–n-alkanes series has
been the subject of many investigations. In particular, ithas been found that the homologues up to n-pentane ex-hibit phase behavior of Type I, according to classi;cationof van Konynenburg and Scott (1980). Creek, Knobler,and Scott (1981) have investigated the ternary systemmethane–(n-pentane+2,3-dimethylbutane). Although theirresults are not de;nite, they show that the binary systemmethane–n-pentane is very close to the tricritical point(TCP), at which the homogenous liquid phase ;rst splitsinto two phases and the systems starts to exhibit the be-havior of Type V (Deiters & Pegg, 1989). However, itis most probably that methane–n-pentane still belongs toType I. The next homologue, methane–n-hexane, alreadyexhibits Type V behavior. Dickinson, Knobler and Scott(1973) have investigated the low-temperature phase behav-ior of this system and have indicated a close proximity ofthe absolute liquid–liquid immiscibility, which is probablyinterrupted by solidi;cation. In other words, the systemmethane–n-hexane is close to the Type IV behavior. Solid-i;cation hinders classi;cation of phase behavior in heavierhomologues and it is not possible to de;ne where the dou-ble critical endpoint (DCEP) takes place. At the DCEP theupper and the lower branches on the LLVE curve meetand the systems begins to behave as Type III (Deiters &Pegg, 1989). It seems that already the system methane–n-heptane is supposed to exhibit Type III behavior, how-ever, the expected liquid–liquid immiscibility is interruptedby solidi;cation. The same phenomena also take placein heavier homologues. Thus, in the series of methane–n-alkanes we meet mostly VLE and almost no LLE. Thischaracteristic feature presents certain diBculty for GPDA,which is based on the simultaneous presentation of VLEand LLE. However, this approach may still successfullytreat the homologues series under consideration, as shownbelow.

I. Polishuk et al. / Chemical Engineering Science 58 (2003) 4363–4376 4365
2. Theory
The EOS implemented by GPDA is given as follows:
P =RT (Vm + 0:125b)Vm(Vm − 0:875b)
− aT (m1Tm2r )r
(Vm + c)(Vm + d); (1)
where m1 and m2 are adjustable parameters given for theappropriate representation of the vapor pressure curve. Forlight gases high quality data are available, hence in suchcases it seems expedient to evaluate the values of m1 and m2
separately for each particular compound (see Table 1). Forother non-polar compounds these values can be generalized;for example, we have proposed (Polishuk et al., 2003b)that for all hydrocarbons m2 be taken as 0.25. For thosehydrocarbons, whose carbon number is larger than 10, m1
is generalized by the following expression:
m1 =−0:4162 + 1:5447!− 2:5285!2 + 0:81466!3
b(2)
and for n-alkanes up to including n-decane m1 is generalizedas follows:
m1 =0:00849− 0:29324!+ 0:61934!2 − 1:7792!3
b; (3)
where b is given in (L/mol)The values of parameters a, b, c and d are obtained solving
the system of the four following equations:(@P@Vm
)Tc
=(@2P@V 2
m
)Tc
= 0; (4)
b=43:5
Vm; triple point ; (5)
Vm;c;EOS = &Vm;c;EXPT; (6)
where � is a dimensionless number equal to 1+Vm; triple point.If takes place the following inequality:
TTPVm;TPLTcVm;c
¿ 0:117 (7)
then Eqs. (5)–(6) correspond to the solid phase molar vol-ume at the triple point, and if otherwise, to the molar vol-ume of liquid phase at this point. Pure compound data havebeen obtained from the DIPPR database (Daubert, Danner,Sibul, & Stebbins, 1989–2002). The parameters of
Table 1Values of m1 and m2 for several light gases
Compound m1 m2
Carbon dioxide −0:33595 −0:15187Methane −0:13198 −0:09946Ethane −0:25851 0.03319
Eq. (1) for mixtures are obtained using the following clas-sical van der Waals mixing rules:
z =∑ij
xixjzij; (8)
where z = a, b, c, and d.The cross-interaction parameters are obtained using the
following combination rules:
a21 = a12 = (1− k12)√a11a22;
b12 = b21 = (1− l12) b11 + b222;
c12 = c21 =c11 + c22
2;
d12 = d21 =d11 + d22
2; (9)
where k12 and l12 are binary adjustable parameters. So farwe have evaluated these values for other series at the inter-section of the loci that present the UCEP of absolute liquid–liquid immiscibility and the pressure of CPM on klGPD.However, as we have pointed out, the series under consider-ation has no homologues for which the UCEP or any UCSTdata are available because the possible liquid–liquid split isinterrupted by solidi;cation. However, the fact that all re-gions of the thermodynamic phase space are always closelyinter-related suggested that instead of an absolute liquid–liquid immiscibility, the limited one could be used for eval-uation of the binary parameters.It should be realized that the experimental value of ev-
ery thermodynamic property might be traced as a path inthe klGPD. However, the loci of properties not having asolid mathematical de;nition must be estimated by tedioustrial-and-error procedures. Therefore, states, which can bedetermined by solving algebraic equations, are more suit-able for presentation in the klGPD. For this reason we haveused the fact that the system methane–n-pentane is locatedvery close to TCP to estimate the binary parameters for thewhole homologous series at the intersection of the loci thatpresent the TCP and the pressure of CPM on klGPD of thissystem. An additional important pair of binary parametershas been also evaluated at the intersection of the loci thatpresent the temperature and the pressure of CPM. As usual,both key intersections take place at very similar values ofl12, however, their k12 values are diMerent. This problem cansolved by attaching the temperature dependency to the latterparameter as follows:
k12 =(K11 − l12 Tc2Tc1
)(1− t) + K22t; (10)
where K11 and K22 are characteristic values for a given ho-mologues series and t is given by the following dimension-less functionality:
t = tanh
[(T − Tc1T ∗c2 − Tc1
)2]: (11)
4366 I. Polishuk et al. / Chemical Engineering Science 58 (2003) 4363–4376
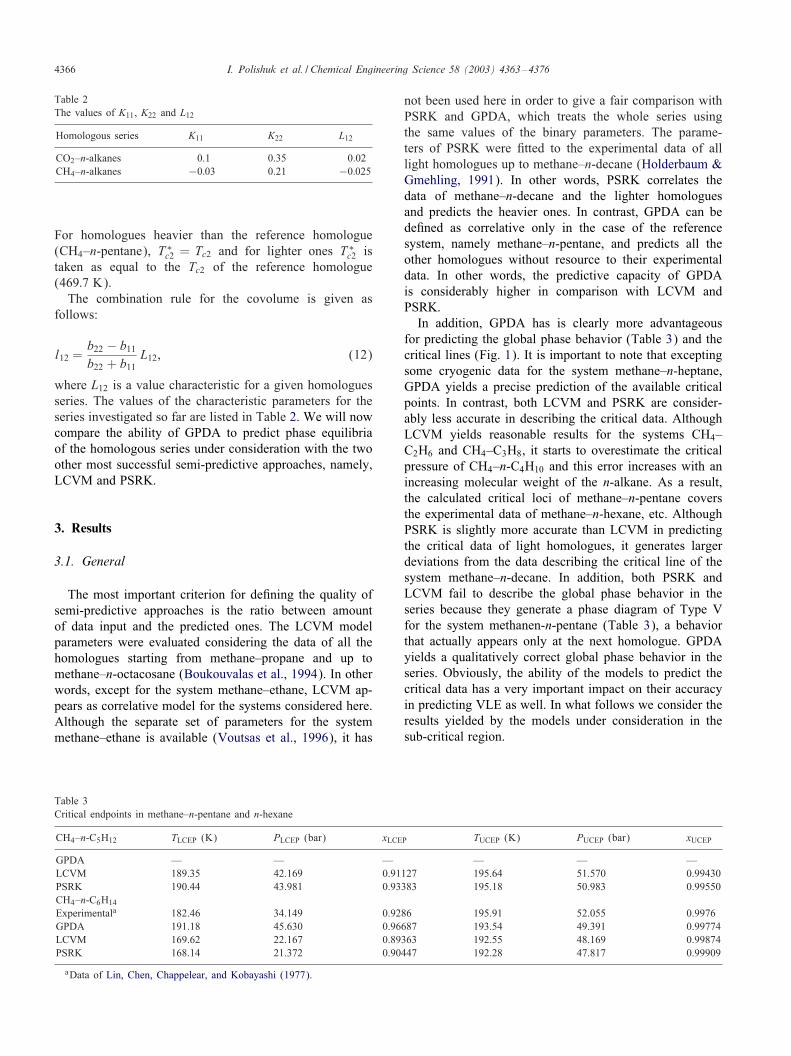
Table 2The values of K11, K22 and L12
Homologous series K11 K22 L12
CO2–n-alkanes 0.1 0.35 0.02CH4–n-alkanes −0:03 0.21 −0:025
For homologues heavier than the reference homologue(CH4–n-pentane), T ∗
c2 = Tc2 and for lighter ones T ∗c2 is
taken as equal to the Tc2 of the reference homologue(469:7 K).The combination rule for the covolume is given as
follows:
l12 =b22 − b11b22 + b11
L12; (12)
where L12 is a value characteristic for a given homologuesseries. The values of the characteristic parameters for theseries investigated so far are listed in Table 2. We will nowcompare the ability of GPDA to predict phase equilibriaof the homologous series under consideration with the twoother most successful semi-predictive approaches, namely,LCVM and PSRK.
3. Results
3.1. General
The most important criterion for de;ning the quality ofsemi-predictive approaches is the ratio between amountof data input and the predicted ones. The LCVM modelparameters were evaluated considering the data of all thehomologues starting from methane–propane and up tomethane–n-octacosane (Boukouvalas et al., 1994). In otherwords, except for the system methane–ethane, LCVM ap-pears as correlative model for the systems considered here.Although the separate set of parameters for the systemmethane–ethane is available (Voutsas et al., 1996), it has
Table 3Critical endpoints in methane–n-pentane and n-hexane
CH4–n-C5H12 TLCEP (K) PLCEP (bar) xLCEP TUCEP (K) PUCEP (bar) xUCEP
GPDA — — — — — —LCVM 189.35 42.169 0.91127 195.64 51.570 0.99430PSRK 190.44 43.981 0.93383 195.18 50.983 0.99550CH4–n-C6H14Experimentala 182.46 34.149 0.9286 195.91 52.055 0.9976GPDA 191.18 45.630 0.96687 193.54 49.391 0.99774LCVM 169.62 22.167 0.89363 192.55 48.169 0.99874PSRK 168.14 21.372 0.90447 192.28 47.817 0.99909
aData of Lin, Chen, Chappelear, and Kobayashi (1977).
not been used here in order to give a fair comparison withPSRK and GPDA, which treats the whole series usingthe same values of the binary parameters. The parame-ters of PSRK were ;tted to the experimental data of alllight homologues up to methane–n-decane (Holderbaum &Gmehling, 1991). In other words, PSRK correlates thedata of methane–n-decane and the lighter homologuesand predicts the heavier ones. In contrast, GPDA can bede;ned as correlative only in the case of the referencesystem, namely methane–n-pentane, and predicts all theother homologues without resource to their experimentaldata. In other words, the predictive capacity of GPDAis considerably higher in comparison with LCVM andPSRK.In addition, GPDA has is clearly more advantageous
for predicting the global phase behavior (Table 3) and thecritical lines (Fig. 1). It is important to note that exceptingsome cryogenic data for the system methane–n-heptane,GPDA yields a precise prediction of the available criticalpoints. In contrast, both LCVM and PSRK are consider-ably less accurate in describing the critical data. AlthoughLCVM yields reasonable results for the systems CH4–C2H6 and CH4–C3H8, it starts to overestimate the criticalpressure of CH4–n-C4H10 and this error increases with anincreasing molecular weight of the n-alkane. As a result,the calculated critical loci of methane–n-pentane coversthe experimental data of methane–n-hexane, etc. AlthoughPSRK is slightly more accurate than LCVM in predictingthe critical data of light homologues, it generates largerdeviations from the data describing the critical line of thesystem methane–n-decane. In addition, both PSRK andLCVM fail to describe the global phase behavior in theseries because they generate a phase diagram of Type Vfor the system methanen-n-pentane (Table 3), a behaviorthat actually appears only at the next homologue. GPDAyields a qualitatively correct global phase behavior in theseries. Obviously, the ability of the models to predict thecritical data has a very important impact on their accuracyin predicting VLE as well. In what follows we consider theresults yielded by the models under consideration in thesub-critical region.

I. Polishuk et al. / Chemical Engineering Science 58 (2003) 4363–4376 4367
5504503502501500
140
280
420
T(K)
P(b
ar)
C
C
C
CC
C
2
3
4
5
6
7
GPDA
C 10
5504503502501500
140
280
420
T(K)
P(b
ar)
C
C
C
C
C
C
2
3
4
5
6
7
LCVM
C10
5504503502501500
140
280
420
T(K)
P(b
ar)
C
C
C
C
C
C
2
3
4
5
6
7
PSR KC10
Fig. 1. Critical lines of methane–n-alkanes. Dot lines—vapor pressurelines. Black solid lines—predicted critical lines. —experimental criti-cal data of Bloomer, Gami, and Parent (1953). —experimental crit-ical data of Price and Kobayashi (1959), Roof and Baron (1967),and Wichterle and Kobayashi (1972). ◦—experimental critical dataof Roberts, Wang, Azarnoosh, and McKetta (1962) and Elliot, Chen,Chappelear, and Kobayashi (1974). •—experimental critical data ofBerry and Sage (1970) and Chu, Chen, Chappelear, and Kobayashi (1976).�—experimental critical data of Poston and McKetta (1966) and Lin,Chen, Chappelear, and Kobayashi (1977). 4—experimental critical dataof Reamer, Sage, and Lacey (1956) and Chang, Hurt, and Kobayashi(1966). ⊕—experimental critical data of Reamer, Olds, Sage, and Lacey(1942).
3.2. Methane–ethane
This system is not asymmetric and therefore it usuallydoes not present diBculties for its prediction or correlation.
1.00.80.60.40.20.00
20
40
60
80
x,y(1)
P(b
ar)
GPDA
1.00.80.60.40.20.00
20
40
60
80
x,y(1)
P(b
ar)
LCVM
1.00.80.60.40.20.00
20
40
60
80
x,y(1)
P(b
ar)
PSRK
Fig. 2. VLE of methane–ethane. Dot lines—predicted critical loci. Blacksolid lines—VLE predicted at 210, 230, 250 and 270 K. Experimen-tal VLE data of Wei, Brown, Kidnay, and Sloan (1995): 4—210 K;—230 K; •—250 K; �—270 K.
Since PSRK in contrast to GPDA and LCVM correlatesits data and does not predict them, it does not seem sur-prising that it has some superiority over these models(Fig. 2). The accuracy of PSRK for both the dew andthe bubble data is achieved by a slight overestimation ofthe critical pressures. LCVM slightly overestimates allthe critical, dew-, and bubble-point data. GPDA is ex-act in predicting the critical and the dew-point data, but

4368 I. Polishuk et al. / Chemical Engineering Science 58 (2003) 4363–4376
somewhat underestimates the bubble points. However, itshould be noticed that all the models under considerationyield rather similar results for this system and that theiractual deviations do not really exceed the possible experi-mental uncertainty.
3.3. Methane–propane
For this system only GPDA appears as predictive andboth LCVM and PSRK—as correlative. Again, it can beseen (Fig. 3) that all models yield similar results, howeverPSRK is somewhat more accurate. It slightly overesti-mates the critical pressure and describes both the dew- andbubble-point data precisely. LCVM yields a more signi;cantoverestimation of critical pressure and bubble-point dataat low temperatures. GPDA is more accurate that LCVMin predicting the critical pressures and the bubble-pointdata. However, it fails in describing the dew-point dataof Reamer, Sage, and Lacey (1950) at 344:26 K. At thesame time, it should be pointed out that at low temperaturesthe data of Reamer et al. (1950) overestimates the equi-libria pressures up to about 10% in comparison with theavailable recent data of Webster and Kidnay (2001). ThusGPDA is probably more accurate than it can be understoodfrom Fig. 3. An additional evidence of this assumptionis the fact that GPDA does not produce signi;cant de-viations from the data of Roberts, Wang, Azarnoosh, &McKetta (1962) at the near temperature of 377:59 K for thenext homologue, methane–n-butane, which is consideredbelow.
3.4. Methane–n-butane
Although in contrast to GE-based models, GPDA appearshere as a predictive model, its superiority in description ofthe data is evident (Fig. 4). It predicts within reasonableaccuracy the whole thermodynamic phase space in the sys-tem, excepting only of the dew-point data at 410:93 K. Itshould be pointed out that GPDA is not very accurate inpredicting the high-temperature dew-point data also in otherhomologues. However, these data usually do not have signif-icant practical importance because separation processes areusually not performed at such temperatures. Nevertheless,high temperatures are typically found in diMerent processesof organic synthesis. For an appropriate design of such pro-cess it is very important to know if at the given conditionsthe hydrocarbon phase remains homogenous or starts to ex-hibit VLE. In other words, the critical data are particularlyimportant at high temperatures. Since GPDA has a clear su-periority in predicting such data at all temperatures, it canbe considered as a reliable model for the design of organicsynthesis processes.The price that the GE-based models pay for an accurate
correlation of a very speci;c part of the thermodynamicphase space, such as the dew-point data at high temper-
1.00.80.60.40.20.00
20
40
60
80
100
120
x,y(1)
P(b
ar)
GPDA
1.00.80.60.40.20.00
20
40
60
80
100
120
x,y(1)
P(b
ar)
LCVM
1.00.80.60.40.20.00
20
40
60
80
100
120
x,y(1)
P(b
ar)
PSRK
Fig. 3. VLE of methane–propane. Dot lines—predicted critical loci. Blacksolid lines—VLE predicted at 230, 270, 344.26 and 360:93 K. Experimen-tal VLE data of Webster and Kidnay (2001): 4—230 K; —270 K. Ex-perimental VLE data of Reamer, Sage, and Lacey (1950): �—344:26 K;•—360:93 K.
atures, ;nds its expression not only in the less accurateresults for the bubble point data, but also in an overestima-tion of critical pressures. Such overestimation in the case ofLCVM is more signi;cant than the one exhibited by PSRK;it leads to inaccurate description of high-pressure phaseequilibria and many other consequences, such as predictionof false LLE split in the system methane–n-pentane, whichis considered below.

I. Polishuk et al. / Chemical Engineering Science 58 (2003) 4363–4376 4369
1.00.80.60.40.20.00
50
100
150
x,y(1)
P(b
ar)
GPDA
1.00.80.60.40.20.00
50
100
150
x,y(1)
P(b
ar)
LCVM
1.00.80.60.40.20.00
50
100
150
x,y(1)
P(b
ar)
PSRK
Fig. 4. VLE of methane–n-butane. Dot lines—predicted critical loci. Blacksolid lines–VLE predicted at 210.94, 277.59, 377.59, and 410:93 K. Ex-perimental VLE data of Elliot et al. (1974): 4—210:94 K; —277:59 K.Experimental VLE data of Roberts et al. (1962): ◦—377:59 K;•—410:93 K.
3.5. Methane–n-pentane
This is the only system in the series for which GPDAappears as correlative. Nevertheless, it should be realizedthat it uses the experimental data of only one point, namely,the TCP, and the fact that the system is located very closeto the TCP. In contrast, models such as PSRK use the largedatabase available for this system in the wide temperaturerange of 178–461 K (Holderbaum & Gmehling, 1991).
1.00.80.60.40.20.00
50
100
150
200
x,y(1)
P(b
ar)
GPDA
1.00.80.60.40.20.00
50
100
150
200
x,y(1)
P(b
ar)
LCVM
1.00.80.60.40.20.00
50
100
150
200
x,y(1)
P(b
ar)
PSRK
Fig. 5. VLE of methane–n-pentane. Dot lines—predicted critical loci.Black solid lines—VLE predicted at 194.17, 223.92, 320, 360, 400, and450 K. Experimental VLE data of Chu et al. (1976): ⊕—194:17 K;⊗—223:92 K. Experimental VLE data of Berry and Sage (1970):4—320 K; �—360 K; •—400 K; ◦—450 K.
Fig. 5 shows that the regularities detected for the previ-ous homologue are valid also here. Although GPDA yieldsan adequate description of the overall picture of phasebehavior in the system, it underestimates the dew pointdata at high temperatures and the bubble-point data at thecryogenic ones. LCVM fails to describe the data in thenear-critical range and yields a relatively large region offalse liquid–liquid split (see Table 3). PSRK is somewhatmore accurate than LCVM in describing the critical points

4370 I. Polishuk et al. / Chemical Engineering Science 58 (2003) 4363–4376
1.00.80.60.40.20.00
50
100
150
200
250
x,y(1)
P(b
ar)
GPDA
1.00.80.60.40.20.00
50
100
150
200
250
x,y(1)
P(b
ar)
LCVM
1.00.80.60.40.20.00
50
100
150
200
250
x,y(1)
P(b
ar)
PSRK
Fig. 6. VLE of methane–n-hexane. Black solid lines—VLE predictedat 323.15, 373.15, and 444:25 K. Experimental data of Shim and Kohn(1962): •—323:15 K; 4—373:15 K. Experimental data of Marteau,Obriot, Barreau, RuBer-Meray, and Behar (1997): ◦—323:15 K;�—373:15 K. Experimental data of Poston and McKetta (1966):⊕—444:25 K.
and yields a smaller region of false LLE, but it underesti-mates the bubble-point data at high temperatures.
3.6. Methane–heavy n-alkanes
Figs. 6–9 show that moving to heavier homologues theaccuracy of GPDA increases while that of the GE-based
1.00.80.60.40.20.00
100
200
300
x,y(1)
P(b
ar)
GPDA
1.00.80.60.40.20.00
100
200
300
x,y(1)
P(b
ar)
LCVM
1.00.80.60.40.20.00
100
200
300
x,y(1)
P(b
ar)
PSRK
Fig. 7. VLE of methane–n-heptane. Black solid lines—VLE predicted at310.93, 344.26, and 377:59 K. Experimental data of Reamer et al. (1956):•—310:93 K; �—344:26 K; —377:59 K.
models decreases. Yet the fact that they overestimate thecritical pressures does not ;nd expression in a better corre-lation of VLE. Moreover, GPDA predicts exactly the crit-ical points and it is also more accurate in predicting thebubble-point lines. At the same time, its deviations fromthe dew point data for methane–n-hexane and n-heptane(Figs. 6 and 7) are insigni;cant and do not seriously exceedthe possible experimental uncertainty. In addition, it can beseen that already for the system methane–n-nonane (Fig. 9)all the models describe the dew-point data with same ac-curacy, but the GE-based models remain less accurate than

I. Polishuk et al. / Chemical Engineering Science 58 (2003) 4363–4376 4371
1.00.80.60.40.20.00
100
200
300
x,y(1)
P(b
ar)
GPDA
1.00.80.60.40.20.00
100
200
300
x,y(1)
P(b
ar)
LCVM
1.00.80.60.40.20.00
100
200
300
x,y(1)
P(b
ar)
PSRK
Fig. 8. VLE of methane–n-octane. Black solid lines—VLE predicted at223.15, 298.15, and 423:15 K. Experimental VLE data of Kohn andBradish (1964): •—223.15; ◦—298:15 K; 4—423:15 K.
GPDA in describing bubble point data and the critical points.Although GPDA under predicts the range of limited LLE inthe system methane–n-hexane (Table 3), it predicts the crit-ical endpoints more accurately that LCVM and PSRK, whooverestimate the cryogenic liquid–liquid split.The advantage of GPDA becomes evident when going
forward to the system methane–n-decane (Fig. 10). The ;g-ure shows that in comparison with the correlations yieldedby LCVM and PSRK, again GPDA predicts more accuratelynot only the near critical and the bubble-point data, but alsothe dew-point ones. It should be realized that the dew-point
1.00.80.60.40.20.00
100
200
300
400
x,y(1)
P(b
ar)
GPDA
1.00.80.60.40.20.00
100
200
300
400
x,y(1)
P(b
ar)
LCVM
1.00.80.60.40.20.00
100
200
300
400
x,y(1)
P(b
ar)
PSRK
Fig. 9. VLE of methane–n-nonane. Black solid lines—VLE predictedat 273.15, 298.15, 348.15, and 423:15 K. Experimental VLE data ofShipman and Kohn (1966): •—273.15; ◦—298:15 K; —348:15 K;�—423:15 K. Experimental data of Rousseaux, Richon, and Renon(1983): +—298:15 K.
data of the heavier homologues is industrially much moreimportant than that of the lighter ones. This is because con-densation of the heavy hydrocarbons may result in a veryserious problem during storage, transportation, and process-ing of natural gas.The same tendency can be observed also for the next sys-
tem, for which the experimental data are available, namely,methane–n-dodecane (Fig. 11). Although GPDA underpredicts the near-critical data at low temperature, it yields

4372 I. Polishuk et al. / Chemical Engineering Science 58 (2003) 4363–4376
3603202802400
100
200
300
400
500
T(K)
P(b
ar)
GPDA
3603202802400
100
200
300
400
500
T(K)
P(b
ar)
LCVM
3603202802400
100
200
300
400
500
T(K)
P(b
ar)
PSRK
Fig. 10. VLE of methane–n-decane. Black solid lines—isopleths pre-dicted by GPDA, LCVM and PSRK. Experimental isopleths of Rijkers,Malais, Peters, and de Swaan Arons (1992b): ◦—x(1) = 0:0992;•—x(1)=0:1934; x—x(1)=0:305; +—x(1)=0:4049; —x(1)=0:4759;—x(1) = 0:5456; 4—x(1) = 0:9006; �—x(1) = 0:9502;
⊕—x(1) = 0:9753; ⊗—x(1) = 0:9876.
accurate predictions for all other data, results that are moreaccurate than the correlative ones of LCVM. PSRK is nowquite inaccurate, probably because the data of this systemhave not been included in the evaluation of its parameters.This fact is additional evidence to the low approximationability of this model. PSRK also fails to predict the data offollowing homologues (Figs. 12 and 13). In contrast, GPDA
3203103002902802702602500
100
200
300
400
500
600
700
T(K)
P(b
ar)
GPDA
3203103002902802702602500
100
200
300
400
500
600
700
T(K)
P(b
ar)
LCVM
3203103002902802702602500
100
200
300
400
500
600
700
T(K)
P(b
ar)
PSRK
Fig. 11. VLE of methane–n-dodecane. Black solid lines—isopleths pre-dicted by GPDA, LCVM and PSRK. Experimental isopleths of Rijkers,Maduro, Peters, and de Swaan Arons (1992a): ◦—x(1) = 0:0948;•—x(1)=0:296; —x(1)=0:4882; —x(1)=0:5957; 4—x(1)=0:7013;�—x(1) = 0:7552; ⊕—x(1) = 0:8989.
predicts the data of methane–n-tetradecane (Fig. 12) quiteaccurately and only slightly overestimates the bubble-pointsof the system methane–n-hexadecane (Fig. 13). LCVMcorrelates the system methane–n-tetradecane less accuratelythan GPDA predicts it, but describes more accurately thebubble-pressures of methane–n-hexadecane. At the sametime, GPDA still predicts more accurately the critical pointsin this very asymmetric system.

I. Polishuk et al. / Chemical Engineering Science 58 (2003) 4363–4376 4373
4404003603200
200
400
600
800
T(K)
P(b
ar)
GPDA
4404003603200
200
400
600
800
T(K)
P(b
ar)
LCVM
4404003603200
200
400
600
800
T(K)
P(b
ar)
PSRK
Fig. 12. VLE of methane–n-tetradecane. Black solid lines—isopleths pre-dicted by GPDA, LCVM and PSRK. Experimental isopleths of de Leeuw,de Loos, Kooijman, and de Swaan Arons (1992): x—x(1) = 0:105;◦—x(1) = 0:205; •—x(1) = 0:296; —x(1) = 0:396; —x(1) = 0:515;4—x(1) = 0:593; �—x(1) = 0:711; ⊗—x(1) = 0:817; ⊕—x(1) = 0:93.
4. Conclusions
The present study compares the ability of threesemi-predictive approaches, namely GPDA, PSRK, andLCVM to describe the experimental data in the binary ho-mologous series of methane–n-alkanes. PSRK and LCVMincorporate simple two-parameter cubic EOSs and rela-tively complex GE-based mixing rules. Thus, these models
1.00.80.60.40.20.00
100
200
300
400
500
600
700
x,y(1)
P(b
ar)
GPDA
1.00.80.60.40.20.00
100
200
300
400
500
600
700
x,y(1)
P(b
ar)
LCVM
1.00.80.60.40.20.00
100
200
300
400
500
600
700
x,y(1)
P(b
ar)
PSRK
Fig. 13. VLE of methane–n-hexadecane. Dot lines—predicted critical loci.Black solid lines—VLE predicted at 230, 270, 344.26 and 360:93 K.Experimental VLE data of Lin, Sebastian, and Chao (1980): �—703:6 K;◦—542.7; •—462:5 K. Experimental VLE data of Glaser, Peters, vander Kooi, and Lichtenthaler (1985): 4—350 K.
neglect the prediction the pure compound properties andconcentrated on correlating the VLE data in mixtures us-ing multidimensional functionality with many adjustableparameters. In contrast, GPDA appreciates the fact thatall regions of the thermodynamic phase space, which in-cludes pure compounds and their mixtures, are closelyinter-related. It is based on a four-parameter EOS, whichyields a better description of pure compounds, and simple

4374 I. Polishuk et al. / Chemical Engineering Science 58 (2003) 4363–4376
classical mixing rules with a temperature-dependent binaryadjustable parameter k12. Since the GPDA is substantiallysimpler than PSRK and LCVM, the phase equilibria cal-culations with this model are much more faster and sim-pler, which presents signi;cant advantage for its possiblecommercial use. After its successful implementation forpredicting the data in the series carbon dioxide–n-alkanes(Polishuk et al., 2003a,b), it has been now been ap-plied to the series methane–n-alkanes with the followingresults:
• The parameters of the LCVM model were evaluatedconsidering the data available for all homologues frommethane–propane to methane–n-octacosane. Hence, ex-cepting the system methane–ethane, LCVM appears ascorrelative model for all the systems under consideration.The parameters of PSRK were ;tted to the experimentaldata of all light homologues up to methane–n-decane.In other words, PSRK correlates the data of this andall lighter homologues and predicts the heavier ones. Incontrast, GPDA can be seen as a correlative procedureonly for methane–n-pentane and as predictive for all theother homologues, without needing to experimental dataabout them. In other words, the predictive capacity ofGPDA is considerably better compared to that of LCVMand PSRK.
• The overall accuracy with which GPDA predicts the ex-perimental data exceeds that with which the GE-basedmodels under consideration correlate them. In particular,GPDA predicts the critical points exactly and yields aqualitatively correct picture of the global phase behaviorin the series. In contrast, both PSRK and LCVM overesti-mate the critical pressures and generate false liquid–liquidsplit in the system methane–n-pentane.
• Although, the GE-based models yield more accurate re-sults for dew-point data at high temperatures, GPDApredicts these data better at the moderated and lowtemperatures. In addition, it its clearly better in predict-ing the bubble-point data. PSRK is more accurate thanLCVM in description of the homologues lighter thanmethane–n-decane, however it fails to predict the data ofthe heavier ones.
Notation
a cohesion parameterb covolumec; d attraction density dependence parameters in Eq.
(1)GE excess Gibbs energyP pressureR universal gas constantT temperaturex mole fraction of the lighter compound in the
liquid phase
y mole fraction of the lighter compound in thevapor phase
V volume
Greek letters
� correction factor of the critical volume! acentric factor
Subscripts
c critical statem molar propertyTP triple points
Abbreviations
CPM critical pressure maximumDCEP double critical end pointEOS equation of stateGPD global phase diagramGPDA global phase diagram approachklGPD global phase diagram in the k12 − l12 projectionLCEP lower critical end pointLCVM linear combination of the Vidal and Michelsen
mixing rulesLLE liquid–liquid equilibriaPSRK predictive-Soave-Redlich-Kwong Group
Contribution EOSTCP tri-critical pointsUCEP upper critical end pointUCST upper critical solution temperatureVLE vapor–liquid equilibria
Acknowledgements
This work was ;nanced by the Israel Science Foundation,grant number 340/00, and by FONDECYT, Santiago, Chile(Project 2010100).
References
Berry, V. M., & Sage, B. H. (1970). Phase Behavior in Binaryand Multicomponent Systems at Elevated Pressures: n-Pentane andMethane–n-Pentane. Washington, D.C.: NSRDS.
Bloomer, O. T., Gami, D. C., & Parent, J. D. (1953). Physical–chemicalproperties of methane–ethane mixtures. Institute of Gas TechnologyResearch Bulletin, 22, 1–39.
Boshkov, L.Z., Deiters, U.K., Kraska, T., & Lichtenthaler, R.N. (2002).Global phase diagrams. Physical Chemistry Chemical Physics, 4, V.
Boukouvalas, C., Spiliotis, N., Coutsikos, P., Tzouvaras, N., & Tassios,D. (1994). Prediction of vapor–liquid equilibrium with the LCVMmodel: A linear combination of the Vidal and Michelsen mixing rulescoupled with the original UNIFAC and the t-mPR equation of state.Fluid Phase Equilibria, 92, 75–106.

I. Polishuk et al. / Chemical Engineering Science 58 (2003) 4363–4376 4375
Chang, H. L., Hurt, L. J., & Kobayashi, R. (1966). Vapor–liquid equilibriaof light hydrocarbons at low temperatures and high pressures: Themethane–n-heptane system. A.I.Ch.E. Journal, 12, 1212–1216.
Chu, T.-C., Chen, R. J. J., Chappelear, P. S., & Kobayashi, R.(1976). Vapor–liquid equilibrium of methane–n-pentane system at lowtemperatures and high pressures. Journal of Chemical and EngineeringData, 21, 41–44.
Creek, J. L., Knobler, C. M., & Scott, R. L. (1981). Tricritical phenomenain quasibinary mixtures of hydrocarbons. I. Methane systems. Journalof Physical Chemistry, 74, 3489–3499.
Daubert, T. E., Danner, R. P., Sibul, H. M., & Stebbins, C. C. (1989–2002). Physical and Thermodynamic Properties of Pure Chemicals.Data Compilations, Bristol, PA, Taylor & Francis.
Deiters, U. K., & Pegg, J. L. (1989). Systematic investigation ofphase behavior in binary :uid mixtures. I. Calculations based onRedlich-Kwong equation of state. Journal of Chemical Physics, 90,6632–6641.
de Leeuw, V. V., de Loos, Th. W., Kooijman, H. A., & de Swaan Arons,J. (1992). The experimental determination and modeling of VLE forbinary subsystems of the quaternary system N2+CH4+C4H10+C14H30up to 1000 bar and 440 K. Fluid Phase Equilibria, 73, 285–321.
Dickinson, E., Knobler, C. M., & Scott, R. L. (1973). Solid/liquid phaseequilibria in the mixtures methane+n-hexane and methane+n-pentane.Journal of the Chemical Society, Faraday transactions I, 69, 2179–2187.
Elliot, D. G., Chen, R. J. J., Chappelear, P. S., & Kobayashi, R.(1974). Vapor–liquid equilibrium of methane–butane system at lowtemperatures and high-pressures. Journal of Chemical and EngineeringData, 19, 71–77.
Elvers, B., Hawkins, S., & Schulz, G. (1991). Ullman’s Encyclopedia ofIndustrial Chemistry. Weinheim: VCH Verlagsgesellschaft.
Fischer, K., & Gmehling, J. (1996). Further development, status andresults of the PSRK method for the prediction of vapor–liquid equilibriaand gas solubilities. Fluid Phase Equilibria, 121, 185–206.
Fredenslund, A., Gmehling, J., & Rasmussen, P. (1977). Vapor–Liquid Equilibria Using UNIFAC, A Group Contribution Method.Amsterdam: Elsevier.
Glaser, M., Peters, C. J., van der Kooi, H. J., & Lichtenthaler, R. N.(1985). Phase equilibria of (methane+n-hexadecane) and (p, Vm, T )of n-hexadecane. The Journal of Chemical Thermodynamics, 17,803–815.
Gmehling, J., Jiding, L., & Fischer, K. (1997). Further development ofthe PSRK model for the prediction of vapor–liquid-equilibria at lowand high pressures II. Fluid Phase Equilibria, 141, 113–127.
Holderbaum, T., & Gmehling, J. (1991). PSRK: A group contributionequation of state based on UNIFAC. Fluid Phase Equilibria, 70,251–265.
Horstmann, S., Fischer, K., & Gmehling, J. (2000). PSRK groupcontribution equation of state: Revision and extension III. Fluid PhaseEquilibria, 167, 173–186.
Huron, M. J., & Vidal, J. (1979). New mixing rules in simple equationsof state for representing vapour–liquid equilibria of strongly non-idealmixtures. Fluid Phase Equilibria, 3, 255–271.
Kohn, J. P., & Bradish, W. F. (1964). Multiphase and volumetric equilibriaof the methane–n-octane systems at temperatures between—110◦ and150◦C. Journal of Chemical and Engineering Data, 9, 5–8.
Lin, H.-M., Sebastian, H. M., & Chao, K.-C. (1980). Gas–liquidequilibrium in hydrogen + n-hexadecane and methane + n-hexadecaneat elevated temperatures and pressures. Journal of Chemical andEngineering Data, 25, 252–254.
Lin, Y.-N., Chen, R. J. J., Chappelear, P. S., & Kobayashi, R.(1977). Vapor–liquid equilibrium of methane–n-hexane system atlow temperature. Journal of Chemical and Engineering Data, 22,402–408.
Marteau, Ph., Obriot, J., Barreau, A., RuBer-Meray, V., & Behar,E. (1997). Experimental determination of the phase behavior of
binary mixtures: Methane–hexane and methane–benzene. Fluid PhaseEquilibria, 129, 285–305.
Polishuk, I., Wisniak, J., Segura, H., Yelash, L. V., & Kraska, T. (2000).Prediction of the critical locus in binary mixtures using equation ofstate II. Investigation of van der Waals-type and Carnahan-Starling-typeequations of state. Fluid Phase Equilibria, 172, 1–26.
Polishuk, I., Wisniak, J., & Segura, H. (2001). Simultaneous prediction ofthe critical and sub-critical phase behavior in mixtures using equationof state I. Carbon dioxide-alkanols. Chemical Engineering Science,56, 6485–6510.
Polishuk, I., Stateva, R., Wisniak, J., & Segura, H. (2002). Prediction ofhigh-pressure phase equilibria using cubic EOS. What can be learned?The Canadian Journal of Chemical Engineering, 80, 927–942.
Polishuk, I., Wisniak, J., & Segura, H. (2003a). Estimation of three-phaseequilibria using predictive EOS models. I Carbon dioxide–n-alkanes.Journal of Physical Chemistry(B), 107, 1864–1874.
Polishuk, I., Wisniak, J., & Segura, H. (2003b). Simultaneous prediction ofthe critical and sub-critical phase behavior in mixtures using equationsof state II. Carbon dioxide-heavy n-alkanes. Chemical EngineeringScience, 58, 2529–2550.
Poston, R. S., & McKetta, J. J. (1966). Vapor–liquid equilibrium inthe methane–n-hexane system. Journal of Chemical and EngineeringData, 11, 362–363.
Price, A. R., & Kobayashi, R. (1959). Low-temperature vapor–liquidequilibrium in light hydrocarbon mixtures: Methane–ethane–propanesystem. Journal of Chemical and Engineering Data, 4, 40–52.
Reamer, H. H., Olds, R. H., Sage, B. H., & Lacey, W. N. (1942). Phaseequilibria in hydrocarbon system. Methane–decane system. Industrialand Engineering Chemistry, 34, 1526–1531.
Reamer, H. H., Sage, B. H., & Lacey, W. N. (1950). Phase equilibriain hydrocarbon system, Methane–propane system. Industrial andEngineering Chemistry, 42, 534–539.
Reamer, H. H., Sage, B. H., & Lacey, W. N. (1956). Volumetric andphase behavior of the methane–n-heptane system. Journal of Chemicaland Engineering Data, 1, 29–42.
Rijkers, M. P. W. M., Maduro, V. B., Peters, C. J., & de Swaan Arons, J.(1992a). Measurements on the phase behavior of binary hydrocarbonmixtures for modeling the condensation behavior of natural gas. PartII. The system methane + dodecane. Fluid Phase Equilibria, 72,309–324.
Rijkers, M. P. W. M., Malais, M., Peters, C. J., & de Swaan Arons, J.(1992b). Measurements on the phase behavior of binary hydrocarbonmixtures for modeling the condensation behavior of natural gas. Part I.The system methane + decane. Fluid Phase Equilibria, 71, 143–168.
Roberts, L. R., Wang, R. H., Azarnoosh, A., & McKetta, J. J. (1962).Methane-butane system in the two-phase region. Journal of Chemicaland Engineering Data, 7, 484–485.
Roof, J. G., & Baron, J. D. (1967). Critical loci of binary mixturesof propane with methane, carbon dioxide, and nitrogen. Journal ofChemical and Engineering Data, 12, 292–293.
Rousseaux, P., Richon, D., & Renon, H. (1983). A static methodfor determination of vapor–liquid equilibria and saturated liquidmolar volumes at high pressures and temperatures using a newvariable-volume cell. Fluid Phase Equilibria, 11, 153–168.
Shim, J., & Kohn, J. P. (1962). Multiphase and volumetric equilibria ofmethane–n-hexane binary system at temperatures between—110◦ and150◦C. Journal of Chemical and Engineering Data, 7, 3–8.
Shipman, L. M., & Kohn, J. P. (1966). Heterogeneous phase andvolumetric equilibrium in the methane–n-nonane system. Journal ofChemical and Engineering Data, 11, 176–180.
Spiliotis, N., Boukouvalas, C., Tzouvaras, N., & Tassios, D. (1994a).Application of the LCVMmodel to multicomponent systems: Extensionof the UNIFAC interaction parameter table and prediction of the phasebehavior of synthetic gas condensate and oil systems. Fluid PhaseEquilibria, 101, 187–210.

4376 I. Polishuk et al. / Chemical Engineering Science 58 (2003) 4363–4376
Spiliotis, N., Magoulas, K., & Tassios, D. (1994b). Prediction of thesolubility of aromatic hydrocarbons in supercritical CO2 with EoS=GE
models. Fluid Phase Equilibria, 102, 121–141.van Konynenburg, P. H., & Scott, R. L. (1980). Critical lines and
phase equilibria in binary van der Waals mixtures. PhilosophicalTransactions of the Royal Society of London, 298, 495–540.
Voutsas, E. C., Boukouvalas, C. J., Kalospiros, N. S., & Tassios, D.P. (1996). The performance of EoS=GE models in the prediction ofvapor–liquid equilibria in asymmetric systems. Fluid Phase Equilibria,116, 480–487.
Webster, L. A., & Kidnay, A. J. (2001). Vapor–liquid equilibria forthe methane–propane–carbon dioxide systems at 230 K and 270 K.Journal of Chemical and Engineering Data, 46, 759–764.
Wei, M. S.-W., Brown, T. S., Kidnay, A. J., & Sloan, E.D. (1995). Vapor+liquid equilibria for the ternary systemmethane+ethane+carbon dioxide at 230 K and its constituent binariesat temperatures from 207 to 270 K. Journal of Chemical andEngineering Data, 40, 726–731.
Wichterle, I., & Kobayashi, R. (1972). Vapor–liquid equilibrium ofmethane-propane system at low temperatures and high pressures.Journal of Chemical and Engineering Data, 17, 4–9.
Yakoumis, I. V., Vlachos, K., Kontogeorgis, G. M., Coutsikos, P.,Kalospiros, N. S., Tassios, D., & Kolisis, F. N. (1996). Applicationof the LCVM model to systems containing organic compounds andsupercritical carbon dioxide. The Journal of Supercritical Fluids, 9,88–98.