simultaneous nitritation and p-nitrophenol removal … · 1 2 3 4 5 6 7 8 9 10 11 12 13 14 15 16 17...
TRANSCRIPT
1 2 3 4 5 6 7 8 9 10 11 12 13 14 15 16 17 18 19 20 21 22 23 24 25 26 27 28 29 30 31 32 33 34 35 36 37 38 39 40 41 42 43 44 45 46 47 48 49 50 51 52 53 54 55 56 57 58 59 60 61 62 63 64 65
1
Simultaneous nitritation and p-nitrophenol removal using aerobic granular
biomass in a continuous airlift reactor
Zulkifly Jemaat1, María Eugenia Suárez-Ojeda*, Julio Pérez, Julián Carrera
Department of Chemical Engineering, School of Engineering, Universitat Autònoma de
Barcelona, 08193 Bellaterra, Barcelona, Spain
* Corresponding author. E-mail address: [email protected] (M.E. Suárez-
Ojeda). Tel.: +34 935868372; fax: +34 935812013
Abstract
The chemical and petrochemical industries produce wastewaters containing ammonium
and phenolic compounds. Biological treatment of these wastewaters could be
problematic due to the possible inhibitory effects exerted by phenolic compounds. The
feasibility of performing simultaneous nitritation and p-nitrophenol (PNP)
biodegradation using a continuous aerobic granular reactor was evaluated. A nitrifying
granular sludge was bioaugmented with a PNP-degrading floccular sludge, while PNP
was progressively added to the feed containing a high ammonium concentration.
Nitritation was sustained throughout the operational period with ca. 85 % of ammonium
oxidation and less than 0.3 % of nitrate in the effluent. PNP biodegradation was
unstable and the oxygen limiting condition was found to be the main explanation for
this unsteadiness. An increase in dissolved oxygen concentration from 2.0 to 4.5 mg O2
L-1
significantly enhanced PNP removal, achieving total elimination. Acinetobacter
1 Present address: Department of Chemical Engineering, Faculty of Chemical and
Natural Resources Engineering, Universiti Malaysia Pahang, Lebuhraya Tun Razak,
26300 Kuantan, Pahang, Malaysia.
*Manuscript without changes markedClick here to view linked References
1 2 3 4 5 6 7 8 9 10 11 12 13 14 15 16 17 18 19 20 21 22 23 24 25 26 27 28 29 30 31 32 33 34 35 36 37 38 39 40 41 42 43 44 45 46 47 48 49 50 51 52 53 54 55 56 57 58 59 60 61 62 63 64 65
2
genus and ammonia-oxidizing bacteria were the predominant bacteria species in the
granular biomass.
Keywords: Nitritation, oxygen limitation, industrial wastewater, phenolic compounds,
aerobic granules.
1. Introduction
Currently, biological nitrogen removal via nitrite route is considered as the
technology with the cheapest costs and the lowest environmental foot-print for treating
ammonium-rich wastewaters (Van Hulle et al, 2010). However, several industries such
as the chemical, petrochemical, coke plant and refineries produce complex wastewaters
containing both, ammonium and phenolic compounds (Morita et al., 2007; Milia et al.,
2012). Very often, expensive physico-chemical treatments are advisable for the
treatment of these industrial wastewaters, due to the potential inhibitory effect of
phenolic compounds over microorganisms in the biological treatment (Oller et al.,
2011), specifically the inhibition of the nitrification process by phenolic compounds
(Hu et al., 2005; Liu et al., 2005; Morita et al., 2007).
A possible option for achieving this challenge with only biological treatments
could be the technology of aerobic granules. The systems based on aerobic granular
biomass are known to perform better in front of inhibitory or toxic compounds
compared to activated sludge systems because granule architecture causes diffusion
gradients contributing to protect sensitive bacteria (Adav et al., 2009; Maszenan et al.,
2011). In this sense, some studies have shown the possibility of aerobic granules to
perform simultaneous removal of ammonium and phenolic compounds (Liu et al., 2011;
Suja et al., 2012).
1 2 3 4 5 6 7 8 9 10 11 12 13 14 15 16 17 18 19 20 21 22 23 24 25 26 27 28 29 30 31 32 33 34 35 36 37 38 39 40 41 42 43 44 45 46 47 48 49 50 51 52 53 54 55 56 57 58 59 60 61 62 63 64 65
3
Besides, the development and maturation of aerobic granules is performed, in
general, in sequencing batch reactors (SBR) where high hydrodynamic stress is applied
to form and to maintain the granules (Gao et al., 2011). Nevertheless, conventional
batch operation is not advisable for treatment of phenolic compounds that usually
exhibit inhibition by substrate (Martín-Hernández et al., 2009). To solve this problem,
continuous operation could be a suitable option, since the concentration of the
recalcitrant compounds in the reactor is expected to be low due to the high removal
efficiency, reducing their toxic effect in the reactor. This high removal efficiency could
be attained from the beginning of the operation by performing a controlled enrichment
of the specific degrading biomass, i.e. by feeding this kind of compounds progressively
during the start-up (Martín-Hernández et al., 2009).
In this sense, the development of a biological treatment dealing simultaneously
with phenols and ammonium-rich wastewaters is of paramount importance.
In this study, p-nitrophenol (PNP) was selected as model compound of the
nitrophenols family that are widely used, as reflected by their inclusion in the list of
High Volume Production Chemicals (OECD, 2008). So that, the simultaneous
nitritation and PNP removal using a continuous aerobic-granular airlift-reactor is
investigated and evaluated for the treatment of an industrial wastewater containing PNP
and a high concentration of ammonium . Granular biomass was characterized in terms
of size, density, sludge volumetric index, settling velocity and contents of exopolymeric
substances (EPS). Fluorescence in-situ hybridization (FISH) coupled with confocal
laser scanning microscopy (CLSM) was also performed for identification and
quantification of the predominant bacteria species and to determine their spatial
arrangement in the granules.
1 2 3 4 5 6 7 8 9 10 11 12 13 14 15 16 17 18 19 20 21 22 23 24 25 26 27 28 29 30 31 32 33 34 35 36 37 38 39 40 41 42 43 44 45 46 47 48 49 50 51 52 53 54 55 56 57 58 59 60 61 62 63 64 65
4
2. Materials and Methods
2.1. Experimental set-up and reactor conditions
A glass airlift reactor with a working volume of 2.6 L was used. The internal
diameter of the down-comer was 62.5 mm. The riser had a height of 750 mm and an
internal diameter of 42.5 mm, and it was at 8 mm from the bottom of the down-comer.
Figure S1 in supporting information depicts a schematic diagram of the experimental
set-up. Compressed air was supplied through an air diffuser placed at the bottom of the
reactor. The reactor was equipped with dissolved oxygen (DO) (Crison DO 6050) and
pH probes (Crison pH 5333) that were connected to a data monitoring system (Crison
Multimeter 44). The temperature in the reactor was maintained using a temperature
controller coupled with a belt-type heating device (Horst, Germany). pH of the reactor
was maintained by a regular addition of NaHCO3 into the reactor. Feeding to the reactor
was made with a membrane pump (ProMinent Gamma/L). Air flow-rate in the reactor
was regulated by rotameter (Aalborg, USA) with a range of 125-500 mL min-1
. Samples
were regularly withdrawn from the effluent and filtered through 0.20 m syringe filter
driven unit from Milipore® provided with a high-density polyethylene housing and
membrane of hydrophilic Durapore® (PVDF) prior to analysis. The operational
conditions in the reactor during the experimental period were: Temperature of 30 ± 1 ºC
and pH of 8.1 ± 0.4.
2.2. Wastewater composition
The airlift reactor was fed with synthetic wastewater containing 3.6 g L-1
NH4Cl
(950 ± 25 mg N-NH4+ L
-1) and the following compounds and micronutrients
1 2 3 4 5 6 7 8 9 10 11 12 13 14 15 16 17 18 19 20 21 22 23 24 25 26 27 28 29 30 31 32 33 34 35 36 37 38 39 40 41 42 43 44 45 46 47 48 49 50 51 52 53 54 55 56 57 58 59 60 61 62 63 64 65
5
(concentrations are expressed in mg L-1
): CH3COONa, 48.0; glucose, 12.5; sucrose,
11.9; CaCl2·2H2O, 88.0; KH2PO4, 41.0; NaCl, 176.0; MgCl2·7H2O, 198.0; FeSO4·7H2O,
4.0; MnSO4·H2O, 3.0; ZnSO4·7H2O, 4.0; CuSO4·5H2O, 2.0; and H3BO3, 0.02;
CO(NH2)2, 12.0 and yeast extract, 2.0. In addition, an increasing amount of PNP was
added to the influent, for details see Section 2.4 and Figure S2 in supporting
information.
2.3. Inoculum and reactor operation before bioaugmentation
The airlift reactor was inoculated with 1 L of granular biomass from a granular
sequencing batch reactor (GSBR) at pilot scale treating low-strength wastewater for
simultaneous carbon, nitrogen, phosphorus removal (Isanta et al., 2012). Then, the
reactor was operated in continuous using a synthetic high-strength ammonium
wastewater (950 ± 25 mg N-NH4+ L
-1) to obtain nitritation maintaining the DO /
ammonium concentration ratio below 0.02 mg O2 mg-1
N (Bartrolí et al. 2010). Prior to
bioaugmentation, the reactor was performing partial nitritation, oxidising ca. 48% of
ammonium to nitrite at 0.3 ± 0.1 g N L-1
d-1
of volumetric nitrogen loading rate (NLRV).
The average effluent concentrations were: ammonium, 505 ± 40 mg N L-1
; nitrite, 462 ±
40 mg N L-1
and nitrate, 2 ± 1 mg N L-1
. Just before bioaugmentation, the granular
biomass characteristics were as follow: mean size (mm) 1.1 ± 0.7, settling velocity (m h-
1) 66 ± 27, sludge volumetric index (SVI5) (mL g
-1 TSS) 8 ± 2, ratio SVI5/SVI30 1.0 and
biomass density (g VSS Lparticle-1
) 370 ± 140.
2.4. Bioaugmentation and operational strategy
At day 0, the airlift reactor was bioaugmented with 500 mL (2 g VSS L-1
) of a
floccular sludge from a SBR performing stable PNP degradation (Martín-Hernández et
1 2 3 4 5 6 7 8 9 10 11 12 13 14 15 16 17 18 19 20 21 22 23 24 25 26 27 28 29 30 31 32 33 34 35 36 37 38 39 40 41 42 43 44 45 46 47 48 49 50 51 52 53 54 55 56 57 58 59 60 61 62 63 64 65
6
al., 2009). The bioaugmented biomass was accounted to be 15 % of the total biomass
inside the airlift reactor. Martín-Hernández et al. (2012) suggested using ca. 5 % w/w
for a successful bioaugmentation and retention of specialised biomass in a SBR.
Considering that the airlift reactor was operating in continuous and biomass wash out
would be inevitable, 15% of bioaugmented biomass was added instead of the 5% used
by Martín-Hernández et al. (2012). The bioaugmentation procedure was repeated twice,
on days 7 and 14.
The microbial composition of the PNP-degrading floccular sludge was
characterized through fluorescence in situ hybridization (FISH) coupled to confocal
laser scanning microscope (CLSM) following the protocol developed by Suárez-Ojeda
et al. (2011). The FISH-CLSM results allowed identification and quantification of
Arthrobacter sp. (26±2 %) and genus Acinetobacter (31±10 %) as the PNP-degraders in
the floccular sludge, whereas no hybridization was found for Burkholderia sp. and
Pseudomonas spp.
The PNP concentration was progressively increased during the experimental
period to minimise its potential toxic or inhibitory effect over the granular biomass.
During the first 14 days, PNP concentration in the influent was of 5 mg PNP L-1
, then, it
was increased to 10 mg PNP L-1
during the next 115 days, and finally it reached 15 mg
PNP L-1
for the last 111 days of the experiment (the reader is kindly referred to the
Figure S2 in supporting information for a graphical overview of the feeding strategy).
This feeding strategy was selected by two reasons: (i) the progressive increase of
PNP should allow to ease biodegradation and to promote the growth of specific PNP-
degrading bacteria into the granules, and (ii) the AOB inhibition/toxicity by PNP should
be minimized.
1 2 3 4 5 6 7 8 9 10 11 12 13 14 15 16 17 18 19 20 21 22 23 24 25 26 27 28 29 30 31 32 33 34 35 36 37 38 39 40 41 42 43 44 45 46 47 48 49 50 51 52 53 54 55 56 57 58 59 60 61 62 63 64 65
7
2.5. Analytical methods
PNP was determined by High Performance Liquid Chromatography (HPLC) as
described by Martín-Hernández et al., (2009). The ammonium as total ammonia
nitrogen (TAN = N-NH4+ + N-NH3), the nitrite as total nitrite nitrogen (TNN = N-NO2
-
+ N-HNO2) and nitrate concentrations were measured as described by Bartrolí et al.,
(2010). Volatile suspended solids (VSS), total suspended solids (TSS) and sludge
volumetric index (SVI) were determined using the procedure described in Standard
Methods (APHA, 1998). The granular biomass was characterized in terms of size,
granule density, settling velocity and EPS content. The size distribution of the granules
was measured regularly by using image analysis with an optical microscope Zeiss
Axioskop equipped with a video camera (iAi Protec). The digital image captured was
further processed using Image-Pro Plus version 6.0 (Media Cybernetics, Inc.,). The
procedure followed was (i) to convert the original image to black and white for image
processing, (ii) to define the threshold in order to delimit the area of interest in the
image (i.e. the granules) and (iii) to export the selected data with the software to a
worksheet. For each mean size determination, at least 50 granules were used. The
density of the granular biomass was determined using the Dextran Blue method
described by Beun et al. (2002). The settling velocity was determined by placing
individual granule in a column containing the described wastewater and measuring the
time spent to drop a height of 40 cm (Bartrolí et al., 2010). The EPS were extracted
from the granules using formaldehyde + NaOH according to Adav and Lee, (2011).
p-Nitrophenol (granular solid form, purity 99%) and ammonium chloride (purity
99.5%) were employed and supplied by Panreac (Spain) and Carl Roth (Germany),
1 2 3 4 5 6 7 8 9 10 11 12 13 14 15 16 17 18 19 20 21 22 23 24 25 26 27 28 29 30 31 32 33 34 35 36 37 38 39 40 41 42 43 44 45 46 47 48 49 50 51 52 53 54 55 56 57 58 59 60 61 62 63 64 65
8
respectively. All the chemicals and other reagents were purchased from Sigma-Aldrich
(Spain) and the highest purities available were employed.
2.6. Determination of the oxygen half-saturation coefficient for PNP-degraders (KOPNP)
and the ammonia-oxidising bacteria (AOB) inhibition coefficient for PNP (KIPNP,AOB)
KOPNP represents the DO concentration at which the PNP biodegradation rate is
half of its maximum value:
Eq. (1)
where r is the PNP degradation rate (g PNP L-1
d-1
), rmax is the maximum PNP
degradation rate (g PNP L-1
d-1
), [DO] is the DO concentration (mg O2 L-1
) and KOPNP is
the oxygen half-saturation coefficient for PNP-degraders (mg O2 L-1
).
In order to determine the KOPNP, a respirometric experiment was carried out
following the procedure proposed by Guisasola et al. (2005). In brief, the procedure for
KOPNP determination is based on monitoring the drop in DO concentration in a
respirometer when external aeration is stopped, and the biomass is consuming substrate
(PNP in this case) without limitation. At this moment, the DO concentration in the
liquid phase sharply decreased because of the oxygen consumption being linked to the
substrate consumption. This oxygen consumption rate corresponded to the maximum
oxygen uptake rate (OURmax) assuming that no substrate limitations existed. It is
essential to avoid any substrate limitation (except for oxygen) for a reliable KOPNP
estimation. The oxygen mass balance that describes this system is as follows:
1 2 3 4 5 6 7 8 9 10 11 12 13 14 15 16 17 18 19 20 21 22 23 24 25 26 27 28 29 30 31 32 33 34 35 36 37 38 39 40 41 42 43 44 45 46 47 48 49 50 51 52 53 54 55 56 57 58 59 60 61 62 63 64 65
9
Eq. (2)
where kLasup
is the global oxygen mass transfer constant through the liquid-gas surface
(d-1
), [DO*] is the DO concentration at saturation (mg O2 L
-1), [DO] is the DO
concentration (mg O2 L-1
), OURend is the endogenous OUR value (mg O2 L-1
d-1
),
OURmax is the maximum OUR value (mg O2 L-1
d-1
) and KOPNP is the oxygen half-
saturation coefficient for PNP-degraders (mg O2 L-1
).
An open and aerated Liquid-Flow-Static (LFS) respirometer was employed. The
volume of the respiration vessel was 1 L and it was magnetically stirred. pH, DO
concentration and temperature were measured in the liquid phase through a DO probe
(WTW-Cellox 325) and a pH probe (WTW-Sentix 81), which were connected via RS-
232 with the PC to store and monitor the data. The respiration vessel was submerged in
a thermostatic bath, and the temperature was maintained at 30.0 ± 0.5 C. The pH was
maintained at 8.0 ± 0.1 with controlled addition of HCl (1M) and NaOH (1M). The
PNP-degrading biomass was a floccular sludge obtained from a SBR performing stable
PNP biodegradation (Martín-Hernández et al., 2009).
The KIPNP,AOB determination was carried out following the procedure described by
Suárez-Ojeda et al. (2010). In brief, the percentage of inhibition was determined by
comparing the OURmax measured when a control pulse is added inside a respirometer,
before (1st pulse) and after (2
nd pulse) an inhibitor pulse according to:
Eq. (3)
1 2 3 4 5 6 7 8 9 10 11 12 13 14 15 16 17 18 19 20 21 22 23 24 25 26 27 28 29 30 31 32 33 34 35 36 37 38 39 40 41 42 43 44 45 46 47 48 49 50 51 52 53 54 55 56 57 58 59 60 61 62 63 64 65
10
Respirometric tests were performed to measure the AOB inhibition by PNP.
Ammonium was used as a control substrate, and different concentrations of PNP 0.5, 2,
15, 25 and 30 mg L-1
were used as the inhibitory substrate. Each test consisted in three
sequential pulses: a first pulse of 10 mg N-NH4+ L
-1, a pulse of PNP and finally a
second pulse of 10 mg N-NH4+ L
-1added after the DO concentration return to its initial
DO concentration value (the DO before the first control substrate was added). An
example of one of these tests can be seen in Figure S3 (supporting information). The
experiment set-up was similar to the previously described for the KOPNP determination.
The temperature was maintained at 30.0 ± 0.5 C while the pH was maintained at 8.0 ±
0.1 with controlled addition of HCl (1M) and NaOH (1M). The enriched AOB culture
was a floccular sludge obtained from a pilot plant performing stable full nitritation
(Torà et al., 2012).
The AOB inhibition by PNP was modelled as a non-competitive inhibition as
follows:
Eq. (4)
where [PNP] is the PNP concentration (mg L-1
) and KIPNP,AOB is the AOB inhibition
coefficient for PNP (mg L-1
).
All parameters were estimated using MATLAB 7.5 (The Mathworks, Natick, MA,
USA). The differential equation was solved using an explicit Runge-Kutta formula.
Parameter estimation was carried out by using the Nelder-Mead Simplex search
method.
1 2 3 4 5 6 7 8 9 10 11 12 13 14 15 16 17 18 19 20 21 22 23 24 25 26 27 28 29 30 31 32 33 34 35 36 37 38 39 40 41 42 43 44 45 46 47 48 49 50 51 52 53 54 55 56 57 58 59 60 61 62 63 64 65
11
2.7. FISH analysis
FISH coupled with CLSM was used to determine the fractions of PNP-degraders,
of betaproteobacterial ammonia-oxidising bacteria (βAOB) and of nitrite-oxidising
bacteria (NOB) in crushed granules. Sliced granules were used for determining the
distribution of bacteria species along the granule geometry. Both analyses were
performed at the end of the experimental period. Hybridization was carried out using
probes targeting specific microorganisms for PNP-degraders (ACA652 and KO 02),
βAOB (Nso190) and NOB (NIT3). The general probe consisting of equal parts of
UNIV1390 and EUBmix was used for detection of all bacteria. The probes used for
PNP-degraders were selected taking into account the characterisation of the PNP-
degraders culture used for bioaugmentation following the methodology stated by
Suárez-Ojeda et al. 2011 (see section 2.4. Bioaugmentation and operational strategy).
For biomass fractions quantification, the granular biomass was crushed using a
mortar and a pestle and then, FISH procedure was followed. The quantification of the
microbial populations was performed following a modification of the procedure
described in Jubany et al., (2009), where 40-50 microscopic fields were analyzed, and a
single z-position was selected based on the highest intensity for each sample.
For sliced granules, entire granules were embedded in paraffin wax before their
sectioning with a microtome. Slices with a thickness of 3 μm were cut, and each single
section was placed on the surface of poly-L-lysine coated microscopic slides prior to
follow the FISH protocol. In order to obtain a better sliced granule staining, the amount
of probe used in the hybridisation step was increased 4 to 5 times, depending on the
total area of the sliced granule.
1 2 3 4 5 6 7 8 9 10 11 12 13 14 15 16 17 18 19 20 21 22 23 24 25 26 27 28 29 30 31 32 33 34 35 36 37 38 39 40 41 42 43 44 45 46 47 48 49 50 51 52 53 54 55 56 57 58 59 60 61 62 63 64 65
12
A Leica TCS-SP5 AOBS confocal laser scanning microscope (Leica
Microsystems Heidelberg GmbH, Mannheim, Germany) was used with a HC PL APO
CS 63x1.25 oil objective and equipped with two He-Ne lasers and a hybrid detector.
3. Results and discussion
3.1. Performance of the granular airlift reactor for simultaneous nitritation and PNP
removal
Before performing bioaugmentation, a batch test was carried out to assess the
capacity of nitrifying granules to biodegrade PNP (data not shown). The test consisted
on the addition of a pulse of ammonium and PNP in an aerated batch reactor. The
results of this test showed that the nitrifying granular biomass was not able to
biodegrade PNP. Moreover, PNP-degrading species in the nitrifying granules (section
2.7) was assessed through FISH-CLSM with negative results for genus Acinetobacter
and for Arthrobacter sp. Consequently, the nitrifying granular airlift reactor was
bioaugmented with floccular PNP-degrading biomass as explained in section 2.4.
The performance of nitritation and PNP biodegradation in the bioaugmented
aerobic granular airlift reactor is shown in Figure 1. As can be seen in Figure 1.A, two
periods can be distinguished regarding nitritation performance. In the first period from
day-0 to day-185, the applied NLRV was 0.4 ± 0.1 g N L-1
d-1
, while during the second
period from day-185 onwards, an average NLRV of 1.0 ± 0.1 g N L-1
d-1
was applied.
In the first period, the reactor was performing stable nitritation with an average of
62 % of ammonium oxidation and less than 0.2 % of nitrate in the effluent with a DO
concentration in the bulk liquid of 1± 0.5 mg O2 L-1
(Figure 1.B). However, PNP
biodegradation behaviour (Figure 1.C) was rather unstable.
1 2 3 4 5 6 7 8 9 10 11 12 13 14 15 16 17 18 19 20 21 22 23 24 25 26 27 28 29 30 31 32 33 34 35 36 37 38 39 40 41 42 43 44 45 46 47 48 49 50 51 52 53 54 55 56 57 58 59 60 61 62 63 64 65
13
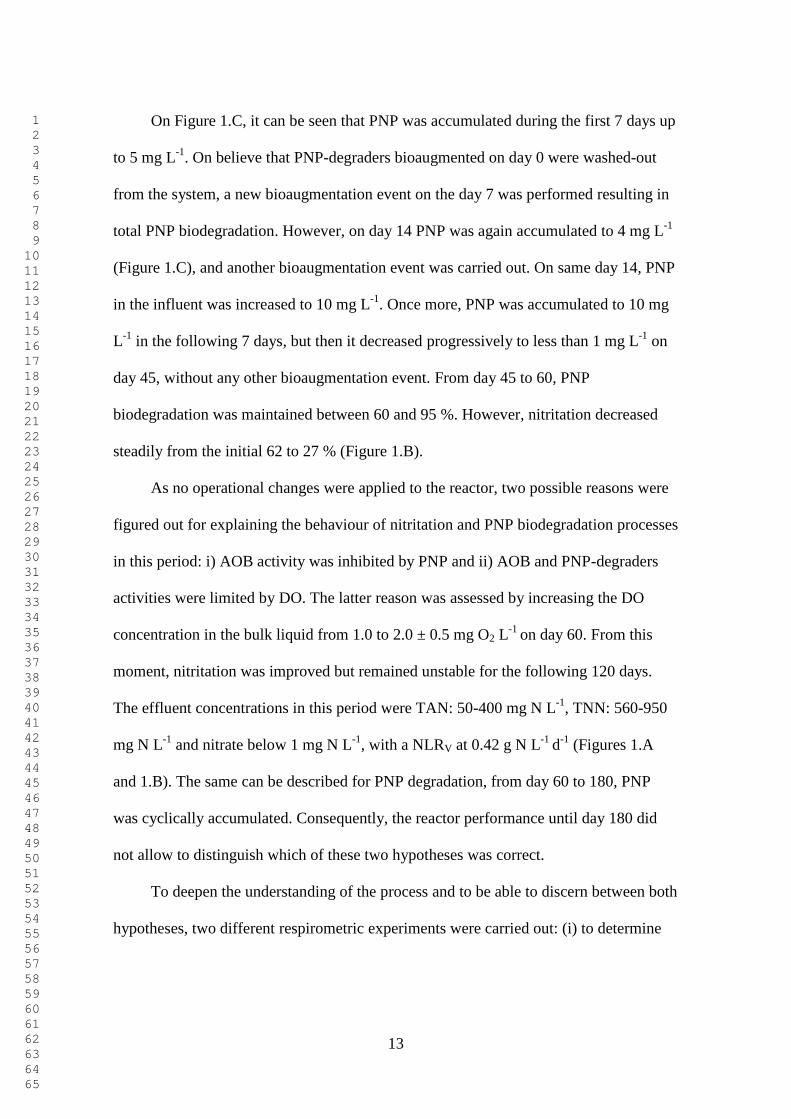
On Figure 1.C, it can be seen that PNP was accumulated during the first 7 days up
to 5 mg L-1
. On believe that PNP-degraders bioaugmented on day 0 were washed-out
from the system, a new bioaugmentation event on the day 7 was performed resulting in
total PNP biodegradation. However, on day 14 PNP was again accumulated to 4 mg L-1
(Figure 1.C), and another bioaugmentation event was carried out. On same day 14, PNP
in the influent was increased to 10 mg L-1
. Once more, PNP was accumulated to 10 mg
L-1
in the following 7 days, but then it decreased progressively to less than 1 mg L-1
on
day 45, without any other bioaugmentation event. From day 45 to 60, PNP
biodegradation was maintained between 60 and 95 %. However, nitritation decreased
steadily from the initial 62 to 27 % (Figure 1.B).
As no operational changes were applied to the reactor, two possible reasons were
figured out for explaining the behaviour of nitritation and PNP biodegradation processes
in this period: i) AOB activity was inhibited by PNP and ii) AOB and PNP-degraders
activities were limited by DO. The latter reason was assessed by increasing the DO
concentration in the bulk liquid from 1.0 to 2.0 ± 0.5 mg O2 L-1
on day 60. From this
moment, nitritation was improved but remained unstable for the following 120 days.
The effluent concentrations in this period were TAN: 50-400 mg N L-1
, TNN: 560-950
mg N L-1
and nitrate below 1 mg N L-1
, with a NLRV at 0.42 g N L-1
d-1
(Figures 1.A
and 1.B). The same can be described for PNP degradation, from day 60 to 180, PNP
was cyclically accumulated. Consequently, the reactor performance until day 180 did
not allow to distinguish which of these two hypotheses was correct.
To deepen the understanding of the process and to be able to discern between both
hypotheses, two different respirometric experiments were carried out: (i) to determine
1 2 3 4 5 6 7 8 9 10 11 12 13 14 15 16 17 18 19 20 21 22 23 24 25 26 27 28 29 30 31 32 33 34 35 36 37 38 39 40 41 42 43 44 45 46 47 48 49 50 51 52 53 54 55 56 57 58 59 60 61 62 63 64 65
14
the AOB inhibition coefficient for PNP (KIPNP,AOB) and (ii) to determine the oxygen
half-saturation coefficient for PNP-degraders (KOPNP).
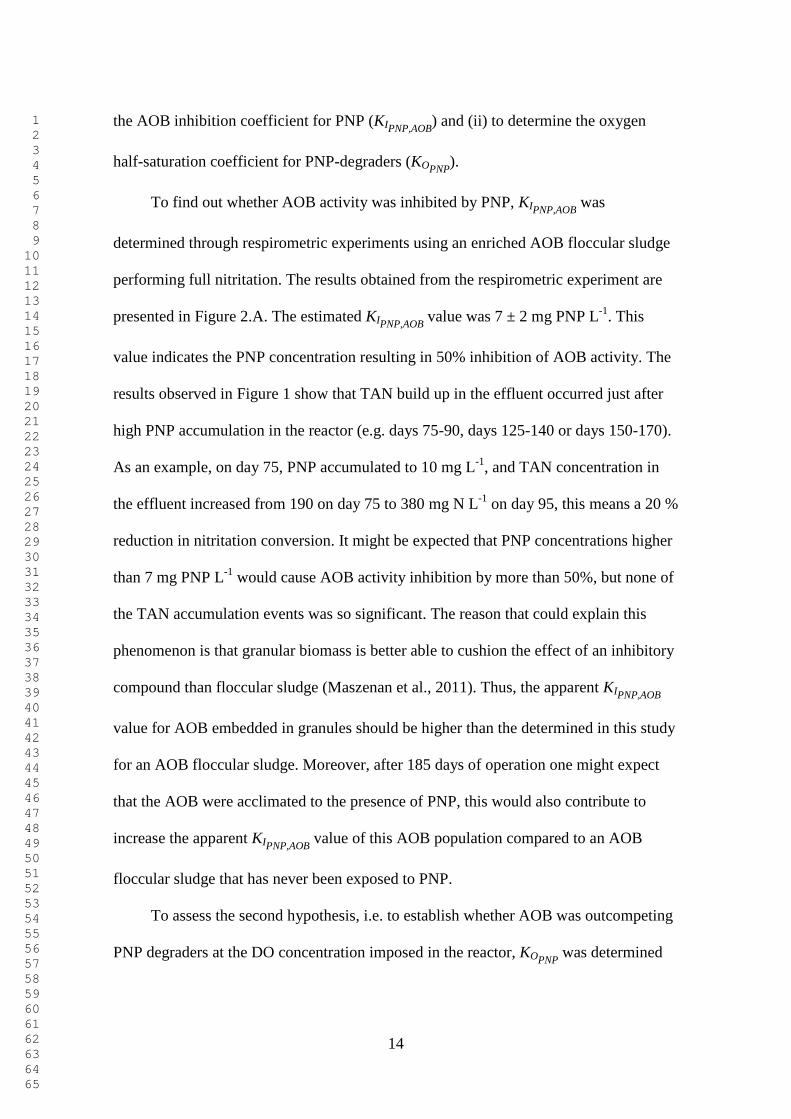
To find out whether AOB activity was inhibited by PNP, KIPNP,AOB was
determined through respirometric experiments using an enriched AOB floccular sludge
performing full nitritation. The results obtained from the respirometric experiment are
presented in Figure 2.A. The estimated KIPNP,AOB value was 7 ± 2 mg PNP L
-1. This
value indicates the PNP concentration resulting in 50% inhibition of AOB activity. The
results observed in Figure 1 show that TAN build up in the effluent occurred just after
high PNP accumulation in the reactor (e.g. days 75-90, days 125-140 or days 150-170).
As an example, on day 75, PNP accumulated to 10 mg L-1
, and TAN concentration in
the effluent increased from 190 on day 75 to 380 mg N L-1
on day 95, this means a 20 %
reduction in nitritation conversion. It might be expected that PNP concentrations higher
than 7 mg PNP L-1
would cause AOB activity inhibition by more than 50%, but none of
the TAN accumulation events was so significant. The reason that could explain this
phenomenon is that granular biomass is better able to cushion the effect of an inhibitory
compound than floccular sludge (Maszenan et al., 2011). Thus, the apparent KIPNP,AOB
value for AOB embedded in granules should be higher than the determined in this study
for an AOB floccular sludge. Moreover, after 185 days of operation one might expect
that the AOB were acclimated to the presence of PNP, this would also contribute to
increase the apparent KIPNP,AOB value of this AOB population compared to an AOB
floccular sludge that has never been exposed to PNP.
To assess the second hypothesis, i.e. to establish whether AOB was outcompeting
PNP degraders at the DO concentration imposed in the reactor, KOPNP was determined
1 2 3 4 5 6 7 8 9 10 11 12 13 14 15 16 17 18 19 20 21 22 23 24 25 26 27 28 29 30 31 32 33 34 35 36 37 38 39 40 41 42 43 44 45 46 47 48 49 50 51 52 53 54 55 56 57 58 59 60 61 62 63 64 65
15
through a specific respirometric test (Figure 2.B). The estimated KOPNP was 1.65 ± 0.01
mg O2 L-1
. This value is close to that reported by Contreras et al. (2008) for phenol
(KOPhenol= 1.84 mg O2 L
-1), higher than that reported for AOB (0.74 mg O2 L
-1) by
Guisasola et al.(2005) and much higher than that reported for heterotrophic bacteria of
0.20 mg O2 L-1
(Henze et al., 2000). Therefore, the supplied DO concentration at 2.0 mg
O2 L-1
throughout the first 185 days of the operational period was insufficient for
maintaining a stable full PNP degradation because the aerobic PNP biodegradation was
limited by DO concentration. This finding confirmed the hypothesis about oxygen
limiting condition to explain the instability of PNP removal in the reactor.
In view of these results, from day 185 onward the second period of the airlift
operation was started with a DO concentration in the bulk liquid of 4.5 ± 0.5 mg O2 L-1
aim was to obtain full PNP biodegradation that will further eliminate AOB inhibition.
Complete and stable PNP degradation was achieved on day 185 onward, allowing to
increase both, PNP-loading rate and NLRV to 16 PNP L-1
d-1
and 1.0 g N L-1
d-1
,
respectively. It is interesting to highlight that despite the simultaneous PNP
biodegradation, this NLRv is comparable to the reported in the literature for the
treatment of high-strength ammonium wastewater at 30ºC but, without containing any
phenolic compound: Yamamoto et al. (2011) 0.7-2.6 g N L-1
d-1
, Okabe et al. (2011)
1.0-1.8 g N L-1
d-1
and Bartrolí et al. (2010) 0.75-6.1 g N L-1
d-1
.
Moreover, nitrite oxidation was always prevented due to the strong oxygen
limiting conditions imposed in the reactor for NOB. Although since day 60 onwards,
DO concentration in the reactor was between 2.0 and 4.5 mg O2 L-1
, the TAN
concentration was always kept in great excess. Therefore, the DO/TAN concentration
ratio in the reactor was very low (between 0.04 and 0.16 mg O2 mg-1
N), outcompeting
1 2 3 4 5 6 7 8 9 10 11 12 13 14 15 16 17 18 19 20 21 22 23 24 25 26 27 28 29 30 31 32 33 34 35 36 37 38 39 40 41 42 43 44 45 46 47 48 49 50 51 52 53 54 55 56 57 58 59 60 61 62 63 64 65
16
the NOB in the granules, as already demonstrated in previous studies (Bartrolí et al.,
2010; Jemaat et al., 2013). This fact is later confirmed with the FISH analyses, where
occurrence of Nitrobacter sp. was very low (see section 3.2 for further details).
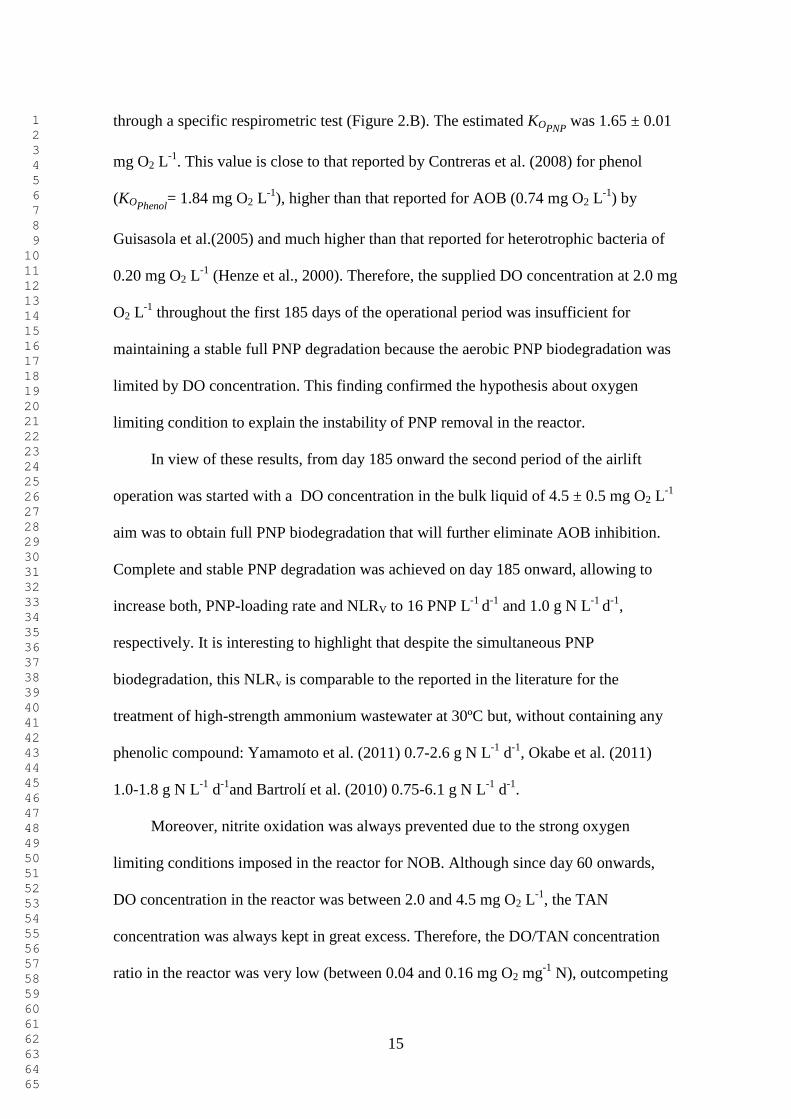
The biomass concentration in the reactor was maintained between 2.4 to 3.2 g
VSS L-1
(Figure 3.A). On the first 30 days of the experimental period, an increase of
effluent biomass concentration was observed up to a maximum of 250 mg VSS L-1
(Figure 3.A). This would be related to the washout of a fraction of the bioaugmented
PNP-degrading floccular sludge that could not be retained in the reactor. From day 50 to
the end of the experimental period, the biomass concentration in the effluent was always
maintained at a low value 39 ± 20 mg VSS L-1
. The good settling ability of the granular
biomass is demonstrated by the low SVI5 values obtained, ranging from 9 to 13 ± 2 mL
g-1
TSS (Figure 3.B). Only SVI5 was depicted in Figure 3.B since SVI30 values were
identical to SVI5 values throughout the whole operational period, and consequently the
SVI30/SVI5 ratio was always one.
3.2. Characteristics of the granular biomass and identification of dominant species in the
granules
Granule size, biomass density and settling velocity were not significantly affected
throughout the operational period (Figures 3.B and 3.C). The biomass density decreased
during the first 100 days of operation from 390 g VSS Lparticle -1
until a stable value of
210 g VSS Lparticle -1
. This could be explained by the development and attachment of
heterotrophic biomass able to degrade PNP in the form of filamentous structures that
inevitably will decrease the compactness of granular biomass (see section 3.2). All the
1 2 3 4 5 6 7 8 9 10 11 12 13 14 15 16 17 18 19 20 21 22 23 24 25 26 27 28 29 30 31 32 33 34 35 36 37 38 39 40 41 42 43 44 45 46 47 48 49 50 51 52 53 54 55 56 57 58 59 60 61 62 63 64 65
17
parameters were in the range expected for granular sludge, according the review
performed by Gao et al. (2011).
EPS content in granules was unchanged during the first 100 days of operation
(Table 1). However, a slight increase was observed at the end of the reactor operation.
An increase of EPS concentration in this period could be linked to: i) the increase in DO
concentration through an increase in the airflow-rate applied to the reactor and
consequently, higher shear stress conditions were applied to the granules and ii) the
increase in the applied loading rate. Both actions could stimulate the microbial activity
and thus, increase production of EPS (Tay et al., 2001a). In general, higher
concentrations of PS than PN were observed during the operational period (Table 1).
The high PS content in EPS was also reported in several studies with nitrifying granules
(Tay et al., 2001b; Liu and Tay, 2004). High PS content was noted to facilitate cell to
cell adhesion and strengthen the microbial structure through a polymeric matrix (Adav
et al., 2008).
Besides the determination of DO concentration as an important parameter
enhancing the overall performance of this biofilm reactor, another key feature for
maintaining simultaneous nitritation and PNP biodegradation at long-term is the
development, retention and attachment of the PNP-degraders over the nitrifying
granules. To observe the morphological changes in the nitrifying granules throughout
the experimental period, a magnifying glass was used to obtain pictures of the granules
on days 0, 112 and 220 (Figure S4, in supporting information). On the beginning, the
nitrifying granules possessed a smooth surface and regular granular shape (Figure
S4.A). After 112 days of operation and also on day 220, the outer surface of nitrifying
granules were covered with filamentous structures (Figures S4.B and S4.C), probably
1 2 3 4 5 6 7 8 9 10 11 12 13 14 15 16 17 18 19 20 21 22 23 24 25 26 27 28 29 30 31 32 33 34 35 36 37 38 39 40 41 42 43 44 45 46 47 48 49 50 51 52 53 54 55 56 57 58 59 60 61 62 63 64 65
18
linked to the growth of bacteria related to PNP biodegradation. FISH analysis was
performed at the end of the operational period to aiming to confirm this supposition.
The results from FISH -CLSM identified that only Acinetobacter genus and
βAOB were the predominant populations at the end of the experimental period, whereas
Nitrobacter sp. was detected at very low occurrence and Arthrobacter sp. was never
detected in the samples. It was quantified that Acinetobacter genus accounted for about
50±14%, βAOB for 49±20% and Nitrobacter sp for 1±1%. Acinetobacter genus
detected in the granules was one of the dominant bacteria populations in the
bioaugmented PNP-degraders (section 2.4), responsible for PNP biodegradation. These
results seem to indicate that only Acinetobacter genus and not Arthrobacter sp. was
capable of being retained in the granular airlift reactor. The low occurrence of
Nitrobacter sp confirms that NOB were outcompeted by AOB in the granules due to the
imposed DO/TAN concentration ratio that guarantees strong oxygen limiting conditions
for NOB, as already demonstrated in previous studies (Bartrolí et al., 2010).
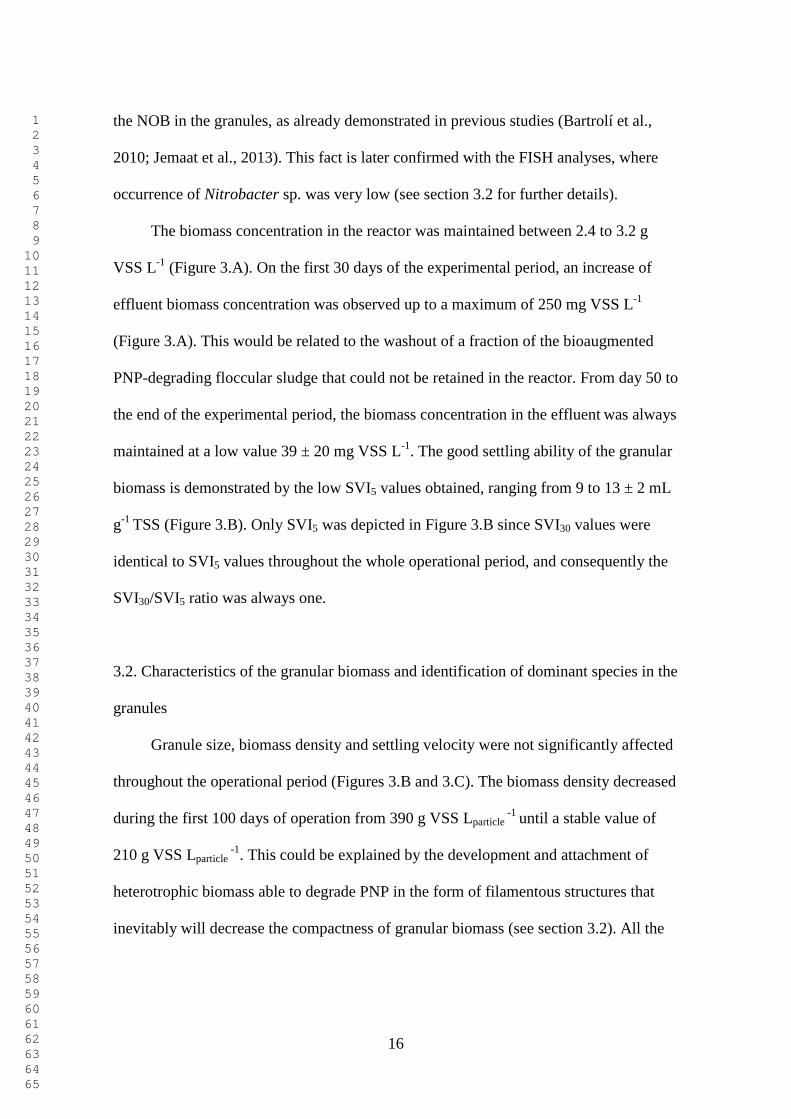
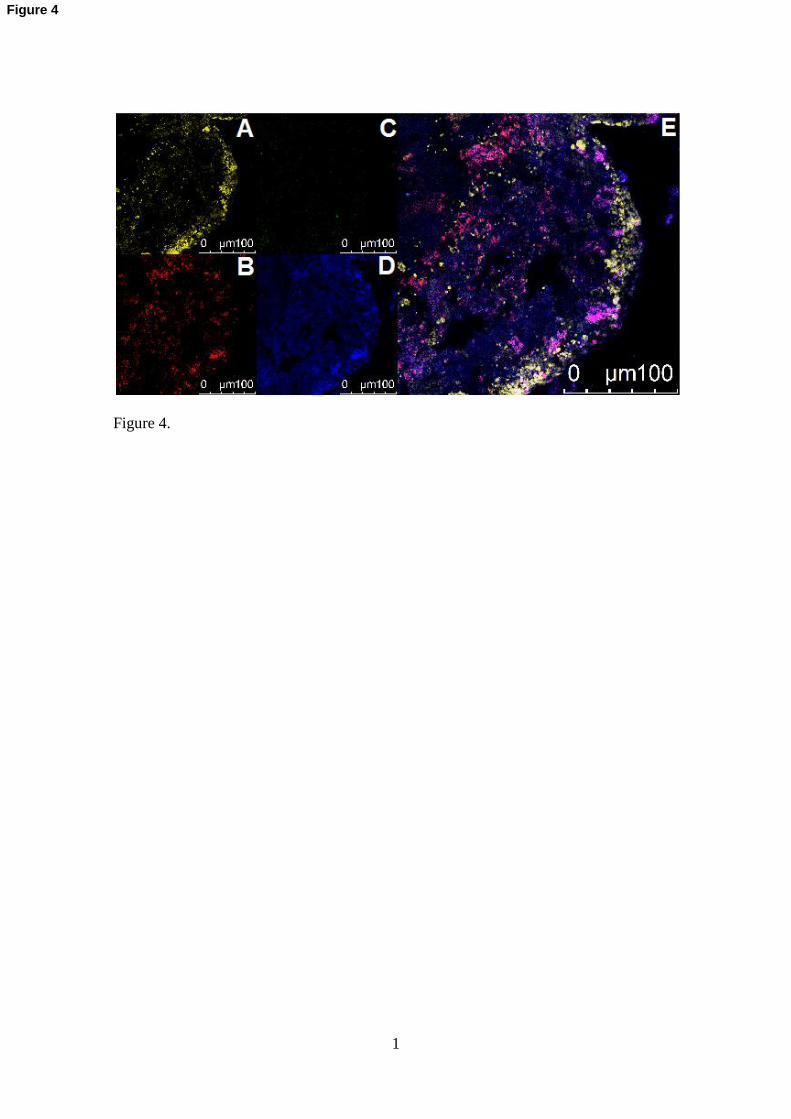
Figure 4 shows the spatial distribution of the different bacterial populations in a
sliced granule. Acinetobacter genus seems to proliferate in the outer layer (Figure 4.A),
whereas βAOB tends to locate in the inner layers of the granule (Figure 4.B) and
Nitrobacter sp. is almost undetectable (Figure 4.C). As in Figure S4, some filaments are
also visible in Figure 4. These results confirm not only the development of the specific
heterotrophic bacteria for PNP biodegradation, but a microbial stratification in the
aerobic granules following different metabolic activities. This stratification is probably
the key for understanding the high capacity of the AOB population in the granules to
bear significant PNP concentrations in the bulk liquid.
3.3 Practical implications of this study
1 2 3 4 5 6 7 8 9 10 11 12 13 14 15 16 17 18 19 20 21 22 23 24 25 26 27 28 29 30 31 32 33 34 35 36 37 38 39 40 41 42 43 44 45 46 47 48 49 50 51 52 53 54 55 56 57 58 59 60 61 62 63 64 65
19
The results show that a continuous biological treatment dealing simultaneously with p-
nitrophenol removal and nitritation of ammonium-rich wastewaters is feasible by using
aerobic granules. However, for achieving complete nitrogen removal a following step
must be coupled to this reactor, which could be done either through heterotrophic
denitrification or using anammox bacteria.
There is no doubt that the cheapest process, from both the economical and the
environmental point of view, will be partial nitritation plus anammox. However, the
complexity of real industrial wastewaters is a tremendous challenge and sometimes an
obstacle for the anammox process due to the inhibition of the anammox bacteria by
several pollutants (Jin et al., 2013).
In this sense, a more robust process towards the presence of phenols in the
effluent of the nitrification reactor could be a heterotrophic denitrification as pointed out
by De la Torre-Velasco et al. (2013). The key points of this integrated process will be: i)
The use of aerobic granular biomass for the simultaneous treatment of phenols and
ammonium-rich wastewater for producing a suitable effluent for the heterotrophic
denitrification, ii) the use of a suitable [DO]/[TAN] ratio to achieve and to maintain
stable nitritation, avoiding oxygen limiting conditions for getting a stable removal of
phenols.
4. Conclusions
Simultaneous nitritation and PNP biodegradation was successfully demonstrated
in a single reactor using aerobic granular sludge. Nitritation, with less than 0.3% of N-
NO3-, was steadily maintained for more than 185 days despite unstable PNP
biodegradation
1 2 3 4 5 6 7 8 9 10 11 12 13 14 15 16 17 18 19 20 21 22 23 24 25 26 27 28 29 30 31 32 33 34 35 36 37 38 39 40 41 42 43 44 45 46 47 48 49 50 51 52 53 54 55 56 57 58 59 60 61 62 63 64 65
20
Bioaugmentation enhanced the formation of a diversified microbial consortium
(AOB and PNP-degraders) over the granules. The oxygen limiting conditions were
found to be the key factor affecting the stability of PNP biodegradation, as complete
PNP degradation was achieved and stably maintained when DO concentration was
increased to a non-limiting value.
The granular characteristics were not significantly affected during the
simultaneous nitritation and PNP biodegradation.
5. Acknowledgements
This study was supported by the Spanish Ministerio de Economía y
Competitividad through the ONLYBIO project (CTQ2011-24745/PPQ). The authors are
members of the GENOCOV research group (2009 SGR 815). Z. Jemaat wants to thank
Ministry of Higher Education of Malaysia and the Universiti Malaysia Pahang for his
SLAB fellowship.
1 2 3 4 5 6 7 8 9 10 11 12 13 14 15 16 17 18 19 20 21 22 23 24 25 26 27 28 29 30 31 32 33 34 35 36 37 38 39 40 41 42 43 44 45 46 47 48 49 50 51 52 53 54 55 56 57 58 59 60 61 62 63 64 65
21
6. References
[1] Adav, S.S., Lee, D.-J., Tay, J.-H., 2008. Extracellular polymeric substances and
structural stability of aerobic granule. Water Res. 42, 1644-1650.
[2] Adav, S.S., Lee, D.-J., Lai, J.-Y., 2009. Treating chemical industries influent using
aerobic granular sludge: Recent development. J. Taiwan Inst. Chem. E. 40, 333-
336.
[3] Adav, S.S., Lee, D.-J., 2011. Characterization of extracellular polymeric substances
(EPS) from phenol degrading aerobic granules. J. Taiwan Inst. Chem. E. 42, 645-
651.
[4] APHA., 1998. Standard methods for the examination of water and wastewater.
American Public Health Association/ American Water Works Association/ Water
Environment Federation. Washington DC, USA.
[5] Bartrolí, A., Pérez, J., Carrera, J., 2010. Applying ratio control in a continuous
granular reactor to achieve full nitritation under stable operating conditions.
Environ. Sci. Technol. 44, 8930-8935.
[6] Beun, J.J., van Loosdrecht, M.C.M., Heijnen, J.J., 2002. Aerobic granulation in a
sequencing batch airlift reactor. Water Res. 36, 702-712.
[7] Contreras, E.M., Albertario, M.E., Bertola, N.C., Zaritzky, N.E., 2008. Modelling
phenol biodegradation by activated sludges evaluated through respirometric
techniques. J. Hazard. Mater. 158, 366-374.
[8] De la Torre-Velasco, A., Beristain-Cardoso, R., Damian-Matsumura, P., Gómez, J.,
2013. Sequential nitrification-denitrification process for nitrogenous, sulfurous and
phenolic compounds removal in the same bioreactor. Bioresource Technol. 139,
220-225.
1 2 3 4 5 6 7 8 9 10 11 12 13 14 15 16 17 18 19 20 21 22 23 24 25 26 27 28 29 30 31 32 33 34 35 36 37 38 39 40 41 42 43 44 45 46 47 48 49 50 51 52 53 54 55 56 57 58 59 60 61 62 63 64 65
22
[9] Gao, D., Liu, L., Liang, H., Wu, W.-M., 2011. Aerobic granular sludge:
characterization, mechanism of granulation and application to wastewater
treatment. Crc. Cr. Rev. Biotechn. 31, 137-152.
[10] Guisasola, A., Jubany, I., Baeza, J.A., Carrera, J., Lafuente, J., 2005. Respirometric
estimation of the oxygen affinity constants for biological ammonium and nitrite
oxidation. J. Chem. Technol. Biot. 80, 388-396.
[11] Henze, M., Gujer, W., Mino, T., van Loosdrecht, M.C.M., 2000. Activated sludge
models ASM1, ASM2, ASM2d and ASM3, IWA, London.
[12] Hu, Z., Ferraina, R.A., Ericson, J.F., Mackay, A.A., Smets, B.F., 2005. Biomass
characteristics in three sequencing batch reactors treating a wastewater containing
synthetic organic chemicals. Water Res. 39, 710-720.
[13] Isanta, E., Suárez-Ojeda, M.E., Val del Río, Á., Morales, N., Pérez, J., Carrera, J.,
2012. Long term operation of a granular sequencing batch reactor at pilot scale
treating a low-strength wastewater. Chem. Eng. J. 198-199, 163-170.
[14] Jemaat, Z., Bartrolí, A., Isanta, E., Carrera, J., Suárez-Ojeda, M.E., Pérez, J., 2013.
Closed-loop control of ammonium concentration in nitritation: Convenient for
reactor operation but also for modeling. Bioresource Technol. 128, 655-663.
[15] Jin, R.-C., Zhang, Q.-Q., Yang, G.-F., Xing, B.-S., Ji, Y.-X., Chen, H., 2013.
Evaluating the recovery performance of the ANAMMOX process following
inhibition by phenol and sulfide. Bioresource Technol. 142 162-170.
[16] Jubany, I., Lafuente, J., Carrera, J., Baeza, J.A., 2009. Automated thresholding
method (ATM) for biomass fraction determination using FISH and confocal
microscopy. J. Chem. Technol. Biot. 84, 1140-1145.
1 2 3 4 5 6 7 8 9 10 11 12 13 14 15 16 17 18 19 20 21 22 23 24 25 26 27 28 29 30 31 32 33 34 35 36 37 38 39 40 41 42 43 44 45 46 47 48 49 50 51 52 53 54 55 56 57 58 59 60 61 62 63 64 65
23
[17] Liu, L., Sheng, G.-P., Li, W.-W., Tong, Z.-H., Zeng, R.J., Liu, J.-X., Xie, J., Peng,
S.-C., Yu, H.-Q., 2011. Cultivation of aerobic granular sludge with a mixed
wastewater rich in toxic organics. Biochem. Eng. J. 57, 7-12.
[18] Liu, Y., Tay, J.-H., 2004. State of the art of biogranulation technology for
wastewater treatment. Biotechnol. Adv. 22, 533-563.
[19] Liu, Y.-Q., Tay, J.-H., Ivanov, V., Moy, B.Y.-P., Yu, L., Tay, S.T.-L., 2005.
Influence of phenol on nitrification by microbial granules. Process Biochem. 40,
3285-3289.
[20] Martín-Hernández, M., Carrera, J., Pérez, J., Suárez-Ojeda, M.E., 2009.
Enrichment of a K-strategist microbial population able to biodegrade p-nitrophenol
in a sequencing batch reactor. Water Res. 43, 3871-3883.
[21] Martín-Hernández, M., Suárez-Ojeda, M.E., Carrera, J., 2012. Bioaugmentation for
treating transient or continuous p-nitrophenol shock loads in an aerobic sequencing
batch reactor. Bioresource Technol. 123, 150-156.
[22] Maszenan, A.M., Liu, Y., Ng, W.J., 2011. Bioremediation of wastewaters with
recalcitrant organic compounds and metals by aerobic granules. Biotechnol. Adv.
29, 111-123.
[23] Milia, S., Cappai, G., Perra, M., Carucci, A., 2012. Biological treatment of
nitrogen-rich refinery wastewater by partial nitritation (SHARON) process.
Environ. Technol. 33, 1477-1483.
[24] Morita, M., Kudo, N., Uemoto, H., Watanabe, A., Shinozaki, H., 2007. Protective
effect of immobilized ammonia oxidizers and phenol-degrading bacteria on
nitrification in ammonia– and phenol-containing wastewater. Eng. Life Sci. 7, 587-
592.
1 2 3 4 5 6 7 8 9 10 11 12 13 14 15 16 17 18 19 20 21 22 23 24 25 26 27 28 29 30 31 32 33 34 35 36 37 38 39 40 41 42 43 44 45 46 47 48 49 50 51 52 53 54 55 56 57 58 59 60 61 62 63 64 65
24
[25] OECD, 2008. The 2004 Organisation for Economic Co-operation and
Development (OECD) list of high production volume chemicals.
http://www.oecd.org/dataoecd/55/38/33883530.pdf. Last time consulted:
24/09/2013.
[26] Okabe, S., Oshiki, M., Takahashi, Y., Satoh, H., 2011. Development of long-term
stable partial nitrification and subsequent anammox process. Bioresource Technol.
102, 6801-6807.
[27] Oller, I., Malato, S., Sánchez-Pérez, J.A., 2011. Combination of advanced
oxidation processes and biological treatments for wastewater decontamination-A
review. Sci. Total Environ. 409, 4141-4166.
[28] Suárez-Ojeda, M.E., Guisasola, A., Carrera, J., 2010. Inhibitory impact of quinone-
like compounds over partial nitrification. Chemosphere 80, 474-480.
[29] Suárez-Ojeda, M.E., Montón, H., Roldán, M., Martín-Hernández, M., Pérez, J.,
Carrera, J., 2011. Characterization of a p-nitrophenol-degrading mixed culture with
an improved methodology of fluorescence in situ hybridization and confocal laser
scanning microscopy. J. Chem. Technol. Biot. 86, 1405-1412.
[30] Suja, E., Nancharaiah, Y.V., Venugopalan, V.P., 2012. p-Nitrophenol
biodegradation by aerobic microbial granules. Appl. Biochem. Biotech. 167, 1569-
1577.
[31] Tay, J.H., Liu, Q.S., Liu, Y., 2001a. The effects of shear force on the formation,
structure and metabolism of aerobic granules. Appl. Microbiol. Biot. 57, 227-233.
[32] Tay, J.H., Liu, Q.S., Liu, Y., 2001b. Microscopic observation of aerobic
granulation in sequential aerobic sludge blanket reactor. J. Appl. Microbiol. 91,
168-175.
1 2 3 4 5 6 7 8 9 10 11 12 13 14 15 16 17 18 19 20 21 22 23 24 25 26 27 28 29 30 31 32 33 34 35 36 37 38 39 40 41 42 43 44 45 46 47 48 49 50 51 52 53 54 55 56 57 58 59 60 61 62 63 64 65
25
[33] Torà, J.A., Lafuente, J., Carrera, J., Baeza, J.A., 2012. Fast start-up and controlled
operation during a long-term period of a high-rate partial nitrification activated
sludge system. Environ. Technol. 33, 1361-1366.
[34] Van Hulle, S., Vandeweyer, H., Meesschaert, B., Vanrolleghem, P., Dejans, P.,
Dumoulin A., 2010. Engineering aspects and practical application of autotrophic
nitrogen removal from nitrogen rich streams. Chem. Eng. J. 162, 1-20.
[35] Yamamoto, T., Wakamatsu, S., Qiao, S., Hira, D., Fujii, T., Furukawa, K., 2011.
Partial nitritation and anammox of a livestock manure digester liquor and analysis
of its microbial community. Bioresource Technol. 102, 2342-2347.
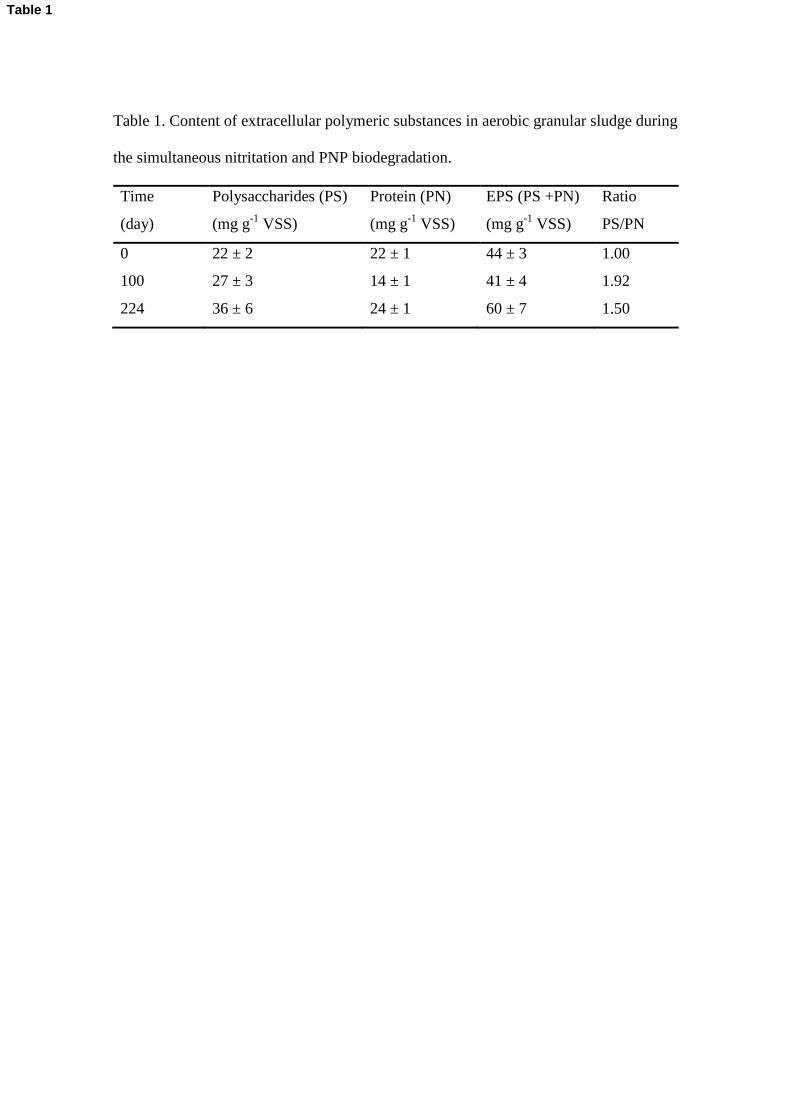
Table 1. Content of extracellular polymeric substances in aerobic granular sludge during
the simultaneous nitritation and PNP biodegradation.
Time
(day)
Polysaccharides (PS)
(mg g-1
VSS)
Protein (PN)
(mg g-1
VSS)
EPS (PS +PN)
(mg g-1
VSS)
Ratio
PS/PN
0 22 ± 2 22 ± 1 44 ± 3 1.00
100 27 ± 3 14 ± 1 41 ± 4 1.92
224 36 ± 6 24 ± 1 60 ± 7 1.50
Table 1
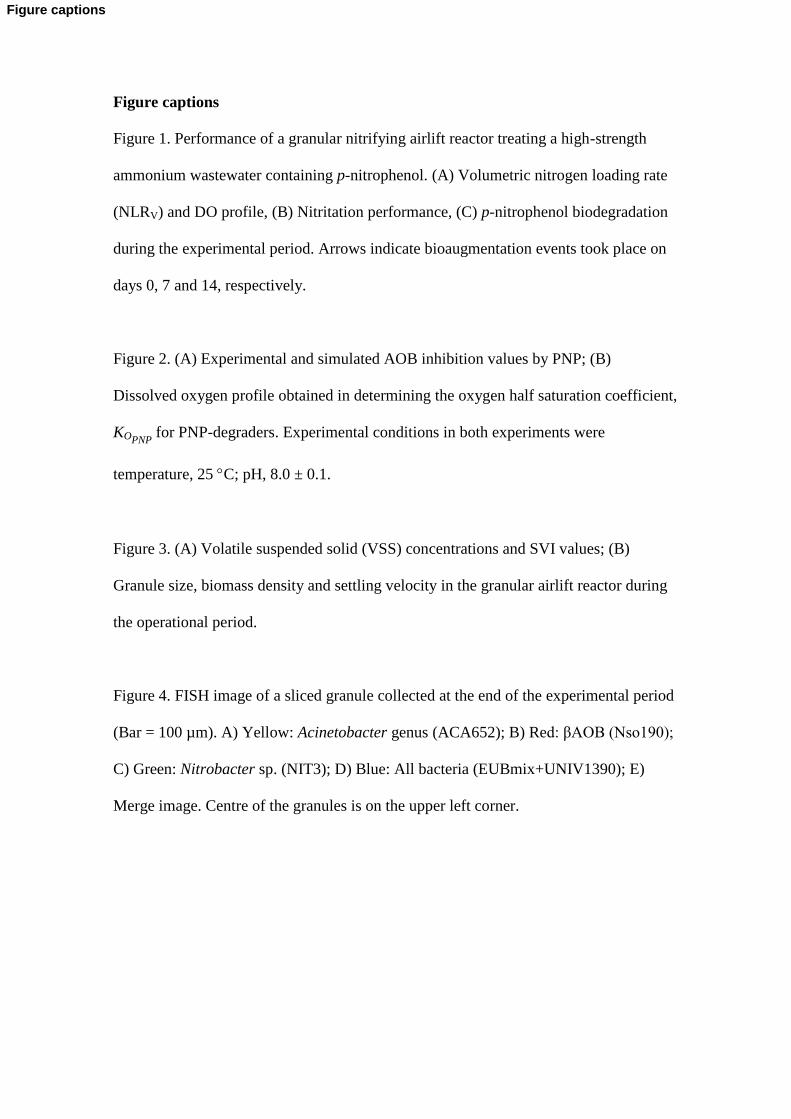
Figure captions
Figure 1. Performance of a granular nitrifying airlift reactor treating a high-strength
ammonium wastewater containing p-nitrophenol. (A) Volumetric nitrogen loading rate
(NLRV) and DO profile, (B) Nitritation performance, (C) p-nitrophenol biodegradation
during the experimental period. Arrows indicate bioaugmentation events took place on
days 0, 7 and 14, respectively.
Figure 2. (A) Experimental and simulated AOB inhibition values by PNP; (B)
Dissolved oxygen profile obtained in determining the oxygen half saturation coefficient,
KOPNP for PNP-degraders. Experimental conditions in both experiments were
temperature, 25 C; pH, 8.0 ± 0.1.
Figure 3. (A) Volatile suspended solid (VSS) concentrations and SVI values; (B)
Granule size, biomass density and settling velocity in the granular airlift reactor during
the operational period.
Figure 4. FISH image of a sliced granule collected at the end of the experimental period
(Bar = 100 µm). A) Yellow: Acinetobacter genus (ACA652); B) Red: βAOB (Nso190);
C) Green: Nitrobacter sp. (NIT3); D) Blue: All bacteria (EUBmix+UNIV1390); E)
Merge image. Centre of the granules is on the upper left corner.
Figure captions
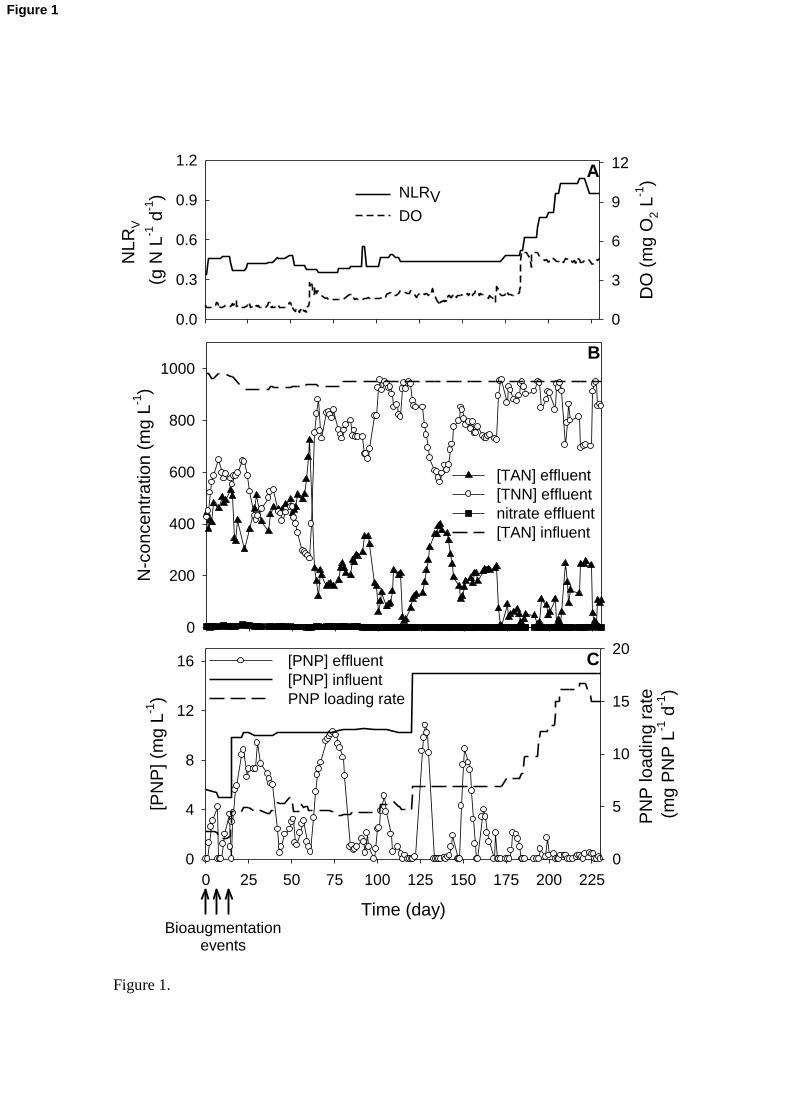
Figure 1.
N-c
on
ce
ntr
atio
n (
mg
L-1
)
0
200
400
600
800
1000
[TAN] effluent
[TNN] effluent
nitrate effluent
[TAN] influent
NL
RV
(g N
L-1
d-1
)
0.0
0.3
0.6
0.9
1.2
DO
(m
g O
2 L
-1)
0
3
6
9
12
NLRV
DO
Time (day)
0 25 50 75 100 125 150 175 200 225
[PN
P]
(mg
L-1
)
0
4
8
12
16P
NP
lo
adin
g r
ate
(mg
PN
P L
-1 d
-1)
0
5
10
15
20[PNP] effluent
[PNP] influent
PNP loading rate
A
B
C
Bioaugmentationevents
Figure 1
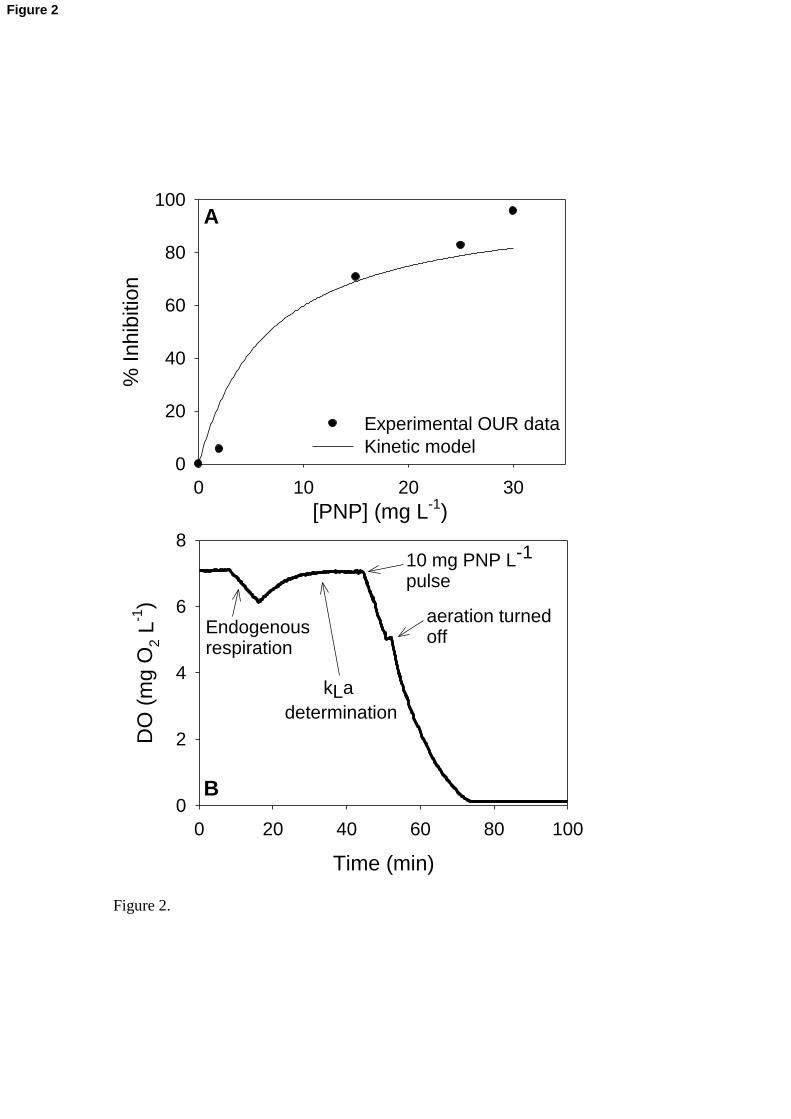
Figure 2.
[PNP] (mg L-1)
0 10 20 30
% Inhib
itio
n
0
20
40
60
80
100
Experimental OUR data
Kinetic model
Time (min)
0 20 40 60 80 100
DO
(m
g O
2 L
-1)
0
2
4
6
8
A
B
kLa
determination
10 mg PNP L-1 pulse
aeration turnedoff
Endogenous respiration
Figure 2
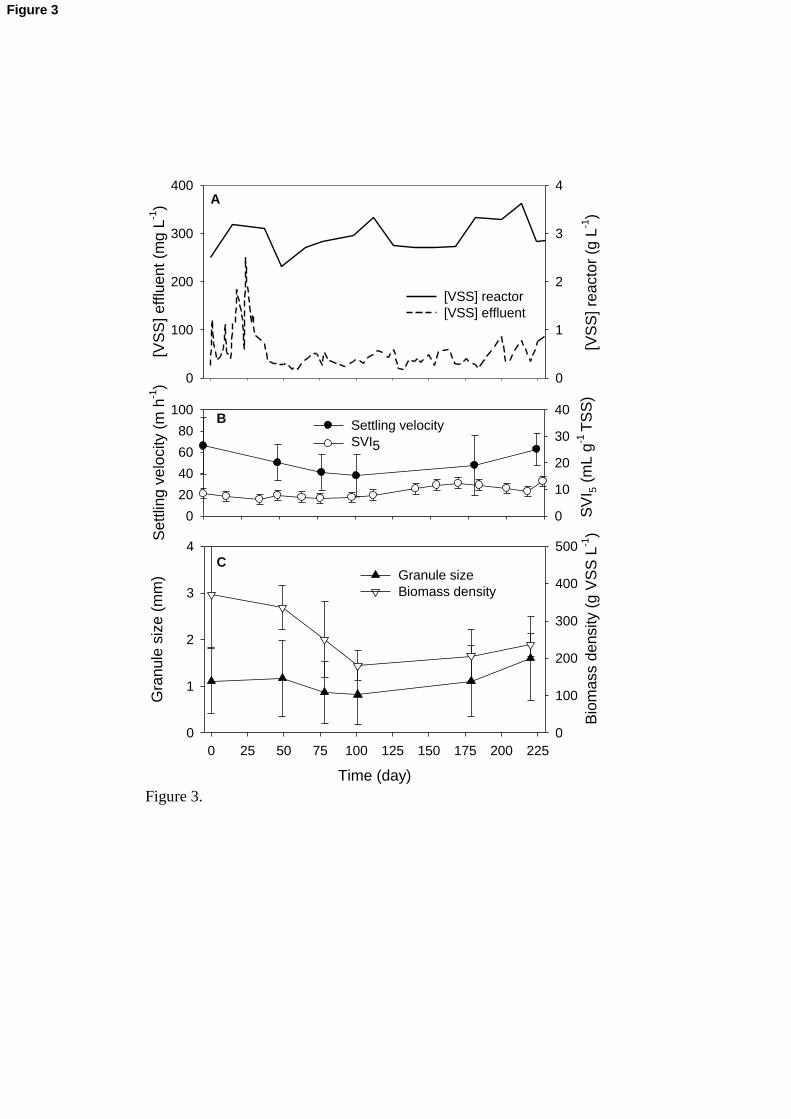
Figure 3.
Time (day)
0 25 50 75 100 125 150 175 200 225
Gra
nule
siz
e (
mm
)
0
1
2
3
4
Bio
mass d
ensity (
g V
SS
L-1
)
0
100
200
300
400
500
Granule size
Biomass density[V
SS
] re
acto
r (g
L-1
)
0
1
2
3
4
[VS
S]
eff
luent
(mg L
-1)
0
100
200
300
400
[VSS] reactor
[VSS] effluent
A
Sett
ling v
elo
city (
m h
-1)
0
20
40
60
80
100
SV
I 5 (
mL g
-1 T
SS
)
0
10
20
30
40Settling velocity
SVI5
B
C
Figure 3
1
Figure 4.
Figure 4