simultaneous measurement of the raman gain coefficient and the nonlinear refractive index of optical...
TRANSCRIPT

426 J. Opt. Soc. Am. B/Vol. 22, No. 2 /February 2005 Oguama et al.
Simultaneous measurement of the Raman gaincoefficient and the nonlinear refractive
index of optical fibers: theory and experiment
Ferdinand A. Oguama
Ultrafast Optics and Optoelectronics Laboratory, Department of Physics, New Jersey Institute of Technology,Newark, New Jersey 07102
Hernando Garcia
Department of Physics, Southern Illinois University, Edwardsville, Illinois 62026
Anthony M. Johnson
Center for Advanced Studies in Photonics Research, University of Maryland, Baltimore County, 1000 Hilltop Circle,Baltimore, Maryland 21250
Received March 24, 2004; revised manuscript received August 22, 2004; accepted August 25, 2004
We report for the first time, to our knowledge, a technique that has the capability to measure both the Ramangain coefficient and the nonlinear refractive index of an optical fiber, using the same experimental setup. Thismeasurement utilizes the induced-grating autocorrelation (IGA) technique, which is based upon time-delayedfour-beam coupling in a photorefractive crystal. The standard IGA trace, which is based upon two-beam cou-pling, fits a simple model based on pure self-phase modulation (SPM). We demonstrate that, in the negligible-dispersion regime of an optical fiber, the addition of stimulated Raman scattering (SRS) leads to a measurabledistortion of the standard (pure SPM) IGA trace. We have developed a new IGA model from the analyticalsolution of the coupled-amplitude nonlinear Schrodinger equation. This new model successfully accounts forthe effect of SRS on the IGA trace in the negligible-dispersive regime of the fiber and allows the direct deter-mination of the Raman gain coefficient and the nonlinear refractive index from the fit of the SRS distorted IGAtrace. The measured nonlinear refractive index and the Raman gain coefficient are in good agreement withpublished results. © 2005 Optical Society of America
OCIS codes: 060.2300, 190.4370, 190.5330.
1. INTRODUCTIONOne of the greatest challenges in optical communicationis the understanding and control of optical fiber nonlin-earities. Whereas these nonlinearities limit the power-handling capacity of optical fibers and can cause noise,signal distortion, and cross talk in optically amplifiedtransmission systems,1–4 they have been equally har-nessed for the development of a new generation of opticalamplifiers5–8 and tunable laser sources.9–11 The twoprominent parameters that characterize the nonlinearproperties of an optical fiber are the nonlinear refractiveindex (n2) and the Raman gain coefficient ( gR). Theseparameters are related to the third-order nonlinear sus-ceptibility @x (3)#. In general, the third-order nonlinearsusceptibility can be represented as the sum of two terms;the first is a nonresonant (real) electronic contribution,and the second is a resonant (imaginary) contribution as-sociated with molecular vibrations (Raman susceptibil-ity). This can be expressed mathematically as12:
x~3 !~Dv! 5 xNR~3 ! 1 xR
~3 !~Dv!. (1)
The imaginary part of the resonant susceptibility is anti-symmetric in Dv. It determines the Raman gain coeffi-cient:
0740-3224/2005/020426-11$15.00 ©
gR~Dv! 5 Im@xR~3 !~Dv!#
4pvo
cno. (2)
On the other hand, the expression for the nonlinear re-fractive index is given by
n2 52p
no$xNR
~3 ! 1 Re@xR~3 !~0 !#%. (3)
We can neglect the real contribution to the nonlinear sus-ceptibility from molecular vibration $Re@xR
(3)(0)#% at timescales of the order of picoseconds.
Different techniques for measurement of the Ramangain coefficient in optical fibers have been reported by anumber of authors.13–18 With the exception of a fewcases,13 the available techniques for measurement of theRaman gain coefficient have always required the use ofvery long fibers, (z ; 10 km),15–18 whereas some requirethe use of two independent laser sources.14,18 In addi-tion, one would generally require a separate and indepen-dent experiment to measure the nonlinear refractive in-dex of the fiber.19–29 We have recently used a time-delayed photorefractive beam-coupling technique that wecall induced grating autocorrelation (IGA) to measure the
2005 Optical Society of America

Oguama et al. Vol. 22, No. 2 /February 2005 /J. Opt. Soc. Am. B 427
nonlinear refractive index of short (,25 m) lengths ofsilica and erbium-doped fibers.29
In this paper, we show that with the IGA technique, itis possible to measure the Raman gain coefficient and thenonlinear refractive index simultaneously in shortlengths (z ; 20–100 m) of fiber, using 50–70-ps pulses.This new technique relies on the fact that with reasonablyshort lengths of fiber (such that dispersion can be ne-glected), stimulated Raman scattering (SRS) leads to ameasurable distortion30 of the IGA trace of a self-phase-modulated Gaussian pulse. Standard IGA traces fit asimple model of self-phase modulation (SPM) for a Gauss-ian pulse propagating in the zero group velocity disper-sion (GVD) regime.29,31,32 Experimentally, we begin bycoupling intense 50–70-ps duration pulses from a cwmode-locked Nd:YAG laser at 1064 nm into the fiber un-der test. The fiber output pulses, which have interactedwith the fiber nonlinearities, are then directed into amodified interferometer with one arm fixed and the otherwith a variable delay. We produce an IGA trace by vary-ing the delay between two coherent excitation pulses thatform a photorefractive phase grating (via interference in aphotorefractive medium) and by plotting the diffracted in-tensity of one beam (the probe) as a function of the rela-tive delay. In the simple model of IGA, the detected sig-nal (Wdet) is proportional to the squared magnitude of theelectric field autocorrelation function given by29,31,32:
uk~t!u2 5 U E2`
`
E~t !E* ~t 1 t!dtU2
. (4)
In the limits of pure SPM, the electric field in the aboveequation is simply the solution of the nonlinear waveequation for a self-phase-modulated Gaussian pulse,31
which has acquired a time-dependent phase shift whilepropagating through the fiber.32,33 Thus
E~t ! 5 E0 expH 22 ln 2S t
tpD 2
2 i@v0t 1 f~t !#J . (5)
In the above equation, f(t) is the time-dependent phasethat also obtains a Gaussian character given by29,32:
f~t ! 5 v0tpQ expF24 ln 2S t
tpD 2G , (6)
where v0tpQ is the self-phase modulation strength.29,32
We previously reported29,34 the nonlinear refractive in-dex measurements in short lengths of fibers (z < 20 m)using the IGA technique, on the basis of the above simpletheory. Figure 1 shows typical experimental IGA data re-corded for an optical pulse that has undergone SPM (only)in the absence of GVD. As can be seen from the figure,the fit of the experimental data to the standard IGAmodel for pure SPM [Eq. (4)] is excellent. In performingsuch experiments29,34 one usually keeps the input powerlevel in the fiber low enough that SRS is negligible. Inrecent experiments aimed at extending the applicabilityof this technique, it was observed30,35,36 that SRS distortsthe IGA trace and leads to deviations of the measuredIGA traces from the above simple (pure SPM) model.Figure 2 shows an experimentally measured SRS dis-torted IGA trace (with ;15% Raman conversion) fitted tothe standard IGA model. As can be seen, this fit is very
poor and clearly indicates the breakdown of the standardIGA model. The deviation is characterized by the liftingof the base regions around the central peak of the IGAtrace and the gradual depletion of the sidelobes. Inter-estingly, these deviations are symmetric about the centralpeak of the IGA trace and are found to depend on the in-put power in the fiber as well as the germania content ofthe fiber core.36 To take into account the SRS effect onthe IGA, we have developed a new IGA model (that fitsthe experimental data) from the analytical solution of thecoupled-amplitude nonlinear Schrodinger equation thatincludes both SPM and SRS contributions in thenegligible-dispersion regime of the fiber (using the unde-pleted pump approximation).37–39 The resulting IGA re-sponse is modeled in the context of four-beam coupling inphotorefractive media. This new model successfully ac-counts for the effect of SRS on the IGA trace and allowsthe direct determination of the Raman gain coefficientand the nonlinear refractive index of the fiber from the fitof the SRS distorted IGA trace of the fiber output pulse.
Fig. 1. Typical measured IGA trace for a self-phase-modulatedGaussian pulse (after propagation through a 20-m length of fiber,with Aeff ; 8.8 mm2) fitted to the standard IGA model.
Fig. 2. Typical measured SRS distorted IGA trace at 15% Ra-man conversion, fitted to the standard IGA model for pure SPM.The experimental data showed clear deviations from the pureSPM model [Er-Al-Ge doped fiber with high (;28% M) GeO2content].

428 J. Opt. Soc. Am. B/Vol. 22, No. 2 /February 2005 Oguama et al.
2. PULSE PROPAGATION IN OPTICALFIBER IN THE PRESENCE OF SPM AND SRSIN THE NONDISPERSIVE REGIMEIn the slowly varying amplitude approximation, thecoupled-amplitude nonlinear Schrodinger equation suit-able for describing the propagation of relatively shortpulses in an optical fiber in the presence of SPM and SRScan be written as37:
]Ap
]z1
i
2b2p
]2Ap
]T21
ap
2Ap
5 igp[uApu2 1 ~2 2 fR!uAsu2]Ap 2gp
2uAsu2Ap , (7a)
]As
]z1
i
2b2s
]2As
]T21
as
2As 2 d
]As
]T
5 igs[uAsu2 1 ~2 2 fR!uApu2]As 1gs
2uApu2As ,
(7b)
where T 5 t 2 b1z 5 t 2 z/vg is the time measured in aframe of reference moving with the pulse at group velocityvg and b1 is the group velocity parameter. In the aboveequations, Aj ( j 5 p or s, representing the pump andStokes pulses, respectively) is the slowly varying ampli-tude of the pulse envelope; b2j is the GVD parameter, andg j 5 n2v j /cAeff is the nonlinear parameter, where n2 isthe nonlinear refractive index and Aeff is the effective corearea of the fiber. The parameter fR represents the frac-tional contribution of the delayed Raman response to thenonlinear polarization37,40; typically, fR is ;0.18. Thewalk-off parameter d is introduced to account for thegroup velocity mismatch between the pump and Ramanpulses (d 5 1/vgp 2 1/vgs). Equation (7) is valid for pi-cosecond pulses with pulse widths between 1 and 100 ps.Thus transient effects are negligible, since the pulsewidths are large compared with the Raman response time(;50 fs). This is accompanied by the assumption thatthe pump spectrum is narrow compared with the Ramangain spectrum. Higher-order nonlinear effects, such asself-frequency shift and self-steepening, can therefore beneglected. Self-frequency shift results from intrapulseRaman scattering, a process in which energy is trans-ferred within the same pulse from the high-frequencycomponent to the low-frequency component. Self-steepening, on the other hand, arises from the intensitydependence of the group velocity. Both self-frequencyshift and self-steepening occur for ultrashort pulses withpulsewidths less than 1 ps. In addition, the upper limitof the pulsewidth (100 ps) ensures that the walk-offlength (Lw) does not exceed the experimental fiber length(z).
For short lengths of fibers (as generally obtained in IGAexperiments), we can neglect pulse dispersion (b2p5 b2s 5 0) and fiber loss (ap 5 as 5 0). Thus the soleeffect of the nonlinear refractive index in this approxima-tion is to induce SPM on the pump and Stokes pulseswithout leading to a redistribution of energy within thepulse through GVD. Equation (7) therefore reduces to
]Ap
]z5 igp[uApu2 1 ~2 2 fR!uAsu2]Ap 2
gp
2uAsu2Ap ,
(8a)
]As
]z2 d
]As
]T
5 igs[uAsu2 1 ~2 2 fR!uApu2]As 1gs
2uApu2As .
(8b)
Equations (8) are applicable when the fiber length (z) issuch LD @ z > LNL (where LD is the dispersion lengthand LNL is the nonlinear length), which is the necessarycondition for the nonlinearity-dominant propagation re-gime. When the fiber length z is comparable with bothLD and LNL , then both dispersive and nonlinear effectsneed to be included, and Eqs. (8) are no longer valid. Thespecific values of LD and LNL depend on the fiber type, thelaser pulse width, and the input power. Typically, forpure silica fiber LD exceeds 20 km for a 50-ps pulse at1064 nm, while LNL is ;8 m at a peak power of 25 W.However, both LD and LNL become smaller as pulses be-come shorter and more intense. The optimum fiberlengths (z) for IGA experiments with 50-ps pulses aretypically 15–100 m for pure silica fiber.
An analytical solution to Eqs. (8) is obtained by use ofthe undepleted pump approximation.37–39 This assumesthat the Stokes amplitude is small compared with thepump, such that uApu2 @ uAsu2. Therefore all terms con-taining uAsu2 in Eqs. (8) can be dropped, so that we are leftwith
]Ap
]z5 igpuApu2Ap, (9a)
]As
]z2 d
]As
]T5 gs~2 2 fR!uApu2As 1
gs
2uApu2As .
(9b)
These equations have the following solutions:
Ap~z, T ! 5 Ap~0, T !exp@igpuAp~0, T !u2z#, (10a)
As~z, T ! 5 As~0, T 1 zd !
3 expH Fgs
21 igs~2 2 fR!Gc ~z, T !J ,
(10b)
where c is an overlap factor given by
c ~z, T ! 5 E0
z
uAp~0, T 1 zd 2 z8d !u2dz8. (11)
The overlap factor c (z, T) accounts for the relativeseparation between the pump and Raman pulses alongthe fiber. This factor depends on the shape of the pulse,37
and thus the integral given in Eq. (11) must be evaluatedfor a given pulse shape. For the particular case of aGaussian pump pulse of the form used in this work,
Oguama et al. Vol. 22, No. 2 /February 2005 /J. Opt. Soc. Am. B 429
Ap~0, T ! 5 APm expF22 ln 2S T2
tp2 D 2 i~vt 1 f !G ,
(12)
one can substitute Eq. (12) into Eq. (11) and evaluate theintegral. The result is
c ~z, T ! 51
4PmS p
ln 2 D 1/2S z
dD $erf@2Aln 2~t 1 d!#
2 erf@2Aln 2~t!#%, (13)
where erf is the well-known error function, Pm is themaximum pulse power, and t 5 T/tp is the normalizedtime (normalized to the input pulsewidth tp). Similarly,d 5 zd/tp is the normalized propagation distance, with dbeing the walk-off parameter (in units of picoseconds permeter). Thus an IGA experiment with the copropagatingpump (Ap) and Stokes (As) pulses given above must in-clude four-beam coupling in photorefractive crystal. Theexperimental details are discussed in Section 3.
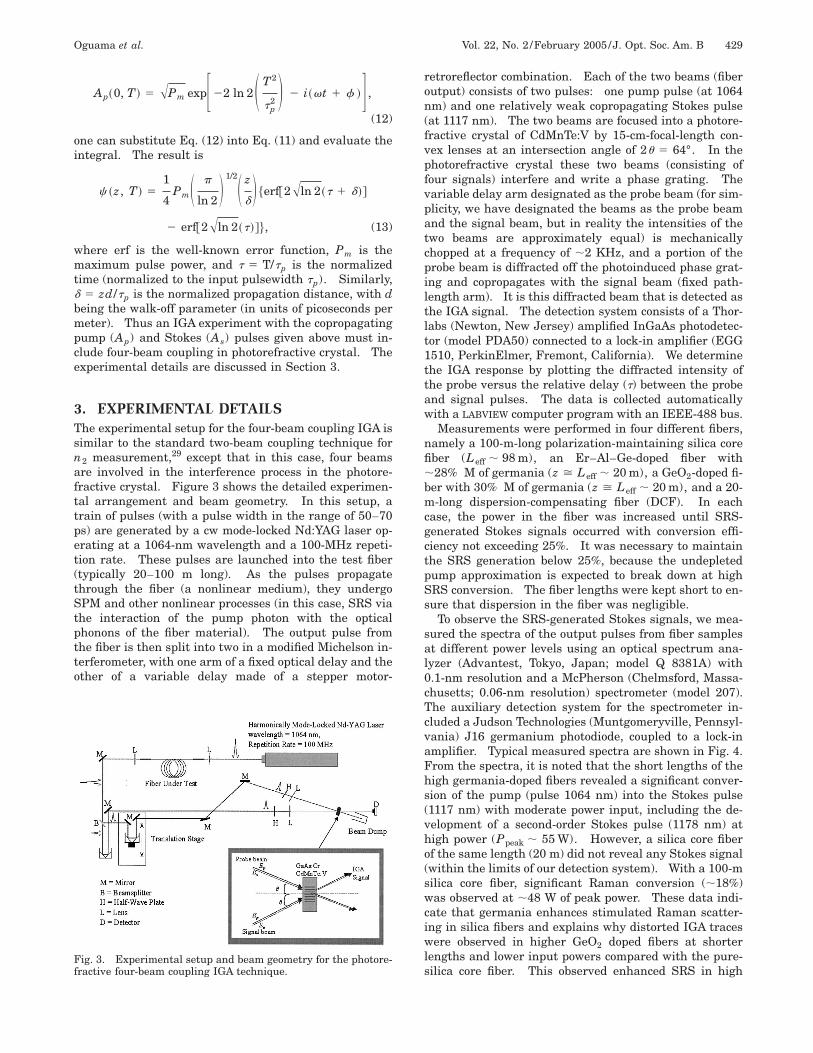
3. EXPERIMENTAL DETAILSThe experimental setup for the four-beam coupling IGA issimilar to the standard two-beam coupling technique forn2 measurement,29 except that in this case, four beamsare involved in the interference process in the photore-fractive crystal. Figure 3 shows the detailed experimen-tal arrangement and beam geometry. In this setup, atrain of pulses (with a pulse width in the range of 50–70ps) are generated by a cw mode-locked Nd:YAG laser op-erating at a 1064-nm wavelength and a 100-MHz repeti-tion rate. These pulses are launched into the test fiber(typically 20–100 m long). As the pulses propagatethrough the fiber (a nonlinear medium), they undergoSPM and other nonlinear processes (in this case, SRS viathe interaction of the pump photon with the opticalphonons of the fiber material). The output pulse fromthe fiber is then split into two in a modified Michelson in-terferometer, with one arm of a fixed optical delay and theother of a variable delay made of a stepper motor-
Fig. 3. Experimental setup and beam geometry for the photore-fractive four-beam coupling IGA technique.
retroreflector combination. Each of the two beams (fiberoutput) consists of two pulses: one pump pulse (at 1064nm) and one relatively weak copropagating Stokes pulse(at 1117 nm). The two beams are focused into a photore-fractive crystal of CdMnTe:V by 15-cm-focal-length con-vex lenses at an intersection angle of 2u 5 64°. In thephotorefractive crystal these two beams (consisting offour signals) interfere and write a phase grating. Thevariable delay arm designated as the probe beam (for sim-plicity, we have designated the beams as the probe beamand the signal beam, but in reality the intensities of thetwo beams are approximately equal) is mechanicallychopped at a frequency of ;2 KHz, and a portion of theprobe beam is diffracted off the photoinduced phase grat-ing and copropagates with the signal beam (fixed path-length arm). It is this diffracted beam that is detected asthe IGA signal. The detection system consists of a Thor-labs (Newton, New Jersey) amplified InGaAs photodetec-tor (model PDA50) connected to a lock-in amplifier (EGG1510, PerkinElmer, Fremont, California). We determinethe IGA response by plotting the diffracted intensity ofthe probe versus the relative delay (t) between the probeand signal pulses. The data is collected automaticallywith a LABVIEW computer program with an IEEE-488 bus.
Measurements were performed in four different fibers,namely a 100-m-long polarization-maintaining silica corefiber (Leff ; 98 m), an Er–Al–Ge-doped fiber with;28% M of germania (z > Leff ; 20 m), a GeO2-doped fi-ber with 30% M of germania (z > Leff ; 20 m), and a 20-m-long dispersion-compensating fiber (DCF). In eachcase, the power in the fiber was increased until SRS-generated Stokes signals occurred with conversion effi-ciency not exceeding 25%. It was necessary to maintainthe SRS generation below 25%, because the undepletedpump approximation is expected to break down at highSRS conversion. The fiber lengths were kept short to en-sure that dispersion in the fiber was negligible.
To observe the SRS-generated Stokes signals, we mea-sured the spectra of the output pulses from fiber samplesat different power levels using an optical spectrum ana-lyzer (Advantest, Tokyo, Japan; model Q 8381A) with0.1-nm resolution and a McPherson (Chelmsford, Massa-chusetts; 0.06-nm resolution) spectrometer (model 207).The auxiliary detection system for the spectrometer in-cluded a Judson Technologies (Muntgomeryville, Pennsyl-vania) J16 germanium photodiode, coupled to a lock-inamplifier. Typical measured spectra are shown in Fig. 4.From the spectra, it is noted that the short lengths of thehigh germania-doped fibers revealed a significant conver-sion of the pump (pulse 1064 nm) into the Stokes pulse(1117 nm) with moderate power input, including the de-velopment of a second-order Stokes pulse (1178 nm) athigh power (Ppeak ; 55 W). However, a silica core fiberof the same length (20 m) did not reveal any Stokes signal(within the limits of our detection system). With a 100-msilica core fiber, significant Raman conversion (;18%)was observed at ;48 W of peak power. These data indi-cate that germania enhances stimulated Raman scatter-ing in silica fibers and explains why distorted IGA traceswere observed in higher GeO2 doped fibers at shorterlengths and lower input powers compared with the pure-silica core fiber. This observed enhanced SRS in high

430 J. Opt. Soc. Am. B/Vol. 22, No. 2 /February 2005 Oguama et al.
germania-doped fibers is consistent with the work ofSharma et al. and others.41–43
4. ANALYSIS OF IGA DATA ANDDETERMINATION OF THE RAMAN GAINCOEFFICIENT ( gR) AND THENONLINEAR REFRACTIVE INDEX (n2)A. Four-Beam Coupling in a Photorefractive CrystalPreviously, we showed that time-dependent phase distor-tion of the electric field can result in oscillations in thewings of the IGA function.29,32,34 One form of the phasedistortion occurs via the SPM experienced by an intenseoptical pulse while it propagates in an optical fiber. Inthis analysis we will take into account the formation ofthe phase grating when more than two beams interact inthe photorefractive crystal. We will show that deviationsfrom the standard IGA trace (SPM only) correspond to anew nonlinear contribution to the phase grating, namely,SRS generated in the optical fiber. In Fig. 5 we representthe interaction of these two pair of beams in a photore-fractive medium.
The electric fields of these beams are written
Ej 5 Ej~t !exp@i~v jt 2 kjr !#, (14)
with the conditions that
v1 5 v3 , v2 5 v4 , (15)
k1 2 k3 5 k4 2 k2 5 K, (16)
where v j and kj are the frequency and the wave vector ofthe jth wave. One of the main points is to assume thatthe frequency difference between these two pair of beamsis much larger than the inverse of the response time (tr)of the medium, that is (v2 2 v1) @ 1/tr . This preventsthe formation of stable grating between beams E1 and
Fig. 4. Typical spectra of the output pulse from some of thetested fibers. (a) Fiber B, Er–Al–Ge-doped fiber with high(;28%M) GeO2 (Leff ; 20 m, Ppeak ; 24 W); (b) fiber C, high Ge-doped fiber with ;30%M GeO2 (Leff ; 20 m, Ppeak ; 55 W); (c)fiber A, silica core fiber (Leff ; 20 m, Ppeak ; 55 W); and (d) fiberA, silica core fiber (Leff ; 98 m, Ppeak ; 48 W).
E2 ; similarly there is no grating formed between E3 andE4 . Therefore the amplitude of the only grating formedin the medium is given by44:
G~t, t! } E2`
t
E1~t8!E3* ~t8 1 t!dt8 1 E2`
t
E2~t8!
3 E4* ~t8 1 t!dt8, (17)
where t is the relative delay between the pulses. In thespecial case where the beam E2 (labeled ER) is being gen-erated in the fiber through SRS and E1 is the pump field(labeled EP), we get for the diffracted field32,45,46
Edif } G~t, t!Epr~t 1 t!, (18)
where the probe field is given by
Epr~t 1 t! 5 Ep~t 1 t! 1 ER~t 1 t!, (19)
the detected energy can be expressed as
Wdet~t! } E2`
`
uEdet~t 1 t!u2dt. (20)
In this case the diffracted field copropagates with theother two fields and can be expressed as
Edet~t 1 t! } E~t ! 1 Edif~t, t!, (21)
where
E~t ! 5 Ep~t ! 1 ER~t !. (22)
Using Eq. (21) into Eq. (20) we get for the detected signal
Wdet~t! } E2`
`
$uE~t !u2 1 uEdif~t !u2
1 2 Re@E* ~t !Edif~t, t!#%dt. (23)
In Eq. (23) the first term can be neglected, because wemeasure pulse energy changes; the second term also canbe ignored, because we are in the small signal limit,32
where uE(t)u @ uEdif(t, t)u, and Eq. (23) becomes
Fig. 5. Four-beam coupling in a photorefractive media. BeamsE1 and E3 are coherent, with each other and beam E2 is coherentwith beam E4 . The index grating consists of two contributionswith a common wave vector.

Oguama et al. Vol. 22, No. 2 /February 2005 /J. Opt. Soc. Am. B 431
Wdet~t! } E2`
`
2 Re@E* ~t !Edif~t, t!#dt. (24)
Inserting Eqs. (18) and (22) into Eq. (24), we obtain
Wdet~t! } E2`
`
2 ReX@Ep* ~t ! 1 ER* ~t !#H E2`
t
@Ep~t8!Ep* ~t8
1 t! 1 ER~t8!ER* ~t8 1 t!#dtJ @Ep~t 1 t!
1 ER~t 1 t!#dt C (25)
after some tedious algebra the detected IGA signal re-duces to
Wdet~t! } U E2`
`
Ep~t !Ep* ~t 1 t!dtU2
1 U E2`
`
ER~t !ER* ~t 1 t!dtU2
1 U E2`
`
ER~t !ER* ~t 1 t!dt
3 E2`
`
Ep~t !Ep* ~t 1 t!dtU1 2 ReF E
2`
`
Ep~t !ER~t 1 t!dt
3 E2`
`
Ep~t !Ep* ~t 1 t!dt
1 E2`
`
Ep* ~t !ER~t 1 t!dt
3 E2`
`
ER~t !ER* ~t 1 t!dtG . (26)
Equation (26) is the new IGA model that takes into ac-count the four-beam coupling in the photorefractive crys-tal, involving two pairs of pump and Raman Stokespulses. The first term in this expression is just the con-tribution from pure SPM, whereas the rest of the termsare contributions from the SRS effects through Ramangain and cross-phase modulation. In the above analysis,we note that the electric field E(z, t) of an optical pulse isrelated to the pulse envelope A(z, t) by the followingexpression37:
E~z, t ! 5 @exp i~v0t 2 k0r !#F~x, y !A~z, t !, (27)
where exp i(v0t 2 k0r) is the phase term and F(x, y) rep-resents the spatial modal distribution. If the fundamen-tal mode is approximated by a Gaussian distribution,then F(x, y) ; exp@2(x2 1 y2)/w2#, and pw2 ; Aeff ,where Aeff is the effective core area of the fiber and w isthe Gaussian spot size of the mode. Under such circum-stances, a simple and valid approximation useful for ana-lyzing experimental data is to assume that uA(z, t)u2
' (Aeff) 3 uE(z, t)u2 ' P(t), where P(t) is the pulse powertemporal profile.
B. Numerical Fitting of the Modified IGA Model withthe Experimental Data and the Determination ofthe Raman Gain Coefficient and Nonlinear RefractiveIndexTo determine the Raman gain coefficient and the nonlin-ear refractive index we numerically evaluate the compli-cated integral shown in Eq. (26), and the resulting trace isfitted to the experimental data. In doing so, Eqs. (10a)and (10b) together with Eq. (13) are substituted, and thefitting parameters are factored from the values in the ex-ponents of these equations. Typical fitted IGA traces areshown in Figs. 6 and 7. As can be seen from the figures,there is excellent agreement between theory and experi-ment. The following three fitting parameters are used:
(a) The self-phase-modulation parameter (SPMP) isgiven by
SPMP 5 gp8zuAp~0, T !u2, (28)
Fig. 6. Typical measured SRS distorted IGA trace fitted to themodified IGA model [Eq. (23)] for fiber B (Er–Al–Ge doped) with28%M GeO2 ; Leff ; 20 m.
Fig. 7. Typical measured SRS distorted IGA trace fitted to themodified IGA model that accounts for SPM and SRS [Eq. (23)].Fiber A, silica core fiber; Leff ; 98 m.

432 J. Opt. Soc. Am. B/Vol. 22, No. 2 /February 2005 Oguama et al.
where gp8 5 2pn2 /(Aefflp) and uA(0, T)u2 > Eo2Aeff ' Pm
(Pm is the maximum power in the fiber), Eo is the peakelectric field amplitude, z is the fiber length, and the restof the parameters have their usual meanings as earlierdefined in the text.
(b) The Raman gain parameter (RGP) is given by
RGP 5 g8zuAp~0, T !u2, (29)
where g8 5 gR /Aeff , and gR is the Raman gain coefficientof the fiber.
(c) The walk-off term (WOT) given by
WOT [ d 5zd
tp, (30)
where d is the walk-off parameter and tp is the laserpulse width.
The fitting process was accomplished with a numericalcode written in MATLAB that runs in a conventional per-sonal computer. When the fitting is performed, aguessed value of the SPMP (based on a typical value ofthe SPM strength of an equivalent undistorted IGA trace)is usually given to the fitting routine, whereas the othertwo parameters (RGP and WOT) are randomly supplied.Upon convergence (which takes approximately 2–5 min-utes) the program returns the appropriate values forthese parameters. The first parameter (SPMP) is relatedto the nonlinear refractive index (n2), while the secondparameter (RGP) is related to the Raman gain coefficient( gR). The third parameter yields the walk-off parameter(d), which is related to the walk-off length (Lw 5 tp /d).
If we invoke the usual expression for the peak electricfield amplitude in cgs units47,48:
E02 5
8pI0
nc, (31)
where I0 is the peak power per unit area averaged overthe optical period @I0 5 (107 3 Pm /Aeff), where Pm is inwatts and 107 3 Pm is in ergs/s], and use the fact that fora Gaussian pulse:
Pm 5 2S ln 2
pD 1/2 Pavg tR
tp, (32)
where Pavg is the average power, tR is the laser pulse pe-riod, tp is the laser pulse width (and the rest have theirusual meanings as earlier defined); then we can use Eqs.(27) and (28) together with Eqs. (2) and (3) to show thatthe nonlinear refractive index29 and the Raman gain co-efficient can be expressed respectively as
n2~esu! 5 Aeff
ncl
LeffF32p2S ln 2
pD 1/2
3 107G21 SPMP
Ppeak,
(33)
gR~esu! 5 AeffS 4p • nc
LeffD
3F32p2S ln 2
pD 1/2
3 107G21 RGP
Ppeak, (34)
where Ppeak 5 (PavgtR)/tp is the peak power of the fiberinput pulse, Leff is the effective length of the fiber, and Aeffis the effective core area of the fiber. For the laser usedin this work, the repetition rate is 100 MHz (tR5 10 ns), and the pulsewidth (tp) is in the order of 50–70ps, as determined through the well-known noncollinear,background-free second-harmonic intensity autocorrela-tion. For improvement of the accuracy of the measure-ment, it is advisable to take a series of IGA traces andplot the resulting RGP and SPMP as a function of Ppeak(Figs. 8 and 9). The slope of the graph of the former isproportional to n2 , whereas the latter is proportional togR . The analysis was performed assuming an averageRaman conversion of 15%, such that approximately 85%of the input laser power remains in the self-phase-modulated pump pulse. Table 1 shows the measured Ra-man gain coefficient ( gR) and the nonlinear refractive in-dex (n2) as well as the walk-off parameters for the fourdifferent fibers.
Fig. 8. Plot of the (RGP) versus peak power for fiber B (Er–Al–Ge-doped) with ;28% M GeO2 ; Leff ; 20 m. Slope of graph isproportional to gR .
Fig. 9. Plot of the SPMP versus peak power for fiber B (Er–Al–Ge-doped) with ;28% M GeO2 ; Leff ; 20 m. Slope of graph isproportional to n2 .

Oguama et al. Vol. 22, No. 2 /February 2005 /J. Opt. Soc. Am. B 433
5. DISCUSSION OF RESULTSThe results obtained in the present work are shown inTable 1. We would like to compare our data with pub-lished results (see Table 2). Values of the Raman gain co-efficient in silica core fiber at 1064-nm wavelength werepreviously reported by Lin et al.49 ( gR 5 0.923 10211 cm/W) and by Nakashima et al.50 (0.743 10211 cm/W). Our result of gR 5 0.78 3 10211 cm/Wis in reasonable agreement with these values. We notefurther that the DCF fiber measured in this work hasbeen previously characterized with an independenttechnique51,52 at 1450 nm, yielding a Raman gain effi-ciency of CR 5 3.2 (W km)21, corresponding to a gR ( gR5 CR /Aeff) of 0.48 3 10211 cm/W (at 1450 nm). Sincethe Raman gain coefficient is known to vary inverselywith pump wavelength, we must scale this value down to1064 nm in order to compare with our result. The scal-ing formula has been discussed by Newbury53 and by Cor-dina and Flunger.18 In terms of wavelengths, the scalingequation can be written as
gR~l, ls! 5 S lp
lD e
gR~lp , ls!, (35)
where gR(l, ls) is the Raman gain coefficient at any de-sired pump wavelength l and gR(lp , ls) is the Ramangain coefficient measured at a pump wavelength lp . l isthe new pump wavelength, lp is the pump wavelength atwhich the measurement was taken, and e is the scalingcoefficient. Using a typical value18 of e ; 2.8, we obtaina scaled value of gR 5 1.14 3 10211 cm/W at 1064 nm forthe DCF. This value is in good agreement with ourpresent measurement for the DCF @ gR 5 1.33 10211 cm/W (67%)#.
For the high-germania-doped fibers (fibers B and C),there have been no prior measurements for direct com-parison with our data, but researchers have found that anaccurate estimate of the gR for high-germania-doped fi-bers can be obtained from the relative refractive index dif-ference between the fiber core and the cladding.50 For ahigh-germania-doped fiber the Raman gain coefficient canbe expressed as42,50
gR ~cm/W! 50.94 3 10211
lp~1 1 80D!, (36)
where lp is the pump wavelength, measured in microme-ters, and D is the relative refractive index between the fi-
Table 1. Values of the Raman Gain Coefficient ( gR), the Nonlinear Refractive Index (n2), and theWalk-off Parameter (d) Determined from IGA Measurements at 1064 nm
Fiber IDAeff
(mm2)gR (esu)(67%)
gR (cm/W)(67%)
n2 (esu)(67%)
n2 (cm2/W)(67%)
d (ps/m)(65%)
APure silica core 50 2.7 3 1029 0.78 3 10211 6.31 3 10214 1.81 3 10216 1.1
BEr-Al-Ge doped(;28% M GeO2)
4.88 9.97 3 1029 2.86 3 10211 9.45 3 10214 2.71 3 10216 4.3
CGeO2 doped(;30% M GeO2)
5.95 1.32 3 1028 3.8 3 10211 9.66 3 10214 2.77 3 10216 4.5
DDCF 10.61 5.13 3 1029 1.47 3 10211 9.31 3 10214 2.67 3 10216 5.2
Table 2. Literature Values of the Raman Gain Coefficient ( gR) and the Nonlinear Refractive Index (n2)
Fiber Type gR (cm/W) n2 (cm2/W)
Pure silica core 0.92 3 10211 @1064 nma 2.44 3 10216 @1064 nmd
0.74 3 10211 @1064 nmb 2.70 3 10216 @514.5 nme
2.20 3 10216 @1550 nmf
DCF 0.48 3 10211 @1450 nmc 3.04 3 10216 @1064 nmg
1.14 3 10211 cm/W @1064 nm (scaled with Eq. 35) 2.75 3 10216 @1550 nmf
4.34 3 10216 @1550 nmh
a Ref. 49.b Ref. 50.c Refs. 51 and 52.d Ref. 29.e Ref. 19.f Ref. 57.g Ref. 34.h Ref. 25.

434 J. Opt. Soc. Am. B/Vol. 22, No. 2 /February 2005 Oguama et al.
ber core and the cladding. The core-cladding relative re-fractive index is proportional to the GeO2 content.54
With this relation, our calculations predict a value of gR5 2.83 3 10211 cm/W for fiber B (D ' 0.0275) and gR5 2.98 3 10211 cm/W for fiber C (D ' 0.0293). Thesecalculated values appear to be in a reasonable agreementwith our measurements for these fibers, which are gR5 2.86 3 10211 cm/W (for fiber B) and gR 5 3.83 10211 cm/W (for fiber C), respectively.
The significantly higher value of gR in the high-germania-doped silica fibers in comparison with the pure-silica core fiber is remarkable, but not unusual, since pre-vious work50,51,55 has shown that the Raman gain inGeO2-doped silica fiber increases with the peak germaniaconcentration. This is further supported by the en-hanced Raman conversion observed in the spectra of thehigh-germania-doped fibers, as shown in Fig. 4. In fact,documented results suggest that the Raman gain coeffi-cient of GeO2 is ;1 order of magnitude higher than thatof SiO2 .48,56
Our result on the walk-off parameter shown in Table 1follows the correct trend and is within the accepted rangeof values reported in the literature. The walk-off param-eter for silica core fiber is known to be about 1.0–1.5 ps/mat 1064 nm, but varies 2–6 ps/m for doped fibers.37,50
The walk-off parameter determines the walk-off lengthfor the fiber at a given pulse width (Lw 5 tp /d). Thewalk-off length (Lw) is defined as the distance in whichthe Stokes pulse passes through one pump pulse width;this is effectively the distance over which the pump andStokes pulses overlap in the fiber. Calculations based onour measured walk-off parameters show that the walk-offlength for the pure-silica fiber for a 50-ps (1064-nm) pulseis 45 m, whereas for the high-germania-doped fibers Lw is;11 m.
The nonlinear refractive indices obtained in thepresent measurement are also in good agreement withour earlier measurements for the two previously charac-terized fibers, based on the pure SPM model.29,34 Ourprevious measurement based on the pure SPM modelyielded values of n2 5 2.44 3 10216 cm2/W (65%) forthe silica core fiber29 and n2 5 3.043 10216 cm2/W (65%) for the DCF,34 whereas thepresent measurement with the modified IGA modelyielded n2 5 1.81 3 10216 cm2/W (67%) for the silica fi-ber and n2 5 2.67 3 10216 cm2/W (67%) for the DCF.Similar values of n2 for DCF fibers have also been re-ported as determined from other n2 measurementtechniques.25,57 DCFs normally have a relatively high-germania-doped core (with typically 16%–21%M ofGeO2),57 and this might explain why both the n2 and gRvalues for DCFs are generally higher than those of puresilica fibers.
The major source of uncertainty in the present work isthe effective area measurement. The effective core areasof the fibers used in this analysis were calculated from themode-field diameter. The mode-field diameter values at1.064 mm were extrapolated from the measured values atwavelengths of 1.314, 1.45, and 1.552 mm when the pro-cedure described in Ref. 34 was followed. The estimateduncertainty in Aeff measurement is approximately 63%.Other sources of uncertainties include laser amplitude
fluctuation (which translates into fluctuation in the aver-age laser power) and the possibility of some diminutivebackward scattering in the fiber. The error associatedwith the average power and the pulse-width measure-ments is reduced to 64% by averaging. Thus the overalluncertainty in the measurement is 67%. The aboveanalysis does not include any correction for polarizationeffects. Although researchers have proposed58,59 the useof a correction factor of 8/9 to account for polarizationscrambling for n2 measurements in nonpolarization-maintaining fibers, the implementation of this correctionmay not be completely justified in this case, since signifi-cant polarization scrambling is not likely to occur oversuch relatively short fiber lengths.
6. CONCLUSIONSFor the first time, to the best of our knowledge, a tech-nique for simultaneously measuring the Raman gain co-efficient ( gR) and the nonlinear refractive index (n2) inshort lengths of fiber has been demonstrated. This tech-nique utilizes time-delayed photorefractive four-beamcoupling (IGA) as a novel detector of the SPM and SRSexperienced by an intense optical pulse after propagationin a single-mode fiber. We have performed measure-ments in four different fibers, including two previouslycharacterized fibers. Our results for gR and n2 werechecked against results reported elsewhere,29,34,49–51,57
and good agreement was found. The spread of the mea-sured values, 67% for both parameters, is believed to bedue mainly to the uncertainty in the effective area, aver-age power, and pulsewidth measurements.
ACKNOWLEDGMENTThe authors would like to express their thanks to D. J. Di-giovanni and Jake Bromage both of OFS Laboratories,New Jersey, for fruitful discussions and for providingsome of the fibers measured in this work. Special thanksalso go to the New Jersey Commission on Science andTechnology for funding this research, under grant#990345.
REFERENCES1. F. Forghieri, R. W. Tkach, and A. R. Chraplyvy, ‘‘Fiber non-
linearities and their impact on transmission systems,’’ inOptical Fiber Telecommunications, I. P. Kaminow and T. L.Koch, eds. (Academic, San Diego, California, 1997), Vol.IIIA, pp. 196–264.
2. D. Marcuse, A. R. Chraplyvy, and R. W. Tkach, ‘‘Effects offiber nonlinearities on a long-distance transmission,’’ J.Lightwave Technol. 9, 121–128 (1991).
3. A. R. Chraplyvy, ‘‘Limitations on lightwave communicationsimposed by optical-fiber nonlinearities,’’ J. Lightwave Tech-nol. 8, 1548–1557 (1990).
4. A. M. Glass, D. J. DiGiovanni, T. A. Strasser, A. J. Stentz, R.E. Slusher, A. E. White, A. R. Kortan, and B. J. Eggleton,‘‘Advances in fiber optics,’’ Bell Syst. Tech. J. 2000, 168–187.
5. M. Karasek and M. Menif, ‘‘Channel addition/removal re-sponse in Raman fiber amplifiers: modeling and experi-mentation,’’ J. Lightwave Technol. 20, 1680–1687 (2002).
6. N. Takachio and H. Suzuki, ‘‘Application of Raman-distributed amplification to WDM transmission systems us-
Oguama et al. Vol. 22, No. 2 /February 2005 /J. Opt. Soc. Am. B 435
ing 1.55-mm dispersion-shifted fibers,’’ J. Lightwave Tech-nol. 19, 60–69 (2001).
7. T. N. Nielsen, P. B. Hansen, A. J. Stentz, V. M. Aquari, J. R.Pedrazzani, A. A. Abramov, and R. P. Espindola, ‘‘83 10 Gb/s 1.3-mm unrepeated transmission over a distance
of 141 km with Raman post- and pre-amplifiers,’’ IEEE Pho-tonics Technol. Lett. 10, 1492–1494 (1998).
8. P. B. Hansen, G. Jacobovitz-Veselka, L. Gruner-Nielsen,and A. J. Stentz, ‘‘Raman amplification for loss compensa-tion in dispersion compensating fibre modules,’’ Electron.Lett. 34, 1136–1137 (1998).
9. E. M. Dianov, ‘‘Advances in Raman fibers,’’ J. LightwaveTechnol. 20, 1457–1462 (2002).
10. D. C. Johnson, K. O. Hill, B. S. Kawasaki, and D. Kato,‘‘Tunable Raman fiber-optic laser,’’ Electron. Lett. 13, 53(1977).
11. E. Desurvire, A. Imamoglu, and H. Shaw, ‘‘Low-thresholdsynchronously pumped all-fiber ring Raman laser,’’ J. Light-wave Technol. 5, 89–96 (1987).
12. P. V. Mamyshev, ‘‘Fibre nonlinearities,’’ in Laser Sourcesand Applications, A. M. Miller and D. M. Finlayson, eds.(SUSSP Publications, London, 1997), p. 369.
13. R. H. Stolen and E. P. Ippen, ‘‘Raman gain in glass opticalwaveguides,’’ Appl. Phys. Lett. 22, 276–279 (1972).
14. D. J. Dougherty, F. X. Kartner, H. A. Haus, and E. P. Ippen,‘‘Measurement of Raman gain spectrum of optical fibers,’’Opt. Lett. 20, 31–33 (1995).
15. D. Mahberefteh, D. L. Butler, J. Goldhar, B. Rosenberg, andG. L. Burdge, ‘‘Technique for measurement of the Ramangain coefficient in optical fibers,’’ Opt. Lett. 21, 2026–2028(1996).
16. N. R. Newbury, ‘‘Raman gain:pump-wavelength dependencein single mode fiber,’’ Opt. Lett. 27, 1232–1234 (2002).
17. N. Newbury, ‘‘Full wavelength dependence of Raman gainin optical fibers: measurement using a single pump laser,’’in Optical Fiber Communication Conference, Vol. 86 of OSATrends in Optics and Photonics Series (Optical Society ofAmerica, Washington, D.C., 2003), paper WB5.
18. J. Cordina and C. R. S. Flunger, ‘‘Changes in Raman gaincoefficient with pump wavelength in modern transmissionfibers,’’ in Optical Amplifiers and their Applications, Vol. 92of OSA Trends in Optics and Photonics Series (Optical So-ciety of America, Washington, D.C., 2003), paper OMC3.
19. R. H. Stolen and C. Lin, ‘‘Self-phase modulation in silica op-tical fibers,’’ Phys. Rev. A 4, 1448–1453 (1978).
20. Y. Namihira, A. Miyata, and N. Tanahashi, ‘‘Nonlinear co-efficient measurements for dispersion shifted fibres usingself-phase modulation method at 1.55 mm,’’ Electron. Lett.30, 262–264 (1994).
21. M. Monerie and Y. Durtestse, ‘‘Direct interferometric mea-surement of nonlinear refractive index of optical fibers bycross-phase modulation,’’ Electron. Lett. 23, 961–963(1987).
22. R. H. Stolen, W. A. Reed, K. S. Kim, and K. W. Quoi, ‘‘Mea-surement of optical nonlinearity of transmission fibers,’’ inTechnical Digest—Symposium on Optical Fiber Measure-ments, 1992, NIST Special Publication 839 (National Insti-tute of Standards and Technology, Boulder, Colo., 1992), pp.71–75.
23. R. H. Stolen, W. A. Reed, K. S. Kim, and G. T. Harvey,‘‘Measurement of the nonlinear refractive index oflong dispersion-shifted fibers by self-phase modulationat 1.55 mm,’’ J. Lightwave Technol. 16, 1006–1012(1998).
24. M. Artiglia, R. Caponi, F. Cisterninno, C. Naddeo, and D.Roccato, ‘‘A new method for the measurement of the nonlin-ear refractive index of optical fiber,’’ Opt. Fiber Technol. 2,75–79 (1996).
25. T. Kato, Y. Suetsugu, M. Takagi, E. Sasaoka, and M. Nish-imira, ‘‘Measurement of the nonlinear refractive index inoptical fiber by the cross-phase-modulation method with de-polarized pump light,’’ Opt. Lett. 20, 988–990 (1995).
26. M. Artiglia, E. Ciaramella, and B. Sordo, ‘‘Using modula-tion instability to determine Kerr coefficient in optical fi-bers,’’ Electron. Lett. 31, 1012–1013 (1995).
27. L. Prigent and J. P. Hamaide, ‘‘Measurement of fiber non-linear Kerr coefficient by four-wave mixing,’’ IEEE Photon-ics Technol. Lett. 5, 1092–1095 (1993).
28. C. Vinegoni, M. Wegmuller, and N. Gisin, ‘‘Determination ofnonlinear coefficient (n2 /Aeff) using self-aligned interferom-eter and Faraday mirror,’’ Electron. Lett. 26, 886–888(2000).
29. H. Garcia, A. M. Johnson, F. A. Oguama, and S. Trivedi, ‘‘Anew approach to the measurement of the nonlinear refrac-tive index of short (,25 m) lengths of silica and erbium-doped fibers,’’ Opt. Lett. 28, 1796–1798 (2003).
30. F. A. Oguama, A. Tchouassi, and A. M. Johnson, ‘‘Influenceof stimulated Raman scattering and high GeO2 doping onthe induced grating autocorrelation measurements in Er-Al-Ge doped single mode fibers,’’ presented at Annual Con-ference of the National Society of Black Physicists, Atlanta,Ga., February 12–15, 2003.
31. R. Trebino, C. C. Hayden, A. M. Johnson, W. M. Simpson,and A. M. Levine, ‘‘Chirp and self-phase modulation ininduced-grating autocorrelation measurements of ul-trashort pulses,’’ Opt. Lett. 15, 1079–1081 (1990).
32. A. M. Levine, E. Ozizmir, R. Trebino, C. C. Hayden, A. M.Johnson, and K. L. Tokuda, ‘‘Induced grating autocorrela-tion of ultrashort pulses in slowly responding medium,’’ J.Opt. Soc. Am. B 11, 1609–1618 (1994).
33. Y. R. Shen and G. Z. Yang, ‘‘Theory of self-phase modulationand spectral broadening,’’ in The Supercontinuum LaserSource, R. R. Alfano, ed. (Springer-Verlag, Berlin, 1989), pp.1–32.
34. F. A. Oguama, A. M. Johnson, and W. Reed, ‘‘Measurementof the nonlinear coefficient of Er-Al-Ge doped fibers as afunction of the doping profile, using the photorefractivebeam coupling technique,’’ J. Opt. Soc. Am. B, submitted forpublication.
35. F. A. Oguama, A. Tchouassi, and A. M. Johnson, ‘‘Effect ofhigh germania content and stimulated Raman scattering onn2 measurements in erbium-doped single mode fibers,’’ inOSA Annual Meeting (Optical Society of America, Washing-ton, D.C., 2002).
36. F. A. Oguama, ‘‘Measurement of the nonlinear refractive in-dex and stimulated Raman scattering in optical fibers as afunction of germania content, using the photorefractivebeam-coupling technique,’’ Ph.D. thesis (New Jersey Insti-tute of Technology, Newark, N.J., August 2003), Chap. 6,pp. 101–136, http://www.library.njit.edu/etd/index.cfm.
37. G. P. Agrawal, Nonlinear Fiber Optics—Optics and Photon-ics, 3rd ed. (Academic, New York, 2001).
38. J. Manassah and O. Cockings, ‘‘Time domain characteriza-tion of a Raman pulse in the presence of a pump,’’ Appl.Opt. 26, 3749–3752 (1987).
39. R. G. Smith, ‘‘Optical power handling capacity of optical fi-bers as determined by stimulated Raman and Brillouinscattering,’’ Appl. Opt. 11, 2489–2494 (1972).
40. R. H. Stolen, J. P. Gordon, W. J. Tomlinson, and H. A. Haus,‘‘Raman response function of silica-core fibers,’’ J. Opt. Soc.Am. B 6, 1159–1166 (1989).
41. S. K. Sharma, D. W. Matson, J. A. Philpotts, and T. L.Roush, ‘‘Raman study of the structure of glasses along thejoint SiO2-GeO2 ,’’ J. Non-Cryst. Solids 68, 99–114 (1984).
42. I. Torres, A. N. Starodmov, Yu. O. Barmenkov, L. A. Zen-teno, and P. Gavrilovic, ‘‘Raman effect based modulators forhigh power fiber lasers,’’ Appl. Phys. Lett. 72, 401–403(1998).
43. F. L. Galeener, J. C. Mikkelsen, Jr., R. H. Geils, and W. J.Mosby, ‘‘The relative Raman cross sections of vitreous SiO2 ,GeO2 , B2O3 , and P2O5 ,’’ Appl. Phys. Lett. 32, 34–36(1978).
44. P. Yeh, Introduction to Photorefractive Nonlinear Optics(Wiley, New York, 1993).
45. S. L. Palfrey and T. F. Heinz, ‘‘Coherent interactions inpump-probe absorption measurements: the effect of phasegratings,’’ J. Opt. Soc. Am. B 2, 674–679 (1985).
46. R. Trebino, E. K. Gustafson, and A. E. Siegman, ‘‘Fourth-order partial-coherence effects in the formation of

436 J. Opt. Soc. Am. B/Vol. 22, No. 2 /February 2005 Oguama et al.
integrated-intensity gratings with pulsed light sources,’’ J.Opt. Soc. Am. B 3, 1295–1304 (1986).
47. R. Thurston, J. P. Heritage, A. M. Weiner, and W. J. Tom-linson, ‘‘Analysis of picosecond pulse shape synthesis byspectral masking in a grating pulse compressor,’’ IEEE J.Quantum Electron. QE-22, 682–685 (1986).
48. R. H. Stolen, ‘‘Nonlinear properties of optical fibers,’’ in Op-tical Fiber Telecommunications, S. E. Miller and A. G.Chynoweth, eds. (Academic, San Diego, Calif., 1979), pp.125–150.
49. C. Lin, L. G. Cohen, R. H. Stolen, G. W. Tasker, and W. G.French, ‘‘Near-infrared sources in the 1–1.3-mm region byefficient stimulated Raman emission in glass fibers,’’ Opt.Commun. 20, 426–428 (1977).
50. T. Nakashima, S. Seikai, and M. Nakazawa, ‘‘Dependenceof Raman gain on relative index difference for GeO2-dopedsingle-mode fibers,’’ Opt. Lett. 10, 420–422 (1985).
51. J. Bromage, K. Rottwitt, and M. E. Lines, ‘‘A method to pre-dict the Raman gain spectra of germanosilicate fbers witharbitrary index profile,’’ IEEE Photonics Technol. Lett. 14,24–26 (2002).
52. Fiber provided by Dr. Jake Bromage of OFS Laboratories,Holmdel, N.J.
53. N. Newbury, ‘‘Full wavelength dependence of Raman gain
in optical fibers: measurement using a single pumplaser,’’ in Optical Fiber Communication Conference, Vol. 86of 2003 OSA Trends in Optics and Photonics Series(Optical Society of America, Washington, D.C., 2003), paperWB5.
54. Y. Y. Huang and A. Sarkar, ‘‘Relationship between composi-tion, density, and refractive index for germaina silicaglasses,’’ J. Non-Cryst. Solids 27, 29–37 (1978).
55. N. Shibata, M. Horigudhi, and T. Edahiro, ‘‘Raman spectraof binary high-silica glasses and fibers containing GeO2 ,P2O5 and B2O3 ,’’ J. Non-Cryst. Solids 45, 115–126 (1981).
56. M. Hass, ‘‘Raman spectra of vitreous silica, germania andsodium silicate glasses,’’ J. Phys. Chem. Solids 31, 415–422(1970).
57. A. Boskovic, S. V. Chenikov, J. R. Taylor, L. Gruner-Nielson,and O. A. Levring, ‘‘Direct measurement of n2 in varioustypes of telecommunication fiber at 1.55 mm,’’ Opt. Lett. 21,1966–1968 (1996).
58. S. V. Chernikov and J. R. Taylor, ‘‘Measurement of normal-ization factor of n2 for random polarization in optical fi-bers,’’ Opt. Lett. 21, 1559–1561 (1996).
59. S. G. Evangelides, Jr., L. F. Mollenauer, J. P. Gordon, andN. S. Bergano, ‘‘Polarization multiplexing with solitons,’’ J.Lightwave Technol. 10, 28–35 (1992).