simultaneous estimation of paracetamol, ambroxol...
TRANSCRIPT
Simultaneous Estimation of Paracetamol, Ambroxol Hydrochloride,
Levocetrizine Dihydrochloride and Phenylephrine Hydrochloride in
Combined Tablet Formulation by First Order Derivative
Spectrophotometry
K. Anandakumar *, P.Veerasundari,
Department of Pharmaceutical Analysis,
Adhiparasakthi College of Pharmacy,
Melmaruvathur – 603 319,
Tamil Nadu, India.
*“For Correspondence”
E mail: [email protected]

ABSTRACT
Paracetamol, ambroxol hydrochloride, levocetirizine dihydrochloride and
phenylephrine hydrochloride are used in combination for the treatment of chronic
sinusitis, rhinitis, fever, nasal discharge, sore throat and wheezing. The present work
deals with method development for simultaneous estimation of paracetamol, ambroxol
hydrochloride, levocetirizine dihydrochloride and phenylephrine hydrochloride in tablet
formulation by first-order derivative spectrosphotometry. For determination of sampling
wavelength, 10 𝜇g/mL of each of paracetamol, ambroxol hydrochloride, levocetirizine
dihydrochloride and phenylephrine hydrochloride was scanned in 200–400 nm ranges and
sampling wavelengths were found to be 305.5 nm for paracetamol, 321 nm for ambroxol
hydrochloride, 244 nm for levocetrizine dihydrochloride and 280 nm for phenylephrine
hydrochloride in firstorder derivative spectrophotometry. In this method, linearity was
observed in the ranges of 20 – 140 𝜇g/mL for paracetamol, 10 – 70 𝜇g/mL for ambroxol
hydrochloride, levocetrizine dihydrochloride and phenylephrine hydrochloride. The
% recovery was within the range between 98 and 102%, and % relative standard
deviation for precision and accuracy of the method was found to be less than 2%. The
method is validated as per International Conference on Harmonization Guidelines. The
method can be successfully applied for the simultaneous analysis of these drugs in
pharmaceutical dosage forms.
1.Introduction
Paracetamol, (PARA) chemically known as N-(4-hydroxyphenyl)ethanamide
(Figure1), is inhibit the cyclooxygenase (COX) used as an analgesics, antipyretics, and
Non-narcotic agent. Ambroxol hydrochloride, (AMB) chemically known as tran s-4-(2-
Amino-3, 5-dibrombenzylamino)-cyclohexanol (Figure 2), is an active N-desmethyl
metabolite of the mucolytic, bromhexine used as an oral mucolytic expectorant.
Levocetirizine dihydrochloride, (LEVO) chemically known as [2-[4-[(R)-(4-
Chlorophenyl) phenylmethyl]-1-piperazinyl] ethoxy]-acetic acid dihydrochloride
(Figure 3), is L-enantiomer of cetirizine racemate. It works by blocking H1 histamine
receptors, used as an allergic rhinitis an conjunctivitis, hay fever, pollinosis control
sneezing, runny but not blocked nose, and red,watering, and itchy eyes. Phenylephrine
hydrochloride, (PHEN) chemically known as (R)-3-Hydroxy-alpha [(methylamino)
methyl] benzenemethanol hydrochloride (Figure 4) is a direct acting sympathomimetic
agent. It is a selective 𝛼1 adrenoceptor agonist and has negligible 𝛽 action, used as a nasal

decongestant and for producing mydriasis when cycloplegia is not required. PARA, AMB
and PHEN are official in IP [1] and BP [2]. But LEVO is not official in any of the
Pharmacopoeia.
Literature survey revealed that there are several methods have been reported for the
estimation of these drugs in combined with other drugs by using UV spectrophotometry
[3-12], RP- HPLC [13-36], HPTLC [36-39] and LC-MS [40-41]. PARA, AMB, LEVO
and PHEN in combination is not official in any pharmacopoeia. As per literature, no
analytical method could be traced for the analysis of PARA, AMB, LEVO and PHEN in
combined tablet dosage form. Therefore, simple, rapid, and reliable method for
simultaneous estimation of these drugs in combination seemed to be necessary.
Spectrophotometric methods of analysis are more economic and simpler, compared to
methods such as chromatography and electrophoresis. Under computer-controlled
instrumentation, derivative spectrophotometry is playing a very important role in the
multicomponent analysis of mixtures by UV molecular absorption spectrophotometry.
Quartenary mixture can be easily resolved by means of a spectrophotometric method,
which is based on the simultaneous use of “zero crossing” method. The aim of this work
was to investigate the utility of derivative spectrophotometry and to develop reliable
spectrophotometric procedure for the simultaneous determination of PARA, AMB,
LEVO and PHEN in combined tablet dosage form without any prior separation of
individual drugs. The present developed method was validated as per International
Conference on Harmonization guidelines (ICH) [42-43].
HO
NH
O
CH3
FIGURE 1: Chemical structure of PARA.

Br
Br
NH2
NH OH
. HCl
FIGURE 2: Chemical structure of AMB.
N
H
ClN
OCOOH
. 2HCl
FIGURE 3: Chemical structure of LEVO.
OH
C
OH
H
CH2NHCH3 . HCl
FIGURE 4: Chemical structure of PHEN.

2.Materials and Methods
2.1. Apparatus and Instrument. A double beam UV-Visible spectrophotometer
(Shimadzu, model pharm spec 1700) having two matched quartz cells with 1 cm light
path and electronic analytical balance (Shimadzu AUX-220), and ultrasonication (Soltec
2200) were used. Volumetric flasks and pipettes of borosilicate glasses were used in the
study.
2.2. Chemicals and Reagents. Pure drug samples of PARA and LEVO were obtained as
gift sample from Medopharm Pvt. Ltd., Chennai, Tamil Nadu, India, AMB was gifted by
Madras Pharmaceuticals Pvt. Ltd., Chennai, Tamil Nadu, India, and PHEN was gifted by
APEX Pharmacuticals, Chennai, Tamil Nadu, India. Methanol (HPLC grade) was
purchased from Qualigens India Pvt. Limited, Mumbai, India. Distilled water was
obtained from Double distillation unit in our laboratory.
2.3. Marketed Formulation. The marketed formulation studied was 1-AL Total tablets
manufactured by FDC Limited., Aurangabad, India. Each tablet contains 500 mg of
PARA, 60 mg of AMB, 2.5 mg of LEVO, and 5 mg of PHEN.
2.4. Selection of Common Solvent. Methanol was selected as a common solvent to prepare
the stock solution and further dilutions were made with distilled water for developing
spectral characteristics of these drugs. The selection was made after assessing the
solubility of these drugs in different solvents.
2.5. Preparation of Standard Solutions. 50 mg of PARA, and 25 mg of AMB, LEVO and
PHEN were weighed accurately and transferred in to 25 mL volumetric flask
individually, dissolved with methanol and the volume was made upto 25 mL with
methanol.The stock solution contains 2mg/ mL of PARA, and 1mg/ mL of AMB, LEVO
and PHEN.
2.6. Spectrophotometric Conditions
(i) Mode: spectrum.
(ii) Scan speed: medium.

(iii) Bandwidth: 1 nm.
(iv) Wavelength range: 400–200 nm.
(v) Absorbance scale: 0.00A–2.15A.
(vi) Initial baseline correction: distilled water.
1.First-Order Derivative Spectrophotometric Method
The standard stock solution of PARA, AMB, LEVO and PHEN were
appropriately diluted with distilled water to get the concentration 10 μg/ mL of all the
four drugs. Spectra of these diluted solutions were scanned in the spectrum mode between
200 nm and 400 nm using distilled water as a blank. The zero-order spectra of PAR,
AMB, LEVO and PHEN were transformed to corresponding first derivative spectra in the
range of 200 – 400 nm. The overlay spectra (zero and first order) of PARA, AMB, LEVO
and PHEN are shown in Figures 5 and 6.
FIGURE 5: Overlain UV spectra of PARA, AMB, LEVO and PHEN
(10 μg/ mL concentration of each drug solution)
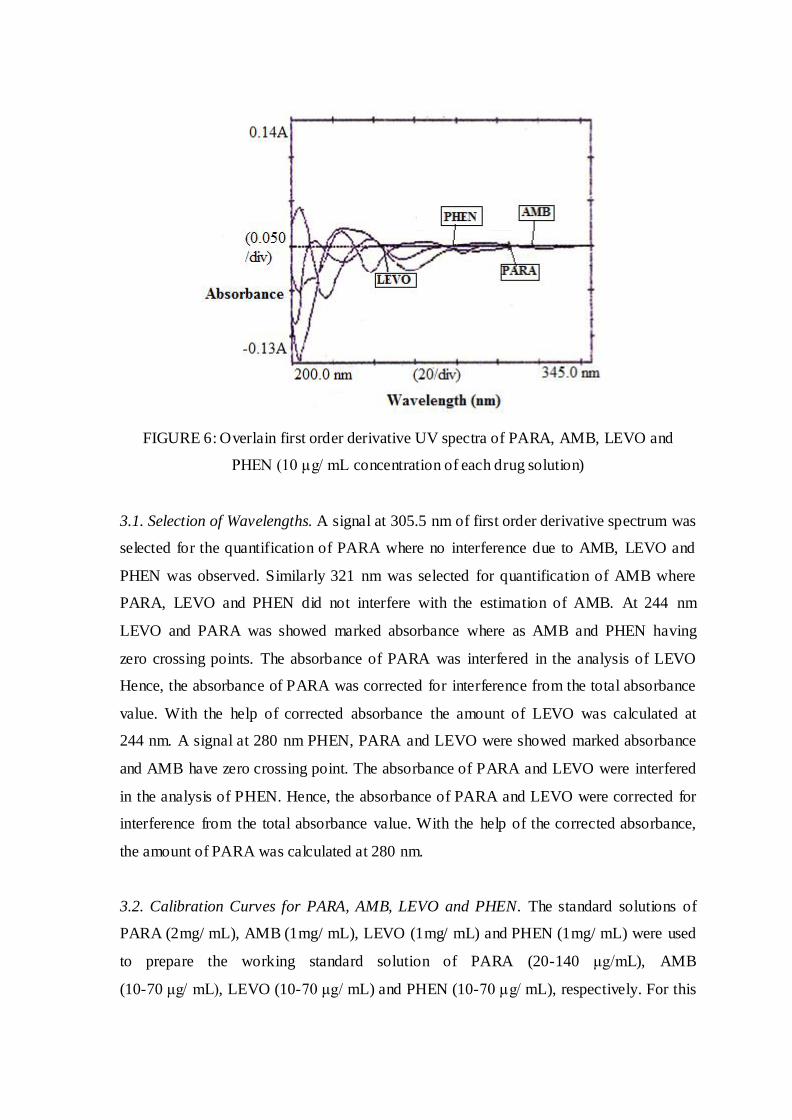
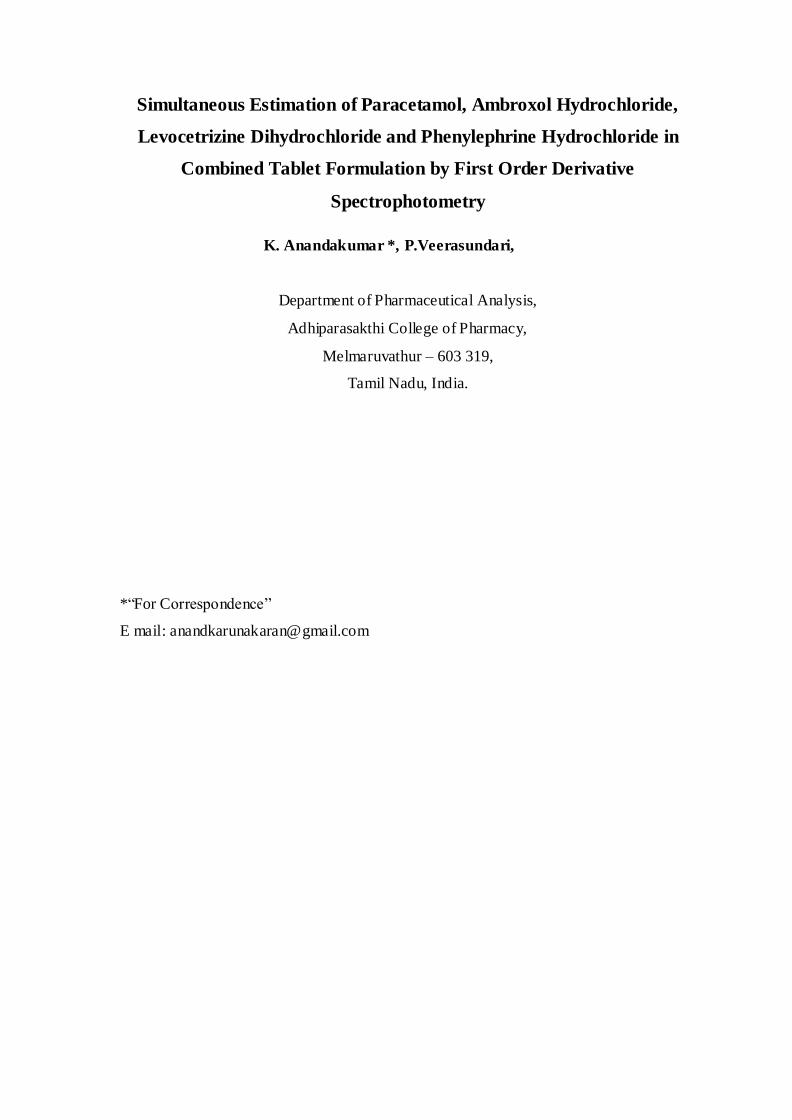
FIGURE 6: Overlain first order derivative UV spectra of PARA, AMB, LEVO and
PHEN (10 μg/ mL concentration of each drug solution)
3.1. Selection of Wavelengths. A signal at 305.5 nm of first order derivative spectrum was
selected for the quantification of PARA where no interference due to AMB, LEVO and
PHEN was observed. Similarly 321 nm was selected for quantification of AMB where
PARA, LEVO and PHEN did not interfere with the estimation of AMB. At 244 nm
LEVO and PARA was showed marked absorbance where as AMB and PHEN having
zero crossing points. The absorbance of PARA was interfered in the analysis of LEVO
Hence, the absorbance of PARA was corrected for interference from the total absorbance
value. With the help of corrected absorbance the amount of LEVO was calculated at
244 nm. A signal at 280 nm PHEN, PARA and LEVO were showed marked absorbance
and AMB have zero crossing point. The absorbance of PARA and LEVO were interfered
in the analysis of PHEN. Hence, the absorbance of PARA and LEVO were corrected for
interference from the total absorbance value. With the help of the corrected absorbance,
the amount of PARA was calculated at 280 nm.
3.2. Calibration Curves for PARA, AMB, LEVO and PHEN. The standard solutions of
PARA (2mg/ mL), AMB (1mg/ mL), LEVO (1mg/ mL) and PHEN (1mg/ mL) were used
to prepare the working standard solution of PARA (20-140 μg/mL), AMB
(10-70 μg/ mL), LEVO (10-70 μg/ mL) and PHEN (10-70 μg/ mL), respectively. For this
aliquots of 1-7 mL of standard stock solutions of PARA, AMB, LEVO and PHEN were
transferred separately to a series of 100 mL volumetric flasks and diluted upto the mark
with distilled water. The absorbance was measured at 305.5 nm for PARA, 321 nm for
AMB, 244 nm for LEVO and 280 nm for PHEN, respectively. The values of first
derivative dA/dλ were plotted against corresponding concentrations to construct the
calibration curves. The calibration curves are shown in Figures 7, 8, 9 and 10 for PARA,
AMB, LEVO and PHEN, respectively.
FIGURE 7: Calibration curve for PARA at 305.5 nm.
-0.002
0
0.002
0.004
0.006
0.008
0.01
0.012
0.014
0.016
0.018
0.02
0 50 100 150
AB
SO
RB
AN
CE
CONCENTRATION [ μg/mL]
CALIBRATION CURVE
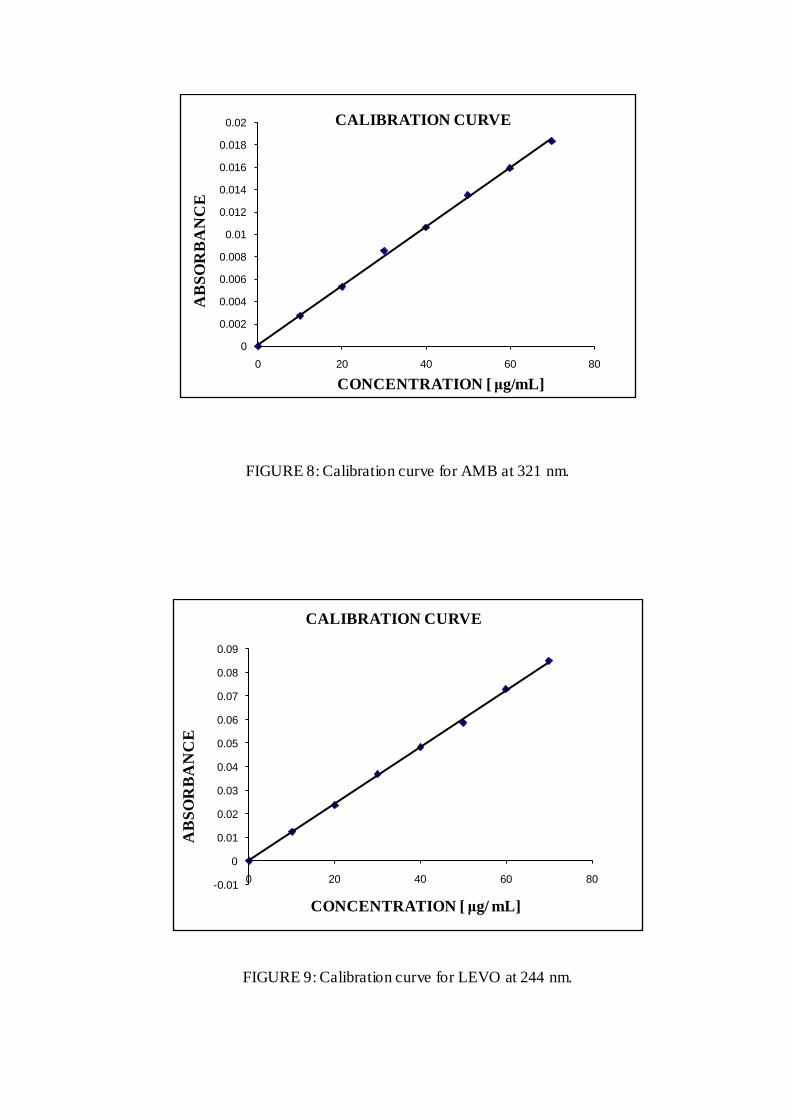
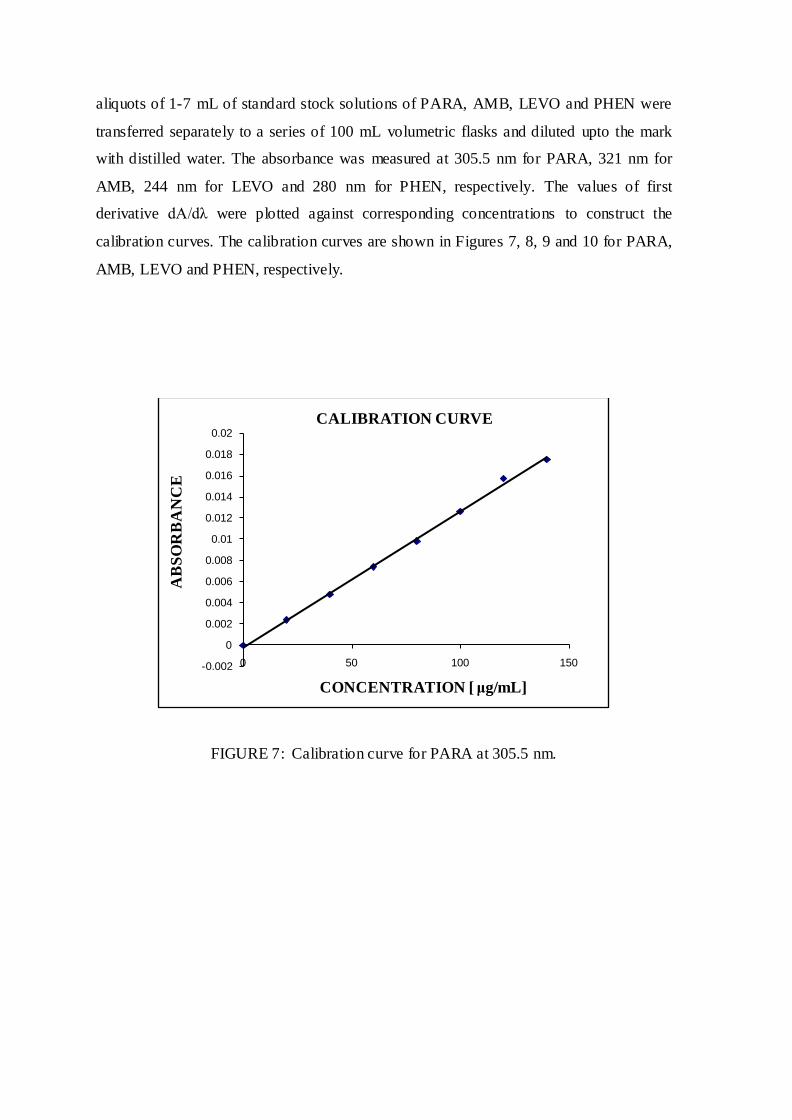
FIGURE 8: Calibration curve for AMB at 321 nm.
FIGURE 9: Calibration curve for LEVO at 244 nm.
0
0.002
0.004
0.006
0.008
0.01
0.012
0.014
0.016
0.018
0.02
0 20 40 60 80
AB
SO
RB
AN
CE
CONCENTRATION [ μg/mL]
CALIBRATION CURVE
-0.01
0
0.01
0.02
0.03
0.04
0.05
0.06
0.07
0.08
0.09
0 20 40 60 80
AB
SO
RB
AN
CE
CONCENTRATION [ μg/ mL]
CALIBRATION CURVE
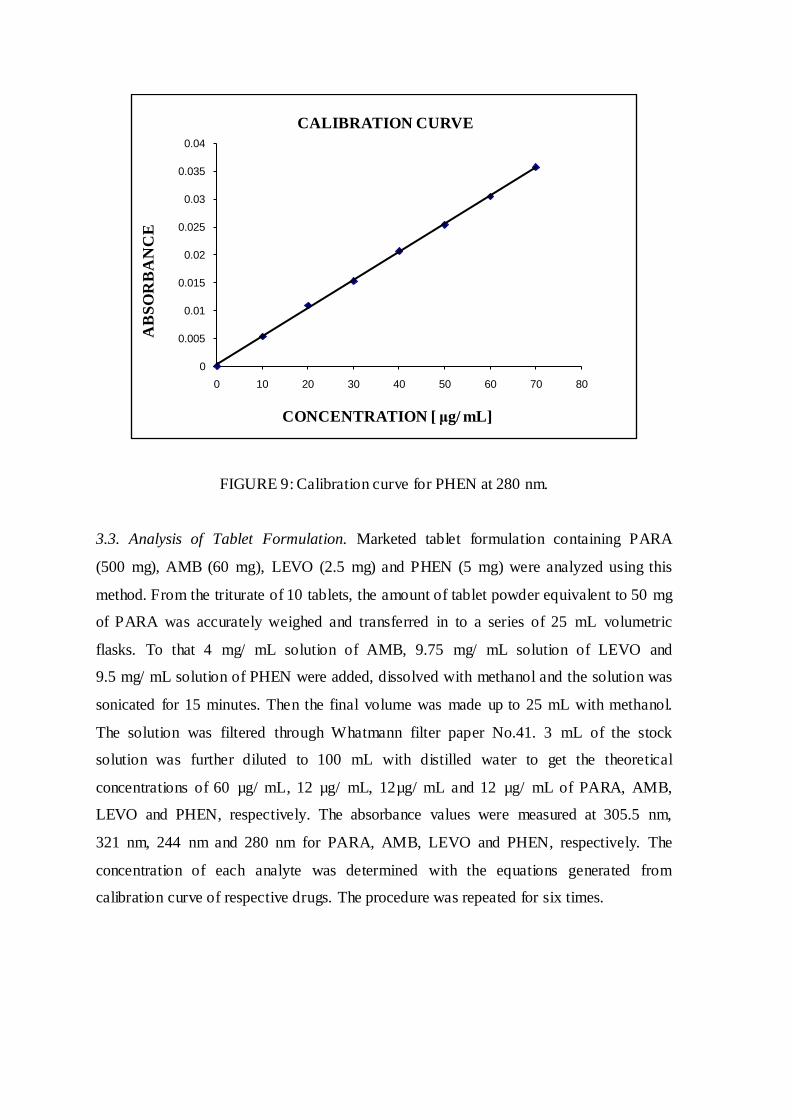
FIGURE 9: Calibration curve for PHEN at 280 nm.
3.3. Analysis of Tablet Formulation. Marketed tablet formulation containing PARA
(500 mg), AMB (60 mg), LEVO (2.5 mg) and PHEN (5 mg) were analyzed using this
method. From the triturate of 10 tablets, the amount of tablet powder equivalent to 50 mg
of PARA was accurately weighed and transferred in to a series of 25 mL volumetric
flasks. To that 4 mg/ mL solution of AMB, 9.75 mg/ mL solution of LEVO and
9.5 mg/ mL solution of PHEN were added, dissolved with methanol and the solution was
sonicated for 15 minutes. Then the final volume was made up to 25 mL with methanol.
The solution was filtered through Whatmann filter paper No.41. 3 mL of the stock
solution was further diluted to 100 mL with distilled water to get the theoretical
concentrations of 60 µg/ mL, 12 µg/ mL, 12µg/ mL and 12 µg/ mL of PARA, AMB,
LEVO and PHEN, respectively. The absorbance values were measured at 305.5 nm,
321 nm, 244 nm and 280 nm for PARA, AMB, LEVO and PHEN, respectively. The
concentration of each analyte was determined with the equations generated from
calibration curve of respective drugs. The procedure was repeated for six times.
0
0.005
0.01
0.015
0.02
0.025
0.03
0.035
0.04
0 10 20 30 40 50 60 70 80
AB
SO
RB
AN
CE
CONCENTRATION [ μg/ mL]
CALIBRATION CURVE
4.Results and Discussion
4.1. Selectivity. The UV spectra of standard mixture (PARA-60 𝜇g/ mL,
AMB -12 𝜇g/ mL, LEVO - 12 𝜇g/ mL and PHEN - 12 𝜇g/ mL and sample solutions
(tablet) were recorded between 200 and 400 nm and their dA/dλ value were measured.
The selectivity of the method was assessed by comparing spectra obtained from
formulation solution with that obtained from standard drug solution. The UV absorption
spectra obtained from standard and sample solutions were found to be identical,
confirming the selectivity of the method.
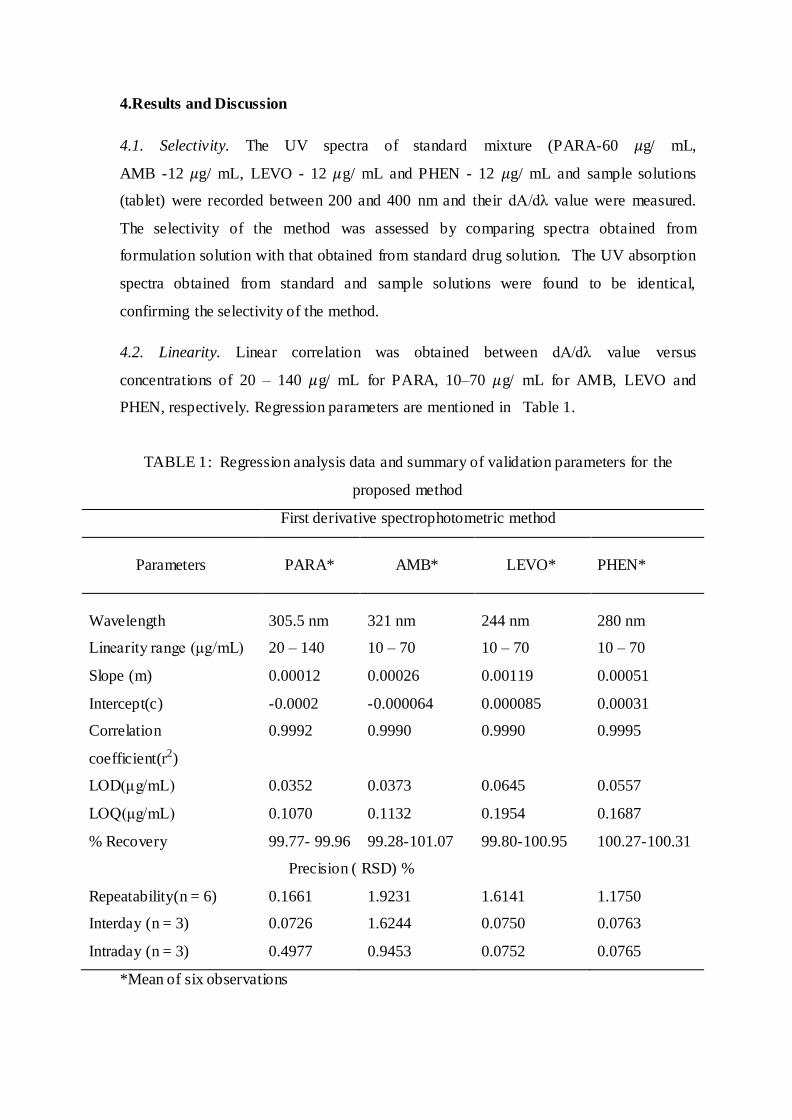
4.2. Linearity. Linear correlation was obtained between dA/dλ value versus
concentrations of 20 – 140 𝜇g/ mL for PARA, 10–70 𝜇g/ mL for AMB, LEVO and
PHEN, respectively. Regression parameters are mentioned in Table 1.
TABLE 1: Regression analysis data and summary of validation parameters for the
proposed method
First derivative spectrophotometric method
Parameters
PARA* AMB* LEVO* PHEN*
Wavelength 305.5 nm 321 nm 244 nm 280 nm
Linearity range (μg/mL) 20 – 140 10 – 70 10 – 70 10 – 70
Slope (m) 0.00012 0.00026 0.00119 0.00051
Intercept(c) -0.0002 -0.000064 0.000085 0.00031
Correlation
coefficient(r2)
0.9992 0.9990 0.9990 0.9995
LOD(μg/mL) 0.0352 0.0373 0.0645 0.0557
LOQ(μg/mL) 0.1070 0.1132 0.1954 0.1687
% Recovery 99.77- 99.96 99.28-101.07 99.80-100.95 100.27-100.31
Precision ( RSD) %
Repeatability(n = 6) 0.1661 1.9231 1.6141 1.1750
Interday (n = 3) 0.0726 1.6244 0.0750 0.0763
Intraday (n = 3) 0.4977 0.9453 0.0752 0.0765
*Mean of six observations

4.3. Accuracy. Accuracy of the method was confirmed by recovery studies. Recovery
studies were performed by standard addition method at three levels, viz., 80%, 100%, and
120%. Known amounts of pure PARA, AMB, LEVO and PHEN were added to
preanalyzed sample of marketed formulation, and they were subjected to analysis by the
proposed method. The recovery was verified by estimation of drug in triplicate
preparations at each specified concentration level and calculated %RSD. The mean
recoveries were 99.77% – 99.96%, 99.78% %– 101.07%, 99.80 % – 100.95% and
100.27 % – 100.31% PARA, AMB, LEVO and PHEN, respectively. The low percentage
RSD values indicated that there is no interference due to the excipients used in
formulation. Hence the accuracy of the method was confirmed. The results of the
recovery analysis are shown in Table 2.
TABLE 2: Recovery data for the proposed method
Drug
Amount
Present (μg/ mL)*
Amount
Added (μg/ mL)*
Amount
Estimated (μg/ mL)*
Amount
Recovered (μg/ mL)*
Percentage
Recovered* (n=6)
% RSD
59.6533 47.3221 107.8898 48.2365 101.93 0.2757
PARA 59.6533 60.0016 119.3033 59.6500 99.41 0.2891
59.6533 71.8727 131.4650 71.8117 99.92 0.1703
12.1440 9.6417 21.6966 9.5526 99.08 0.4154
AMB 12.1440 12.0892 24.2021 12.0581 99.74 0.3285
12.1440 14.3880 26.3979 14.2539 99.07 0.7261
12.1176 9.5284 21.6460 9.5284 100.00 0.3518
LEVO 12.1176 12.0916 23.9843 11.8667 98.14 0.3848
12.1176 14.3880 26.3683 14.2507 99.05 0.4868
11.9592 9.5524 21.6182 9.6590 101.11 0.9930
PHEN 11.9592 12.1304 24.2703 12.3111 101.49 0.6889
11.9592 14.3957 26.5306 14.5714 101.22 0.7734
*Mean of six observations. RSD - Relative Standard Deviation;
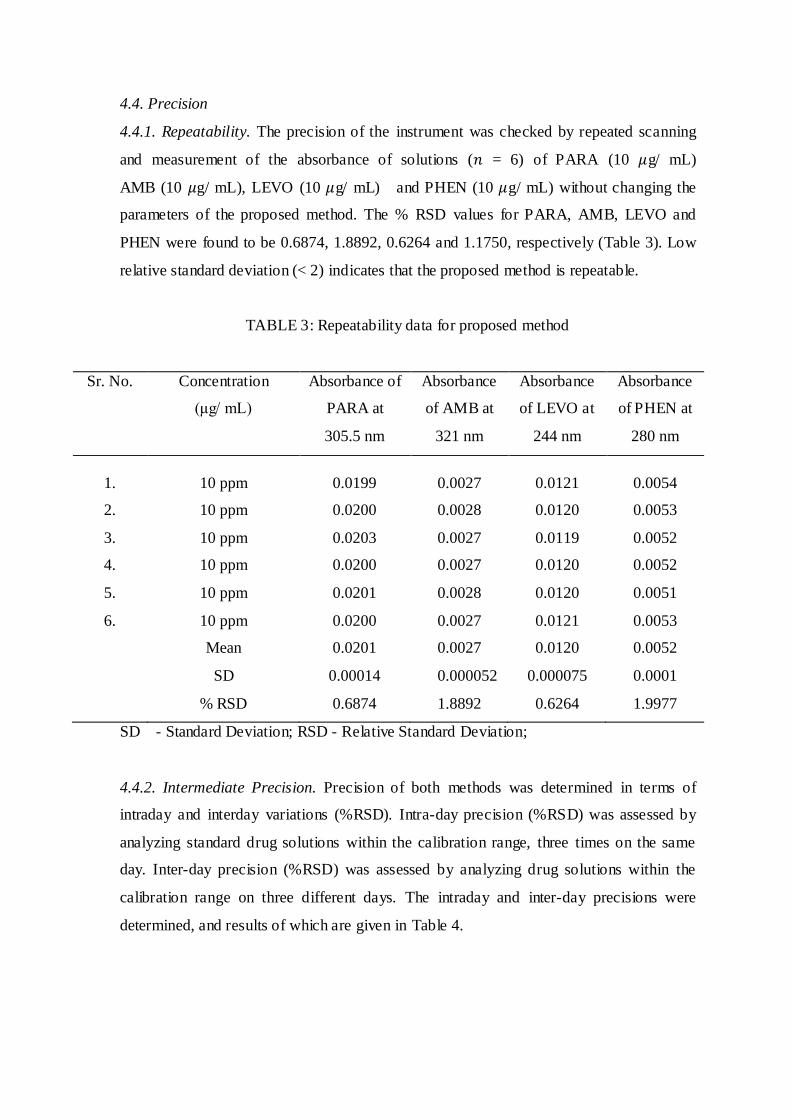
4.4. Precision
4.4.1. Repeatability. The precision of the instrument was checked by repeated scanning
and measurement of the absorbance of solutions (𝑛 = 6) of PARA (10 𝜇g/ mL)
AMB (10 𝜇g/ mL), LEVO (10 𝜇g/ mL) and PHEN (10 𝜇g/ mL) without changing the
parameters of the proposed method. The % RSD values for PARA, AMB, LEVO and
PHEN were found to be 0.6874, 1.8892, 0.6264 and 1.1750, respectively (Table 3). Low
relative standard deviation (< 2) indicates that the proposed method is repeatable.
TABLE 3: Repeatability data for proposed method
Sr. No. Concentration
(μg/ mL)
Absorbance of
PARA at
305.5 nm
Absorbance
of AMB at
321 nm
Absorbance
of LEVO at
244 nm
Absorbance
of PHEN at
280 nm
1. 10 ppm 0.0199 0.0027 0.0121 0.0054
2. 10 ppm 0.0200 0.0028 0.0120 0.0053
3. 10 ppm 0.0203 0.0027 0.0119 0.0052
4. 10 ppm 0.0200 0.0027 0.0120 0.0052
5. 10 ppm 0.0201 0.0028 0.0120 0.0051
6. 10 ppm 0.0200 0.0027 0.0121 0.0053
Mean 0.0201 0.0027 0.0120 0.0052
SD 0.00014 0.000052 0.000075 0.0001
% RSD 0.6874 1.8892 0.6264 1.9977
SD - Standard Deviation; RSD - Relative Standard Deviation;
4.4.2. Intermediate Precision. Precision of both methods was determined in terms of
intraday and interday variations (%RSD). Intra-day precision (%RSD) was assessed by
analyzing standard drug solutions within the calibration range, three times on the same
day. Inter-day precision (%RSD) was assessed by analyzing drug solutions within the
calibration range on three different days. The intraday and inter-day precisions were
determined, and results of which are given in Table 4.
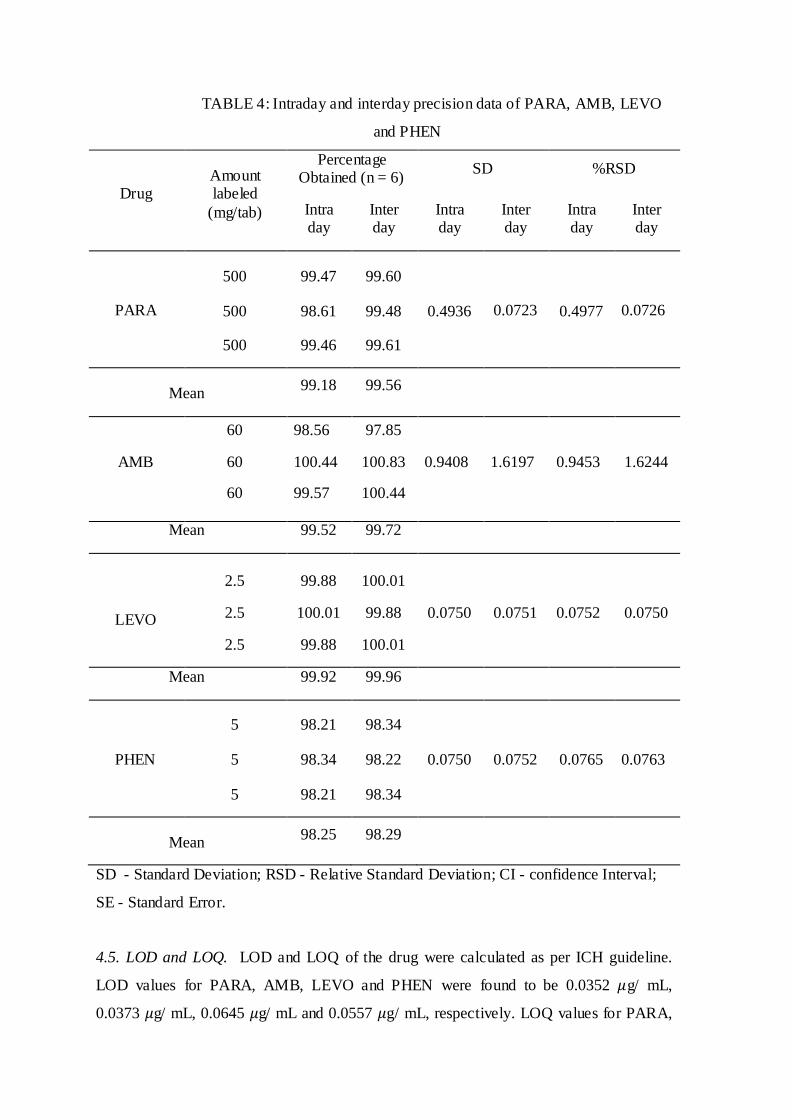
TABLE 4: Intraday and interday precision data of PARA, AMB, LEVO
and PHEN
Drug Amount labeled
(mg/tab)
Percentage Obtained (n = 6)
SD %RSD
Intra day
Inter day
Intra day
Inter day
Intra day
Inter day
PARA
500
500
500
99.47
98.61
99.46
99.60
99.48
99.61
0.4936
0.0723
0.4977
0.0726
Mean 99.18 99.56
AMB
60
60
60
98.56
100.44
99.57
97.85
100.83
100.44
0.9408 1.6197 0.9453 1.6244
Mean 99.52 99.72
LEVO
2.5
2.5
2.5
99.88
100.01
99.88
100.01
99.88
100.01
0.0750 0.0751 0.0752 0.0750
Mean 99.92 99.96
PHEN
5
5
5
98.21
98.34
98.21
98.34
98.22
98.34
0.0750 0.0752 0.0765 0.0763
Mean 98.25 98.29
SD - Standard Deviation; RSD - Relative Standard Deviation; CI - confidence Interval;
SE - Standard Error.
4.5. LOD and LOQ. LOD and LOQ of the drug were calculated as per ICH guideline.
LOD values for PARA, AMB, LEVO and PHEN were found to be 0.0352 𝜇g/ mL,
0.0373 𝜇g/ mL, 0.0645 𝜇g/ mL and 0.0557 𝜇g/ mL, respectively. LOQ values for PARA,
AMB, LEVO and PHEN were found to be 0.1070 μg/ mL, 0.1132 𝜇g/ mL,
0.1954 𝜇g/ mL and 0.1687 𝜇g/ mL, respectively (Table 1). These data show that the
proposed method is sensitive for the determination of PARA, AMB, LEVO and PHEN.
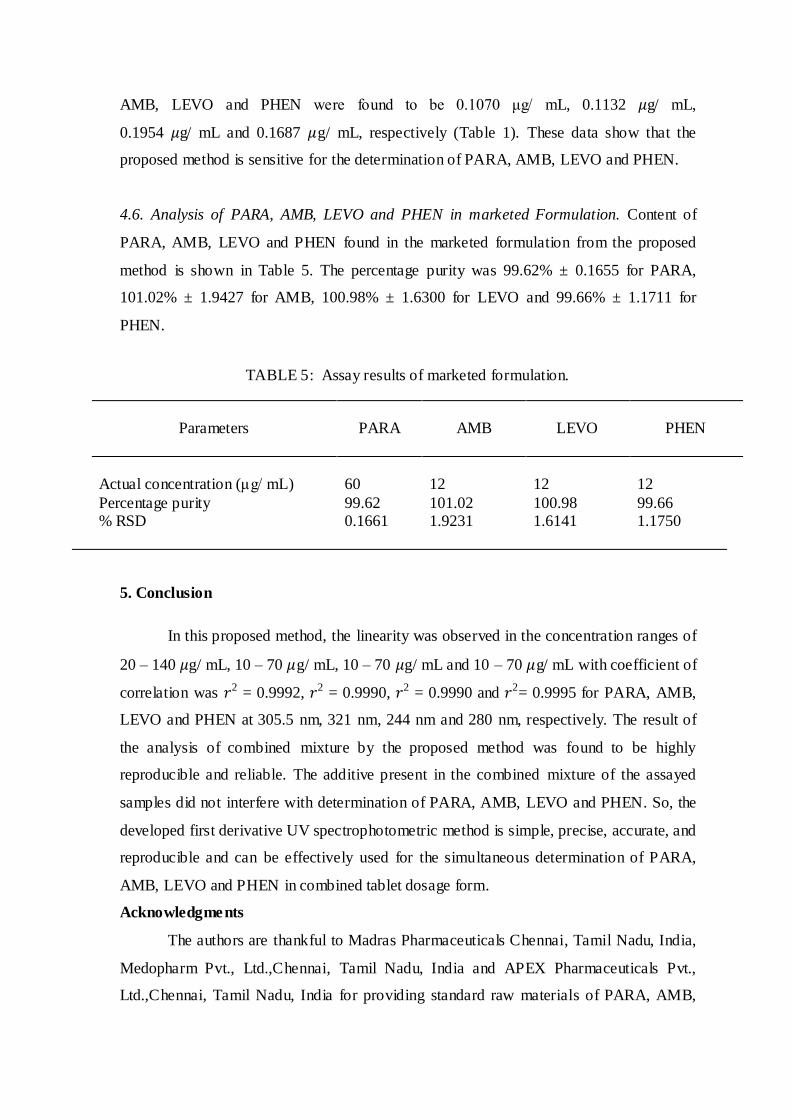
4.6. Analysis of PARA, AMB, LEVO and PHEN in marketed Formulation. Content of
PARA, AMB, LEVO and PHEN found in the marketed formulation from the proposed
method is shown in Table 5. The percentage purity was 99.62% ± 0.1655 for PARA,
101.02% ± 1.9427 for AMB, 100.98% ± 1.6300 for LEVO and 99.66% ± 1.1711 for
PHEN.
TABLE 5: Assay results of marketed formulation.
Parameters PARA AMB LEVO
PHEN
Actual concentration (μg/ mL)
60
12
12
12
Percentage purity 99.62 101.02 100.98 99.66 % RSD 0.1661 1.9231 1.6141 1.1750
5. Conclusion
In this proposed method, the linearity was observed in the concentration ranges of
20 – 140 𝜇g/ mL, 10 – 70 𝜇g/ mL, 10 – 70 𝜇g/ mL and 10 – 70 𝜇g/ mL with coefficient of
correlation was 𝑟2 = 0.9992, 𝑟2 = 0.9990, 𝑟2 = 0.9990 and 𝑟2= 0.9995 for PARA, AMB,
LEVO and PHEN at 305.5 nm, 321 nm, 244 nm and 280 nm, respectively. The result of
the analysis of combined mixture by the proposed method was found to be highly
reproducible and reliable. The additive present in the combined mixture of the assayed
samples did not interfere with determination of PARA, AMB, LEVO and PHEN. So, the
developed first derivative UV spectrophotometric method is simple, precise, accurate, and
reproducible and can be effectively used for the simultaneous determination of PARA,
AMB, LEVO and PHEN in combined tablet dosage form.
Acknowledgments
The authors are thankful to Madras Pharmaceuticals Chennai, Tamil Nadu, India,
Medopharm Pvt., Ltd.,Chennai, Tamil Nadu, India and APEX Pharmaceuticals Pvt.,
Ltd.,Chennai, Tamil Nadu, India for providing standard raw materials of PARA, AMB,
LEVO and PHEN. Also thankful to Dr.T.Vetrichelvan, Principal, Adhiparasakthi College
of Pharmacy, Melmaruvathur for providing the necessary facilities to carry out the
research work.
.
References
1. Indian Pharmacopoeia 2010, vol. 3, Ministry of Health & Family Welfare,
Pharmacopoeia Commision, Ghaziabad, India, 6th edition.
2. British Pharmacopoeia 2010, vol. 3, British pharmacopoeia Commision Office,
London, UK.
3. B. Ghodasara Ragul and M. Prajapathi Arun, “Spectrophotometric method for
simultaneous estimation of ambroxol hydrochloride, levocetrizine d ihydrochloride
and phenylephrine hydrochloride in tablet dosage form,” International Research
Journal of Pharmacy, vol. 4, pp. 197-200, 2013.
4. Ilangovan Ponnilavarasan, Chebrolu.Sunil Narendrakumar and P. Asha,
“Simultaneous estimation of ambroxol hydrochloride and loratadine in tablet
dosage form by using UV spectrophotometric method,” International Journal of
Pharmaceutical and Bio Sciences, vol. 2, pp. 338-344, 2011.
5. Kaminee Parmar, Sunil Baldania, Dimal Shah, Usmangani Chhalotiya and
Naimin Parmar, “Development and validation of first-order derivative
spectrophotometry for simultaneous determination of levocetirizine
dihydrochloride and phenylephrine hydrochloride in pharmaceutical dosage
form,” International Journals of Spectroscopy, vol. 3, pp. 1-6, 2013.
6. S. Lakshmana Prabhu, A. A. Shirwaikar, Annie Shirwaikar, C. Dinesh Kumar and
G. Aravind Kumar, “Simultaneous UV spectrophotometric estimation of
ambroxol hydrochloride and levocetirizine dihydrochloride,” Indian Journal of
Pharmaceutical Sciences, vol. 70, pp. 236–238, 2008.
7. Love Kumar Soni, Tamanna Narsinghani and Charu Saxena,
“UV spectrophotometric estimation of ebastine and phenylephrine hydrochloride
in tablet dosage form using absorption ratio method,” Der Pharmacia Sinica,
vol. 2, pp. 11-16, 2011.
8. Mehul Patel, Bhavna Patel and Shraddha Parmar, “Simultaneous estimation of
ibuprofen and phenylephrine hydrochloride in bulk and combined dosage form by
first derivative UV spectrophotometry method,” Creative commons Attribution
License, vol. 2, pp. 198-201, 2013.

9. A. Manikantakumar, A. Swathi, D. Supriya, L. N. Prasad, V. Prakash and
V. Diwan, “Development and validation of UV spectrophotometric method for
simultaneous estimation of ibuprofen, paracetamol and caffeine in pharmaceutical
dosage form,” American Journal of Pharmatech Research, vol. 2, pp. 540-547,
2012.
10. Ramesh Sawant, Rupali Joshi, Manisha Sawant, Prashant Lanke and
Lokesh Bhangale, “Mathematical and multiwavelength spectrophotometric
methods for simultaneous estimation of paracetamol, phenylephrine
hydrochloride, chlorpheniramine maleate and caffein,”International Journal of
Pharmaceutical Frontier Research, vol. 1, pp. 31-38, 2011.
11. P.Y. Pawar, Hapse Sandip, Salve Megha and Agarkar Arti, “Spectrophotometric
estimation and validation of paracetamol and domperidone by different method
from pure and tablet dosage form,” International Journal of Drug Research and
Technology, vol. 3, pp. 37- 44, 2013.
12. G. Nagamalleswari, A. Prabahar and N. Ramarao, “Simultaneous quantitative
estimation of levocetirizine and phenylephrine by different analytical methods,”
International Journal of Pharmaceutical Research, vol. 5, pp. 214-22, 2013.
13. Padmakana Malakar, Arup Ratan Deb, Soumitra Adhikary, Siraj Ahmed and Ravi
Maloth, “Simultaneous estimation of phenylephrine hydrochloride, paracetamol,
caffeine and cetirizine dihydrochloride from tablet dosage form using RP-HPLC,”
International Journal of Biological & Pharmaceutical Research, vol. 4,
pp. 368-376, 2013.
14. Palled Mahesh, Karagane Swapnalee, Mane Aruna, Bhat Anilchandra and Shinde
Prashanti, “Analytical method development and validation of acetaminophen,
caffeine, phenylephrine hydrochloride and dextromethorphan hydrobromide in
tablet dosage form by RP- HPLC,” Inventi Journal of Pharmaceutical Science
Invention, vol. 2, pp. 9-15, 2013.
15. S. R. Pattan, S. G.Jamdar, R. K. Godge, N. S. Dighe, S. A. Daithankar, Nirmal
and M. G. Pai, “RP- HPLC method for simultaneous estimation of paracetamol
and etoricoxib from bulk and tablets,” Journal of Chemical and Pharmaceutical
Research, vol. 1, pp. 329-335, 2009.
16. M. Pinak, Sanchaniya, A. Falgun, Mehta and Nirav, B. Uchadadiya,
“Development and validation of RP-HPLC method for estimation of ibuprofen

and phenylephrine hydrochloride in combined pharmaceutical dosage form,”
Chromatographic International Research, vol. 3, pp. 1-6, 2013.
17. M. Prajapati Arun and B. Ghodasara Rahul, “Development and validation of
RP-HPLC method for simultaneous determination of ambroxol hydrochloride,
levocetirizine dihydrochloride and phenylephrine hydrochloride in combined
dosage form,” Inventi Rapid; Pharmaceutical Analysis & Quality Assurance,
Vol. 2013, Article ID- " Inventi:ppaqa/864/13 ".
18. S. Gopalakrishnan, T. A. Chitra, A. Aruna and A. Chenthilnathan, “Development
of RP-HPLC method for the simultaneous estimation of ambroxol hydrochloride,
cetirizine hydrochloride and antimicrobial preservatives in combined dosage
form,” Der Pharma Chemica, vol. 4, pp. 1003-1015, 2012.
19. Grzegorz, Bazylak and LucJNagels, “Simultaneous high-throughput
determination of clenbuterol, ambroxol and bromhexine in Pharmaceutical
formulations by HPLC with potentiometric detection,” Journal of Pharmaceutical
and Biomedical Analysis, vol. 4, pp.887-903, 2003.
20. Jigar Goswami, Jagdish Kakadiya and Nehal Shah,“RP-HPLC method
development and validation for simultaneous estimation of ambroxol
hydrochloride and cefpodoxime proxetile in pharmaceutical dosage form,”
American Journal of pharmatech Research, vol. 2, pp. 1043 – 1052, 2012.
21. Preeti Chandra, Atul Singh Rathore, Sathiyanarayanan Lohidasan and Kakasaheb
Ramoo Mahadik, “Application of HPLC for the simultaneous determination of
aceclofenac, paracetamol and tramadol hydrochloride in pharmaceutical dosage
form,” Scientia Pharmaceutica, vol. 8, pp. 337-351, 2012.
22. R. Sawant, P. Joshi, Lanke and L. Bhangale, “Simultaneous estimation and
validation of paracetamol, phenylephrine hydrochloride and chlorpheniramine
maleate in tablets by spectrophotometric method,” Journal of Pharmaceutical
Science and Health Care, vol. 3, pp. 23- 28, 2010.
23. Rakshit Kanubhai Trivedi, Mukesh C. Patel, B. Sushant and Jadhav, “Rapid,
stability indicating RP-UPLC method for simultaneous determination of ambroxol
hydrochloride, cetirizine hydrochloride and antimicrobial preservatives in liquid
pharmaceutical formulation,” Scientia Pharmaceutica, vol. 7, pp. 525–543, 2011.
24. J. Mahesh Reddy, M. R. Jeyaprakash, K. Madhuri, S. N. Meyyanathan and
K. A. Elango, “Sensitive RP-HPLC method for simultaneous estimation of

diethylcarbamazine and levocetirizine in tablet formulation,”Journal of Pub Med
and Science Citation, vol. 7, 320-323, 2011.
25. V. Maslarska and J. Tencheva, “Simultaneous determination and validation of
paracetamol and codeine phosphate in pharmaceutical preparation by
RP-HPLC,” International Journal of Pharmaceutical Science, vol. 5,
pp. 417-419, 2013.
26. Mukesh Maithani, Richa Raturi, Vertika Gautam, Dharmendra Kumar, Amrendra
Kumar Chaudhary, Anand Gaurav and Ranjit Sing’ “Development and validation
of a RP-HPLC method for the determination of chlorpheniramine maleate and
phenylephrine in pharmaceutical dosage form,” Pharmacie Globale International
Journal of Comprehensive Pharmacy, vol. 5, pp. 8146-8157, 2010.
27. G. Nagamalleswari, “Development and validation of a chromatographic method
for simultaneous estimation of levocetrizine and phenylephrine in pharmaceutical
dosage form,” International Journal of Advances in Pharmaceutical Research,
vol. 4, pp.1921 – 1926, 2013.
28. D. Ramteke Urwashi and S. P. Wate, “RP-HPLC method development and
validation for simultaneous estimation of levocetirizne dihydrochloride and
phenylephrine hydrochloride in their tablet dosage form,” Asian Journals of
Research and Chemistry, vol. 6, pp. 1-3, 2013.
29. Ritu Kimbahune, Sunil K.Prachi Kabra, Kuldeep Delvadiya and Sanjay Surani.
“Spectrophotometric analysis of ambroxol hydrochloride, guaiphenasin, and
terbutaline sulphate in liquid dosage form (syrup),” International Journal of
Pharmaceutical Sciences Review and Research, vol. 8, pp. 24-28, 2011.
30. S. Rohan, Wagh, R. A. Hajare, Anand Tated and Anil V. Chandewar,
“Absorption correction method and simultaneous equation method for the
simultaneous estimation of ebastine and phenylephrine hydrochloride in bulk and
in combined tablet dosage form,” International Journal of Research in Pharmacy
and Chemistry, vol. 1, pp. 812-818, 2011.
31. Saeed Arayne, M. Najma Sultana, Mirza Agha Zeeshan and Farhan Ahmed
Siddiqui, “Simultaneous determination of gliquidone, fexofenadine, buclizine and
levocetirizine in dosage formulation and human serum by RP-HPLC, ”Journal of
Chromatographic Science, vol. 48, pp. 382-385, 2008.
32. K. A. Shaikh and A. T. Patil, “A stability- indicating lc method for the
simultaneous determination of levocetirizine dihydrochloride and
pseudoephedrine sulfate in tablet dosage forms,” International Journal of Chem
Tech Research, vol. 2, pp. 454 – 461, 2010.
33. K. A.Shaikh, S. D. Patil and A. B. Devkhile, “Development and validation of a
reversed - phase HPLC method for simultaneous estimation of ambroxol
hydrochloride and azithromycin in tablet dosage form,”Journal of Pharmaceutical
and Biomedical Analysis, vol. 48, pp. 1481-1484, 2008.
34. A. L. Suryan, V. K. Bhusari, K. S. Rasal and S. R. Dhaneshwar, “Simultaneous
quantitation and validation of paracetamol, phenylpropanolamine hydrochloride
and cetirizine hydrochloride by RP-HPLC in bulk drug and formulation,”
International Journal of Pharmaceutical Sciences and Drug Research, vol. 3,
pp. 303-308, 2011.
35. Ramalingam Suresh, Rajappan Manavalan and Kannappan Valliappan,
“HPLC method for the simultaneous determination of levocetirizine, ambroxol
and montelukast in human plasma employing response surface methodology,”
International Journal of Drug Development & Research, vol. 4, pp. 173-185,
2012.
36. R. S. Wagh, R. A. Hajare, A .G. Tated, P .A. Gadbali, F.A Khan and S. D. Kayal,
“Method development and validation for simultaneous determination of ebastine
and phenylephrine hydrochloride in tablet formulation by RP-HPLC,”
International Journal of Pharmaceutical Research and Development, vol. 3, pp.
214-220, 2011.
37. S. Atul Rathore, L. Sathiyanarayanan and K. R. Mahadik, “Development of
validated HPLC and HPTLC methods for simultaneous determination of
levocetirizine dihydrochloride and montelukast sodium in bulk drug and
pharmaceutical dosage form,” Journal of Pharmaceutica Analytica Acta,
vol. 1, pp. 1-6, 2010.
38. R. Chabukswar Anuruddha, Thakur Vishakha, L. Dharam Deepali, H. Shah
mansi, S. Kuchekar Bhanudas and Sharma Shailesh, “Development and validation
of HPTLC method for simultaneous estimation of paracetamol, ibuprofen and
caffeine in bulk and pharmaceutical dosage form,” Reseacch Journal of Pharmacy
and Technology, vol. 5, pp. 1218-1222, 2012.
39. T. Raja and A. Lakshmana Rao, “Development and validation of HPTLC method
for the simultaneous estimation of gemifloxacin mesylate and ambroxol

hydrochloride in bulk and tablet dosage form,” Analytical Chemistry Letters,
vol. 2, pp. 152-158, 2013.
40. FenliSu, Feng Wang, Wei Gao and Huande Li, “Determination of ambroxol in
human plasma by high performance liquid chromatography–electrospray
ionization mass spectrometry (HPLC–MS/ESI)”, Journal of Chromatography,
vol. 853, pp. 364–368, 2007.
41. H. Kim, J. Y. Yoo, S. B. Han, H. J. Lee and K. R. Lee, “Determination of
ambroxol in human plasma using LC-MS/MS,” Journal of Pharmaceutical and
Biomedical Analysis, vol. 32, pp. 209-216, 2003.
42. “ICH Tripartite Guidelines, Q2R1, Validation of Analytical Procedures: Text and
Methodology,” Geneva, Switzerland, 2005.
43. “ICH Tripartite Guidelines, Q2B, Validation of Analytical Procedures: Text and
Methodology,”Geneva,Switzerland,1996.