simultaneous analysis of four sulfonamides in chicken
TRANSCRIPT

HAL Id: hal-00701868https://hal.archives-ouvertes.fr/hal-00701868
Submitted on 27 May 2012
HAL is a multi-disciplinary open accessarchive for the deposit and dissemination of sci-entific research documents, whether they are pub-lished or not. The documents may come fromteaching and research institutions in France orabroad, or from public or private research centers.
L’archive ouverte pluridisciplinaire HAL, estdestinée au dépôt et à la diffusion de documentsscientifiques de niveau recherche, publiés ou non,émanant des établissements d’enseignement et derecherche français ou étrangers, des laboratoirespublics ou privés.
Simultaneous analysis of four sulfonamides in chickenmuscle tissue by High Performance Liquid
ChromatographyCarmen Lidia Chitescu, Anca Ioana Nicolau, Ana Csuma, Carmen Moisoiu
To cite this version:Carmen Lidia Chitescu, Anca Ioana Nicolau, Ana Csuma, Carmen Moisoiu. Simultaneous analysisof four sulfonamides in chicken muscle tissue by High Performance Liquid Chromatography. FoodAdditives and Contaminants, 2011, pp.1. �10.1080/19440049.2011.577098�. �hal-00701868�

For Peer Review O
nly
Simultaneous analysis of four sulfonamides in chicken muscle tissue by High Performance Liquid Chromatography
Journal: Food Additives and Contaminants
Manuscript ID: TFAC-2010-425.R1
Manuscript Type: Original Research Paper
Date Submitted by the Author:
26-Mar-2011
Complete List of Authors: Chitescu, Carmen; University Dunarea de Jos GalaŃi, Faculty of Food Science and Engineering Nicolau, Anca; University Dunarea de Jos GalaŃi, Faculty of Food Science and Engineering Csuma, Ana; Pasteur Institute Bucharest, Residues Laboratory
Moisoiu, Carmen; Pasteur Institute Bucharest, Romania
Methods/Techniques: Chromatography - HPLC, Chromatography - LC/MS, Extraction, Method validation
Additives/Contaminants: Veterinary drug residues - sulphonamides
Food Types: Animal products – meat
Abstract:
Abstract The aim of this study was to develop a simple high-performance liquid chromatography (HPLC) with UV detection method, for the determination of four sulfonamides in chicken muscle tissue. The sulfonamides were extracted with acetonitrile, acetone and dichloromethane. Separation was carried out on an C18 analytical column, using as mobile phase a mixture of 6‰ di-sodium
hydrogen phosphate and methanol. The analytes were detected by UV, in one run. Calibration curves were linear with very good correlation coefficients for concentration ranging from 30µg kg-1 to 150µg kg-1. The limits of detection (LOD) for sulfonamides ranged from 6.5 to 0.14 µg kg-1. The recovery for spiked chicken muscle with 50–150 µg kg-1 ranged more than 70%. The relative standard deviations (RSDs) of the sulfonamides for six measurements at 50 µg kg-1, 100 µg kg-1 and 150 µg kg-1 were less then 15%. These
http://mc.manuscriptcentral.com/tfac Email: [email protected]
Food Additives and Contaminants

For Peer Review O
nly
parameters met the EU criteria for method validation. The results were confirmed by liquid chromatography–tandem mass spectrometry (LC–MS/MS) using multiple reacting monitoring, as operating mode. Confirmation require the retention times of the analytes to be within ±2.5% of the retention times of the standards, presence of the parent ion and two characteristic
fragment ions (product ions) per analyte, as well as the relative ion abundance ratios of the fragment ions shall correspond to ratios obtained for the standards, within permitted limits . The transition of two common product ions at m/z 155.7 and 107.5 were monitored for all sulfonamides. Each of the analytes, in all tested samples met the confirmation criteria. Thus, it was demonstrated the applicability of the HPLC-UV method for routine analysis of chicken muscle tissue.
Page 1 of 25
http://mc.manuscriptcentral.com/tfac Email: [email protected]
Food Additives and Contaminants
123456789101112131415161718192021222324252627282930313233343536373839404142434445464748495051525354555657585960
For Peer Review O
nly
1
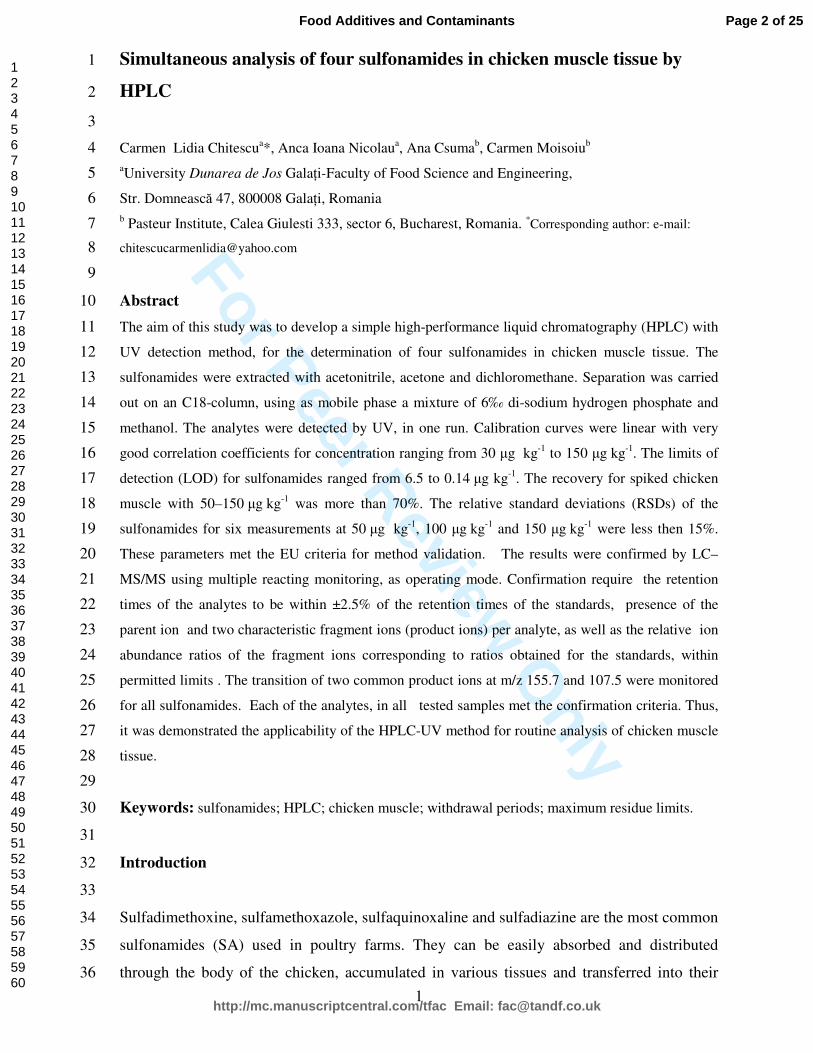
Simultaneous analysis of four sulfonamides in chicken muscle tissue by 1
HPLC 2
3
Carmen Lidia Chitescua*, Anca Ioana Nicolaua, Ana Csumab, Carmen Moisoiub 4
aUniversity Dunarea de Jos GalaŃi-Faculty of Food Science and Engineering, 5
Str. Domnească 47, 800008 GalaŃi, Romania 6
b Pasteur Institute, Calea Giulesti 333, sector 6, Bucharest, Romania. *Corresponding author: e-mail: 7
9
Abstract 10
The aim of this study was to develop a simple high-performance liquid chromatography (HPLC) with 11
UV detection method, for the determination of four sulfonamides in chicken muscle tissue. The 12
sulfonamides were extracted with acetonitrile, acetone and dichloromethane. Separation was carried 13
out on an C18-column, using as mobile phase a mixture of 6‰ di-sodium hydrogen phosphate and 14
methanol. The analytes were detected by UV, in one run. Calibration curves were linear with very 15
good correlation coefficients for concentration ranging from 30 µg kg-1 to 150 µg kg-1. The limits of 16
detection (LOD) for sulfonamides ranged from 6.5 to 0.14 µg kg-1. The recovery for spiked chicken 17
muscle with 50–150 µg kg-1 was more than 70%. The relative standard deviations (RSDs) of the 18
sulfonamides for six measurements at 50 µg kg-1, 100 µg kg-1 and 150 µg kg-1 were less then 15%. 19
These parameters met the EU criteria for method validation. The results were confirmed by LC–20
MS/MS using multiple reacting monitoring, as operating mode. Confirmation require the retention 21
times of the analytes to be within ±2.5% of the retention times of the standards, presence of the 22
parent ion and two characteristic fragment ions (product ions) per analyte, as well as the relative ion 23
abundance ratios of the fragment ions corresponding to ratios obtained for the standards, within 24
permitted limits . The transition of two common product ions at m/z 155.7 and 107.5 were monitored 25
for all sulfonamides. Each of the analytes, in all tested samples met the confirmation criteria. Thus, 26
it was demonstrated the applicability of the HPLC-UV method for routine analysis of chicken muscle 27
tissue. 28
29
Keywords: sulfonamides; HPLC; chicken muscle; withdrawal periods; maximum residue limits. 30
31
Introduction 32
33
Sulfadimethoxine, sulfamethoxazole, sulfaquinoxaline and sulfadiazine are the most common 34
sulfonamides (SA) used in poultry farms. They can be easily absorbed and distributed 35
through the body of the chicken, accumulated in various tissues and transferred into their 36
Page 2 of 25
http://mc.manuscriptcentral.com/tfac Email: [email protected]
Food Additives and Contaminants
123456789101112131415161718192021222324252627282930313233343536373839404142434445464748495051525354555657585960

For Peer Review O
nly
2
products (Kan and Petz, 2000; Kishda and Furusawa 2002). The recommended withdrawal 37
periods, if not observed before slaughtering of the medicated animals, may impact on the 38
safety of chicken meat and by-products. 39
40
In order to ensure the reduction to an acceptable level of sulfonamide residues in edible 41
tissues, these substances must be administered only in recommended concentrations and their 42
withdrawal times must be observed. The maximum residue level (MRL) of sulfonamides in 43
poultry tissues and eggs is 100 µg kg-1 (Council Regulation 2377/90-EEC, 1990; Codex 44
Alimentarius Commission, CAC/MRL 02-2006, Maximum residue limits for veterinary drugs 45
in foods; and Code of Federal Regulation, USA, 1996). 46
47
Despite the efforts of national and international bodies involved in food residue control, still 48
there are people affected by the presence of drug residues in food. Unfortunately, about 10-49
15% of the human population is considered to be hypersensitive to antimicrobials especially 50
penicillin and sulfonamides (Slatore, 2004; Cochrane et al., 1995) and suffer from allergic 51
reactions like skin rashes, hives, asthma and anaphylactic shock. It has been estimated that 52
approximately five percent of human patients medicated with sulfonamides received 53
unwanted effects from the drugs (Montanaro, 1998; Korpimäki, 2004). 54
55
The interest in having reliable methods able to detect low amounts of sulfonamides in food is 56
very real. Chicken meat is the second most popular meat in Romania, with a weight of about 57
33% of total meat consumption (average consumption in 2009 was 20.5kg/person/year), 58
contributing to increased population exposure to residues of sulfonamides, if this level is not 59
well controlled (Peligrad, 2010). 60
61
Sulphonamide residue analysis involves extraction with an appropriate solvent followed by 62
one or more clean-up processes and then quantitative determination. Traditionally, the 63
extraction of sulphonamides from meat, has been performed with organic solvents. 64
Sulphonamides are not very soluble in non-polar solvents, but have good solubility in more 65
polar solvents. Extraction is generally carried out with chloroform, methylene chloride 66
(Thomas, 1998), acetone, acetonitrile, or ethyl acetate. Sample clean-up procedures include 67
column chromatography, solid phase extraction (SPE) (Bele et al., 2007; Hela et al., 2003; 68
Kao, et al., 2001), matrix solid phase dispersion (MSPD) (Kishda and Furusawa , 2001), 69
supercritical fluid extraction (SPE) (Maxwell, Lightfield,1998). 70
Page 3 of 25
http://mc.manuscriptcentral.com/tfac Email: [email protected]
Food Additives and Contaminants
123456789101112131415161718192021222324252627282930313233343536373839404142434445464748495051525354555657585960

For Peer Review O
nly
3
A variety of methods have been used to measure sulfonamide residue in biological materials, 71
including thin-layer chromatography (TLC) (Babić, et al. 2005) , high-performance liquid 72
chromatography (HPLC) with UV, UV-DAD (Gratacós-Cubarsí, et al., 2006; Furusawa and 73
Kishida, 2001) or fluorescence detection (Gehring, et al., 2006), liquid chromatography - 74
mass spectrometry (LC/MS) (Jung, et al., 2004), micellar liquid chromatography (Szyman, 75
2008), high-performance capillary electrophoresis (HPCE), gas chromatography (GC), along 76
with enzyme-linked immunosorbent assay (ELISA) (Zhang, et al., 2007), biosensor 77
immunoassay (BIA) (Ploum, et al. 2005) and microbiological methods (Braham, et al., 78
2001). 79
80
Instrumental methods such as LC/MS and GC are both sensitive and specific, but are 81
laborious and expensive. These methods are suitable for confirmation but not for screening of 82
large numbers of samples. Microbiological methods do not require highly specialized and 83
expensive equipment, but they have not enough sensitivity and assay precision. Currently, 84
TLC has been almost replaced by other instrumental analysis. Although HPCE has powerful 85
separation ability, the precision is poor and the instrument still needs to be improved. 86
Immunochemical methods such as ELISA can be simple, rapid and cost-effective, with 87
enough sensitivity and specificity to detect small molecules (Wang et al., 2005). The official 88
method AOAC uses pre-column derivatization and liquid chromatography with fluorescence 89
detection (Salisbury, 2004). 90
91
A rapid, sensitive and specific assay is required to detect sulphonamides positive samples in 92
routine analysis, by liquid chromatography with ultraviolet detection (LC–UV). The goal of 93
this paper is to promote a HPLC-UV method, which does not need to be performed on the 94
latest generation equipment, but is able to be used for the simultaneous detection of 95
sulfonamides residues in meat. This method could be welcomed both by the laboratories of 96
the veterinary medicine manufacturers, where withdrawal times have to be established, and 97
Official Control Laboratories that regularly evaluate the implementation of good veterinary 98
practices, detect and regulate deviations in veterinary drugs usage. The authors are expecting 99
that this method to be of real help especially for the laboratories from the EU new member 100
states, in which expensive analytical techniques are not widely available. This multi-residue 101
analysis was performed to simultaneously determine four sulfonamides in chicken muscle 102
tissue: sulfadimethoxine sulfamethoxazole, sulfaquinoxaline and sulfadiazine, the most 103
common used sulfonamides in poultry farms. 104
Page 4 of 25
http://mc.manuscriptcentral.com/tfac Email: [email protected]
Food Additives and Contaminants
123456789101112131415161718192021222324252627282930313233343536373839404142434445464748495051525354555657585960
For Peer Review O
nly
4
105
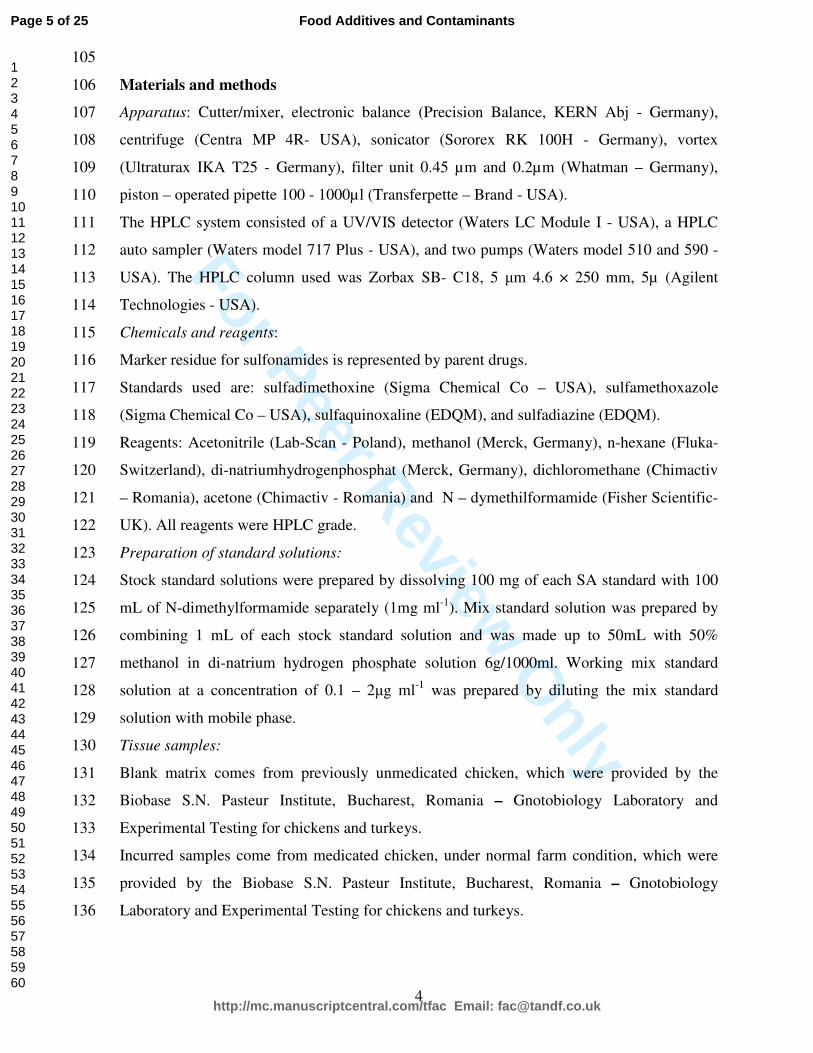
Materials and methods 106
Apparatus: Cutter/mixer, electronic balance (Precision Balance, KERN Abj - Germany), 107
centrifuge (Centra MP 4R- USA), sonicator (Sororex RK 100H - Germany), vortex 108
(Ultraturax IKA T25 - Germany), filter unit 0.45 µm and 0.2µm (Whatman – Germany), 109
piston – operated pipette 100 - 1000µl (Transferpette – Brand - USA). 110
The HPLC system consisted of a UV/VIS detector (Waters LC Module I - USA), a HPLC 111
auto sampler (Waters model 717 Plus - USA), and two pumps (Waters model 510 and 590 - 112
USA). The HPLC column used was Zorbax SB- C18, 5 µm 4.6 × 250 mm, 5µ (Agilent 113
Technologies - USA). 114
Chemicals and reagents: 115
Marker residue for sulfonamides is represented by parent drugs. 116
Standards used are: sulfadimethoxine (Sigma Chemical Co – USA), sulfamethoxazole 117
(Sigma Chemical Co – USA), sulfaquinoxaline (EDQM), and sulfadiazine (EDQM). 118
Reagents: Acetonitrile (Lab-Scan - Poland), methanol (Merck, Germany), n-hexane (Fluka- 119
Switzerland), di-natriumhydrogenphosphat (Merck, Germany), dichloromethane (Chimactiv 120
– Romania), acetone (Chimactiv - Romania) and N – dymethilformamide (Fisher Scientific- 121
UK). All reagents were HPLC grade. 122
Preparation of standard solutions: 123
Stock standard solutions were prepared by dissolving 100 mg of each SA standard with 100 124
mL of N-dimethylformamide separately (1mg ml-1). Mix standard solution was prepared by 125
combining 1 mL of each stock standard solution and was made up to 50mL with 50% 126
methanol in di-natrium hydrogen phosphate solution 6g/1000ml. Working mix standard 127
solution at a concentration of 0.1 – 2µg ml-1 was prepared by diluting the mix standard 128
solution with mobile phase. 129
Tissue samples: 130
Blank matrix comes from previously unmedicated chicken, which were provided by the 131
Biobase S.N. Pasteur Institute, Bucharest, Romania – Gnotobiology Laboratory and 132
Experimental Testing for chickens and turkeys. 133
Incurred samples come from medicated chicken, under normal farm condition, which were 134
provided by the Biobase S.N. Pasteur Institute, Bucharest, Romania – Gnotobiology 135
Laboratory and Experimental Testing for chickens and turkeys. 136
Page 5 of 25
http://mc.manuscriptcentral.com/tfac Email: [email protected]
Food Additives and Contaminants
123456789101112131415161718192021222324252627282930313233343536373839404142434445464748495051525354555657585960
For Peer Review O
nly
5
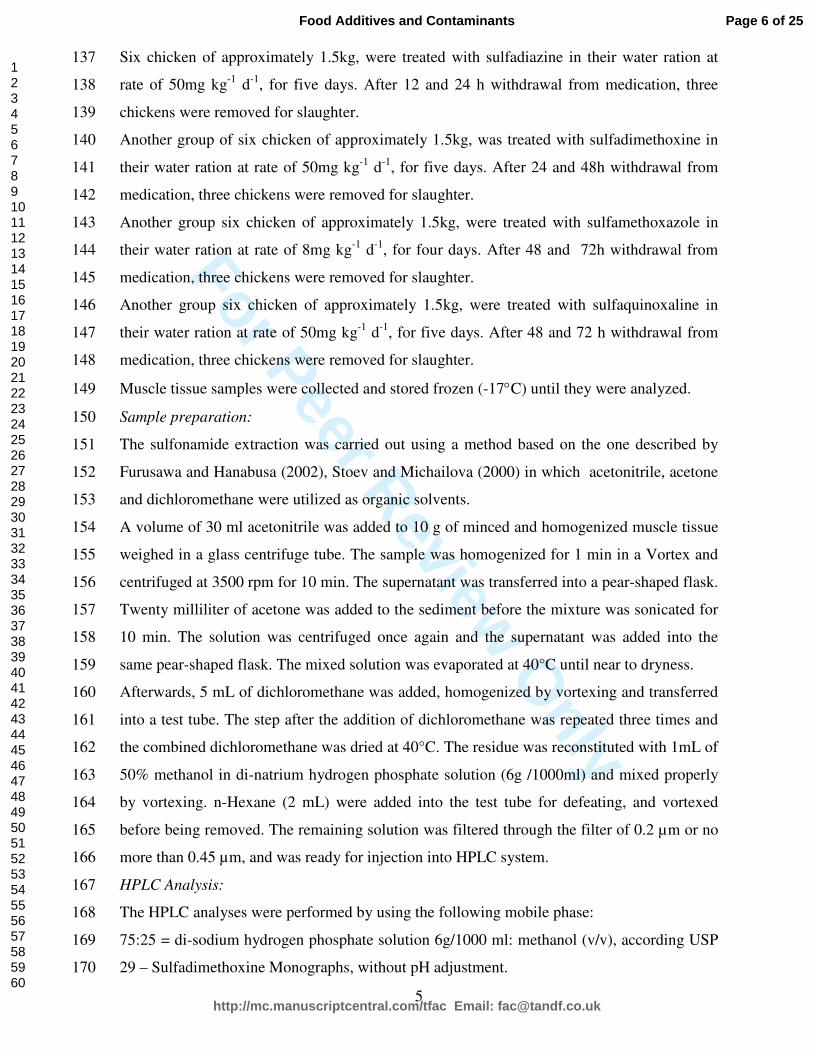
Six chicken of approximately 1.5kg, were treated with sulfadiazine in their water ration at 137
rate of 50mg kg-1 d-1, for five days. After 12 and 24 h withdrawal from medication, three 138
chickens were removed for slaughter. 139
Another group of six chicken of approximately 1.5kg, was treated with sulfadimethoxine in 140
their water ration at rate of 50mg kg-1 d-1, for five days. After 24 and 48h withdrawal from 141
medication, three chickens were removed for slaughter. 142
Another group six chicken of approximately 1.5kg, were treated with sulfamethoxazole in 143
their water ration at rate of 8mg kg-1 d-1, for four days. After 48 and 72h withdrawal from 144
medication, three chickens were removed for slaughter. 145
Another group six chicken of approximately 1.5kg, were treated with sulfaquinoxaline in 146
their water ration at rate of 50mg kg-1 d-1, for five days. After 48 and 72 h withdrawal from 147
medication, three chickens were removed for slaughter. 148
Muscle tissue samples were collected and stored frozen (-17°C) until they were analyzed. 149
Sample preparation: 150
The sulfonamide extraction was carried out using a method based on the one described by 151
Furusawa and Hanabusa (2002), Stoev and Michailova (2000) in which acetonitrile, acetone 152
and dichloromethane were utilized as organic solvents. 153
A volume of 30 ml acetonitrile was added to 10 g of minced and homogenized muscle tissue 154
weighed in a glass centrifuge tube. The sample was homogenized for 1 min in a Vortex and 155
centrifuged at 3500 rpm for 10 min. The supernatant was transferred into a pear-shaped flask. 156
Twenty milliliter of acetone was added to the sediment before the mixture was sonicated for 157
10 min. The solution was centrifuged once again and the supernatant was added into the 158
same pear-shaped flask. The mixed solution was evaporated at 40°C until near to dryness. 159
Afterwards, 5 mL of dichloromethane was added, homogenized by vortexing and transferred 160
into a test tube. The step after the addition of dichloromethane was repeated three times and 161
the combined dichloromethane was dried at 40°C. The residue was reconstituted with 1mL of 162
50% methanol in di-natrium hydrogen phosphate solution (6g /1000ml) and mixed properly 163
by vortexing. n-Hexane (2 mL) were added into the test tube for defeating, and vortexed 164
before being removed. The remaining solution was filtered through the filter of 0.2 µm or no 165
more than 0.45 µm, and was ready for injection into HPLC system. 166
HPLC Analysis: 167
The HPLC analyses were performed by using the following mobile phase: 168
75:25 = di-sodium hydrogen phosphate solution 6g/1000 ml: methanol (v/v), according USP 169
29 – Sulfadimethoxine Monographs, without pH adjustment. 170
Page 6 of 25
http://mc.manuscriptcentral.com/tfac Email: [email protected]
Food Additives and Contaminants
123456789101112131415161718192021222324252627282930313233343536373839404142434445464748495051525354555657585960

For Peer Review O
nly
6
The flow rate: 1 mL/min. 171
Injection volume: 20µl 172
Detection was performed at 245 nm, in order to achieve a greater sensitivity than in the 173
method described by Ismail and co-workers (2008), which used 266 nm. 174
Run time: 10min 175
Calculation formula: 176
µg kg-1 sulfonamide = C x 100 x 100 x R-1 177
C = measured concentration (µg kg-1) 178
R = recovery (%) 179
LC–MS/MS 180
Identification and quantification of analytes were carried out on Waters 2695 (USA) liquid 181
chromatography, equipped with a MS–MS Quatro Micro (Micromass, USA) tandem mass 182
spectrophotometer. The X Bridge Shield RP18 column, 150mm x 2.1, 3.5µm, (Waters, USA) 183
was used for separation. The flow rate was 20µl/min, and the temperature of the column was 184
40 ºC. Mobile phase was methanol (B) and a 0.1% formic acid solution (A) folowing 185
gradient 186
Time A B 187
0 95 5 188
1.5 95 5 189
10 60 40 190
15 10 90 191
15.5 95 5 192
20 95 5 193
MS/MS conditions: the mass spectrophotometer was operated in electrospray positive ion 194
mode. The capillary voltage was held at 4.5KV, cone voltage, at 30V and extractor voltage, 195
at 2V. The source temperature was 100º C, desolvation gas (nitrogen) temperature, 350 ºC 196
and flow: 350l/h. Collision gas (argon) pressure: 3x10⁻³mbar. Data acquisition was made in 197
multiple reaction monitoring mode. The transition of two common product ions were 198
monitored. 199
Page 7 of 25
http://mc.manuscriptcentral.com/tfac Email: [email protected]
Food Additives and Contaminants
123456789101112131415161718192021222324252627282930313233343536373839404142434445464748495051525354555657585960
For Peer Review O
nly
7
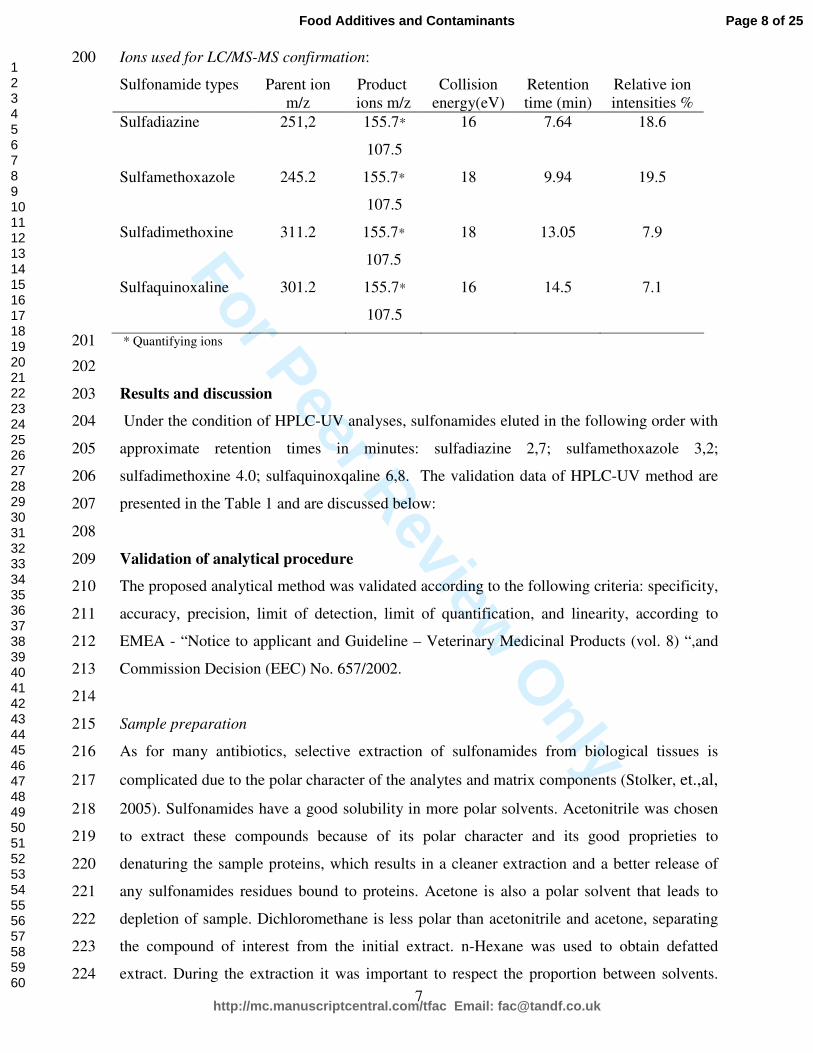
Ions used for LC/MS-MS confirmation: 200
Sulfonamide types Parent ion m/z
Product ions m/z
Collision energy(eV)
Retention time (min)
Relative ion intensities %
Sulfadiazine 251,2
155.7*
107.5
16 7.64 18.6
Sulfamethoxazole 245.2
155.7*
107.5
18 9.94 19.5
Sulfadimethoxine 311.2
155.7*
107.5
18 13.05 7.9
Sulfaquinoxaline 301.2
155.7*
107.5
16 14.5 7.1
* Quantifying ions 201
202
Results and discussion 203
Under the condition of HPLC-UV analyses, sulfonamides eluted in the following order with 204
approximate retention times in minutes: sulfadiazine 2,7; sulfamethoxazole 3,2; 205
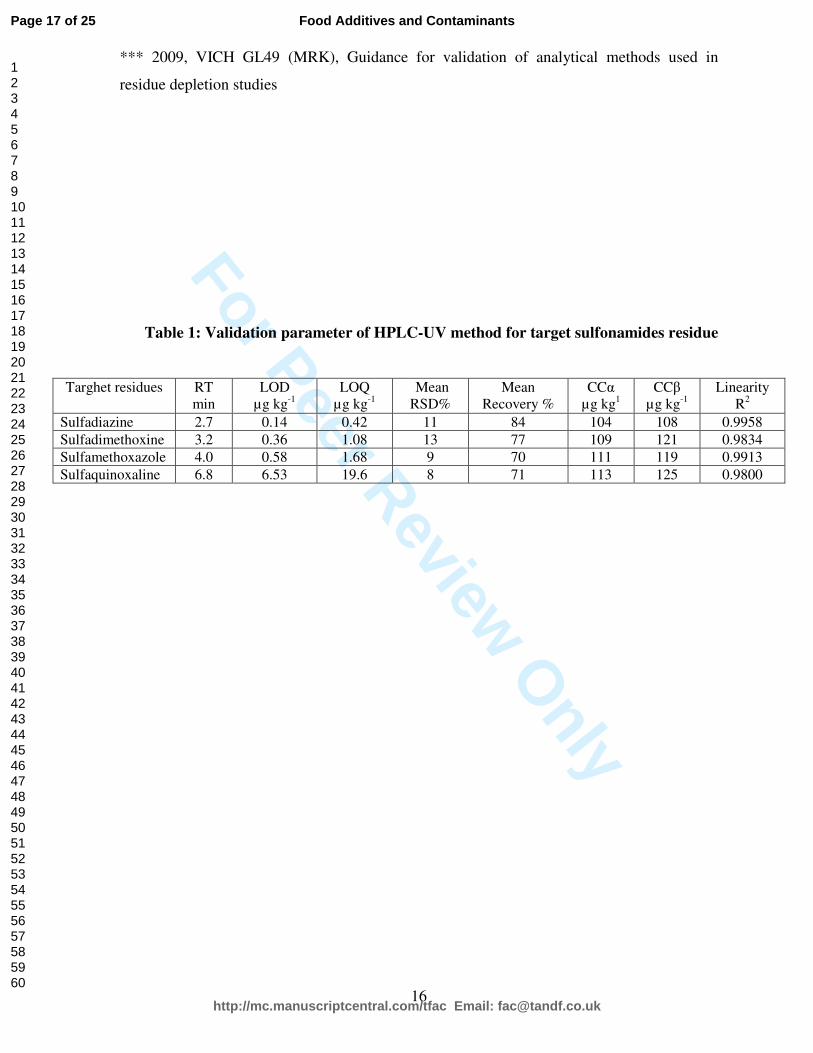
sulfadimethoxine 4.0; sulfaquinoxqaline 6,8. The validation data of HPLC-UV method are 206
presented in the Table 1 and are discussed below: 207
208
Validation of analytical procedure 209
The proposed analytical method was validated according to the following criteria: specificity, 210
accuracy, precision, limit of detection, limit of quantification, and linearity, according to 211
EMEA - “Notice to applicant and Guideline – Veterinary Medicinal Products (vol. 8) “,and 212
Commission Decision (EEC) No. 657/2002. 213
214
Sample preparation 215
As for many antibiotics, selective extraction of sulfonamides from biological tissues is 216
complicated due to the polar character of the analytes and matrix components (Stolker, et.,al, 217
2005). Sulfonamides have a good solubility in more polar solvents. Acetonitrile was chosen 218
to extract these compounds because of its polar character and its good proprieties to 219
denaturing the sample proteins, which results in a cleaner extraction and a better release of 220
any sulfonamides residues bound to proteins. Acetone is also a polar solvent that leads to 221
depletion of sample. Dichloromethane is less polar than acetonitrile and acetone, separating 222
the compound of interest from the initial extract. n-Hexane was used to obtain defatted 223
extract. During the extraction it was important to respect the proportion between solvents. 224
Page 8 of 25
http://mc.manuscriptcentral.com/tfac Email: [email protected]
Food Additives and Contaminants
123456789101112131415161718192021222324252627282930313233343536373839404142434445464748495051525354555657585960

For Peer Review O
nly
8
Specificity and recovery results were in acceptable limits, which show the extraction 225
efficiency and a good removal of matrix interference. The detection limit was also 226
comparable with the other reported method. 227
228
Calibration curves of each component were established by plotting the peak area of each 229
active component against its associated concentrations. The concentration used for each drug 230
ranged from 30 µg kg-1 to150µg kg-1(0.5MRL – 1.5MRL), at five levels, according to the 231
recommendation made by the Commission Decision No. 657/2002. 232
A statistic linear regression was performed for each component. For the tested domain, 233
calibration curves were linear with very good correlation coefficients (R2 >0.99). 234
235
Specificity was study by analyzing blank samples and spiked samples at relevant 236
concentration (0.5, 1, 1.5 x MRL) and checking any interferences in the region of interest. 237
The peak of each analite width at half-maximum height was within the 90-110% range of the 238
standard width, and the retention times were identical within a margin of 5 %. No interfering 239
peaks from endogenous compounds were found in the retention time of the target 240
sulfonamides. 241
242
Repeatability: 3 test samples were spiked at analyte levels, which encompass 0.5x and 2x the 243
MRL. Then, 6 test portions of each level were taken, analyzed and the residue concentration 244
of each test portion was determined. At each spiked concentration, the CV (Srel = S x 100 / 245
Mean) was calculated. The relative standard deviations (RSDs) of the sulfonamides for six 246
measurements at 50 µg kg-1, 100 µg kg-1 and 150 µg kg-1 were from 7.8 to 13.5%. These 247
values are within the criteria stipulated for residue analysis by the Commission Decision No. 248
657/2002: RSD <20%. 249
250
The accuracy (recovery) was determined by recovery experiments using blank matrices. 251
- 18 aliquots of a blank material was spiked (six aliquots) at each of 0.5, 1 and 1.5 x MRL 252
- the samples were analyzed and the sulfonamides concentration present in each sample was 253
calculated; 254
- using the equation below, the recovery for each sample was calculated. 255
% Recovery (R) = 100 × measured content / spiked level 256
- it was calculated the mean recovery and CV from the six results at each level. 257
Page 9 of 25
http://mc.manuscriptcentral.com/tfac Email: [email protected]
Food Additives and Contaminants
123456789101112131415161718192021222324252627282930313233343536373839404142434445464748495051525354555657585960
For Peer Review O
nly
9
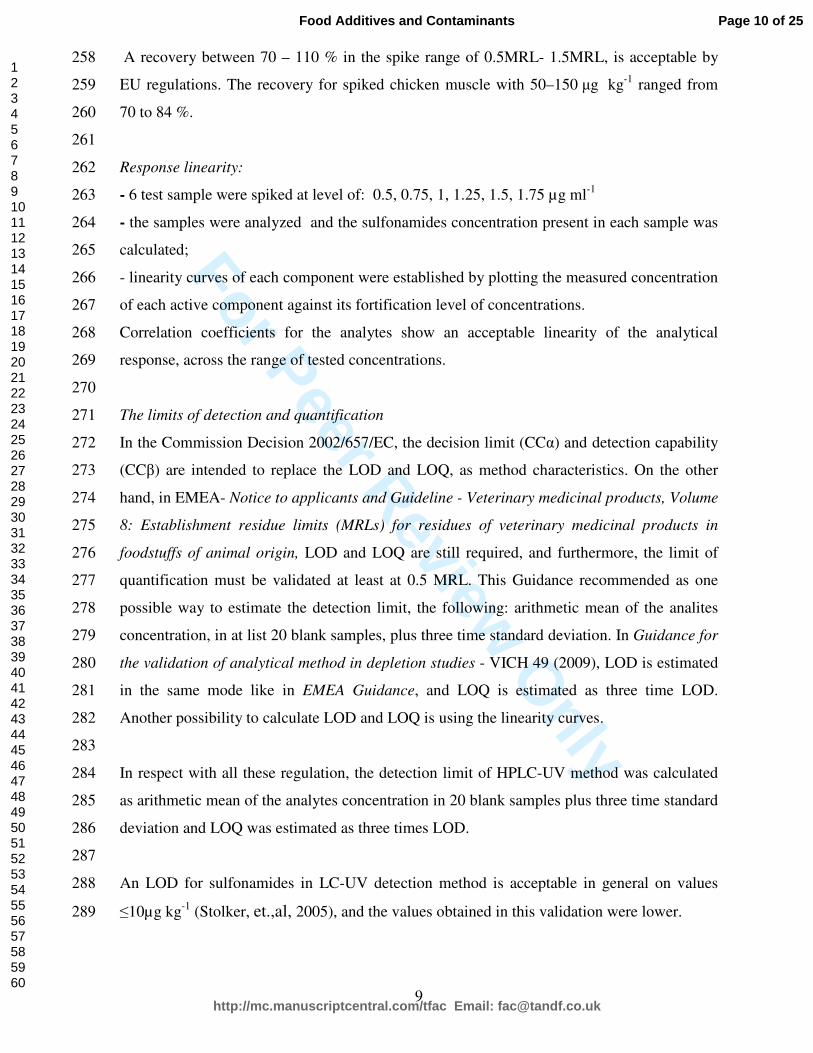
A recovery between 70 – 110 % in the spike range of 0.5MRL- 1.5MRL, is acceptable by 258
EU regulations. The recovery for spiked chicken muscle with 50–150 µg kg-1 ranged from 259
70 to 84 %. 260
261
Response linearity: 262
- 6 test sample were spiked at level of: 0.5, 0.75, 1, 1.25, 1.5, 1.75 µg ml-1 263
- the samples were analyzed and the sulfonamides concentration present in each sample was 264
calculated; 265
- linearity curves of each component were established by plotting the measured concentration 266
of each active component against its fortification level of concentrations. 267
Correlation coefficients for the analytes show an acceptable linearity of the analytical 268
response, across the range of tested concentrations. 269
270
The limits of detection and quantification 271
In the Commission Decision 2002/657/EC, the decision limit (CCα) and detection capability 272
(CCβ) are intended to replace the LOD and LOQ, as method characteristics. On the other 273
hand, in EMEA- Notice to applicants and Guideline - Veterinary medicinal products, Volume 274
8: Establishment residue limits (MRLs) for residues of veterinary medicinal products in 275
foodstuffs of animal origin, LOD and LOQ are still required, and furthermore, the limit of 276
quantification must be validated at least at 0.5 MRL. This Guidance recommended as one 277
possible way to estimate the detection limit, the following: arithmetic mean of the analites 278
concentration, in at list 20 blank samples, plus three time standard deviation. In Guidance for 279
the validation of analytical method in depletion studies - VICH 49 (2009), LOD is estimated 280
in the same mode like in EMEA Guidance, and LOQ is estimated as three time LOD. 281
Another possibility to calculate LOD and LOQ is using the linearity curves. 282
283
In respect with all these regulation, the detection limit of HPLC-UV method was calculated 284
as arithmetic mean of the analytes concentration in 20 blank samples plus three time standard 285
deviation and LOQ was estimated as three times LOD. 286
287
An LOD for sulfonamides in LC-UV detection method is acceptable in general on values 288
≤10µg kg-1 (Stolker, et.,al, 2005), and the values obtained in this validation were lower. 289
Page 10 of 25
http://mc.manuscriptcentral.com/tfac Email: [email protected]
Food Additives and Contaminants
123456789101112131415161718192021222324252627282930313233343536373839404142434445464748495051525354555657585960

For Peer Review O
nly
10
The limits of quantification (LOQ) for the three sulfonamides were in the range of 0.4-1.7 µg 290
kg-1. Sulfaquinoxaline LOQ is 19.6 µg kg-1, still below 0.5 MRLs, and for all analytes LOQ 291
was significant lower then CCβ, reducing the false negative result rate. 292
293
Decision limit (CCα) and detection capability (CCβ) 294
In this validation CCα and CCβ was established considering the permitted limit, in that case 295
MRL, in respect with Commission decision 2002/657/EC, by analyzing 20 blank samples 296
fortified with the analytes at the permitted limit, and calculating the decision limit (CCα) as 297
arithmetic mean of analyte concentration at MRL level plus 1.64 times the standard deviation 298
of repeatability (α = 5%), and detection capability (CCβ), as arithmetic mean of analyte 299
concentration at CCα level plus 1.64 times the standard deviation of repeatability (β= 5 %) 300
Decision limits (CCα) and detection capabilities (CCβ) were in the range of 104.64 – 112.95 301
µg kg-1 and 108.5 - 125 µg kg-1, respectively. 302
303
LC–MS/MS confirmation 304
A method for measuring residue level by liquid chromatography–tandem mass spectrometry 305
(LC–MS/MS) was applied, using the same extraction procedure, as confirmatory method. 306
The confirmatory analysis is based on MS–MS monitoring of two product ion and a 307
precursor ion, which provide four identification points (IPs). For sulfonamides, listed in 308
Group B (Council Directive 96/23/EC), a minimum three IPs are required. Relative retention 309
time of analytes was within the tolerance of ±2.5%. Relative ion intensities for fortified 310
samples correspond to those of the calibration standards, in the permitted tolerance. 311
312
The residue was reconstituted with 1mL of 50% methanol in 0.1% formic acid solution. For 313
determination, analytes were separated by a different gradient LC procedure, ionized by 314
electrospray ionization (ESI), and detected by MS–MS with a triple quadrupole mass 315
spectrometer. 316
317
MS parameters were optimized by direct flow infusion of each standard. The calibration 318
curves show a good linearity in the concentration range of 0.5 –10 µg/kg, for each analyte, 319
with correlation coefficients between 0.9988 – 0.9996.The chromatograms of a spiked 320
sample contain 10 µg/kg of each compound is shown in Figure 1. 321
322
The LC-MS/MS method was used for verify the identity of marker residue and to ensure the 323
Page 11 of 25
http://mc.manuscriptcentral.com/tfac Email: [email protected]
Food Additives and Contaminants
123456789101112131415161718192021222324252627282930313233343536373839404142434445464748495051525354555657585960
For Peer Review O
nly
11
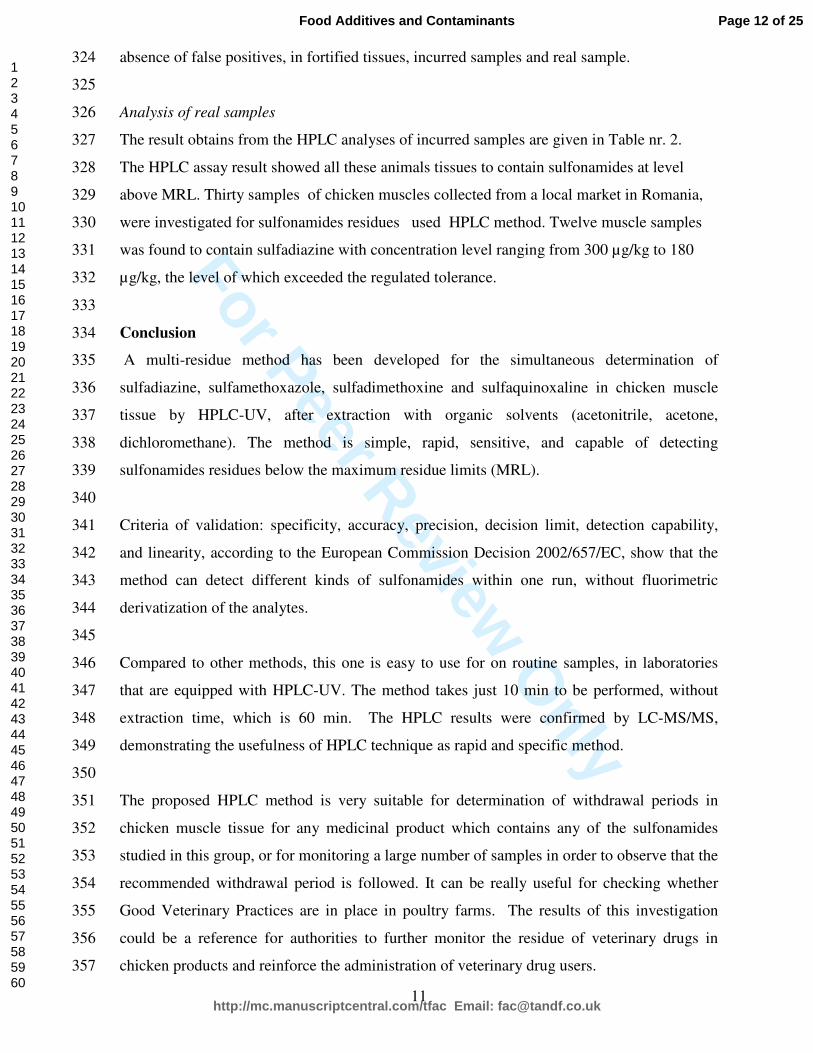
absence of false positives, in fortified tissues, incurred samples and real sample. 324
325
Analysis of real samples 326
The result obtains from the HPLC analyses of incurred samples are given in Table nr. 2. 327
The HPLC assay result showed all these animals tissues to contain sulfonamides at level 328
above MRL. Thirty samples of chicken muscles collected from a local market in Romania, 329
were investigated for sulfonamides residues used HPLC method. Twelve muscle samples 330
was found to contain sulfadiazine with concentration level ranging from 300 µg/kg to 180 331
µg/kg, the level of which exceeded the regulated tolerance. 332
333
Conclusion 334
A multi-residue method has been developed for the simultaneous determination of 335
sulfadiazine, sulfamethoxazole, sulfadimethoxine and sulfaquinoxaline in chicken muscle 336
tissue by HPLC-UV, after extraction with organic solvents (acetonitrile, acetone, 337
dichloromethane). The method is simple, rapid, sensitive, and capable of detecting 338
sulfonamides residues below the maximum residue limits (MRL). 339
340
Criteria of validation: specificity, accuracy, precision, decision limit, detection capability, 341
and linearity, according to the European Commission Decision 2002/657/EC, show that the 342
method can detect different kinds of sulfonamides within one run, without fluorimetric 343
derivatization of the analytes. 344
345
Compared to other methods, this one is easy to use for on routine samples, in laboratories 346
that are equipped with HPLC-UV. The method takes just 10 min to be performed, without 347
extraction time, which is 60 min. The HPLC results were confirmed by LC-MS/MS, 348
demonstrating the usefulness of HPLC technique as rapid and specific method. 349
350
The proposed HPLC method is very suitable for determination of withdrawal periods in 351
chicken muscle tissue for any medicinal product which contains any of the sulfonamides 352
studied in this group, or for monitoring a large number of samples in order to observe that the 353
recommended withdrawal period is followed. It can be really useful for checking whether 354
Good Veterinary Practices are in place in poultry farms. The results of this investigation 355
could be a reference for authorities to further monitor the residue of veterinary drugs in 356
chicken products and reinforce the administration of veterinary drug users. 357
Page 12 of 25
http://mc.manuscriptcentral.com/tfac Email: [email protected]
Food Additives and Contaminants
123456789101112131415161718192021222324252627282930313233343536373839404142434445464748495051525354555657585960

For Peer Review O
nly
12
358
Acknowledgements 359
The authors are grateful to the Pasteur Institute Bucharest, Romania – Gnotobiology 360
Laboratory and Experimental Testing for chickens and turkeys, and Department of Research, 361
Development, Diagnostic and Quality Control, for providing all facilities to carry out the 362
present research. The work of Carmen Lidia Chitescu was supported by the Project SOP 363
HRD – EFICIENT 61445. 364
365
366
References 367
368
Babić, S., Ašperger, D., Mutavdžić, D., Horvat, A., J., M., Kaštelan-Macan, M., 2005. 369
Determination of sulfonamides and trimethoprim in spiked water samples by solid-phase 370
extraction and thin-layer chromatography . JPC-Journal of Planar Chromatography Modern 371
TLC. (18): 423-426. 372
373
Bele, C. , Matea, C., T. , Dulf, F., Miclean , M. 2007. Determination of six sulfonamides in 374
pork and beef meat by a new solid phase extraction and HPLC - UV for detection. Bulletin 375
USAMV-CN, 64/2007 (1-2). 376
Braham, R., Black,W.,D., Claxton, J., Yee, A.,J., 2001 A Rapid Assay for Detecting 377
Sulfonamides in Tissues of Slaughtered Animals. Journal of Food Protection (64): 1565-378
1576. 379
Cochrane, B., Doyle, E.M., Steinhart, C.E., 1995, Food Safety, New York USA, p. 247. 380
381
Furusawa, N., Hanabusa, R. 2002. Cooking effects on sulfonamide residues in chicken thigh 382
muscle. FoodRes. Int. 35: 37-42. 383
384
Furusawa, N., Kishida, K. 2001. High- performance chromatographic procedure for routine 385
residue monitoring of seven sulfonamides in milk. J. Anal.Chem. 371: 1031-1033. 386
387
Gehring, T.A., Griffin, B., Williams, R., Geiseker, C., Rushing, L. G., Siitonen, P. H.. 2006. 388
Multiresidue determination of sulfonamides in edible catfish, shrimp and salmon tissues by 389
Page 13 of 25
http://mc.manuscriptcentral.com/tfac Email: [email protected]
Food Additives and Contaminants
123456789101112131415161718192021222324252627282930313233343536373839404142434445464748495051525354555657585960
For Peer Review O
nly
13
high-performance liquid chromatography with postcolumn derivatization and fluorescence 390
detection, Journal of Chromatography B, 840:132–138. 391
392
Gratacós-Cubarsí, M., Castellari, M., Valero, A., García-Regueiro, J.A. 2006. A simplified 393
LC–DAD method with an RP-C12 column for routine monitoring of three sulfonamides in 394
edible calf and pig tissue. Analytical and Bioanalytical Chemistry, Volume 385, Number 7 / 395
August, 2006, pages 1218-1224. 396
397
Hela, W., Brandtner, M., Widek, R., Schuh, R. 2003. Determination of sulfonamides in 398
animal tissues using cation exchange reversed phase sorbent for sample cleanup and HPLC-399
DAD for detection. Food Chem. 83: 601-608. 400
401
Ismail-Fitry, M. R., Jinap, S., Jamilah, B., Saleha A.A. 2008. Effect of Deep-Frying at 402
Different Temperature and Time on Sulfonamide Residues in Chicken Meat-Balls, Journal of 403
Food and Drug Analysis, 16(6): page 81-87. 404
405
Jung, B.S., Bark, J.,J., Gum, M., R., Kim, I., K., Park, B., O., Han, J., H. 2004. Simultaneous 406
analysis of sulfonamides in beef and pork by height performance liquid chromatography and 407
electro spray ionization mass spectrofotometry. Korean J Vet Serv, 27(1): 17 - 29. 408
409
Kao, Y. A., Chang, M. H., Cheng, C. C. and Chou, S. S. 2001. Multiresidue determination of 410
veterinary drugs in chicken and swine muscles by high performance liquid chromatography. 411
J. Food Drug Anal. 9: 84-95. 412
413
Kan. C., A. and Petz. M. 2000. Residues of veterinary drugs in eggs and their distribution 414
between yolk and white. J. Agric. Food Chem. 48: 6397-6403. 415
416
Kishda, K., Furusawa, N., 2001. matrix solid-phase dispersion extraction and high 417
performance liquid chromatographie determination of residual sulfonamides in chicken. J. 418
Cromatogr. A. 937: 49-55. 419
420
Kishda, K., Furusawa, N., 2002 Transfer and distribution profiles of dietary sulphonamides 421
in the tissues of the laying hen. Food Additives & Contaminants: Part A, (19): 368 – 372. 422
423
Page 14 of 25
http://mc.manuscriptcentral.com/tfac Email: [email protected]
Food Additives and Contaminants
123456789101112131415161718192021222324252627282930313233343536373839404142434445464748495051525354555657585960
For Peer Review O
nly
14
Korpimäki, T., Brockmann, E.C., Kuronen, O., Saraste, M., Lamminmäki, U., Tuomola, M. , 424
2004. Engineering of a Broad Specificity Antibody for Simultaneous Detection of 13 425
Sulfonamides at the Maximum Residue Level, Journal of Agricultural and Food Chemistry, 426
52 (1): 40-47. 427
428
Maxwell, R., J., Lightfield, A., R., 1998. Multiresidue supercritical fluid extraction method 429
for the recovery at low ppb levels of three sulfonamides from fortified chicken liver. J. 430
Cromatogr. B Biomed SCI Appl. 715 ( 2 ): 431 - 435. 431
Montanaro, A., Sulfonamide allergy. 1998. Immunology and Allergy Clinics of North 432
America, Volume 18, Issue 4, Pages 843-850. 433
434
Peligrad A., 2010. Price, a criterion for acquisition of more and more important in times of 435
crises. Meat Factory, February 2010, nr 7. 436
437
Ploum, M.E.; Korpimaeki, T.; Haasnoot, W.; Kohen, F., 2005. Comparison of multi-438
sulfonamide biosensor immunoassays. Analytica Chimica Acta, (529), No. 1-2, p.115-122. 439
440
Salisbury, C.D.C., Sweet, J.C., Munro, R. 2004. Determination of Sulfonamide Residues in 441
the Tissues of Food Animals Using Automated Precolumn Derivatization and Liquid 442
Chromatography with Fluorescence Detection. Journal of AOAC international, 87(5):1264-443
1268. 444
445
Slatore, C. G., Tilles S. A... 2004. Sulfonamide hypersensitivity. Immunology and Allergy 446
Clinics of North America - Volume 24, Issue 3 (August 2004). 447
448
Stoev, G., Michailova, A. 2000. Quantitative determination of sulfonamide residues in foods 449
of animal origin by high-performance liquid chromatography with fluorescence detection, 450
Journal of Chromatography A, 871: 37-42. 451
Stolker A.A.M., Brinkman U.A.Th, 2005, Analytical strategies for residue analysis of 452
veterinary drugs and growth-promoting agents in food-producing animals — a review, 453
Journal of Chromatography A, 1067:15–53. 454
455
Szyman, A., Mickiewicz, A.2008. Determination of Sulfonamide Residues in Food by 456
Micellar Liquid Chromatography. Toxicology Mechanisms and Methods, 18:473–481. 457
Page 15 of 25
http://mc.manuscriptcentral.com/tfac Email: [email protected]
Food Additives and Contaminants
123456789101112131415161718192021222324252627282930313233343536373839404142434445464748495051525354555657585960
For Peer Review O
nly
15
458
Thomas, G., Millor, .R., Antis, P. 1998. Stability of sulfonamide antibiotics in spiked pig 459
liver tissue during frozen storage. Quality Assurance Study Report Series, Number 98-3. 460
461
Wang, S., Zhang1, H. Y., Wang1, L., Duan1, Z. J., Kennedy, I. 2006. Analysis of 462
sulphonamide residues in edible animal products: A review. Food Additives and 463
Contaminants, April 2006; 23(4): 362–384. 464
465
Zhang, H., Wang. L., Zhang, Y., Fang, G., Zheng, W., Wang, S. 2007. Development of an 466
Enzyme-Linked Immunosorbent Assay for Seven Sulfonamide Residues and Investigation of 467
Matrix Effects from Different Food Samples. J. Agric. Food Chem., 55 (6), pp 2079–2084 468
469
*** CAC/MRL 02-2006, Codex Alimentarius Commission - Maximum residue limits for 470
veterinary drugs in foods. 471
472
*** Commission Decision 2002/657/EC concerning the performance of analytical methods 473
and the interpretation of results. 474
475
*** Code of Federal Regulations. 1996. 21: 365. 476
477
*** European Union Regulation 1990. Establishment of Maximum Residue Levels of 478
Veterinary Medical Products in foodstuffs of animal origin. Council Regulation (EEC) No. 479
2377/90. Official Journal of the European Communities. No. L 224, Brussels, 1990, 1. 480
481
*** The rules governing medicinal products in the European Union October 2005, Volume 8 482
- Notice to applicants and Guideline - Veterinary medicinal products: Establishment residue 483
limits (MRLs) for residues of veterinary medicinal products in foodstuffs of animal origin. 484
485
*** USP 29 – Sulfadimethoxine Monographs, CNF24, Page 2024 486
487
*** 1996. COUNCIL DIRECTIVE 96/23/EC on measures to monitor certain substances and 488
residues thereof in live animals and animal products 489
490
Page 16 of 25
http://mc.manuscriptcentral.com/tfac Email: [email protected]
Food Additives and Contaminants
123456789101112131415161718192021222324252627282930313233343536373839404142434445464748495051525354555657585960
For Peer Review O
nly
16
*** 2009, VICH GL49 (MRK), Guidance for validation of analytical methods used in
residue depletion studies
Table 1: Validation parameter of HPLC-UV method for target sulfonamides residue
Targhet residues RT min
LOD µg kg-1
LOQ µg kg-1
Mean RSD%
Mean Recovery %
CCα µg kg1
CCβ µg kg-1
Linearity R2
Sulfadiazine 2.7 0.14 0.42 11 84 104 108 0.9958
Sulfadimethoxine 3.2 0.36 1.08 13 77 109 121 0.9834
Sulfamethoxazole 4.0 0.58 1.68 9 70 111 119 0.9913
Sulfaquinoxaline 6.8 6.53 19.6 8 71 113 125 0.9800
Page 17 of 25
http://mc.manuscriptcentral.com/tfac Email: [email protected]
Food Additives and Contaminants
123456789101112131415161718192021222324252627282930313233343536373839404142434445464748495051525354555657585960

For Peer Review O
nly
17
Table 2: Result for incurred samples
Sulfonamide types
Withdrawal time (h)
HPLC assay
(µg kg-1)
305
257
12
312
124
97
Sulfadiazine
24
184
547
438
48
470
210
185
Sulfaquinoxaline
72
162
328
456
24
412
115
205
Sulfadimethoxine
48
156
465
305
48
375
157
186
Sulfamethoxazole
72
255
Page 18 of 25
http://mc.manuscriptcentral.com/tfac Email: [email protected]
Food Additives and Contaminants
123456789101112131415161718192021222324252627282930313233343536373839404142434445464748495051525354555657585960

For Peer Review O
nly
18
Figure caption
Figure 1. The chromatograms of spiked samples contain 0.1 µg/ml (10 µg/kg) of each
compound. The extracted ions are from top to bottom: sulfadiazine m/z 251.2 →155.7,
251.2 →107.5, Rt =7.64; sulfamethoxazole m/z 254.2 → 155.7, 254.2 → 107.5 , Rt =9.94;
sulfadimethoxine m/z 311.2 → 155.7; 311.2 → 107.5 Rt =13.05 and sulfaquinoxaline m/z
301.2 → 155.7, 301.2 → 107.5, Rt = 14.50.
Page 19 of 25
http://mc.manuscriptcentral.com/tfac Email: [email protected]
Food Additives and Contaminants
123456789101112131415161718192021222324252627282930313233343536373839404142434445464748495051525354555657585960

For Peer Review O
nly
19
Figure1
Page 20 of 25
http://mc.manuscriptcentral.com/tfac Email: [email protected]
Food Additives and Contaminants
123456789101112131415161718192021222324252627282930313233343536373839404142434445464748495051525354555657585960

For Peer Review O
nly
20
Page 21 of 25
http://mc.manuscriptcentral.com/tfac Email: [email protected]
Food Additives and Contaminants
123456789101112131415161718192021222324252627282930313233343536373839404142434445464748495051525354555657585960

For Peer Review O
nly
21
Page 22 of 25
http://mc.manuscriptcentral.com/tfac Email: [email protected]
Food Additives and Contaminants
123456789101112131415161718192021222324252627282930313233343536373839404142434445464748495051525354555657585960

For Peer Review O
nly
22
Page 23 of 25
http://mc.manuscriptcentral.com/tfac Email: [email protected]
Food Additives and Contaminants
123456789101112131415161718192021222324252627282930313233343536373839404142434445464748495051525354555657585960

For Peer Review O
nly
23
Page 24 of 25
http://mc.manuscriptcentral.com/tfac Email: [email protected]
Food Additives and Contaminants
123456789101112131415161718192021222324252627282930313233343536373839404142434445464748495051525354555657585960

For Peer Review O
nly
24
Page 25 of 25
http://mc.manuscriptcentral.com/tfac Email: [email protected]
Food Additives and Contaminants
123456789101112131415161718192021222324252627282930313233343536373839404142434445464748495051525354555657585960
For Peer Review O
nly
25
Page 26 of 25
http://mc.manuscriptcentral.com/tfac Email: [email protected]
Food Additives and Contaminants
123456789101112131415161718192021222324252627282930313233343536373839404142434445464748495051525354555657585960