simulation results from the santa cruz linear collider group
DESCRIPTION
Simulation Results from the Santa Cruz Linear Collider Group. Beijing Linear Collider Workshop Beijing, China February 4-8 2007 Bruce Schumm. Tracking Performance of an All-Silicon Tracker. - PowerPoint PPT PresentationTRANSCRIPT
Simulation Results from the Santa Cruz Linear Collider Group
Beijing Linear Collider WorkshopBeijing, ChinaFebruary 4-8 2007
Bruce Schumm

Tracking Performance of an All-Silicon Tracker
Thanks to Michael Young (UCSC Master’s student), Eric Wallace, Lori Stevens, and Tyler Rice (UCSC undergraduates)
Goals:
• Verify tracking efficiency for all-silicon tracking
• Verify track parameter resolution

TRACKING CODE
Available track reconstruction/fitting is VXDBasedReco, due to Nick Sinev (Oregon).
Start with segment from VXD Attach tracker hits (at least one hit needed to reduce bckgd)
Can be run with no hit smearing, gaussian smearing, or realistic CCD hit smearing (realistic strip smearing still under development).
NOTE: VXDBasedReco not yet available in new (LCIO) framework; these results are >1 year old!
Also: we use Wolfgang Walkowiak’s TrackEfficiencyDriver for the core of the tracking efficiency calculation.

EVENT/TRACK SELECTION
Choose qqbar events at Ecm= 500 GeV (dense jet cores)
Choose events/tracks that should be easily reconstructed (tracks curl up below p= 1 GeV):
Event Selection
|costhrust| < 0.5
Thrust Mag > 0.94
Track Selection
|costrack| < 0.5
p > 5 GeV/c

SOME PRELIMINARIES
1. Gaussian variable related to momentum resolution is curvature , inversely related to p and radius of curvature R according to
= 1/R = 0.003 * B(T) * (1/p)
2. Define as angle between track and jet core, where jet core angle is taken to be the thrust axis.
3. All fitting studies done without beam constraint

EFFICIENCIES FOR QQBAR EVENTS
Doesn’t look that spectacular; what might be going on here?
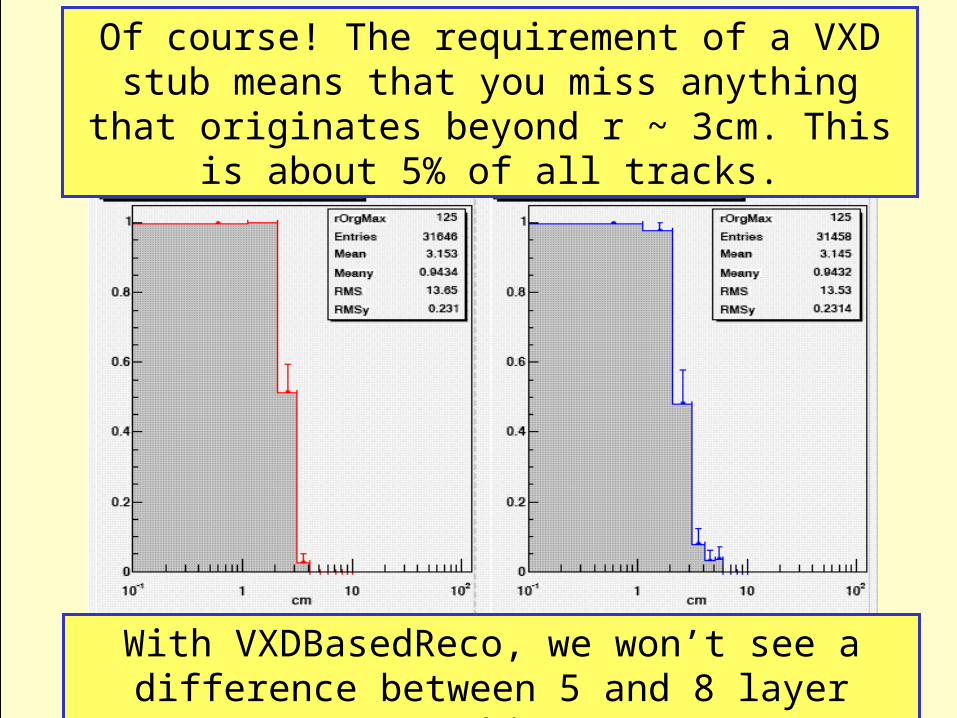
Of course! The requirement of a VXD stub means that you miss anything that originates beyond r ~ 3cm. This
is about 5% of all tracks.
With VXDBasedReco, we won’t see a difference between 5 and 8 layer tracking.
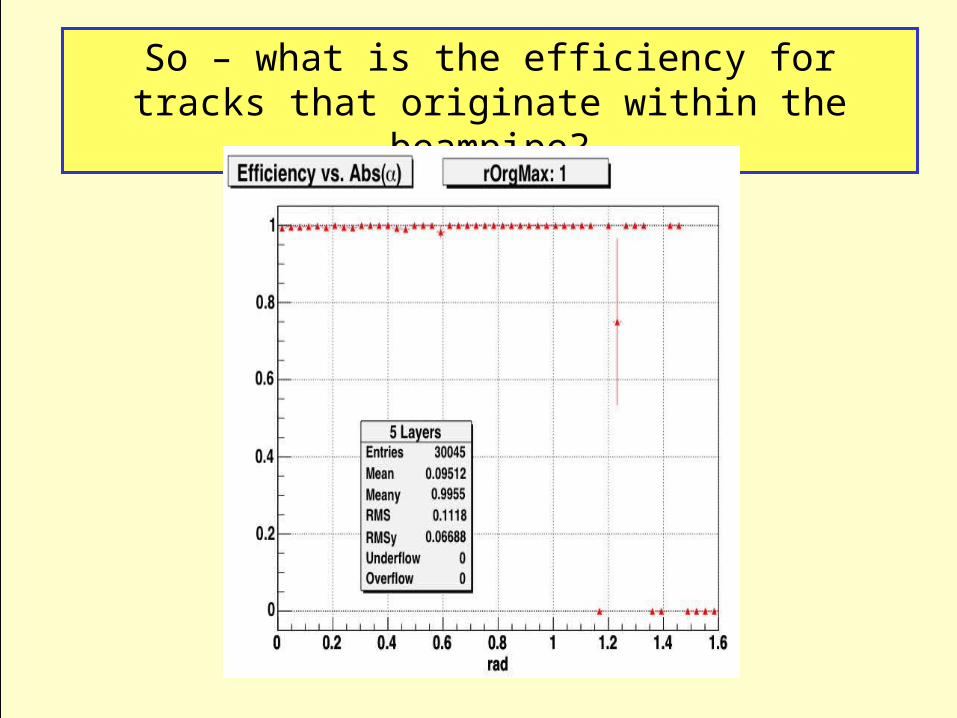
So – what is the efficiency for tracks that originate within the beampipe?

Efficiency Versus Transverse Momentum
Lose Track-ing Layer 3
Lose Track-ing Layer 2
Lose Track-ing Layer 1
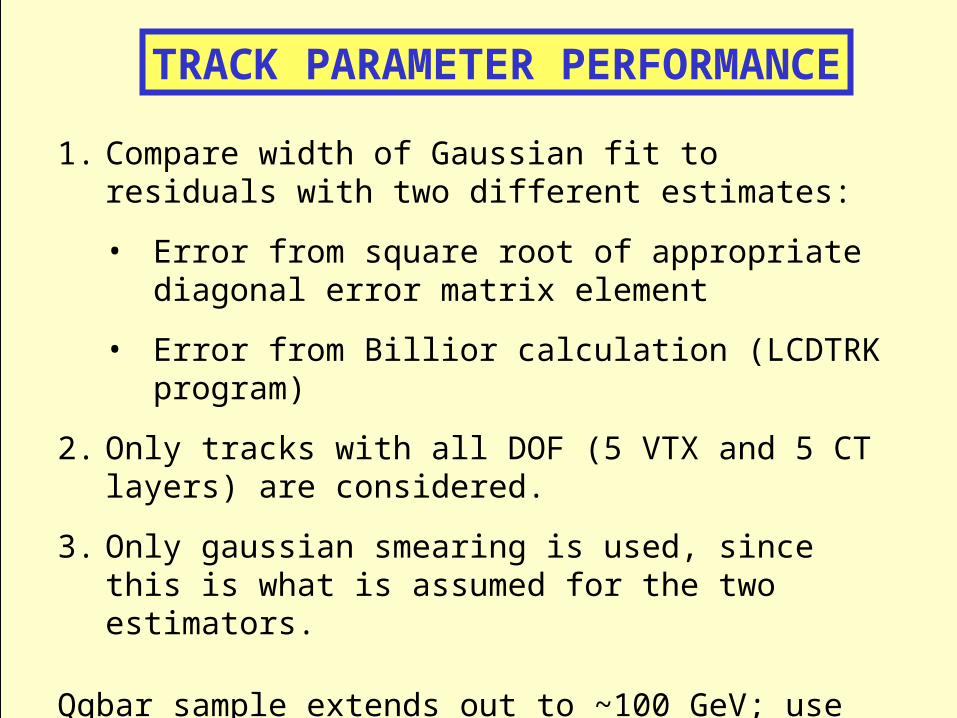
TRACK PARAMETER PERFORMANCE
1. Compare width of Gaussian fit to residuals with two different estimates:
• Error from square root of appropriate diagonal error matrix element
• Error from Billior calculation (LCDTRK program)
2. Only tracks with all DOF (5 VTX and 5 CT layers) are considered.
3. Only gaussian smearing is used, since this is what is assumed for the two estimators.
Qqbar sample extends out to ~100 GeV; use +- sample to get higher energy (200-250 GeV) bin.
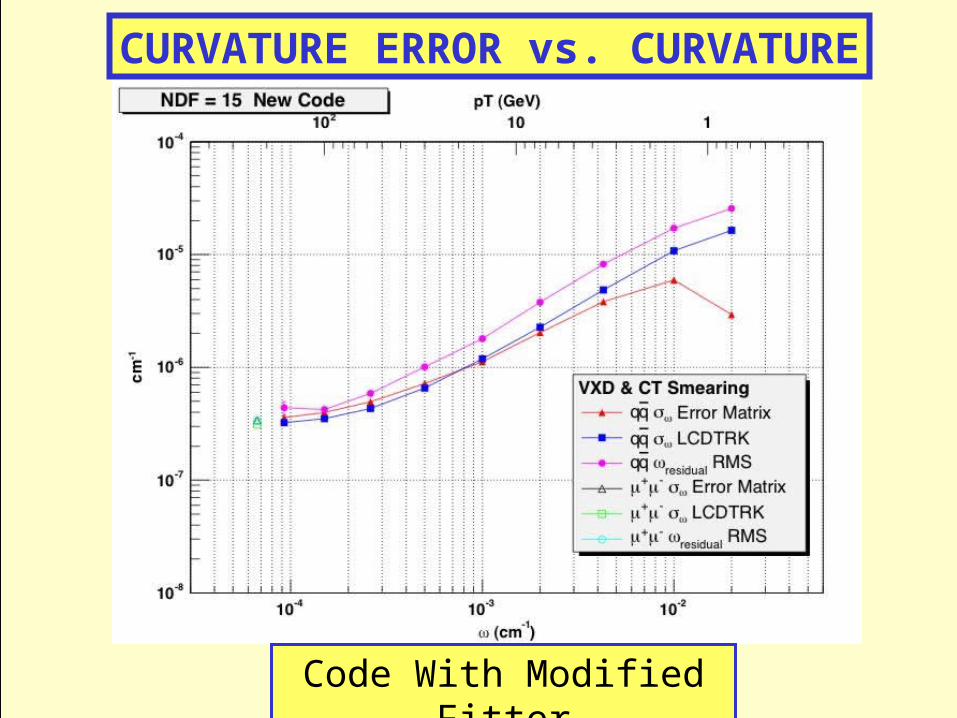
CURVATURE ERROR vs. CURVATURE
Code With Modified Fitter

RESULTS FOR (LOWEST BIN)
Residuals (Gaussian smear): = 3.40x10⁻⁷
Error Matrix: = 3.12x10⁻⁷
LCDTRK: = 3.26x10⁻⁷
Actual momentum resolution is about 9% worse than LCDTRK expectation
Residuals (realistic CCD): = 3.29x10⁻⁷
Apparently, “realistic” CCD resolution is better than assumed value of 5m
RECONSTRUCTING NON-PROMPT TRACKS
• Snowmass ‘05: Tim Nelson wrote axial-only algorithm to reconstruct tracks in absence of Vertex Detector
• UCSC idea: use this to “clean up” after vertex-stub based reconstruction (VXDBasedReco)
• About 5% of tracks originate beyond the VXD inner layers
• For now: study Z-pole qq events

Cheater• VXDBasedReco had not yet been ported to
org.lcsim framework, so…
• Wrote “cheater” to emulate perfectly efficient VXDBasedReco; assume anything that can be found by VXDBasedReco is found and the hits flagged as used
• Loops over TkrBarrHits and MCParticles, finds particles with rOrigin < 20mm and hits from those particles, removes them from collections
• rOrigin defined as sqrt(particle.getOriginX()^2 + particle.getOriginY()^2)

Total Momentum (GeV)
Number of hits per track
5 10 15 20 25 30 35 40 45 50 55 60 65 70 75 80 85 90 95 100 105 110 115 120 125 130 135 140 145 150
0.5
1.0
1.5
2.0
2.5
3.0
3.5
4.0
4.5
5.0
5.5
6.0
6.5
7.0
7.5
8.0
8.5
9.0
9.5
10.0
10.5
11.0
11.5
12.0
12.5
13.0
13.5
Entries : 6712 XMean : 4.5455 XRms : 11.547 YMean : 0.28509 YRms : 0.85769
Hit count vs. Total Momentum
Number of hits on track
Tra
ck M
omen
tum
What’s Left after “Cheating”? (258 events, no backgrounds)
“Good”
“Other” “Knock-on” (less than 10 MeV)“Looper”
Total hits: 30510 100%Good hits: 1754 5.7%Looper hits: 13546 44.4%Knock-on hits: 10821 35.5%Other hits: 4389 14.4%
Total tracks: 6712 100%Good tracks: 445 6.6%Looper tracks: 459 6.8%Knock-on tracks: 3303 49.2%Other tracks: 2505 37.3%

Radius of Origin (mm) Of Tracks
And where do these tracks originate?
Hit Count
0 200 400 600 800 1,000 1,200 1,4000
100
200
300
400
500
600
700
Entries : 2505 Mean : 863.47 Rms : 394.27
rOrg other tracks
Hit Count
0 200 400 600 800 1,000 1,2000
200
400
600
800
1,000
1,200
Entries : 3303 Mean : 935.72 Rms : 290.46
rOrg knock on tracks
Hit Count
Radius (mm)
0 200 400 600 800 1,000 1,2000
10
20
30
40
50
60
70
80
90
Entries : 459 Mean : 602.79 Rms : 358.51
rOrg looper tracks
Hit Count
Radius (mm)
0 200 400 600 800 1,000 1,200 1,40005
101520253035404550
Entries : 445 Mean : 369.71 Rms : 358.00
rOrg good tracks
“Good” “Looper”
“Knock-on” “Other”

AxialBarrelTrackFinder (Tim Nelson, SLAC)
• Loops over all hits in each layer, from the outside in, and finds 3 “seed” hits, one per layer
• Performs CircleFit (alogrithm provided by Norman Graf) to seed hits
• If successful, looks for hits on the remaining layers that can be added to seed fit, refitting after each hit added.
• If at least 4 hits on track, and Chi^2 of fit reasonable, creates track object and adds to collection
• Only two (half-barrel) segments in z for now

AxialBarrelTrackFinder PerformanceDefine “findable” particle as
• Pt > 0.75
• Radius of origin < 400 mm (require four layers)
• Path Length > 500 mm
• |cos| < 0.8
Number of “findable” particles per event

Particle is “found” if it is associated with a track with four or more hits, with at most one hits coming from a different track. All non-associated tracks with pt>0.75 and DCA < 100mm are labeled “fake”.
Particles Fakes
Not Found 175 (46.4%) --------
Found 4 Hits 88 (23.3%) 270
Found 5 Hits 114 (30.2%) 1
Total 377 (100%)
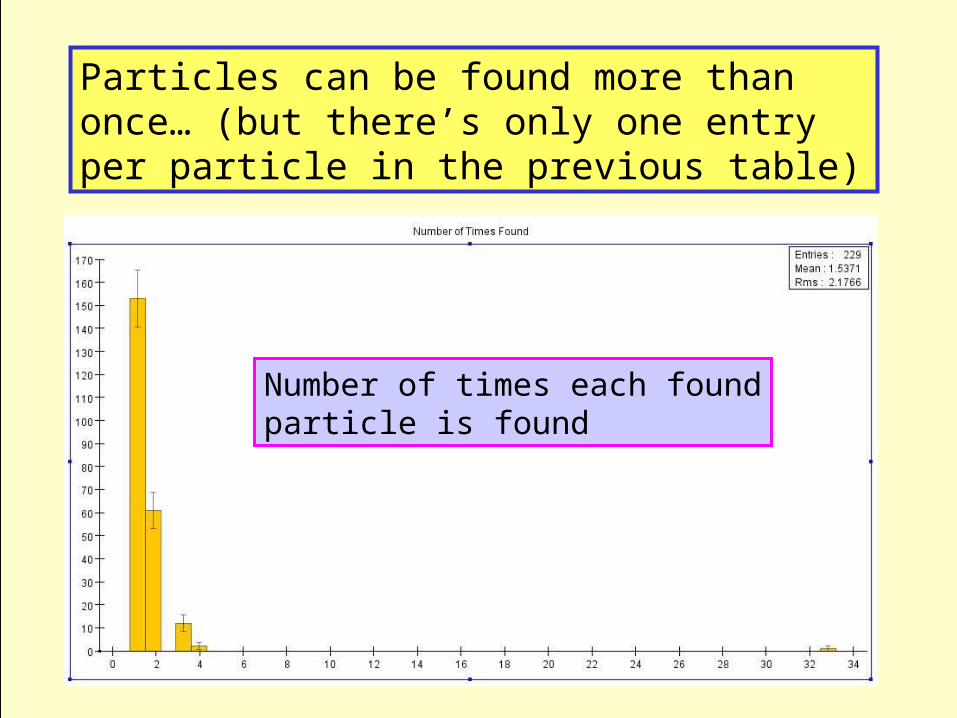
Particles can be found more than once… (but there’s only one entry per particle in the previous table)
Number of times each foundparticle is found
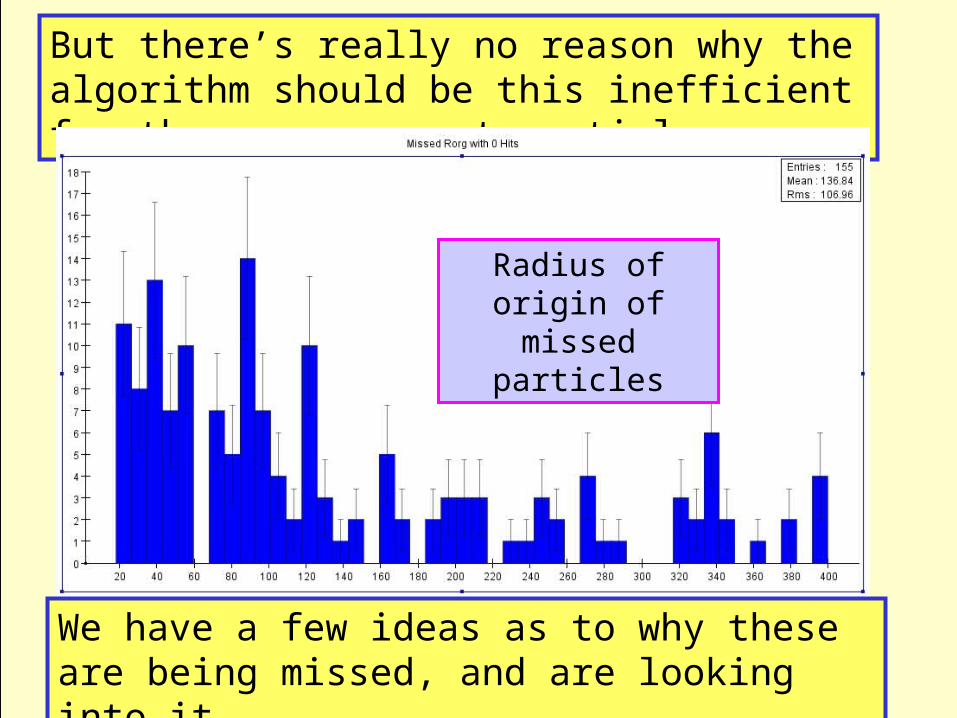
But there’s really no reason why the algorithm should be this inefficient for these non-prompt particles
Radius of origin of missed particles
We have a few ideas as to why these are being missed, and are looking into it.

CONCLUSIONS
Extending vertex detector stubs is very efficient for tracks above pt = 0.5 GeV/c and that originate within the second layer of the VXD
Most of the ~5% of tracks that originate outside the second layer of the VXD originate within the second layer of the central tracker, and may be findable.
We find them with about 30% efficiency now, but believe we can do better.
How much will Z segmentation help? How about tracking calorimeter stubs back in? (Kansas State’s GARFIELD package does this with ~30% efficiency)
RANDOM BACK-UP SLIDES

Two Areas of Study
Slepton Mass Reconstruction and Detector Resolution• Is the information on Slepton masses in the forward
region?• Can we detect it above backgrounds?• Are our detectors up to the task?
Track Reconstruction with an All-Silicon Detector• Does the current software reconstruct tracks efficiently in dense jet environments?• Is the momentum resolution as good as expected from Billior calculations? Why or why not?
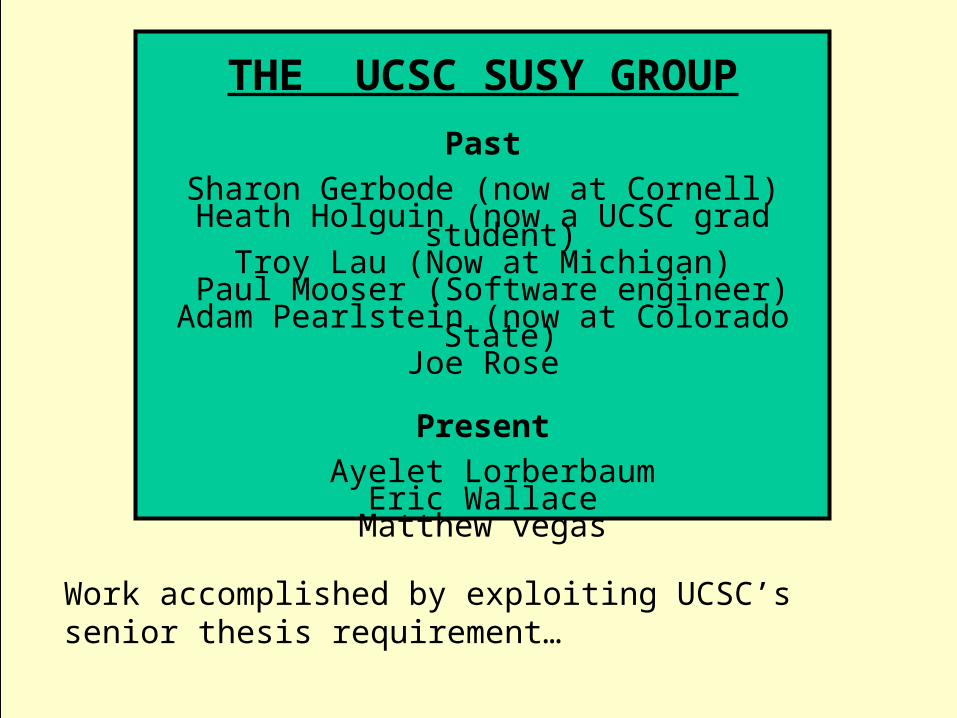
THE UCSC SUSY GROUP
Past
Sharon Gerbode (now at Cornell)Heath Holguin (now a UCSC grad student)
Troy Lau (Now at Michigan) Paul Mooser (Software engineer)
Adam Pearlstein (now at Colorado State)Joe Rose
Present
Ayelet LorberbaumEric Wallace
Matthew vegas
Work accomplished by exploiting UCSC’s senior thesis requirement…

Motivation
To explore the effects of limited detector resolution on our ability to measure SUSY parameters in the forward (|
cos()| > .8) region.

selectrons
LSP
SPS 1 Spectroscopy:
At Ecm = 1Tev, selectrons and neutralino are
light.
Beam/Brehm:√smin=1 √smax=1000 = .29sz = .11 (mm)

-0.9 -0.8 -0.7 -0.6 -0.5 -0.4 -0.3 -0.2 -0.1 0.0 0.1 0.2 0.3 0.4 0.5 0.6 0.7 0.8 0.91,000
2,000
3,000
4,000
5,000
6,000
7,000
8,000
9,000
10,000
11,000
12,000
13,000
14,000
15,000
16,000
SUSY: Particle cos(theta) (no cuts)
SPS1A at 1 TeVSelectrons vs. cos()
Electrons vs. cos()
Roughly ½ of statistics above |cos()| of 0.8,
but…
Energy Distribution
0
50
100
150
200
250
300
350
400
450
0 7 14
22
29
36
43
50
58
65
72
79
86
94
101
108
115
122
130
137
144
151
158
166
173
180
187
194
202
209
216
223
230
238
245
252
259
266
274
281
288
Energy GeV
Co
un
ts
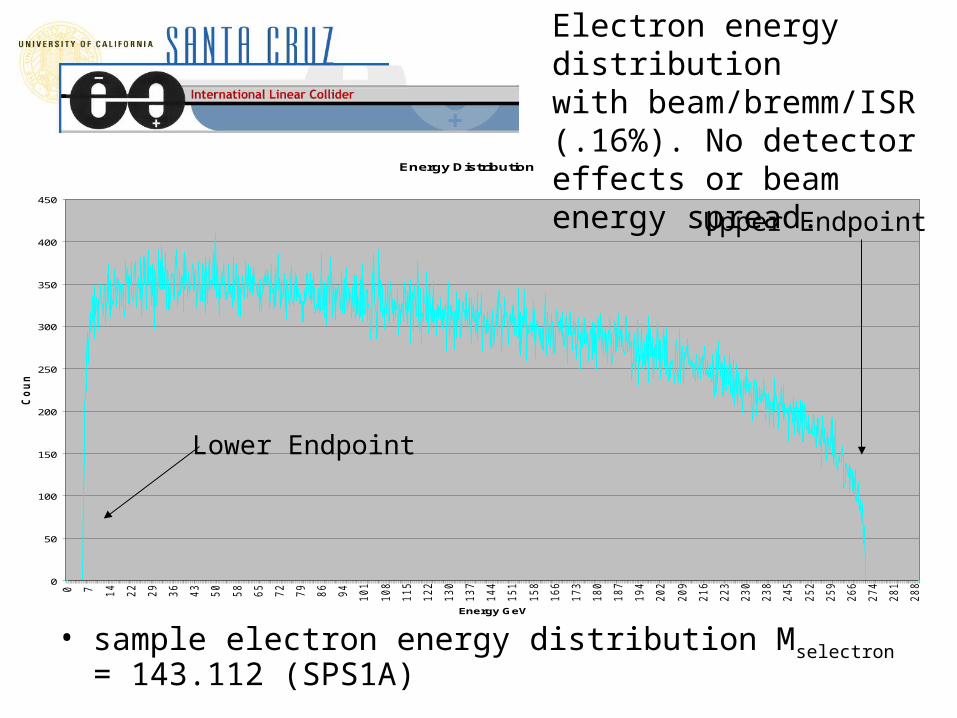
• sample electron energy distribution Mselectron = 143.112 (SPS1A)
Lower Endpoint
Upper Endpoint
Electron energy distributionwith beam/bremm/ISR (.16%). No detector effects or beam energy spread.

The spectrum is weighted towards higher energy at high |cos()|, so there’s more information in the forward region than one might expect.

Previous work: Can one find the selectron signal for |
cos()|>0.8?
Dominant Backgrounds:
e+ e- e+ e- e+ e-
e+ e- e+ e-

‘STANDARD’ CUTS
• Fiducial Cut: Exactly one final-state positron and one final-state electron pair in |cos()| region of interest, each with a transverse momentum of at least 5GeV. Otherwise the event is discarded.
• Tagging Cut: No observable electron or positron in low-angle `tagging’ calorimetry (with coverage of 20mrad < < 110mrad)
• Transverse Momentum (TM) Cut: Cuts events where vector sum of transverse momentum for e+e- pair is less than 2 * 250GeV * sin (20 mrads)
‘NEW’ CUTS
• Photon Cut: TM cut eliminates four-electron background except for radiative events. Remove remaining radiative events by looking for radiated photon; i.e., if there is a photon in the tagging region with energy of 20GeV or more.
• HP Cut: Removes low-mass, t-channel-dominated ee backgrounds while preserving high-mass SUSY signal

Before H-P
After H-P
After ‘photon cut’, which eliminates the four-electron back-ground, the dominant background is ee. Manipulation of the beam polarization, combined with application of the ‘HP Cut’ reduces background to minimal levels, even in forward region.
Ignore backgrounds in detector resolution studies.
Pe- = +80%Pe+ = -50%
Pe- = +80%Pe+ = 0%
|cos| < 0.994
Standard Model Backgrounds

Fitting the Endpoints for the Selectron Mass
For now, we have done one-dimensional fits (assume 0 mass known)
Vary SUSY parameters minutely around SPS1A point so that selectron mass changes while 0 mass remains fixed.
Generate ‘infinite’ (~1000 fb-1) at each point to compare to 115 fb-1 data sample; minimize 2 vs. mselectron to find best-fit selectron mass.
Repeat for 120 independent data samples; statistics from spread around mean rather than directly from 2 contour.
SPS1Amselectron

Selectron Mass Study Scenarios
12 scenarios were considered:
Detector Resolution
Perfect (no smearing) and SDMAR01
Detector Coverage
|cos| < 0.8 and |cos| < 0.994
Beam Spread
0%, 0.16%, and 1.0%

RMS Error / Error on Error COSTHETA 0-.8
0.0730.078
0.194
0.1060.111
0.200
0.000
0.050
0.100
0.150
0.200
0.250
-0.10% 0.10% 0.30% 0.50% 0.70% 0.90% 1.10%Beamspread
RM
S E
rro
r
PERFECT
SDMAR01
First, just look in the central region (|cos| < 0.8)
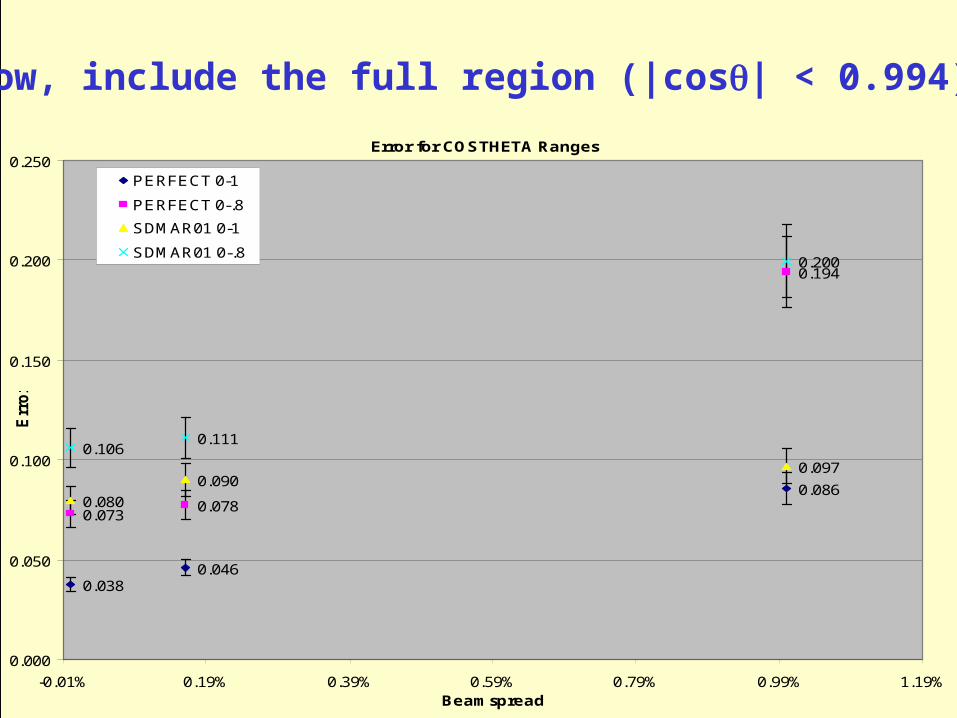
Error for COSTHETA Ranges
0.0380.046
0.086
0.0730.078
0.194
0.080
0.0900.097
0.1060.111
0.200
0.000
0.050
0.100
0.150
0.200
0.250
-0.01% 0.19% 0.39% 0.59% 0.79% 0.99% 1.19%Beamspread
Err
or
PERFECT 0-1
PERFECT 0-.8
SDMAR01 0-1
SDMAR01 0-.8
Now, include the full region (|cos| < 0.994)

0.046
0.104
0.064
0.076
0.000
0.020
0.040
0.060
0.080
0.100
0.120
0.140
0.160
-0.10% 0.40% 0.90%
Beamspread
RM
S E
rro
r
0.078
0.089
0.113
0.128
0.000
0.020
0.040
0.060
0.080
0.100
0.120
0.140
0.160
-0.10% 0.10% 0.30% 0.50% 0.70% 0.90% 1.10%
Beamspread
RM
S E
rro
r
SDMAR01
NO MATERIAL
PERFECT RES-OLUTION
PERFECT RES., NO MATERIAL
|cos| < 0.8 |cos| < 0.994
Is it the point resolution, or the material?

Tentative Conclusions to Draw
1. Due to the stiffening of the spectrum in the forward region, there is a surprising amount of information there. For this scenario, most of the information on slepton masses lies in the forward (|cos| > 0.8) region.
2. For cold-technology beamspread (0.14%), SDMAR01 resolution has not reached the point of diminishing returns. The physics seems to be limited by detector resolution. Point resolution is the dominant issue.
3. Any gains that can be made in p resolution in the forward region would reap large rewards for light sleptons.