simulation of pressure- and tube-tooling wire-coating...
TRANSCRIPT

Simulation of pressure- andtube-tooling wire-coating macrows
through distributedcomputation
A Baloch H Matallah V Ngamaramvarangguland MF Webster
Institute of Non-Newtonian Fluid MechanicsDepartment of Computer Science University of Wales Swansea UK
Keywords Finite element method Viscous macrows Parallel computing
Abstract This article focuses on the comparative study of annular wire-coating macrows withpolymer melt materials Different process designs are considered of pressure- and tube-toolingcomplementing earlier studies on individual designs A novel mass-balance free-surface locationtechnique is proposed The polymeric materials are represented via shear-thinning differentialviscoelastic constitutive models taken of exponential Phan-ThienTanner form Simulations areconducted for these industrial problems through distributed parallel computation using a semi-implicit time-stepping Taylor-Galerkinpressure-correction algorithm On typical regeld results andby comparing short-against full-die pressure-tooling solutions shear-rates are observed to increaseten fold while strain rates increase one hundred times Tube-tooling shear and extension-rates areone quarter of those for pressure-tooling These regndings across design options have considerablebearing on the appropriateness of choice for the respective process involved Parallel regnite elementresults are generated on a homogeneous network of Intel-chip workstations running PVM(Parallel Vitual Machine) protocol over a Solaris operating system Parallel timings yield practicallyideal linear speed-up over the set number of processors
1 IntroductionA number of highly viscoelastic complex extrusion macrows are investigatedcommonly associated with the coatings of glass rovings regbre-optic cableswire and cable manufacturing processes Three macrow problems are considereddie swelldrag macrow (short-die pressure-tooling) full pressure-tooling andtube-tooling macrow The regrst two cases are suitable for simulating industrialnarrow-bore wire-coating processes Tube-tooling deals with thicker (wide-bore) wire-coating processes To provide realistic macrow representation for thepolymer melt materials used in practice the speciregc choice is made of aviscoelastic constitutive model to support shear-thinning and strain-softeningbehaviour To this end an exponential Phan-ThienTanner (EPTT) model isselected macrows are computed in a two-dimensional annular coordinate system
The current issue and full text archive of this journal is available at
httpwwwemeraldinsightcom0961-5539htm
Supported by a grant from the UK EPSRC GRL14916Faculty of Science Chulalongkorn University Thailand Int J Num Meth Heat amp Fluid Flow 6March 2002
HFF124
458
International Journal of NumericalMethods for Heat amp Fluid FlowVol 12 No 4 2002 pp 458-493
q MCB UP Limited 0961-5539DOI 10110809615530210433305
under creeping macrow conditions and a parallelised version of a semi-implicittime-marching regnite element scheme is used Taylor-Galerkinpressure-correction (TGPC)
Wire-coating has been studied extensively in experimental andcomputational form over recent years see Ngamaramvaranggul and Webster(2002) for review Most studies concentrate on the pressure-tooling designModelling assumptions commonly include isothermal macrow conditionsincompressibility of the coating macrow (Chung 1986) concentricity of the wire(Tadmor and Bird 1974) and wire speeds ranging up to one meter per second(Mutlu et al 1998a) Wire-coating in the pressure-tooling context constitutes aprocess of two macrow regimes a shear dominated macrow within an annular die andan extension-dominated macrow along the wire-coating region beyond the dieInjection of the molten polymer into the tooling die establishes a pressure-driven macrow Contact between the molten plastic tube and the wire is madewithin the die for pressure-tooling where the travelling wire induces a dragmacrow drawing out the polymer melt to form a sheath around the cable Uniqueto tube-tooling design is the dependency upon the effects of draw-down beyondthe die Coating production lines for narrow-bore wire use relatively highspeeds around one meter per second and the deposition of the macruid on a rigidmoving wire is treated as a free surface problem
Recent attention by a number of authors has focused on the simulation ofpressure-tooling macrow for viscous macruids such as those of Caswell and Tanner(1978) Pittman and Rashid (1986) Mitsoulis (1986) Mitsoulis et al (1988) andWagner and Mistsoulis (1985) Their work dealt mainly with shear macrow underboth isothermal and non-isothermal conditions Molten polymers have beennoted to exhibit highly elastic behaviour when subject to large deformation(Matallah et al 2001) Only recently numerical techniques have proven capableof reaching solutions for sufregciently high and relevant levels of elasticityMany attempts involving either lubrication or inelastic approximations havebeen conducted to addressed these shortcomings (Caswell and Tanner 1978Mitsoulis et al 1988 Han and Rao 1978) With regnite elements (FE) Mitsoulis(1986) studied the wire-coating macrow of power-law and Newtonian macruidsMitsoulis concluded that the inclusion of shear-thinning reduced the levels ofdie-swell at the die-exit as well as the recirculation that occurred within the dieIn a subsequent article Mitsoulis et al (1988) provided a detailed investigationinto high-speed industrial wire-coating Two macrow formulations were used aplanar FE analysis for non-isothermal macrows and a lubrication approximationfor isothermal power-law macruids Results corroborated the experimentalregndings of Haas and Skewis (1974)
The inadequacy of inelastic modelling was made apparent by (Binding et al1996) rediscrepancies in stress and pressure drop To predict residual stressingwithin the melt coating a viscoelastic analysis was recommended to accountfor the inmacruence of short residence times of the particles within the macrow Hence
Simulation ofpressure- and
tube-tooling
459
we have adopted differential viscoelastic models to predict stress developmentusing state-of-the-art FE techniques to reach the high deformation ratesencountered and associated high Weissenberg numbers O(104) For tube-tooling macrows and regxed free-surface estimation we have conducted single-modePTT (Phan-ThienTanner) simulations in Mutlu et al (1998a) Mutlu et al(1998b) and Matallah et al (2001) Tube-tooling was analysed in sections inMutlu et al (1998a) isolating draw-down macrow and studying the effects of stresspre-history and various boundary conditions This led to a further study (Mutluet al 1998b) on coupled and decoupled solution procedures for a range of modelmacruids approaching those of industrial relevance In Matallah et al (2001)single-mode calculations were compared to those of multi-mode type for LDPEand HDPE grade polymers The multi-mode computations revealed thedominant modes of most signiregcance to the process and gave insight as to thelevels of residual stress in the resultant coatings Further work on multi-modemodelling of Matallah et al (2000) emphasised the inmacruence of die-designon optimal process setting Three as opposed to seven modes were foundadequate to sufregciently describe the macrow The draw-down residence timewhich dictates the dominance of certain modes within the relaxation timespectrum was found to be a major factor to inmacruence the decay of residualstressing in the coating
With speciregc attention paid to slip for viscous macrows a semi-implicit Taylor-Galerkinpressure-correction procedure was used by the present authors(Ngamaramvarangguland Webster 2000a) for pressure-tooling and tube-toolingThere the inmacruence of slip onset as opposed to no-slip conditions within the diewas examined Tracking free surfaces our earlier work on model problemsaddressed stick-slip and die-swell macrows see Ngamaramvaranggul and Webster(2000b) Ngamaramvarangguland Webster (2001) In a recent article for pressure-tooling (Ngamaramvaranggul and Webster 2002) the inmacruence of materialrheology was investigated on free-surface macrow whilst tube-tooling was thesubject in Matallah et al (2001) The present analysis extends upon this workcontrasting comparative designs via a distributed parallel implementation Thecomputational efregciency over various processor-cluster sizes is of particularinterest Distributed computations are performed over homogeneous networkclusters of Intel-chip workstations running a Solaris Operating System In thisrespect our earlier experience with parallelisation for large yet modelproblems (Baloch et al 2000) is taken into the industrial processing realmThere Parallel Virtual Machine (PVM) message passing libraries were usedover heterogeneous clusters comprising of DEC-alpha Intel-Solaris and AMD-K7(Athlon) Linux processors
The outline of the current paper is as follows First the governing equationsare described followed by the rheological behaviour of the PTT model Insection 4 the three different problems are specireged This is followed by anoutline to the parallel TGPC numerical method employed for the simulations
HFF124
460
The results of the simulations are presented in section 6 and some conclusionsare drawn in section 7
2 Governing equationsIsothermal macrow of incompressible viscoelastic macruid can be modelled through asystem comprising of the generalised momentum transport conservation ofmass and viscoelastic stress constitutive equations The problems in this studyare modeled as annular and two-dimensional In the absence of body forcessuch a system can be represented in the form
H Ccedil v = 0 (1)
rshy v
shy t= H Ccedils 2 rv Ccedil Hv (2)
Here v is the macruid velocity vector regeld s is the Cauchy stress tensor r is themacruid density t represents time and divergence and gradient operations areimplied via H The Cauchy stress tensor can be expressed in the form
s = 2 pd + T e
where p is the isotropic macruid pressure d is the Kronecker delta tensor and Te isthe stress tensor For viscoelastic macrows stress Te can be decomposed intosolvent and polymeric contributions
T e = t + 2m 2d
with tensors t the elastic extra-stress and rate-of-strain d = 05[Hv + (Hv) ) ](superscript ) denotes a matrix transpose) m2 is a solvent and m1 a polymericsolute viscosity such that m = m 1 + m 2 The particular choice of constitutivemodel is that of Phan-Thien and Tanner (1977) Phan-Thien (1978) inexponential form (EPPT) In contrast to models such as constant shearviscosity Oldroyd-B this EPPT version supports shear-thinning and regniteextensional viscosity behaviour The constitutive equations for the extra-stressof the EPTT model is expressed as
l1shy tshy t
= 2m 1d + f t 2 l1[ t Ccedil Hv + (Hv) )Ccedil t 2 v Ccedil Ht] (3)
with an averaged relaxation time l1 and function f deregned in terms of trace ofstress trace (t ) as
f = expel1
m 1trace(t)
micro para
The material parameters that control shear and elongational properties ofthe macruid are e and m 1 respectively These may be evaluated by regtting to the
Simulation ofpressure- and
tube-tooling
461
experimental data (Matallah et al 2001 Matallah et al 2000) When e vanishesthe Oldroyd-B model is recovered and f = 1
We regnd it convenient to express the governing equations in non-dimensionalform by deregning corresponding scales of characteristic length R taken ascoating length (Figures 2ndash4) and wire-speed as characteristic velocity scale VThen stress and pressure are scaled by a factor of mV curren Rand time by Rcurren V There are two non-dimensional group numbers of relevance Weissenbergnumber We = Vl1 curren R and Reynolds number Re = rVRcurren m
3 Shear and elongational behaviour of EPTTMany common non-Newtonian macruids exhibit non-constant viscosity behaviourSo for example such materials may display shear-thinning where theviscosity is a decreasing function of increasing shear rate as illustrated inFigures 1a in pure shear Figure 1b remacrects a similar plot demonstrating thefunctional dependence of viscosity under increasing strain-rate in pure uniaxialextension This is termed the elongational or extensional viscosity behaviourThe merits of the PTT model over the Maxwell model are highlighted by Phan-Thien and Tanner (1992) noting that the Maxwellian elongational viscosity issingular at regnite strain rates The shear and extensional viscosity functions m s
and me of the PTT model variants may be expressed as a function of f itselftaken of exponential form as above via
m s( Ccedilg) = m 2 +m 1
f (4)
and
m e( Ccedile) = 3m 2 +2m 1
f 2 2l1 Ccedile+
mf + l1 Ccedile
(5)
Under general macrow conditions there is need to record generalized shear andstrain-rates that are deregned via macrow invariants as respectively
Ccedilg = 2IId
p Ccedile = 3
IIIdIId
(6)
where IId and IIId are the second and third invariants of the rate of straintensor d Such quantities are represented as
IId =1
2trace(d ) =
1
2
shy vr
shy r
sup3 acute2
+shy vz
shy z
sup3 acute2
+vr
r
plusmn sup22
+1
2
shy vr
shy z+
shy vz
shy r
sup3 acute2( )
(7)
IIId = det(d ) =vr
r
shy vr
shy r
shy vz
shy z2
1
4
shy vr
shy z+
shy v2
shy r
sup3 acute2( )
(8)
HFF124
462
In pure shear m s varies with e m1 and l1 The effect of elevating m 1 from levelsof 088 to 099 and 095 reduces the second Newtonian plateau level from0(10 2 1) to 0(10 2 2) and below Here m 1 = 099 solute fraction is taken assuitable Shifting of l1 (via We) from unity to 0(10) and 0(102) translates m s in aconstant shift fashion The larger l1 the earlier the departure occurs from theregrst Newtonian plateau Current material and process settings suggest l1 of0(1s ) is a reasonable choice so that We = 200 With selection of m 1 = 099and We = 200 the inmacruence of the e-parameter choice is relatively minor
Figure 1EPTT model
Simulation ofpressure- and
tube-tooling
463
Figure 3Full-die pressure-tooling
Figure 2Short-die pressure-tooling
HFF124
464
Increasing e from 01 to 0(1) slightly retards the m s pattern so that earlierdeparture from the regrst Newtonian plateau occurs Here e of unity is selected
In steady uniaxial extension m e follows the behavioural trends of m s for bothWe and m1 parameters Distinction may be found via the e -parameter Takingthe tuple setting (m 1 We) = (099 200) for 01 e 05 remacrects strain-hardening at low strain rates prior to softening at rates above 102 2 Onlysoftening is apparent for e 0(1) The EPTT (1099200) model demonstratesthe desired viscometric functional behaviour shear-thinning and strain-softening within the deformation rate ranges of dominant interest for the wire-coating process as one might typically encounter say for an LDPE gradepolymer at 230 8 C As a consequence of these viscometric functions we observelater in the actual macrows of current interest that maximum shear-rates may riseto O(102) units whilst strain-rates reach O(101) This in turn implies thatsecond Newtonian plateaus will be reached in-situ
4 Speciregcation of problemsThis paper deals with the study of three types of macrow die swelldrag macrow(short-die tooling) full-die pressure-tooling macrow and tube-tooling macrow
41 Die-swelldrag macrowThis annular problem illustrates the progressive effects of an imposed dragmacrow from the travelling wire on both the classic die swell problem (within thefree jet-macrow region) and stick-slip macrow (see Figure 2) Mesh reregnementconsiderations follow our previous studies (Ngamaramvaranggul and Webster2002 Ngamaramvaranggul and Webster 2000b Ngamaramvaranggul andWebster 2001) where the regne mesh of Figure 2b is found suitable Themacrowrate through the die is regxed by the fully-developed annular inlet macrowproregle under pressure-driven conditions No-slip conditions are applied atthe die wall boundaries The wire and inlet channel radii comprise thecharacteristic length while characteristic velocity is directly related to theconstant wire-speed at the lower boundary of the domain The rapid reductionin traction at the free jet surface gives rise to the fully-developed plug macrow atthe domain outmacrow
42 Pressure-toolingPressure-tooling macrow is an extension to the previous die-swelldrag macrow studythe domain of which is specireged in Figure 3a This domain contains an initialshort-die macrow zone within the land region of the die (z6 z7) followed by a jetmacrow region at the die exit The traveling wire within the die moving at a regxedspeed regrst makes contact with the pressure-driven annular macrow at z3 stationThe inmacruence of the wire on the polymer melt at this boundary region isreferred to in Ngamaramvaranggul and Webster (2002) Binding et al (1996)Ngamaramvaranggul and Webster (2000a) Flow within the die is restrained byno-slip boundary conditions at the die walls The swelling effects observed in
Simulation ofpressure- and
tube-tooling
465
the jet macrow region are caused by the sudden drop to atmospheric pressurecombined with the immediate lack of traction This swell in the extrudedpolymer levels out to a fully-developed plug macrow by the time it reaches the endof the pressure-tooling domain The biased regne mesh of Figure 3b is employedfor further details see our prior study (Ngamaramvaranggul and Webster2002)
43 Tube-toolingA schematic illustration of the full-die tube-tooling domain is shown inFigure 4a This was computed upon with the regne mesh of Figure 4b Problemdimensions are largely in common with the full pressure-tooling speciregcationSo for example the lower and upper die wall converging angles are 308 and178 at positions z10 and z3 respectively No-slip die-wall boundary conditionsapply throughout the die In the regnal draw-down region (z4z5 and z8z9) freesurface conditions apply For tube-tooling the wire makes contact withthe polymer melt at the end of the draw-down region z5 with the coatinglength upon the wire being taken as the characteristic length R2 As forpressure-tooling the wire dimensions inlet hydraulic radius (R2) and total dielength (3R2) again apply in this example In our previous investigations(Ngamaramvaranggul and Webster 2002 Ngamaramvaranggul and Webster2001) we focused upon mesh convergence studies Here numerical solutionsare generated on regne meshes only the detailed statistics of which are recordedin Table I for all three problems inclusive of degrees of freedom (DOF) forNewtonian (N ) models and viscoelastic (V ) models
Figure 4Full-die tube-tooling
HFF124
466
5 Numerical scheme51 Sequential Taylor-Galerkin algorithmA time-marching regnite element algorithm is employed in this investigation tocompute steady viscoelastic solution through a semi-implicit Taylor-Petrov-Galerkinpressure-correction scheme (Townsend and Webster 1987 Hawkenet al 1990 Carew et al 1993 Baloch and Webster 1995 Baloch et al 1998Matallah et al 1998) based on a fractional-step formulation This involvesdiscretisation for equations (1ndash3) regrst in the temporal domain adopting aTaylor series expansion in time and a pressure-correction operator-split tobuild a second-order time-stepping scheme Spatial discretisation is achievedvia Galerkin approximation for momentum and Petrov-Galerkin for theconstitutive equations The regnite element basis functions employed arequadratic for velocities and stress and linear for pressure deregned over two-dimensional triangular elements Galerkin integrals are evaluated by a sevenpoint Gauss quadrature rule The time-stepping scheme includes a semi-implicit treatment for the momentum equation to avoid restrictive viscousstability constraints Solution of each fractional-staged equation isaccomplished via an iterative solver That is with the exception of thetemporal pressure-difference Poisson equation which is solved through a directCholeski procedure The semi-implicit Taylor-Galerkinpressure-correctionmethod may be presented in semi-discrete temporal format as
Stage 1a
2Re
Dt(v n+ 1
2 2 v n) = [H Ccedil (2m 2d + t) 2 Rev Ccedil Hv 2 Hp]n + H Ccedil m 2(dn+ 1
2 2 d n)
2We
Dt(tn+ 1
2 2 tn)n = 2m 1d 2 f t 2 We[v Ccedil Ht 2 Hv Ccedil t 2 (Hv Ccedil t) ) ]n
Stage 1b
Re
Dt(v 2 vn ) = [H Ccedil (2m 2d 2 Hp]n + [H t 2 Rev Ccedil Hv]n+ 1
2 + H Ccedil m 2(d 2 d n)
We
Dttn+ 1
2 2 tnplusmn sup2
= 2m 1d 2 f t 2 We[v Ccedil Ht 2 Hv Ccedil t 2 (Hv Ccedil t) ) ]n+ 12
Meshes Elements Nodes DOF(N) DOF(V)
Short-die 288 377 929 2437Pressure-tooling 3810 7905 17858 49478Tube-tooling 4714 9755 22031 61051
Table IFinite element mesh
data
Simulation ofpressure- and
tube-tooling
467
Stage 2Dt
2H2(pn+ 1 2 pn) = ReH Ccedil v
Stage 32Re
Dt(v n+ 1 2 v ) = 2 H(pn+ 1 2 pn )
Here n is the time step number and v is a non-solenoidal vector regeld Thevelocity and stress components of Stage 1a are taken for a half time step(ie n + 1curren 2) while at Stage 1b the v velocities and stresses are computedover a full time step (n + 1) In combination Stage 1 constitutes a predictor-corrector doublet performed once per time-step This concludes derivationof stress components for a complete time step Pressure differences over thisperiod are calculated from the Poisson equation (Stage 2) depending uponthe intermediate vector regeld v Solution of this Poisson equation yields thesolenoidal velocity over a full time step as shown in Stage 3 (see Townsendand Webster (1987) Hawken et al (1990)) Free-surface reassessment isconducted at a fourth stage (see on) Recovery of velocity gradients withinthe constitutive equation further enhances stability of the system alongwith streamline-upwind Petrov-Galerkin weighting Determination of timestep (typically O(10 2 3)) is made on the basis of a Courant stabilityconstraint
52 Parallel Taylor-Galerkin algorithmThe semi-implicit time-stepping TGPC algorithm is parallelised as followsEach of the individual fractional-stage phases of the algorithm is parallelisedwithin a single time-step loop This implies operations of gather and scatter ofdata pre- and post- each phase respectively In such a manner the combinedproblem is split into associated sub-problems relating to each subdomain Werelate such operations with message passing between master and slaveprocessors achieved via PVM send and receive communication commandsThis is a crucial issue to ensure correct system conregguration and networkcommunication This slave processors solve subdomain problems whilst themaster processor resolves the interface problem and controls master-slavecommunication (Grant et al 1998)
Of the various fractional-stages the pressure equation step is the only onethat is conducted through a direct solution procedure (Choleski) involving theexplicit parallel construction and solution of a matrix problem Remainingstages are associated with an iterative solution procedure (Jacobi) It is uponthis basis that the exceptional parallel performance characteristics areachieved The complete detail behind the parallelisation of the TGPC and thesetwo algebraic solution procedures is provided in Grant et al (1998) Briemacryboth necessitate an assembly and solution phase involving regnite element loop
HFF124
468
construction of right-hand-side vectors and matrix components For Choleskithe matrix components must be stored Fortunately this is manageable evenfor large problems as the pressure variable in question is of scalar form on theregeld
Solution phases radically differ between iterative and direct proceduresThe iterative solution phase is nodally-based Each sub-problem on a slaveprocessor regrst computes contributions for the boundary (interfacing) nodes sothat their result may be communicated to the master processor directly whilstthe computation for interior sub-domain nodes is completed This enableseffective masking of communication The master processor must then processthe combined domain contributions for the interfacing nodes as well asperforming system synchronisation and intercommunication processor controlUtilising an iteration number r acceleration factor right-hand side vector biteration sub-domain vector XPi system (mass) matrix Mfe and diagonalmatrix Md the parallel regnite element Jacobi iteration may be expressed inconcise notational form as
par
X P1
X P2
X P3
XPn
2
666666666666666666664
3
777777777777777777775
r+ 1
nodes
= (I 2 M 2 1d M fe)
XP
XP
XP3
XPn
2
666666666666666666664
3
777777777777777777775
r
nodes
+ M 2 1d [b]nodes
The mass-matrix (Mfe) is based on quadratic regnite element functions itsdiagonalised form (Md) is one of absolute row-sum and the iterativeacceleration parameter may be selected to suit (often simply taken as unity)System matrices are referenced and evaluated at the element level only so thata complete system is never stored A single iteration sweep of this sort willmaintain integrity levels of the data re-synchronisation Care likewise must betaken with respect to consistent solution increment tolerance calculationsacross individual slave and master processors
The parallel direct solution phase adopts a Schur-complement approachThis introduces a herring-bone structure to the complete system matrixproblem via the associated nodal numbering on each subdomain and the
Simulation ofpressure- and
tube-tooling
469
interfacing boundary nodes The parallel herring-bone structure of the Choleskisystem matrix may be represented as
par
[P1] [MP1]
[P2] [MP2]
[P3] [MP3]
Ccedil Ccedil
Ccedil
Ccedil [Pn] [MPn]
[P1M ] [P2M ] [P3M ] [PnM ] [M ]
2
66666666666664
3
77777777777775
Herring Bone Structure (Schur-complement)
with [Pi] the subdomain problem for the interior of subdomain i [PiM ] thematrix contribution of interior subdomain i to the boundary-node problem and[M ] that for the boundary-nodes
The subdomain problem for each interior subdomain (on a single slaveprocessor) may be solved in parallel with all others Finally the interfacing-node matrix problem is solved for which all available processors may be usedTo date the size of the interfacing-node matrix problem has been such that asingle processor (the master) has been employed to resolve it In such a fashionit is possible to render large-scale problems tractable typically of three-dimensional or viscoelastic form (Grant et al 1998)
53 Free-surface procedureThe term die-swell describes the radial increase of the polymer melt in the free-jet macrow on exiting the die It is represented as the swelling ratio (x = Rj curren R) where Rj is the jet radius and R is the tube radius This phenomenon is ofconsiderable signiregcance to some polymer processing operations in industryFor creeping macrow without gravity and with large surface tension die swellwas deregned analytically by Richardson (1970) A number of numerical schemescan be used to calculate die swell Comparisons in performance between freesurface estimation algorithms utilising regnite differences regnite elements andboundary element methods can be found in Crochet et al (1984) and Tanner(1985) These surveys cover the varying accuracy of the above methods andasymptotic analysis for viscoelastic and Newtonian macruids in axisymmetric andplanar die macrows Below we introduce two schemes for the numerical predictionof free surfaces the streamline prediction method and the mass balancemethod These are incorporated into the present algorithm at a fourthterminating stage within the time-step loop
HFF124
470
54 Stream-line prediction methodA modireged iterative free surface location method was used to determineextrusion proregles Three boundary conditions are used to describe the freesurface see Crochet et al (1984)
vrnr + vznz = 0 (9)
trnr + tznz = S1
r1
+1
r2
sup3 acute (10)
trnz 2 tznr = 0 (11)
Where free surface unit normal components are (nr nz) curvature radii(r1r2) surface tension coefregcient S (vanishes here) radial and axial velocities(vr vz) and surface forces normal to the free surface (tr tz)
Boundary condition (10) and (11) are used when iteratively modelling thefree surface Conditions (9) is then included to deregne the normal velocity Theupper extruded macrow surface can then be obtained for die-swell extrusion For atube radius R the distance r(z ) of the free surface from the axis of symmetry isrepresented by
r(z) = R +
Z yen
z= 0
vr (z)
vz(z)dz (12)
In order to accurately predict the extrusion shape Simpsons quadrature rule isused to compute the integral of equation (12)
The procedure of solution is as follows First the kinematics for a convergedNewtonian solution is used as initial conditions with a relaxed stress regeld andthe regxed free-surface problem is solved Subsequently the full problem iscomputed involving the free surface calculation where the surface locationitself must be determined Continuation from one particular viscoelasticsolution setting to the next is then employed In some instances it is stabilisingto regrst enforce vanishing surface extra-stress (t of equation (3)) prior torelaxing such a constraint To satisfy the zero normal velocity free surfaceboundary condition and to compensate for the adjustment of the free surfacethe velocity solution at the advanced time surface position must be reprojectedfrom the previous surface position
55 Mass balance methodThe pressure dropmass balance method provides an adequate means ofcorrecting the estimation of the free surface position Such a technique mayprovide improved solution accuracy and stability over the regular streamlinelocation method The procedure involves taking an initial estimate of thefree-surface proregle for each Weissenberg number Sampling points for We
Simulation ofpressure- and
tube-tooling
471
begin from the stick-slip region The regnal correction stage makes use of thestreamline method to perturb and validate the position of the die swell surface
By examining the functional dependence of pressure drop (Dp ) in swell (x )proregles at the centreline for each We level the mass balance scheme relatesmacrow characteristics between the stick-slip to die-swell phases of the problem(akin to an expression of energy balance) By taking into account known swellpredictions with sampled pressure drop results a general relationship may beestablished between these two scenarios
x(z) =Dp(z We)
f (We)
By regtting to prior and accepted data (say at low We levels from the streamlinemethod) the denominator can be represented by
f (We) = 1068 2 0133We 2 2125 We2
Using this approach it is possible to derive the approximate swell afterpressure drop calculations are made This process is then implemented withinan iterative time-stepping procedure to obtain a converged solution Such astrategy is found to be absolutely necessary to achieve converged free-surfacesolutions at the extreme levels of parameters relevant to industrial processingnotably high We and low solvent contribution
6 Numerical predictions and discussion61 Short-die pressure-toolingThe solution for short-die pressure-tooling is illustrated through regeld plots interms of pressure extension rate and shear rate in Figure 5 and stresscomponent contours in Figure 7 The short-die problem taken on the 6 pound24element mesh is idealised macrow It proves useful to encapsulate the essence ofpressure-tooling devoid of the complexity of the full die In contrast the full-diestudy reveals the implications of actual processing conditions
The pressure drop across the macrow reaches 046 units (relative to ambientpressure) where the die length to exit gap width ratio is of the order 21 Thisdrop corresponds to that across the die alone The minimum pressure arises atthe top surface die-exit The shear rate I2 is two orders of magnitude largerthan the extension rate peaking with 313 units at the top die-exit boundaryUpon entering the jet region the shear rate rapidly decline and vanishes Themacrow proregle adjusts from a shear macrow within the die to a plug macrow in the jetThe macrow proregles of Figure 6 remacrect this position with a linear decrease inpressure observed along the wire within the die Maximum swell within the jetreaches 1054 units This would correspond to typical results reported in theliterature Mitsoulis (1986) Mitsoulis et al (1988) Wagner and Mitsoulis (1985)
HFF124
472
Ngamaramvaranggul and Webster (2000b) Ngamaramvaranggul and Webster(2001)
Field plots on the stress components of Figure 7 illustrate the dominance ofthe axial stress that in maxima is three times larger than the shear stress andregve times larger than the radial stress The sharp adjustment is noted atdie-exit on the top-surface in both shear and axial stress Trz and Tzz-proregles ofFigure 8 and 9 respectively Proregles on the wire are relatively smooth incontrast We have observed in our earlier work (Ngamaramvaranggul andWebster 2002) that the strain-softening response of the EPTT model stabilises
Figure 5Short-die
Simulation ofpressure- and
tube-tooling
473
Figure 6Short-die (a) pressurealong the wire (b) I2 ontop surface (c) die swellon top free
HFF124
474
stress proregles This stands in stark contrast to models that support strain-hardening
62 Full-die pressure-toolingFollowing our earlier study on mesh convergence (Ngamaramvaranggul andWebster 2002) for this problem our results are plotted upon the biased regnemesh of Figure 3b with identical parameter settings as for the short-die macrowThe zonal reregnements are outlined in Table II with greatest density and bias inthe land and die-exit regions
Figure 7Short-die (a) Trr
contours (b) Trz
contours (c) Tzz contours
Simulation ofpressure- and
tube-tooling
475
The regled plots of Figure 10 indicate an intense drop in pressure local to the landregion reaching a maximum pressure drop of 101 units Shear rate I2 alsoidentireges signiregcant shearing over the land region reaching a peak of 461 unitsat the die-exit a regfteen fold increase to that obtained for short-die tooling
Figure 8Short-die Trz (a) on topsurface (b) on wire
Sub-region zone Biased regne mesh
1 inlet die 15 pound202 converging die 15 pound253 coating region 15 pound304 land region 15 pound55 jet region 15 pound47
Table IIFull-die pressure-tooling meshcharacteristicssub-region zones
HFF124
476
Strain rates Ccedile are an order of magnitude lower than shear rates and displaypeaks at melt-wire contact and die-exit At the melt-wire contact point Ccedileincreases to 837 units A rapid larger rise occurs in the wire-coating section atdie-exit The second peak in Ccedile-proregle at the top boundary characteristic for thefull-die reaches a height of 188 units in the post-die exit region
The pressure along the bottom surface corresponds to the line contour plotof Figure 11a Pressure difference is twenty two times greater for the full caseabove short-die pressure-tooling (as compared with Figure 5) Note that thesedrops in pressure essentially correspond to the same macrow zone that is over theland-region at jet-entry The die-swell proregle along the top free-surface is givenin Figure 11b The swelling ratio is regfteen percent larger than that for short-diepressure-tooling
Figure 9Short-die Tzz (a) on top
surface (b) on wire
Simulation ofpressure- and
tube-tooling
477
Shear rate proregles along the top and bottom surfaces are represented in Figure12 The top surface I2 peak of 4617 units at the die-exit (Figure 12a) is regfteentimes greater than that for short-die pressure-tooling (see Figure 6b) Figuredata on I2 maxima may be found in Table III Along the bottom surface thedouble (sudden shock) peaks of 124 and 140 units of Figure 12b are mostprominent Such peaks do not appear in the short-die case being a newintroduction as a consequence of the full-die and melt-wire contact
The ordfshock impactordm as the macruid makes contact with the wire is mostprominent in the radial shear and axial stress contour plots of Figure 13
Figure 10Full-die pressure-tooling(a) pressure contours(b) I2 contours (c) Ccedilecontours
HFF124
478
Nevertheless stress levels within the die remain small the greatest axial stressof 0069 units occurs upon melt-wire contact
Top-surface stress proregles of Figure 14a and 15a demonstrate most clearlythe ordflocalised effectordm of die-exit point discontinuity A violent jump in shearstress is observed over the land region Comparison of stress between full-dieand short-die pressure-tooling instances reveals factor increases of 18 times inTrz and 17 times in Tzz (Table III) Both shear and axial stress proregles alongthe bottom wire-surface reveal the inmacruence of the moving-wire on the macrowat the melt-wire contact point (axial position 2 11 units) In axial stress ofFigure 15 along the bottom surface the characteristic ordfdouble peakordm proregle atthe melt-wire contact point and die-exit regions is observed The axial stresspeak at the melt-wire contact point exceeds that at die-exit and is followed by asharp relaxation on the approach to the land region upon which a more
Figure 11Full-die pressure-tooling
(a) pressure along thewire (b) die swell on top
free
Simulation ofpressure- and
tube-tooling
479
sustained maxima forms Notably in the extrudate Tzz remains positive andprovides some residual stressing to the coating Tzz-maxima increase onlyslightly from case to case with full-case pressure-tooling values being abouttwice for the short-die instance
Figure 12Full-die pressure-toolingI2 (a) on top surface (b) onbottom surface
Solution variables Short-die Full-die Tube-tooling
I2 max Top 3135 4617 1277I2 max Bot ndash 1397 1442Ccedile max 0144 1883 443Dp 0462 1018 1609Trx max 0014 0025 0024Tzz max 0041 0069 0050x 1054 1215 ndash
Table IIIEPTT (e = 1 m 1 =099 We = 200)solution values
HFF124
480
63 Tube-toolingConcerning the tube-tooling problem our analyses are based on a single reregnedmesh as displayed in Figure 4b see Townsend and Webster (1987) Meshcharacteristics for each sub-region are provided in Table IV As displayed inFigure 16a the pressure-drop is most prominent across the tube-die At thedraw-down and coating regions the pressure hold to an ambient level The
Figure 13Full-die pressure-tooling
(a) Trr contours (b) Trz
contours (c) Tzz contours
Simulation ofpressure- and
tube-tooling
481
most important rate of change in pressure-drop arises across the land-region asis true for pressure-tooling Here the maximum value is higher of 161 units fortube-tooling compared to 102 units for pressure-tooling
In contrast shear-rate I2 is about a quarter of that corresponding topressure-tooling The maximum is 144 units Again higher shear-rates areattained in the land-region see Figure 16b The remaining regions displaysmaller shear-rates so that the shear-viscosity of the polymer melt will be highthere The shear-rate proregles are also displayed in Figure 17b and c plottedalong the top and bottom surfaces in the axial direction The shear-ratesincrease across the converging cone from 089 units at the inlet-tube and startof the converging cone to 146 units at its end A sudden rise in shear-rateoccurs when the polymer enters the land-region across which a constant valueis generated Shear-rate maxima are generated at the die-exit with values of
Figure 14Full-die pressure-toolingTrz (a) on top surface(b) on wire
HFF124
482
1442 and 1272 units at the bottom and top surfaces respectively Beyond thedie-exit entering the draw-down macrow a sharp drop in shear-rate is observedSimilar behaviour is observed in both top and bottom surface shear-rateproregles There is only a gradual decrease in shear-rate over the draw-down
Figure 15Full-die pressure-tooling
Tzz a) on top surface(b) on wire
Sub-region zone Biased regne mesh
1 inlet die 12 pound452 converging die 12 pound18+15 pound83 land region 15 pound12+20 pound124 draw-down region 20 pound255 coating region 20 pound25
Table IVTube-tooling meshcharacteristics sub-
region zones
Simulation ofpressure- and
tube-tooling
483
section followed by a sharp decline when the polymer meets the wireTraveling with the wire the rate of decrease in shear-rates is minimal The regnalshear-rates taken up at the end of the coating are about 026 and 10 units forbottom and top surfaces respectively
The state of strain-rate Ccedile is illustrated in Figure 16c This quantity issigniregcant in the converging tube It reaches a maximum of about 443 units anorder of magnitude lower than that for shear-rate maxima This is a regfth of thatcorresponding to pressure-tooling maxima Large values of strain-rate are alsolocated of less magnitude at the start of the draw-down section just beyond thedie-exit The value reached is about 250 units half of that observed in theconverging die-cone The proregles for Ccedile along the axial direction for top andbottom surfaces show similar behaviour to each other with exceptions at thesharp adjustments in geometry Elongation-rates are large at the land region
Figure 16Tube-tooling (a) pressurecontours (b) I2 contours(c) Ccedile contours
HFF124
484
Figure 17Tube-tooling (a) pressurealong the wire (b) I2 on
top surface (c) I2 onbottom surface
Simulation ofpressure- and
tube-tooling
485
entrance reaching a maximum of 443 units being minimal in the remainingmacrow section Shear and strain-rates are important measurable quantities thatdescribe the state of macrow and according to the ranges encountered mayexplain the polymer response to different macrow scenarios
Component stress proregles along the top surface are provided in Figure 18 a)for trz and b ) for tzz One may observe from this that along the inlet-tube tzz isconstant of about 002 units Sudden change occurs with each adjustment ingeometry An increase of tzz is observed within the converging cone of the diereaching a value of 0045 units at the entrance to the land-region tzz is constantover the land-region followed by a sudden increase due to singularity wherethe polymer departs from the die to the draw-down section A sharp decreasewithin the draw-down is generated When the polymer makes contact with thewire tzz increases providing a residual stress of about 0012 units In contrast
Figure 18Tube-tooling on topsurface (a) Trz (b) Tzz
HFF124
486
the shear-stress trz is lower in value than the tzz component as displayed inFigure 18a trz starts with a value of about 0007 units at the inlet tube increaseover the converging cone to reach a constant value of 001 units across the land-region Subsequently trz decreases in the draw-down and coating regions to aminimum value less than 0001 units Contours are plotted in Figure 19 toanalyse the state of stress over the whole domain and in various componentstrr can be considered to be small in the inlet-tube and land-region it issigniregcant in the converging cone draw-down and coating regions A maximumof about 005 units is realised in the draw-down section For trz we observe apeak (0024 units) in the converging die-cone near the entrance to the land-region The shear-stress is also prominent in the land-region but of lessmagnitude (about half) than that over the converging cone Axial tzz stress ismost signiregcant in the land-region as observed in Figure 19c The maximum
Figure 19Tube-tooling (a) Trr
contours (b) Trz
contours (c) Tzz contours
Simulation ofpressure- and
tube-tooling
487
value 0051 units is double that of the shear-stress Hence residual stressing tothe coating is dominated by the axial component
64 Parallel timingsParallel computation is employed within the simulations performed through aspatial domain decomposition method The domain of interest is decomposedinto a number of subdomains according to available resources and totalnumber of DOF In this study uniform load distribution is ensured using aRecursive Spectral Bisection method (Simon 1991) Though the method is quitegeneral uniform load may be organized if domain subdivision isstraightforward otherwise loading will be approximately uniform fromwhich manual adjustment may be made As the short-die domain has relativelyfew DOF the domain is decomposed into instances with only two and four sub-domains In contrast tube-tooling and pressure-tooling domains are partitionedinto as many as eight sub-domains
In Table V information is presented on domain decomposition the numberof elements and nodes per subdomain the number of interfacing nodes andratio of subdomain nodes to interfacing nodes (Cn= Nn Inn) With an increasingnumber of subdomains interfacing nodes (Inn) increase (as does communicationcost) whilst the number of elements nodes (Nn) and degrees-of-freedom persubdomain decreases
Parallel timings are generated on a networked cluster of single processorIntel 450 MHz Solaris workstations a distributed-memory homogeneousplatform A public domain PVM 343 version for message passing protocol hasbeen employed to support interprocessor communication through networkingwith fast 100 Mbits EtherNet Computed results are presented through the
Domain Elements Nodes Interface nodes Cn
Short-die subdomain subdomain Master Slave Master Slave
1 288 377 ndash ndash ndash ndash2 144 325 13 13 4 44 72 169 39 26 23 154Pressure-tooling1 3810 7905 ndash ndash ndash ndash2 1905 3968 31 31 078 0784 953 1976 93 62 471 3148 476 988 217 62 220 628Tube-tooling1 4714 9755 ndash ndash ndash ndash2 2357 4878 31 31 064 2754 1178 2439 103 67 422 2758 589 1222 272 71 223 581
Table VDomaindecomposition data
HFF124
488
parallel performance of the Taylor-Galerkin scheme by measuring metrics ofspeed-up and efregciency with increasing numbers of processors (hence sub-tasks) The total speed-up (Sn) factor and efregciency (Zn) are deregned as
Sn =T seq
Tn
Zn =Sn
n
Where n is the number of processors Tseq is the CPU time in seconds (s ) for thesequential algorithm and Tn is the CPU time for the parallel algorithm CPUtime Tn of the parallel computation can be decomposed into computation time(Tcomp
n )and communication time (Tcommn ) Timings correspond to total job run-
time inclusive of input-output and communication latencyIn Table VI speed-up and efregciency factors are tabulated for our parallel
implementations Speed-up is plotted in Figure 20 for the viscoelastic simulationsif short-die tube-tooling and pressure-tooling problems with increasingnumbers of processors As the short-die problem has fewer DOF eight percentloss of efregciency is observed with up to four processors For two-subdomains
Short-die Pressure-tooling Tube-toolingProcessors Sn Zn Sn Zn Sn Zn
1 100 100 100 100 100 1002 194 097 199 099 199 0994 366 092 398 099 399 0998 ndash ndash 744 093 761 095
Table VIParallel speed-up
and efregciency
Figure 20Parallel speed-up
Simulation ofpressure- and
tube-tooling
489
the master processor has to communicate with thirteen interfacing nodesMoving to four-subdomains the size of each task on a slave processor halvesFor full pressure-tooling and tube-tooling with two and four subdomains theratio between computation and communication remains small At eightsubdomains this ratio is of the same order as that for the short-die problem andfour processor Under such circumstances with tube-tooling the parallelalgorithm loses regve percent efregciency and seven percent for pressure-toolingproblems The consequence of this is felt within our parallel implementationvia the ratio of internal to boundary nodes in each instance This ratio willaffect the proportion of cost split between communication and sub-problemcomputation (hence the masking of communication (Baloch et al 2000 Grantet al 1998))
In Table V we have recorded data relating to interfacing nodes and the ratiobetween subdomain nodes and interfacing nodes (Cn) For the short-die withtwo slave processors the number of nodes is relatively few and Cn is aroundfour percent Therefore we immediately lose efregciency of about three percentThe loss is even greater with four slave processors see Table VI Suchefregciency loss diminishes as Cn decreases as clearly demonstrated in bothpressure-tooling and tube-tooling instances To take full advantage ofparallelism and gain optimal performance levels we seek to increase problemsize and select a minimal Cn ratio through a judicious choice of domainsubdivision (sub-task generation demanding prerequisite slave processors)For both pressure-tooling and tube-tooling problems and up to four slaveprocessors the Cn ratio is about three percent and we lose efregciency of onepercent At eight slave processors the parallel implementation loses sevenpercent efregciency for the pressure-tooling problem and regve percent for thetube-tooling problem To achieve optimal performance levels we must ensure abalance between the number of processors and total number of degrees-of-freedom per subdomain This will also provide the optimal ratio between(T comm
n ) and T compn times We recognize that communication and computation
times relate to different hardware mechanisms One may identify an acceptablethreshold level on efregciency loss of say up to regve percent For the presentstudy this would imply the efregcient use of two slave-processors for the short-die problem four slave-processors for pressure-tooling and eight slave-processors for tube-tooling With the proviso of sufregcient processors largerproblems may be tackled in this manner
7 ConclusionsIn the case of short-die pressure-tooling macrow there was no melt-wire suddencontact and smooth solutions were established on the wire at the die-exit Forthe full-die study in contrast to the short-die ranges of shear rise ten-fold andextension rate by one hundred times For dimensional equivalents one mustscale by O(103) For the short-die tooling the major observations are maximum
HFF124
490
shear rates arise at die-exit top-surface whilst for extension rates they liewithin the free-jet region The corresponding situation for strain rates is moremarked but displaying similar trends to shear rate Axial stress maxima occurat the top surface on die-exit For full-die pressure-tooling shear rate maxima onthe top surface occur over the land-region and in particular peak at the die-exit The level is some regfteen times larger than that for the short-die Shear ratemaxima on the wire are lower than that at the top surface by a factor of threeThe double (sudden shock) peaks in shear rate at the bottom surface for full-diemacrow do not appear in the short-die case These are a new feature introduced asa consequence of the full-die and melt-wire contact There is a double peakalong the wire with the die-exit value being marginally larger than that atmelt-wire contact Extension rate maxima are lower than shear rates by oneorder but have increased one hundred fold from the short-die case Extensionrates peak at the melt-wire contact and across landdie-exit region Themaximum corresponds to the die-exit The pressure drop across the macrow isalmost entirely conregned to the land-region and is magnireged some twenty-twotimes over that for the short-die The behaviour in stress for full-tooling revealsthe ordfshock impactordm as the macruid makes contact with the wire The largest axialstress arises at the melt-wire contact point The swelling ratios for the EPTTmodels are 15 per cent higher than that observed for short-die tooling Hencethe inmacruence of the die macrow itself is exposed The adequacy of the free-surfaceprocedures is also commended
In contrast focusing on tube-tooling desing stress and pressure build-up isrealised in the land-region section as with pressure-tooling The principalstress component tzz is signiregcant at the end of the coating generating aresidual stress of about 0012 units and vanishing shear-stress This is similarto pressure-tooling Shear-rates are of O(102) units reaching a maximum of 144units a quarter of that corresponding to the pressure-tooling problem Thismaximum is observed at the exit of the die Tube-tooling strain-rates are anorder of magnitude lower than tube-tooling shear-rates strain-rate maximareach 443 units again one quarter of those for pressure-tooling Largest strain-rates are generated throughout the converging did-tube with lesser values inthe draw-down section (extrudate) Such elements of variation between designswould have considerable impact upon the processes involved
Distributed parallel processing has been shown to be an effectivecomputational tool to simulate industrial wire-coating macrows Ideal linearspeed-up in run-times has been extracted based on the number of processorsutilised Increasing the size of the problem would render even greaterefregciency providing a wider pool of processors were made available
References
Baloch A and Webster MF (1995) ordfA computer simulation of complex macrows of regbresuspensionsordm Computers Fluids 24 No 2 pp 135-51
Simulation ofpressure- and
tube-tooling
491
Baloch A Grant PW and Webster MF (2000) Homogeneous and heterogeneous distributedcluster processing for two and three-dimensional viscoelastic macrows submitted to IntJ Num Meth Fluids available as CSR 16
Baloch A Townsend P and Webster MF (1998) ordfOn the highly elastic macrowsordm J Non-Newtonian Fluid Mech 75 pp 139-66
Binding DM Blythe AR Gunter S Mosquera AA Townsend P and Webster MF (1996)ordfModelling Polymer Melt Flows in Wire Coating Processesordm J non-Newtonian Fluid Mech64 pp 191-209
Chung TS (1986) ordfThe Effect of Melt Compressibility on a High-Speed Wire-Coating ProcessordmPolym Eng Sci 26 No 6 pp 410-4
Caswell B and Tanner RI (1978) ordfWire Coating Die Design Using Finite Element MethodsordmJ Polym Sci 5 pp 416-21
Crochet MJ Davies AR and Wlalter K Numerical simulation of Non-Newtonian FlowRheology Series 1 Elsevier Science Publishers (1984)
Carew EOA Townsend P and Webster MF (1993) ordfA Taylor-Petrov-Galerkin Algorithm forViscoelastic Flowordm J Non-Newtonian Fluid Mech 50 pp 253-87
Grant PW Webster MF and Zhang X (1998) ordfCoarse Grain Parallel Simulation forIncompressible Flowsordm Int J Num Meth Eng 41 pp 1321-37
Haas KU and Skewis FH (1974) ordfSPE ANTECordm Tech Paper 20 p 8
Han CD and Rao D (1978) ordfStudies of Wire Coating Extrusion I The Rheology of WireCoating Extrusionordm Polym Eng Sci 18 No 13 pp 1019-29
Hawken DM Tamaddon-Jahromi HR Townsend P and Webster MF (1990) ordfA Taylor-Galerkin-based algorithm for viscous incompressible macrowordm Int J Num Meth Fluid 10pp 327-51
Mitsoulis E (1986) ordfFinite Element Analysis of Wire Coatingordm Polym Eng Sci 26 No 2pp 171-86
Matallah H Townsend P and Webster MF (1998) ordfRecovery and stress-splitting schemes forviscoelastic macrowsordm J Non-Newtonian Fluid Mech 75 pp 139-66
Matallah H Townsend P and Webster MF (2000) Viscoelastic Computations of PolymericWire-Coating Flows Int J Num Meth Heat Fluid Flow accepted for publication 2001available as CSR 13 University of Wales Swansea
Matallah H Townsend P and Webster MF (2000) ordfViscoelastic Multi-Mode Simulations ofWire-Coatingordm J Non-Newtonian Fluid Mech 90 pp 217-41
Mitsoulis E Wagner R and Heng FL (1988) ordfNumerical Simulation of Wire-Coating Low-Density Polyethylene Theory and Experimentsordm Polym Eng Sci 28 No 5 pp 291-310
Mutlu I Townsend P and Webster MF (1998a) ordfComputation of Viscoelastic Cable CoatingFlowsordm Int J Num Meth Fluids 26 pp 697-712
Mutlu I Townsend P and Webster MF (1998b) ordfSimulation of Cable-Coating ViscoelasticFlows with Coupled and Decoupled Schemesordm J Non-Newtonian Fluid Mech 74 pp 1-23
Ngamaramvaranggul V (2000) Numerical Simulation of Non-Newtonian Free Surface FlowsPhD thesis University of Wales Swansea
Ngamaramvaranggul V and Webster MF (2000a) ordfSimulation of Coatings Flows with SlipEffectsordm Int J Num Meth Fluids 33 pp 961-92
Ngamaramvaranggul V and Webster MF (2000b) ordfComputation of Free Surface Flows with aTaylor-GalerkinPressure-Correction Algorithmordm Int J Num Meth Fludis 33pp 993-1026
HFF124
492
Ngamaramvaranggul V and Webster MF (2001) ordfViscoelastic Simulation of Stick-Slip andDie-Swell Flowsordm Int J Num Meth Fluids 36 pp 539-95
Ngamaramvaranggul V and Webster MF (2002) ordfSimulation of Pressure-Tooling Wire-Coating Flow with Phan-ThienTanner Modelsordm Int J Num Meth Fluids 38 pp 677-710
Phan-Thien N (1978) ordfA Non-linear Network Viscoelastic Modelordm J Rheol 22 pp 259-83
Phan-Thien N and Tanner RI (1977) ordfA New Constitutive Equation Derived from NetworkTheoryordm J Non-Newtonian Fluid Mech 2 pp 353-65
Phan-Thien N and Tanner RI (1992) Boundary-Element Analysis of Forming Processes in`Numerical Modelling of Material Deformation Processes Research Development andApplicationrsquo by P Hartley I Pillinger and C Sturgess (Eds) Springer-Verlag London
Pittman JFT and Rashid K (1986) ordfNumerical Analysis of High-Speed Wire Coatingordm PlastRub Proc Appl 6 pp 153
Richardson S (1970) ordfA stick-slip problem relatived to the motion of a free jet at low Reynoldsnumbersordm Proc Camb Phil Soc 67 pp 477-89
Simon HD (1991) ordfPartitioning of unstructured problems for parallel processingordm ComputerSystems in Engineering 2 pp 135-48
Tadmor Z and Bird RB (1974) ordfRheological Analysis of Stabilizing Forces in Wire-CoatingDieordm Polym Eng Sci 14 No 2 pp 124-36
Tanner RI (1985) Engineering Rheology Oxford University Press London
Townsend P and Webster MF (1987) An algorithm for the three-dimensional transientsimulation of non-Newtonian macruid macrows in G Pamde J Middleton (Eds) Proc Int ConfNum Meth Eng Theory and Applications NUMETA Nijhoff Dordrecht pp T121-11
Wagner R and Mitsoulis E (1985) Adv Polym Tech 5 pp 305
Simulation ofpressure- and
tube-tooling
493
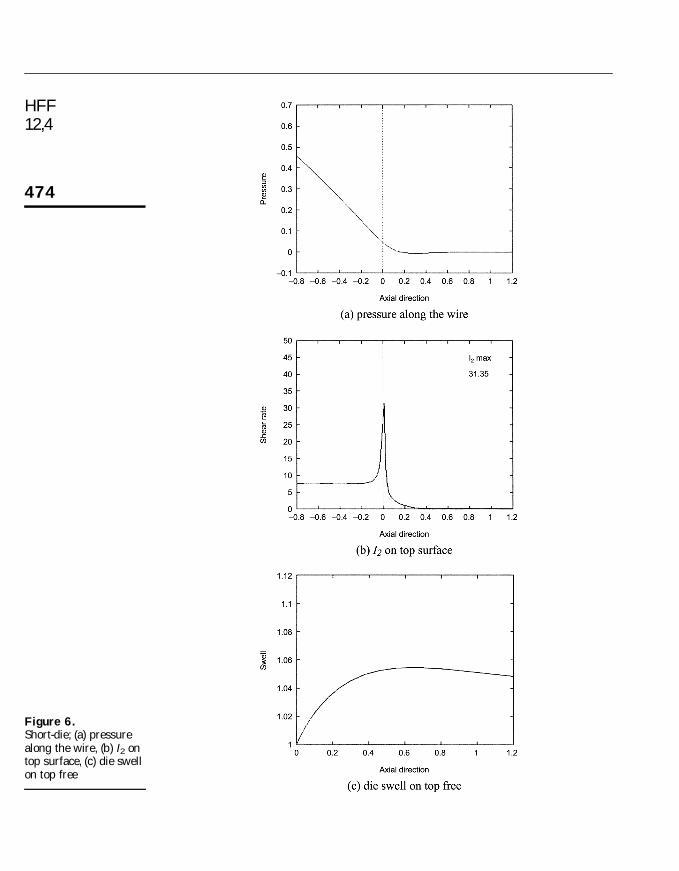
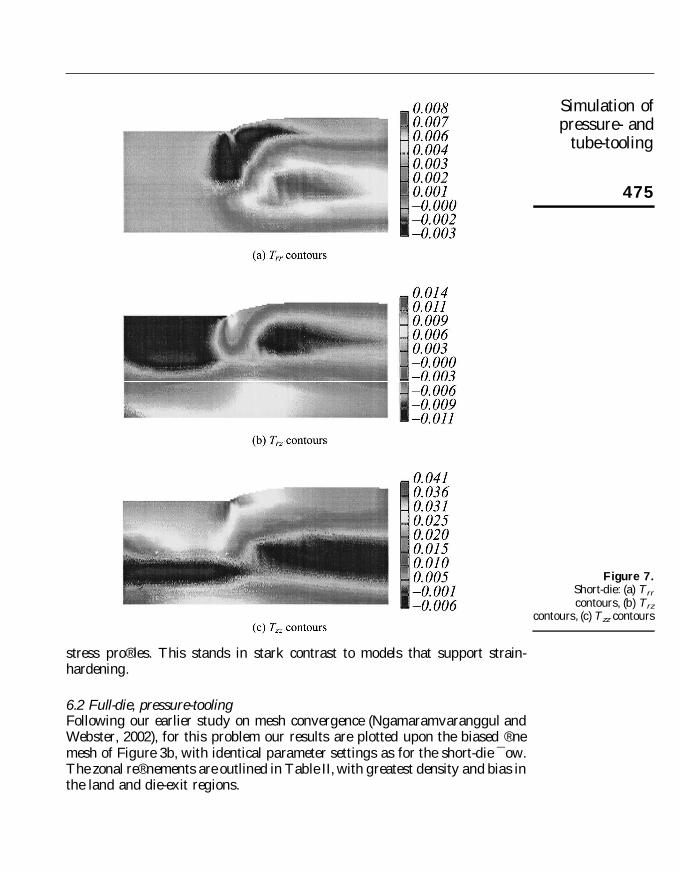
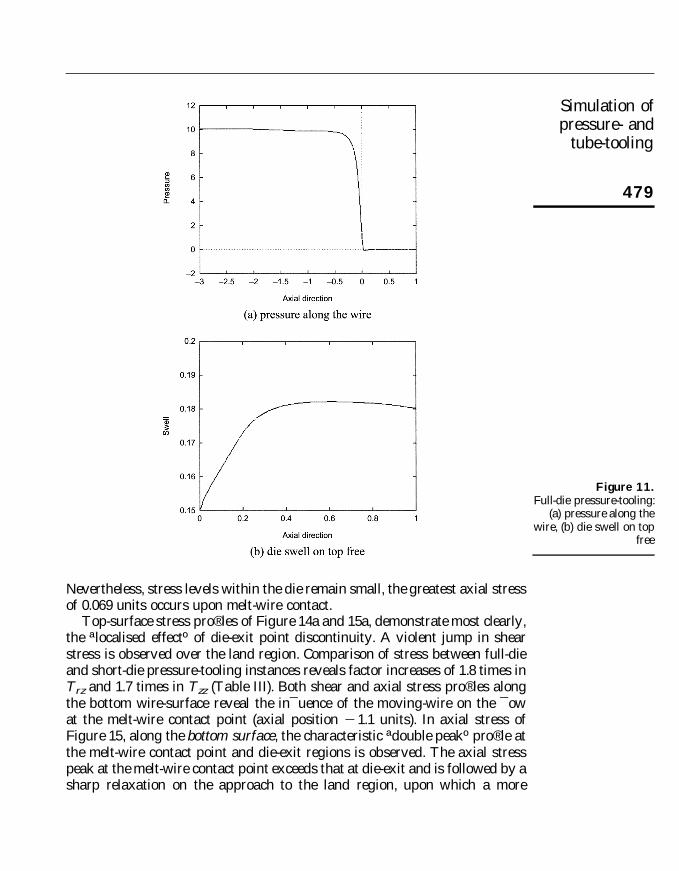
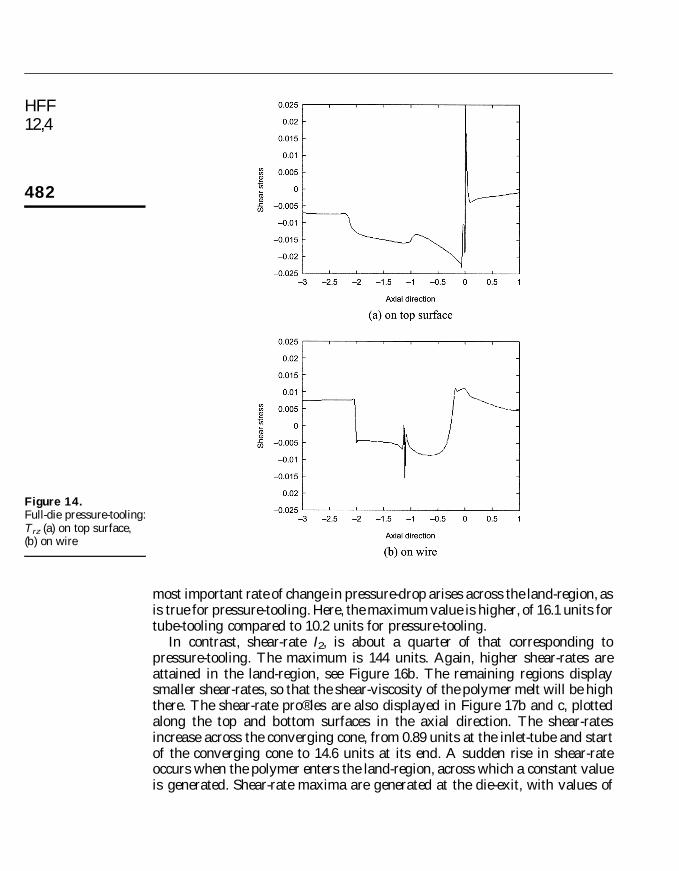
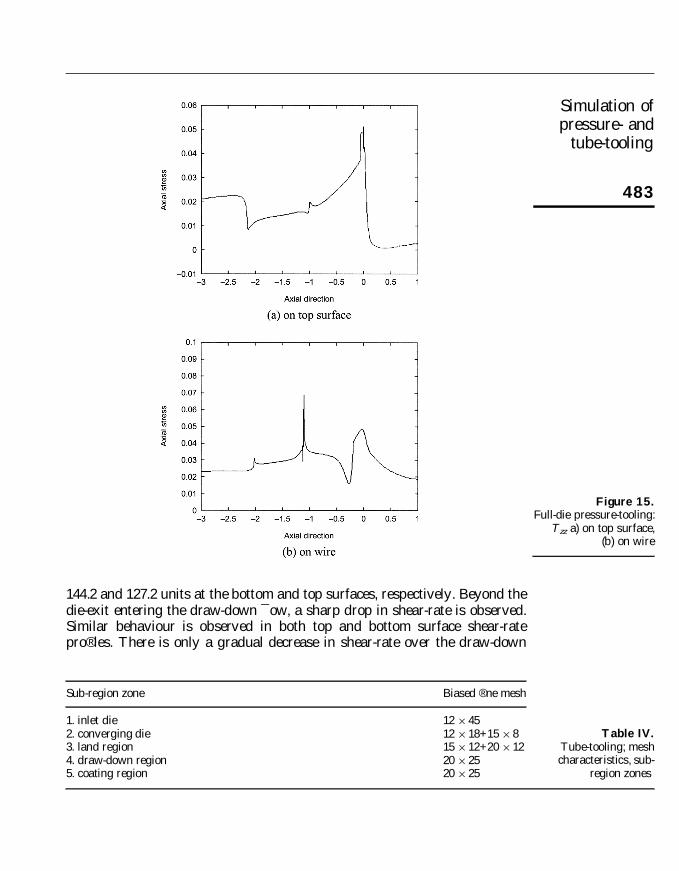
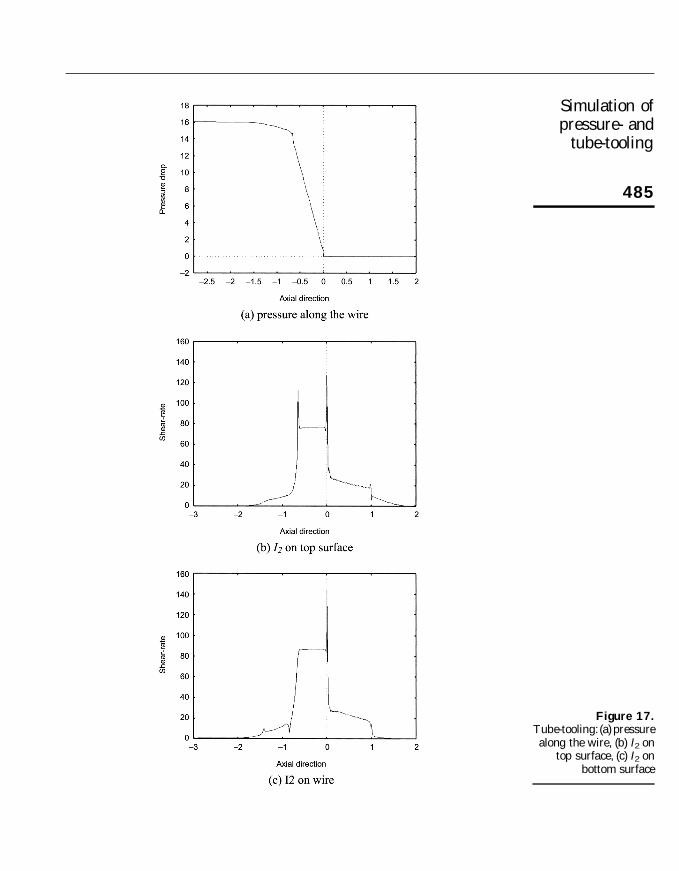