simulation of non-destructive testing methods of
TRANSCRIPT

Int. J. Electrochem. Sci., 8 (2013) 12226 - 12237
International Journal of
ELECTROCHEMICAL SCIENCE
www.electrochemsci.org
Simulation of Non-destructive Testing Methods of Ultrasound in
Concrete Columns
G. Roa-Rodríguez
*, W. Aperador, A. Delgado
Departamento de Ingeniería, Universidad Militar Nueva Granada, Carrera 11 No. 101-80, Fax:+57(1)
6343200, Bogotá, Colombia. *E-mail: [email protected]
Received: 19 July 2013 / Accepted: 30 August 2013 / Published: 25 September 2013
Among the processes that are conducted to perform the inspection of the internal reinforcement of
concrete structures, to study the component it is destroyed directly, in most cases some partial and
total. By means of a sustained theoretical approach, several objectives were established to evaluate
through modeling and simulation methods that could be useful for non-destructive testing in structural
concrete columns. Given these variables (positions and diameters of reinforcements) were established
mathematical models of the physical principles that constitute the operation of the respective non-
destructive testing methods and computational models were made of reinforced concrete column,
finally the data were interpreted from simulations into a graphic reconstructions which representing an
approximation to the column being analyzed. The result was a conceptual design which was the
product of the information gleaned from the simulations of the two methods worked, longitudinal
transmission and pulse echo, corresponding to the ultrasonic non-destructive testing. This research
describes theoretically non-destructive testing methods based on ultrasound, which can be used to
build devices that claim to prevent partial or total destruction of the structure to be studied, and
imaging techniques that are useful to identify the reinforcement positions of the concrete column based
on the collected data from the simulations.
Keywords: Reinforced concrete columns, NDT, Pulse-echo method, longitudinal transmission
method, Acoustic wave propagation, Ultrasound.
1. INTRODUCTION
This work presents the description, modeling and simulation of physical principles of methods
that can be used to perform non-destructive testing on reinforced concrete columns, aimed at
identifying the positions of the reinforcements on such structures. The study aimed to evaluate through
modeling and simulations useful methods to conduct non-destructive testing on reinforced concrete

Int. J. Electrochem. Sci., Vol. 8, 2013
12227
structural columns, obtaining the computational model of the column, the mathematical models that
represent the performance of the methods chosen and applying them through simulations on the model
of column and then using signal processing tools, to finally interpret and reconstruct the values
obtained on an image of the interior of the column, where it can identify the positions of the
reinforcements.
The present Investigation evaluated, through simulations using the Toolbox for Matlab K-
Wave, two non-destructive testing methods based on ultrasound (longitudinal transmission method and
pulse-echo method). To perform the simulations, we established a computational model of the column
on which a perturbation was applied (ultrasonic wave) through k-wave toolbox. Subsequently using
the information gathered by the sensors, we performed the reconstruction of the column through the
time-reversal algorithm, generating an image, in which after conducting the respective processing, it
was possible to identify the reinforcements within the structure.
2. SELECTION OF NON DESTRUCTIVE TESTING METHODs
The ultrasound-based assay (UT) is the Non-destructive testing that provides higher
performance for a possible implementation, the term ultrasonic refers to sound waves whose frequency
is above the threshold of human listener. Most methods based on ultrasound testing using frequencies
in a range between 1MHz and 10MHz. Additionally, along with radiographic testing, provides an
accurate use on ceramic materials such as concrete, and because of its ease and convenience of use
becomes the test of the present study (Table 1).
Table 1. Selection of non-destructive testing methods
Material submitted
for testing
Type of discontinuity VT RT ET UT PT MT AE IR
Ferromagnetic
Metallic
Cracks on the surface
Internal Cracks
x x
x
x
x
x
x
x
x
x
x
x
x
Nonferromagnetic
metallic
Cracks on the surface
Internal Cracks
x x
x
x
x
x
x
x
x
x
x
Metallic
Pitting
Wear corrosion cracking
Welding (depth)
Welding (porosity)
x
x
x
x
x
x
x
x
x
Polymer matrix
composites
Delamination
Porosity
Damages due to impacts
x
x
x
x
x
x
x
x
x
x
Polymers
Curing
Nonadherence
Porosity
x
x
x
x
x
x
x
Ceramic
Density
Porosity
Cracks on the surface
internal Cracks
x
x
x
x
x
x
x
x
x
x
x
x
VT: Visual Inspection
RT: Radiographic testing
ET: Electromagnetic Testing
UT: Ultrasonic Testing
PT: Penetrant testing
MT: Magnetic Particle Test
AE: Acoustic emission testing
IR: Infrared and thermal testing

Int. J. Electrochem. Sci., Vol. 8, 2013
12228
The non-destructive testing based on ultrasound can be applied by a variety of methods based
on the generation and detection of mechanical vibrations or waves that propagate through the objects
of study. Those are not restricted to be either metals or even have to be solid .The methods based on
this test are used for material characterization studies based on the principle that the speed of
ultrasound waves that travel through the material, is a function of the density of the material [1].
An ultrasound wave (in general, any type of mechanical wave), when it hits on a medium, part
is transmitted and part is reflected. From this fact, two methods are derived from this non-destructive
testing, respectively each based on the propagation of the transmitted wave and the collection of the
reflected wave [2]. The non-destructive testing based on ultrasound (UT) provides a variety of methods
for implementation, of which, the Longitudinal Transmission method and Pulse-Echo method were
chosen.
2.1. Longitudinal transmission
As the name implies, the method evaluates the ultrasound which is transmitted through the
medium. The form of implementation is performed, placing on one side of the piece, a transmitter of
ultrasound in complete contact with the surface, and on the opposite side of the piece, also a receiver in
full contact with the face and exactly aligned with the transmitter position (figure 1). [2]
Figure 1. longitudinal transmission
When a defect stands between the transmitter and receiver, the sound intensity decreases
because of partial reflection, or becomes zero in the case of total reflection. In this method, can be used
either a pulse train or continuous sound, since the transmitter and receiver operate independently and
are electrically separated. [2]
2.2. Pulse – Echo
This method uses the part of the wave that is reflected when it interacts with a defect. The wave
propagates in the material until it finds a defect at this point is performed partial or total reflection. The
form of implementation in this case is carried out by placing one probe bicristal (transmitter-receiver,
the two crystals are isolated acoustically) in complete contact with the surface of the object (Figure 2).
[2]

Int. J. Electrochem. Sci., Vol. 8, 2013
12229
Figure 2. Pulse - Echo
In this case, a train of pulses should be used, which allows the receiver to perform the
measurement, since the received signal is smaller than the signals sent by the sender. [2]
2.3. Model of the physical principle
Acoustic waves are longitudinal waves, the molecules move back and forth in the direction of
wave propagation, causing adjacent regions of compression and refraction. As a result, the pressure
change that occurs is the only restoring force capable of propagating a wave [3]. On Solids, the
propagating waves, in addition to longitudinal waves, can also be transmitted shear waves and
combinations of these with the longitudinal. Neglecting the transverse components which propagate in
the solid, the wave propagation in the solid can be described with a model of longitudinal pressure
wave, which depends on the density and velocity of phase [4], Eq (1).
(1)
Where represents the density at any point, the pressure wave at a given point r and
time t, and c indicates the phase velocity of the wave. [5] The present equation is valid for any medium
that has sound velocities and densities as functions of space.
3. COMPUTATIONAL MODEL OF CONCRETE COLUMN
The reinforced concrete column has 3 main components, gravel, concrete and reinforcements.
Each component has certain characteristics of interest such as the density and the phase velocity of
waves as they propagate through these. Reinforcements density was set to a value of 7850 . The
densities corresponding to the gravel and concrete were taken with the values of 2648 [6] and a
magnitude oscillating between 2200 and 2800 [6] respectively. This heterogeneous mixture is
considered as a homogeneous mixture with a density corresponding to 2200 , this value was taken as
a parameter for the density of the concrete. In [7] was conducted a study of the quality of concrete with
respect to the measurement of the phase velocity of an ultrasound pulse that propagates through a
section of the material. It was then decided to take as parameter of phase velocity a value of 4000
which is intermediate between a good and excellent quality concrete. On the other hand, it was

Int. J. Electrochem. Sci., Vol. 8, 2013
12230
established the phase velocity of the reinforcement as 5100 , corresponding to steel value. Given the
properties, and looking for an ideal model, the column is considered as a homogeneous layer with
outstanding concrete reinforcements. The characteristics of ideal column materials with their
respective characteristics were defined according to Table 2.
Table 2. Characteristics of the column materials
Material Phase Velocity Density
Concrete 4100 2200
Reinforcement 5100 7850
Generally, smaller buildings (three floors or less) use square structural columns, whose faces
are measured in a range between 20 cm and 25 cm and reinforced with rods half inch to one inch in
diameter. Given these constraints, we decided to perform a computational model of a cross section of a
square column of reinforced concrete, 20 cm face, reinforced with 8 rods whose diameters are 1 inch.
The model was implemented by creating a matrix that represents the column, each pixel of the array
represents the value of the parameters defined above (phase velocity and density) it means that each
pixel of the array symbolizes a piece of material forming of the column (Figure 3).
Figure 3. a) Cross-section of a real concrete column b) computational model of a cross section of a
reinforced concrete square column of 20 cm of face.
4. SIMULATIONS
To perform the simulations of the physical principle in the computational model of reinforced
concrete square column, we used the toolbox for Matlab, K-Wave [8-17], which implements the
discrete equations from equation 1, that represent the speed of propagation of the wave U and
respective pressures in x and y, Eq (2), Eq (3) Eq (4), Eq (5) Eq (6), Eq (7) , Eq (8).

Int. J. Electrochem. Sci., Vol. 8, 2013
12231
(2)
(3)
(4)
(5)
(6)
(7)
(8)
Where indicates the absorption parameters in x or y, k the compressibility of the medium, v
the effective source dependent of the velocity, the relaxation time, s the wave state variable, and A its
amplitude.
4.1. Simulation of the longitudinal transmission method
The frequencies of the probes, which are on the market, vary in a range between 1MHz and
22MHz. The contact probes that have the lowest frequency provide better penetration, property that
becomes the best choice to use in considerable thicknesses materials, granular materials or materials
that have large attenuation. Given the characteristics of penetration of the contact probe, we chose a
nominal frequency of 2 MHz respect to the amplitude, we define a value of 400mV (amplitude A), a
value that provided one of the best behavior in the propagation of the wave ultrasound in the medium.
To avoid an extensive number of steps in the simulation to make the sweep, we assumed a single
source, whose length is equal to the extent of the face of the column. This source completely covers
the whole medium and therefore is analogous to send ultrasonic waves at multiple positions. The same
assumption was made for the receiver. Given the two sources then ready and the two sensors on the
medium, the simulation was performed (Figure 4), two pulses are sent with origins in the face of the

Int. J. Electrochem. Sci., Vol. 8, 2013
12232
column parallel to the x axis and whose passage was performed on the z axis, and the face of the
column parallel to the axis z whose passage was performed on the x-axis.
Figure 4. source and sensor arrangement in the medium
After ending the propagation of the wave, the points collected by the sensors are reassigned as
initial points of pressure to perform the image reconstruction algorithm using Time Reversal [8-16]. In
the reconstructed image that is obtained, it is possible to visually determine the reinforcements
positions (Figure 5).
Figure 5. average reconstructed image using Time Reversal
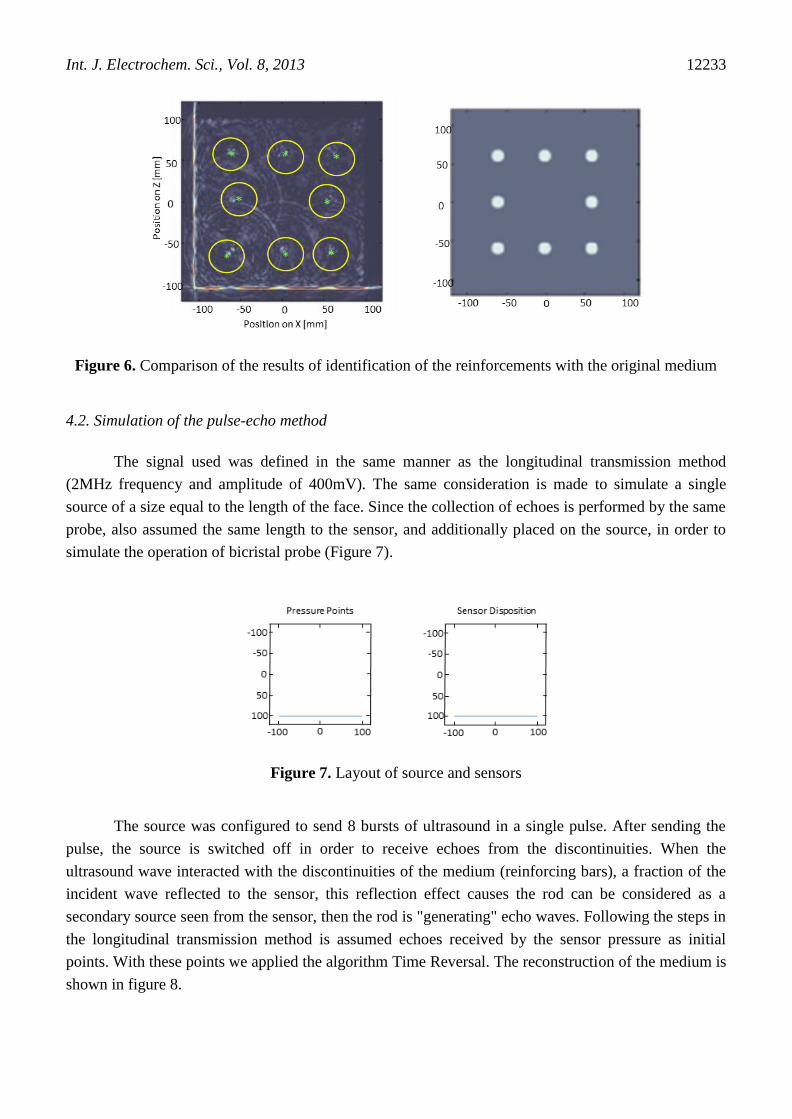
To overcome the need to identify the reinforcements only with visual examination, it was
performed an image processing by applying a Sobel filter using two thresholds to remove the edges
with high and low intensity, 0.3 and 0.05 respectively, this filtering made possible to obtain an image
in black and white with several regions of high concentration of pixels, regions corresponding to the
reinforcements, this filtered image was swept using a circular mask, which determines the regions of
higher concentration, keeping its coordinate. At the end of the swept, the resulting coordinates are
overlayed on the original image reconstruction and then were highlighted with a circle; finally, the
coordinates of the reinforcements are obtained as well as an image where those are identified (Figure
6).
Int. J. Electrochem. Sci., Vol. 8, 2013
12233
Figure 6. Comparison of the results of identification of the reinforcements with the original medium
4.2. Simulation of the pulse-echo method
The signal used was defined in the same manner as the longitudinal transmission method
(2MHz frequency and amplitude of 400mV). The same consideration is made to simulate a single
source of a size equal to the length of the face. Since the collection of echoes is performed by the same
probe, also assumed the same length to the sensor, and additionally placed on the source, in order to
simulate the operation of bicristal probe (Figure 7).
Figure 7. Layout of source and sensors
The source was configured to send 8 bursts of ultrasound in a single pulse. After sending the
pulse, the source is switched off in order to receive echoes from the discontinuities. When the
ultrasound wave interacted with the discontinuities of the medium (reinforcing bars), a fraction of the
incident wave reflected to the sensor, this reflection effect causes the rod can be considered as a
secondary source seen from the sensor, then the rod is "generating" echo waves. Following the steps in
the longitudinal transmission method is assumed echoes received by the sensor pressure as initial
points. With these points we applied the algorithm Time Reversal. The reconstruction of the medium is
shown in figure 8.

Int. J. Electrochem. Sci., Vol. 8, 2013
12234
Figure 8. Image of the medium, reconstructed by Time Reversal (Pulse-Echo method)
The image was subjected to a filtering process using the Sobel operator. Was carried out using
two thresholds for removing higher and lower edges intensity, 0.01 and 0.03 respectively, and then an
image was obtained where it is possible to identify several regions where there is a high concentration
of pixels, regions that correspond to the reinforcement . The filtered image is swept using a circular
mask, which identified regions with higher concentration of pixels keeping its coordinate. After
completing the course, the stored coordinates are superimposed on the original image reconstruction,
where are highlighted and enclosed by a circle, thus obtaining a visual representation of the location of
the reinforcements and their position within the medium (Figure 9).
Figure 9. Identification of reinforcements compared to original medium
4.3. Visual identification of strapping steel
Reinforced concrete columnapart from the vertical reinforcement and the concrete also has
reinforcements known strapping horizontally. They wrap and ensure vertical reinforcements remain in

Int. J. Electrochem. Sci., Vol. 8, 2013
12235
position. Thus, their detection is important when evaluating the structural condition of the building.
Since the method that yielded the best results was the pulse - echo at the time of finding the position of
the reinforcements, using this, we performed a new simulation of the column including narrow strip.
For this simulation were defined segments corresponding to narrow strip with a diameter of 3/8 " in the
computational model. (Figure 10).
Figure 10. computational model of a cross section of a square column
With K-Wave software, the model of the medium depending on the density and velocity of
phase was configured as shown in Figure 11.
Figure 11. Pattern of media using K-Wave tool a) in terms of speed of sound b) in terms of the density
After defining the computational model was simulated propagation of ultrasound wave into the
medium. When finished the simulation cycle, we proceeded to perform image reconstruction of the
medium, in which by a visual inspection is possible to determine the existence of narrow strip (Figure
12).

Int. J. Electrochem. Sci., Vol. 8, 2013
12236
Figure 12. Image of the medium with strapping reconstructed by Time Reversal
5. CONCLUSIONS
The work allow to obtain a representation of the steps of applying ultrasonic non-destructive
testing of reinforced concrete square columns of faces of 20 cm (sending and receiving high frequency
waves, sampling and processing of the received signal).
Idealizations made on the concrete allowed to establish a computational model representing an
approximation to the cross section of a square column of concrete.
Obtaining propagation mathematical model high frequency longitudinal waves, which is
implemented by the toolbox found Matlab K-Wave, allowed by modifying the parameters of density,
phase velocity, performing an Ideal simulation of the propagation of an ultrasonic pulse into a solid
heterogeneous medium such as in the case of reinforced concrete.
Simulations of the propagation inside a heterogeneous medium of high frequency waves,
allowed to represent two ideal methods of non-destructive testing based on ultrasound (longitudinal
transmission and pulse - echo), in which it was possible to simulate the emission of an ultrasonic pulse
and sampling the signal generated by the interaction of said pulse with the reinforcements inside the
medium.
The simulation of the sampling of the signal generated by the interaction of the ultrasound
pulse inside the medium reinforcements allowed, using the algorithm Time Reversal, a reconstruction
of an image in which the reinforcements can be identified within the column.
Image processing obtained from algorithm Time Reversal allowed to perform the automatic
identification of the reinforcements disposed within the column. Evaluation methods based on
ultrasonic non-destructive testing, indicates that both the longitudinal transmission method as the
method of pulse - echo square columns are applicable over reinforced concrete faces 20 cm in order to
identify the position of the reinforcements that are within the column.
Int. J. Electrochem. Sci., Vol. 8, 2013
12237
The simulation of the longitudinal transmission method, indicated that the clarity with which
reinforcements are identified within the column is proportional to the diameter of these, ie the bigger
the diameter, the more clearly we can identify.
The simulation method of pulse - echo proved simpler to implement, since to perform the
measurement only required the provision of a point source on only one side of the reinforced concrete
column, contrasting the transmission method longitudinal which demanded the independent use of a
source and a receiver opposite and perfectly aligned.
The simulation method of pulse - echo demonstrated that if it is required to find the strips
within the column, they can be found by visual examination in the image reconstructed from the
pressure points collected by the bicristal probe.
The histograms extracted from the images generated from the algorithm Time Reversal allowed
comparisons between the two worked methods, which it was determined that the method of pulse -
echo was more effective in the task of identifying reinforcements concrete column armed.
The results of the simulations allowed defining a conceptual design, which gave the instrument
requirements to be able to carry out the identification of reinforcements within concrete square
columns of faces of 20 cm.
References
1. P. Santos, E. Júlio, J. Santos, Engineering Structures, 32 (2010), 207.
2. H.K. Chai, S. Momoki, Y. Kobayashi, D.G. Aggelis, T. Shiotani, NDT & E International, 44
(2011) 206.
3. D.G. Aggelis, N. Tsimpris, H.K. Chai, T. Shiotani, Y. Kobayashi, Construction and Building
Materials, 25 (2011) 1503.
4. D. Breysse, Construction and Building Materials, 33 (2012) 139-163
5. F.R. Kinsler, Fundalmentals of Acoustics, Wiley (1999).
6. K. Kovler, N. Roussel, Cement and Concrete Research, 41 (2011) 775
7. G. Rómel, Ingeniería, 8 (2004) 41.
8. R. Fort, M. Alvarez de Buergo, E. M. Perez-Monserrat, International Journal of Rock Mechanics
and Mining Sciences, 61, (2013) 296.
9. T. Goursolle, S. Dos Santos, O. Bou Matar, S. Callé, International Journal of Non-Linear
Mechanics, 43 (2008) 170.
10. M.K. Kuo, T.R. Lin, P.L. Liu, T.T. Wu, Ultrasonics, 36 (1998) 803.
11. E. Özgan, H. Saruhan, Advances in Engineering Software, 41 (2010) 680.
12. D.N. Boccaccini, M. Maioli, M. Cannio, I. Dlouhy, M. Romagnoli, C. Leonelli, A.R. Boccaccini,
Journal of the European Ceramic Society, 32 (2012) 1175.
13. Zheng Liu, Yehuda Kleiner, Measurement, 46 (2013).
14. A. Khanfar, M. Abu-Khousa, N. Qaddoumi, Composite Structures, 62 (2003) 335.
15. C. Ramadas, Janardhan Padiyar, Krishnan Balasubramaniam, Makarand Joshi, C.V. rishnamurthy,
NDT & E International, 44 (2011) 523.
16. B. Treeby, B. Cox, Journal of Biomedical Optics, 15 (2010).
17. B. Treeby, B. Cox, Journal of the Acoustical Society of America, 131 (2012) 4324.
© 2013 by ESG (www.electrochemsci.org)