simulation of drill cuttings dispersion and deposition in
TRANSCRIPT

Abstract—Drill cuttings with various characteristics and
sizes are produced in any offshore oil and gas exploration and production (EP) drilling of the seabed. Drill cuttings may be transported to shore for land disposal or they may be disposed off into the sea after proper treatment on site. Offshore disposal of treated drilling muds and rock cuttings is operationally the simplest option available and economically the least expensive. Appropriate environmental measures, however, must be taken to ensure that the marine environment is not unduly polluted by the discharged drill cuttings. Further, the disposed drill cuttings will ultimately deposit onto the seabed to form piles around the toe of the platform that might hinder optimal pipe laying and maintenance. To enable proper assessment of the impacts of drill cuttings on the seabed and the marine environment, model simulations are performed to analyze the transport, dispersion and deposition of drilling muds and rock cuttings. For this purpose, a simulation model known as TUNA-PT has been developed to model the transport and deposition of drill cuttings subject to various climatic conditions, coastal environments and cuttings characteristics. This paper presents simulation results of cuttings pile formation patterns on the seabed and the distribution of suspended sediments in the top water column for an offshore EP platform in the South China Sea.
Index Terms—Drill cuttings disposal, TUNA simulation
I. INTRODUCTION obile Offshore Drilling Units (MODU) are typically used for offshore oil and gas exploration and
production (EP) drilling operation. A rotating drill bit is attached to the end of the drill pipe, known as the drill string, to bore into the seabed to reach oil and gas deposit. Drilling fluids, known as muds, are pumped down the drill string during drilling to maintain positive pressure in the well, to cool and lubricate the drill bit, to protect and support the exposed formation in the well and to lift the cuttings from the bottom of the hole to the surface. Drilling fluids are slurry consisting of various solids and additives used to control fluid properties such as density and viscosity. A series of four progressively smaller drill casings
Manuscript received November 19, 2010; revised December 18, 2010. This work was supported under Grants 1001/PMATHS/817024, 1001/PMATHS/817025, 1001/PMATHS/811093 and 302/PMATHS/611897.
H. L. Koh is with the Disaster Research Nexus, School of Civil Engineering, Universiti Sains Malaysia, Engineering Campus, 14300 Nibong Tebal, Penang, Malaysia (phone: 6-04-5996250; fax: 6-04-5941009; e-mail: [email protected]).
S. Y. Teh is with the School of Mathematical Sciences and Disaster Research Nexus, Universiti Sains Malaysia, 11800 Penang, Malaysia (e-mail: [email protected]).
from 22 inches to 8.5 inches is used. The rotating drill bit breaks off pieces of rocks, called drill cuttings, as it penetrates into rock strata. The cuttings typically range in size from coarse gravel to clay. The cuttings size composition varies significantly from site to site, depending on the type of sedimentary rock drilled and the drilling fluids used. The rock cuttings and lubricating drilling muds are lifted from the seabed to the EP platform for adequate treatment and subsequent disposal. The onsite disposal of these muds and cuttings, after proper treatment, requires a permit that involves a series of Environmental Impact Assessments (EIA) to be undertaken to address the potential adverse impacts of the muds and cuttings on the marine environment and on the seabed. Marine lives such as pelagic fish may become exposed to suspended solids and toxic substances. An oxygen demand may also be exerted in the water column and on the seabed, leading to adverse ecological impacts. Cutting deposits of more than 5 cm thick in the vicinity of the well may result in the smothering of benthic organisms mainly of sessile species. Smothering impacts are limited to a small area around the drill well, less than 100 m. Different fauna groups are tolerant to different degree of smothering; for example, burrowing organisms are more tolerant compared to surface living bottom feeders. This paper presents a brief analysis of the formation and heights of cuttings piles on the seabed by means of TUNA-PT model simulations. It will also present a summary on the distribution of suspended sediments in the top water column.
There are two broad categories of drilling fluids used: Water-Based Fluids (WBFs) and Non-Aqueous Drilling Fluids (NADFs). A variety of chemicals is added to both types of fluids to modify the properties of the drilling fluids for optimal operation [1]. Further, NADFs are classified into three broad groups according to the level of aromatic contents and polyaromatic hydrocarbons (PAH) as shown in Table I. Usage of group I NADFs with high aromatic content has been discontinued, in part been replaced by Group II fluids with medium aromatic content and lower toxicity. More recently, Group III fluids with low to negligible aromatic content have been developed to address environmental issues related to overboard discharge and occupational hygiene for drill workers. However, these impacts on the ocean water quality are not thought to present a major concern as NADFs discharges do not readily disperse in water but tend to settle rapidly onto the seabed. Improved NADFs perform better because of higher lubricity, good stability under high temperature and reduced impacts on the marine environment and the seabed. Further, the impacted biological communities recover more rapidly.
Simulation of Drill Cuttings Dispersion and Deposition in South China Sea
Hock Lye Koh and Su Yean Teh
M

Recovery tends to follow a successional recolonization, with colonization initiated by hydrocarbon-tolerant species and opportunistic species that feed on bacteria that metabolized hydrocarbons. Bioaccumulation may be a concern when aquatic organisms accumulate chemical residues in their tissues to levels that can result in toxicity to the aquatic organism or to the consumer of that aquatic organism. Bioaccumulation is the uptake and retention in the tissues of an organism of toxicants from all external sources such as water, food, and substrate. Concentration in the water column is primarily due to drilling fluids since these particles have lower settling velocity and remain suspended in the water column for longer periods of time. In contrast, drill cuttings settle quickly to the seabed. Generally, WBFs are considered less harmful compared to NADFs as the former contains water, rather than oil as its base fluids. However, WBFs may also contain additives (barite) and may include various salts and minerals.
TABLE I
NADF CLASSIFICATION GROUPS AND DESCRIPTIONS [2]
Group Base Fluid Aromatic Content
Aromatic (%) PAH (%)
I Diesel and conventional mineral oil high >5 >0.35
II Low toxicity mineral oil medium 0.5 – 5.0 0.001-0.35
III Enhanced mineral oil and synthetics (esters, olefins and paraffin)
low to negligible <0.5 <0.001
II. APPLICATION OF TUNA When the cuttings are disposed on site, they settle onto
the seabed to form cuttings piles of varying heights and radii, depending on the volume of cuttings disposed and on environmental and climatic conditions, such as tides, waves and storms. Fig. 1 shows the distribution of pile heights (left) and radii (right) for deposited volume of up to 45,000 m3 in the North Sea [3]. The maximum pile heights observed is less than 20 m, while the radius observed is less than 90 m. Equation 1 gives the pile height as a function of pile volume with regression coefficient of R2 = 0.5625. Similarly, Equation 2 gives the pile radius as a function of pile volume with regression coefficient of R2 = 0.2069.
5625.0R
8266.3)(m Volume0003.0(m)Height 2
3
=
+×= (1)
2069.0R
725.42)(m Volume0006.0(m)Height 2
3
=
+×= (2)
Fig. 1. Regression of pile height (left) and pile radius (right) vs. volume. Climatic conditions, tidal hydrodynamic regimes and
cutting characteristics determine the dispersion and
deposition patterns of discharged muds and cuttings. Large and coarse cuttings settle quickly onto the seabed and are deposited near the toe of the drilling platform, typically less than 100 m away. These large particles therefore contribute less suspended solids (SS) in the water column. Fine particles, on the other hand, tend to settle slowly onto the seabed and are more likely to remain suspended longer in the water column as SS, to be carried far away from the disposal site by ocean currents. They therefore tend to be deposited farther away from the toe of the platform, typically more than 200 m away. Strong tidal currents carry the disposed particles away from the disposal site and disperse the particles widely over the ocean. Hence, in an energetic environment with strong currents and strong eddies, the concentration of SS in the water column will be lower and the pile heights on the seabed will also be lower. Conversely, in a calm environment with weak currents and weak eddies, the water column SS will be higher and the seabed pile heights will also be higher. Further, cuttings deposition thickness on the seabed will generally decrease exponentially with distance from the release location, following diffusion theory. Current literature indicates that the settling and dispersion patterns of drill cuttings are highly sensitive to settling velocity of the particles, tidal currents and coastal diffusion, which are highly variable [4, 5]. As a consequence, all simulation models used for this purpose are also highly sensitive to settling velocity, as well as to the ambient marine environment, a view that is constantly being observed in this research.
III. MODEL CALIBRATION BY TUNA-PT Most simulation models used by the oil and gas industry
are proprietary, hence are not readily available to the authors. Hence, an in-house simulation model, based upon the concept of tracking each particle disposed, known as TUNA-PT has been developed for this paper [6, 7] to assess the deposition and dispersion of drill cuttings discharged into the sea from MODU. Following the popular approach adopted by the oil and gas industry, we assume that the particle transport and deposition mechanism follows a mode of movement consisting of advection, diffusion and deposition onto the seabed [8-10]. The strength of horizontal transport and diffusion is a function of the marine hydrodynamic conditions, such as winds, waves, tidal currents and local eddies. The settling velocity depends critically on the particle sizes, in addition to the marine environments mentioned above. The value of tidally averaged horizontal diffusion obtained from previous studies conducted in semi-enclosed Malaysian coastal waters in Penang and Johor is of the order of Ec = 0.1 m2/s in the direction perpendicular to the tidal current flows and Ea = 1.0 m2/s along the current direction [11, 12]. Being open, the South China Sea, however, is a more energetic ocean environment with strong tidal currents and eddies as well as high dispersion. Hence higher values of dispersion will be used in this paper. We proceed to calibrate the model TUNA-PT for two cuttings disposal sites at Heather A and Ninian N in the North Sea, chosen from the data provided in Bell et al. [3], with cuttings dimensions indicated in Table II.

TABLE II
DIMENSIONS OF DEPOSITED DRILL CUTTINGS PILES AT TWO SELECTED SITES [3]
Site Water depth (m)
Pile area (m2)
Pile height (m)
Pile volume
(m3) Pile radius
(m) Heather A 143 11310 19 40000 60 Ninian N 140 11700 15 45000 61
Drill cuttings consist of particles of various sizes, each
with its own settling velocity. Table III provides a summary of drill cuttings particle diameter, density and settling velocity for each of the 10 size classes, each class contributing 10 % in weight [9]. For a typical particle size of diameter 0.1 mm (between class 6 and 7) the settling velocity is 0.01 m/s or 1 cm/s. The depth of water in both sites is about 140 m, implying it would take 4 hours for a particle of diameter of 0.1 mm to settle on the seabed. The cuttings volume deposited in both sites is about 40000 m3, which would require a long duration to accumulate, of the order of a year or two. A typical tide has period of about 12 hours (semi-diurnal) to 24 hours (diurnal). Hence, the settling particles would have gone through many different tidal cycles, over many neap and spring tides. The deposited cuttings formations are therefore the cumulative results of settling that take place over many tidal and environmental conditions. This suggests that a good first approximation would be to adopt the approach that the aggregate settling pattern is governed by particle lateral dispersion or diffusion as the particles settle to the seabed. However, tidal influence on particle dispersion and deposition will be included in subsequent analysis.
TABLE III
CUTTINGS PARTICLE DIAMETER AND SETTLING VELOCITY [9] Size Class
Diameter (mm)
Weight (%)
Density (tonnes/m3)
Velocity (m/s)
Velocity (m/day)
1 0.007 10 2.4 1.90E-05 1.7 2 0.015 10 2.4 8.80E-05 7.6 3 0.025 10 2.4 2.50E-04 21.2 4 0.035 10 2.4 4.80E-04 41.6 5 0.05 10 2.4 9.80E-04 84.9 6 0.075 10 2.4 2.20E-03 191 7 0.2 10 2.4 1.60E-02 1356.5 8 0.6 10 2.4 5.70E-02 4898.9 9 3 10 2.4 2.10E-01 17988.5
10 7 10 2.4 3.20E-01 27483.8 Sum 100
Details regarding the mathematical formulations and
numerical approximations for particle tracking are available elsewhere [6, 7] and hence are omitted. To obtain good simulation results, grid size of Δx = Δy = 1 m is used within a square of 200 m by 200 m, centered at the EP platform location, while larger grid sizes are used outside this inner square. The initial test approximation begins with a simplifying assumption that the particles are grouped into one size class of diameter 0.1 mm, with the settling velocity of 0.01 m/s. Over the duration of settling, the particle would be dispersed or diffused by tidal regimes with an effective diffusion coefficient denoted by D m/s1/2, which is equivalent to the square root of E m2/s. We first consider only effective tidal diffusion D, an approximation that is reasonable in view of the fact that the duration of
accumulation of particle on the seabed (1 year) is much longer than the tidal period (12 hours).
Fig. 2 shows the simulated pile height distribution at Heather A site, considering one particle size of diameter 0.1 mm, settling with velocity of 1 cm/s, and subjected to horizontal diffusion of D = 0.3 m/s1/2 in both x- and y- directions. The top figure refers to the simulation results with 50,000 particles released, while the bottom figure represents the results with 100,000 particles released. Comparison between these two results indicates that 100,000 particles would be adequate to represent a good description of the settling and dispersion of the particles. Hence, to simulate 10 particle sizes, a total of 1 million particles will be used to simulate the settling and dispersion of drill cuttings onto the seabed in this research. The maximum simulated pile height and radius for Heather A site are 18 m and 60 m respectively, which are in good agreement with the measured data shown in Table II. For Ninian N site, the diffusion coefficient is increased slightly to D = 0.35 m/s1/2, in order to match the simulated pile maximum height of 15 m. Fig. 3 depicts simulated pile height (top) and deposited cuttings at Ninian N site in 2D (middle) and 3D (bottom), indicating good agreement with measured data shown in Table II for Ninian N site. It is noted that almost all particles of this size class are deposited within a square of 200 m by 200 m, or within a distance of 100 m from the toe of the EP platform, if all the particles settle onto the seabed with velocity of 1 cm/s. The successful calibration of TUNA-PT for these two sites at Heather A and Ninian N in the North Sea facilitates the application of TUNA-PT to the research site in the South China Sea.
Fig. 2. Pile height at Heather A: 50,000 particles (top) and 100,000 particles (bottom).

Fig. 3. Pile height (top) and deposited cuttings at Ninian N in 2D (middle) and 3D (bottom).
IV. RESULTS AND DISCUSSION The oil and gas EP platform operated by a petroleum
production company (PPC) is located in the South China Sea, about 100 km offshore of Sabah of Malaysia. A total of 8 EP wells will be drilled, each well producing 1000 m3 of cuttings, with their size and settling velocity distribution given in Table III. The 8 wells are uniformly distributed along a circle with radius of 14 m. First, we begin the test simulation with the cuttings grouped into one size class of diameter of 0.1 mm, with a total discharge volume of 8000 m3, disposed at one single location at sea surface. With this consideration, Fig. 4 shows the simulated pile height distribution for cuttings deposited on the seabed, with a depth of 150 m at the PPC site, with the diffusion coefficient of D = 0.35 m/s1/2 and with no tidal currents considered. With settling velocity of 1 cm/s, cuttings pile reaches a maximum height of about 2.25 m and a radius of 60 m; all particles settle onto the seabed within a distance of less than 100 m from the platform.
Fig. 4. Pile height (top) and deposited cuttings at PPC in 2D (middle) and 3D (bottom).
Next, we consider realistic cuttings disposal scenarios to
arrive at realistic assessment of pile formation on the seabed. The cuttings are discharged at sea surface, right above the 8 wells which are uniformly distributed in a circle (Fig. 5, middle). The cuttings consist of 10 particle size classes with diameter and settling velocity indicated in Table III. The diffusion coefficient is D = 0.35 m/s1/2, and the tidal currents are considered to be replaced by the net diffusion D, following the reasoning indicated earlier. The maximum pile height simulated under this scenario is 2.3 m, while the pile radius is 45 m. Fig. 5 illustrates the pile heights on the seabed (top), the deposited particles on the seabed in 2D (middle) and in 3D (bottom). The maximum heights simulated display a circular ring formation, reflecting the circular pattern of the EP wells. Particles of size classes between group 1 and group 5 are small particles that are carried farther away from the platform than the larger particles between classes 6 to 10. These small particles are carried by currents as SS and will settle on the seabed farther away from the platform. Simulation results indicate that 50 % of the drill cuttings will settle on the seabed within a radius of 100 m from the platform toe, while the remaining 50 % are carried as SS in the water column.
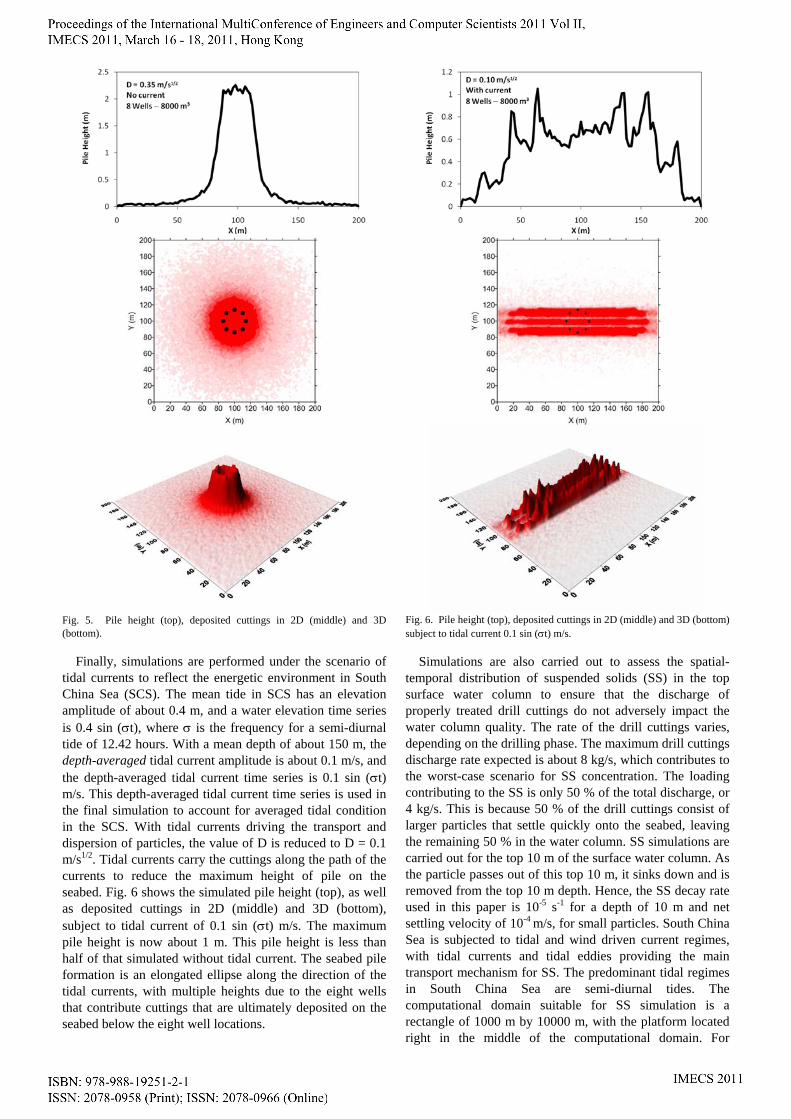
Fig. 5. Pile height (top), deposited cuttings in 2D (middle) and 3D (bottom).
Finally, simulations are performed under the scenario of tidal currents to reflect the energetic environment in South China Sea (SCS). The mean tide in SCS has an elevation amplitude of about 0.4 m, and a water elevation time series is 0.4 sin (σt), where σ is the frequency for a semi-diurnal tide of 12.42 hours. With a mean depth of about 150 m, the depth-averaged tidal current amplitude is about 0.1 m/s, and the depth-averaged tidal current time series is 0.1 sin (σt) m/s. This depth-averaged tidal current time series is used in the final simulation to account for averaged tidal condition in the SCS. With tidal currents driving the transport and dispersion of particles, the value of D is reduced to D = 0.1 m/s1/2. Tidal currents carry the cuttings along the path of the currents to reduce the maximum height of pile on the seabed. Fig. 6 shows the simulated pile height (top), as well as deposited cuttings in 2D (middle) and 3D (bottom), subject to tidal current of 0.1 sin (σt) m/s. The maximum pile height is now about 1 m. This pile height is less than half of that simulated without tidal current. The seabed pile formation is an elongated ellipse along the direction of the tidal currents, with multiple heights due to the eight wells that contribute cuttings that are ultimately deposited on the seabed below the eight well locations.
Fig. 6. Pile height (top), deposited cuttings in 2D (middle) and 3D (bottom) subject to tidal current 0.1 sin (σt) m/s.
Simulations are also carried out to assess the spatial-temporal distribution of suspended solids (SS) in the top surface water column to ensure that the discharge of properly treated drill cuttings do not adversely impact the water column quality. The rate of the drill cuttings varies, depending on the drilling phase. The maximum drill cuttings discharge rate expected is about 8 kg/s, which contributes to the worst-case scenario for SS concentration. The loading contributing to the SS is only 50 % of the total discharge, or 4 kg/s. This is because 50 % of the drill cuttings consist of larger particles that settle quickly onto the seabed, leaving the remaining 50 % in the water column. SS simulations are carried out for the top 10 m of the surface water column. As the particle passes out of this top 10 m, it sinks down and is removed from the top 10 m depth. Hence, the SS decay rate used in this paper is 10-5 s-1 for a depth of 10 m and net settling velocity of 10-4 m/s, for small particles. South China Sea is subjected to tidal and wind driven current regimes, with tidal currents and tidal eddies providing the main transport mechanism for SS. The predominant tidal regimes in South China Sea are semi-diurnal tides. The computational domain suitable for SS simulation is a rectangle of 1000 m by 10000 m, with the platform located right in the middle of the computational domain. For

convenience of presentation, the computational domain is oriented in the x and y direction, with the tidal current flowing in the y-direction. The computational domain must be sufficiently large to fully contain the SS plume within it. This is necessary in order to avoid imposition of complicated boundary conditions. The tidal condition for the surface currents used in the simulation are given by u = 0.3 sin (σt) m/s and v = 0.0 m/s, whereby σ is the semi-diurnal tide period of 12.42 hours. This choice of lower tidal current constitutes a worst-case scenario. For higher tidal current amplitudes, the computational domain must be enlarged in order to fully contain the SS plume within it. For convenience of presentation, the tidal period is simplified to 12.00 hours. The surface dispersion coefficients for both along-flow and cross-flow directions assumed in the simulations are respectively Ea = 5.0 m2/s and Ec = 1.0 m2/s.
0500
1000t = 1 hour
0500 t = 2 hour
0500 t = 3 hour
0500 t = 4 hour
0500 t = 5 hour
0500 t = 6 hour
0500 t = 7 hour
0500
Y (m
)
t = 8 hour
0500 t = 9 hour
0500 t = 10 hour
0500 t = 11 hour
0500 t = 12 hour
0500 t = 13 hour
0500 t = 14 hour
0500 t = 15 hour
0 2000 4000 6000 8000 100000
500 t = 16 hour
SS
(mg/
L)
X (m)
0
50
100
0
50
100
0
50
100
0
50
100
0
50
100
0
50
100
0
50
100
0
50
100
0
50
100
0
50
100
0
50
100
0
50
100
0
50
100
0
50
100
0
50
100
0
50
100
0
100
100
100
100
100
100
100
100
100
100
100
100
100
100
100
100
Fig. 7. Contour (left) and cross-sectional (right) plots of simulated SS concentration in surface water.
Simulation runs are carried out for 24 hours, representing
two complete tidal cycle to achieve steady state solution. However, steady state is achieved after only one tidal cycle. A good correlation is observed between the SS concentration and the phases of the tidal cycle. Higher SS concentration prevails during slack tide with minimal currents. Conversely, lower SS concentrations prevail during peak flood or peak ebb tide, with strong currents to carry the SS farther away, thus diluting the SS. Fig. 7 (left) displays a series of SS contour plots at intervals of 1 hour for a total of 16 hours to cover the entire tidal cycle of 12 hours plus a further 4 hours. To assess the transience or persistence of SS, the discharge of drill cutting is discontinued at hour 12, with simulation continuing up to hour 16. The series of curves on the right indicate the distributions of SS along the SS plume center line in the flow direction. The maximum SS concentration is about 110 mg/l, located at the point of discharge. The results show that SS concentrations drop quickly to zero two hours after the cessation of discharge. This implies that the water column SS is transient, or non-persistent. Once the discharge is stopped, the SS will quickly drop to background levels after two hours. Hence any impacts due to SS are only temporary and will not last more than two hours after this discontinuation of drill cutting discharge.
V. CONCLUSION This paper presents a brief summary of the environmental
impact on the seabed biological communities due to the accumulation of disposed oil and gas drill cuttings on the seabed. Model simulations by means of TUNA-PT are then performed to estimate the pile height distributions on the sea floor, subject to tidal hydrodynamic regimes and cuttings particle sizes. Out of a total of 8000 m3 of drill cuttings disposed from the platform, 50 % are deposited in the vicinity of the platform, within a radius of 50 m. The remaining 50 % contributes to surface suspended sediments. Simulated pile heights may achieve a maximum height between 1 m to 2 m, depending on the strength of dispersion provided by tidal currents and eddies. Surface SS concentration may achieve a maximum value of 110 mg/l at the point of discharge, but drops rapidly to low values away from the source. Further, the surface SS is non-persistent, dropping to background levels after two hours of cessation of discharge.
REFERENCES [1] OGP, “Environmental aspects of the use and disposal of non aqueous
drilling fluids associated with offshore oil & gas operations”, Report no. 342, International Association of Oil & Gas Producers, London, UK, 2003.
[2] ERM, “Ghana Jubilee Field Phase 1 Development: Environmental Impact Statement”, Submitted by Tullow Ghana Limited on 27 November 2009. Mark Irvine, Albert de Jong and AK Armah (Lead Authors), Environmental Resources Management, 2009, Available online at http://www.erm.com/Public-Information-Sites1/Tullow-Jubilee/.
[3] N. Bell, S.J. Cripps, T. Jacobsen, G. Kjeilan and G.B. Picken, “Review of drill cuttings piles in the North Sea”, Cordah, UK, 1998.
[4] L.J. Carles and I.G. Bryden, ”The sensitivity of a dispersion model to cuttings settling speeds”, Society of Underwater technology Journal 24, 1999, 19-24.
[5] H. Niu, A. Drozdowski, T. Husain, B. Veitch, N. Bose and K. Lee, “Modeling the dispersion of drilling muds using the bblt model: the effects of settling velocity”, Environmental Modeling and Assessment 14(5), 2009, 585-594.
[6] H.L. Koh, S.Y. Teh, A.A. Hamidi, D.L. DeAngelis and J. Jiang, “Modeling particle deposition on off-shore seabed by TUNA-DP”, Proceeding of South China Sea Tsunami Workshop 3 (SCSTW3), 3-5 November 2009, Penang, Malaysia, Koh Hock Lye, Philip L.-F. Liu and Teh Su Yean (Eds.), Penerbit USM (in press).
[7] S.Y. Teh, H.L. Koh, A.A. Hamidi, D.L. DeAngelis and J. Jiang, “Particle Tracking Model TUNA-PT”, Proceeding of South China Sea Tsunami Workshop 3 (SCSTW3), 3-5 November 2009, Penang, Malaysia, Koh Hock Lye, Philip L.-F. Liu and Teh Su Yean (Eds.), Penerbit USM (in press).
[8] H. Rye, M. Reed and N. Ekrol, “The PARTRACK model for calculation of spreading and deposition of drilling mud, chemicals and drill cuttings”, Environmental Modelling & Software 13, 1998, 431-441.
[9] H. Rye, M. Reed, T.K. Frost and T.I.R. Utvik, “Comparison of the ParTrack mud/cuttings release model with field data based on use of synthetic-based drilling fluids”, Environmental Modelling & Software 21(2), 2006, 190–203.
[10] I. Eames, B. de Leeuw and P. Coniff, “Formation and remediation of drill cutting piles in the North Sea”, Environmental Geology 41, 2002, 504-524.
[11] H.L. Koh, P.E. Lim and Z. Midun, “Management and control of pollution in Inner Johore Strait”, Environmental Monitoring and Assessment 19, 1991, 349-359.
[12] H.L. Koh, P.E. Lim and H.L. Lee, “Impact modeling of sewage discharge from Georgetown of Penang, Malaysia on coastal water quality”, Journal Environmental Monitoring and Assessment 44, 1997, 199-209.