simulation of deep surge in a turbocharger compression system
TRANSCRIPT
Rick DehnerDepartment of Mechanical and
Aerospace Engineering,
The Ohio State University,
Columbus, OH 43210
e-mail: [email protected]
Ahmet SelametDepartment of Mechanical and
Aerospace Engineering,
The Ohio State University,
Columbus, OH 43210
e-mail: [email protected]
Philip KellerBorgWarner, Inc.,
Auburn Hills, MI 48326
Michael BeckerBorgWarner, Inc.,
Ludwigsburg 71636, Germany
Simulation of Deep Surgein a TurbochargerCompression SystemLarge-amplitude deep surge instabilities are studied in a turbocharger compression sys-tem with a one-dimensional (1D) engine simulation code. The system consists of anupstream compressor duct open to ambient, a centrifugal compressor, a downstreamcompressor duct, a large plenum, and a throttle valve exhausting to ambient. As the com-pressor mass flow rate is reduced below the peak pressure ratio for a given speed, mildsurge oscillations occur at the Helmholtz resonance of the system, and a further reduc-tion in flow rate results in deep surge considerably below the Helmholtz resonance. Atthe boundary with mild surge, the deep surge cycles exhibit, for the particular systemconsidered, a long cycle period containing four distinct flow phases, including quiet(stable), instability growth (mild surge), blowdown (reversal), and recovery. Furtherreductions in flow rate decrease the deep surge cycle period, eliminate the quiet flowphase, and shorten the duration of the instability growth phase. Simulated oscillations ofnondimensional flow rate, pressure, and speed parameters show good agreement with theexperimental results available in literature, in terms of deep surge cycle flow phasesalong with the amplitude and frequency of the resulting fluctuations. The predictionsillustrate that the quiet and instability growth phases, exhibited by this compression sys-tem, disappear as the plenum volume is substantially reduced. [DOI: 10.1115/1.4033260]
1 Introduction
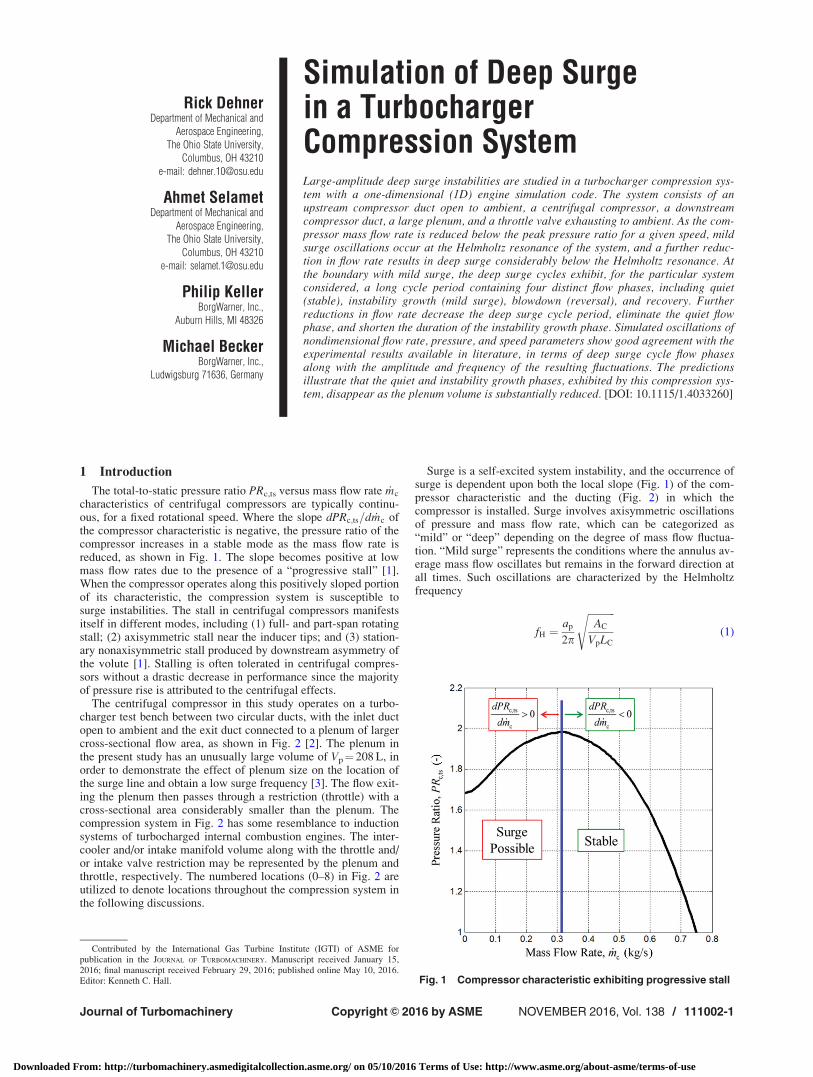
The total-to-static pressure ratio PRc,ts versus mass flow rate _mc
characteristics of centrifugal compressors are typically continu-ous, for a fixed rotational speed. Where the slope dPRc;ts=d _mc ofthe compressor characteristic is negative, the pressure ratio of thecompressor increases in a stable mode as the mass flow rate isreduced, as shown in Fig. 1. The slope becomes positive at lowmass flow rates due to the presence of a “progressive stall” [1].When the compressor operates along this positively sloped portionof its characteristic, the compression system is susceptible tosurge instabilities. The stall in centrifugal compressors manifestsitself in different modes, including (1) full- and part-span rotatingstall; (2) axisymmetric stall near the inducer tips; and (3) station-ary nonaxisymmetric stall produced by downstream asymmetry ofthe volute [1]. Stalling is often tolerated in centrifugal compres-sors without a drastic decrease in performance since the majorityof pressure rise is attributed to the centrifugal effects.
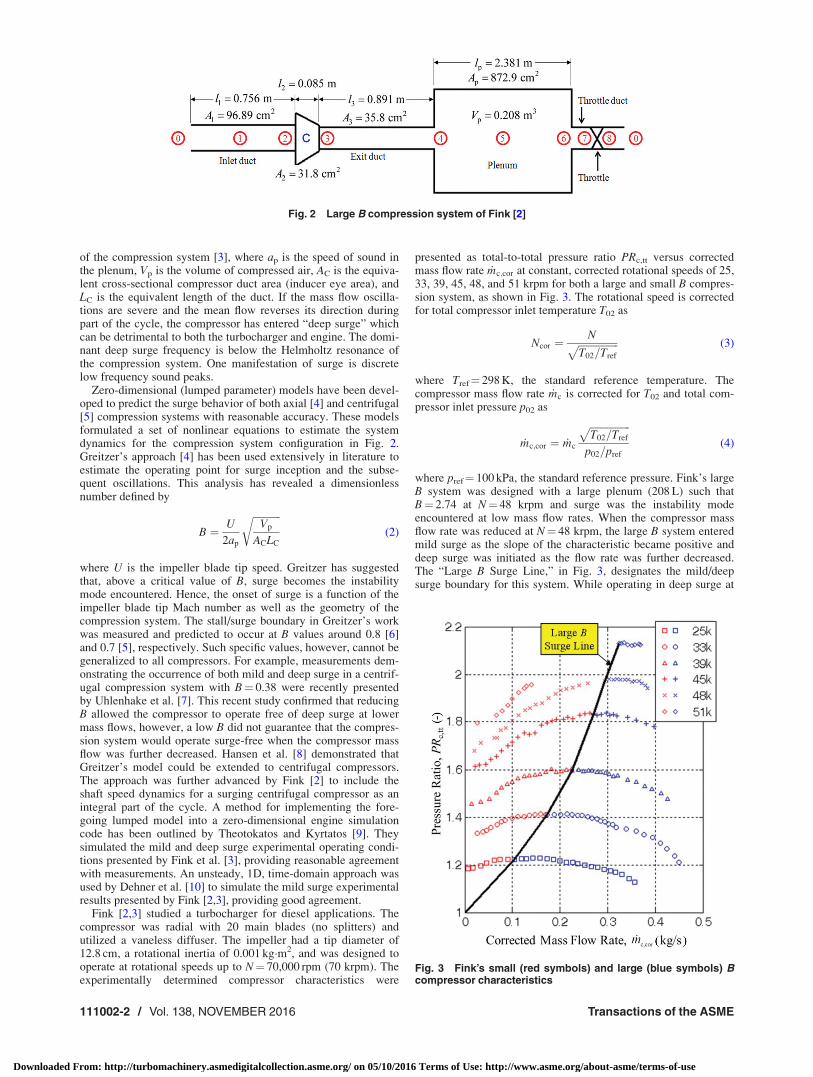
The centrifugal compressor in this study operates on a turbo-charger test bench between two circular ducts, with the inlet ductopen to ambient and the exit duct connected to a plenum of largercross-sectional flow area, as shown in Fig. 2 [2]. The plenum inthe present study has an unusually large volume of Vp¼ 208 L, inorder to demonstrate the effect of plenum size on the location ofthe surge line and obtain a low surge frequency [3]. The flow exit-ing the plenum then passes through a restriction (throttle) with across-sectional area considerably smaller than the plenum. Thecompression system in Fig. 2 has some resemblance to inductionsystems of turbocharged internal combustion engines. The inter-cooler and/or intake manifold volume along with the throttle and/or intake valve restriction may be represented by the plenum andthrottle, respectively. The numbered locations (0–8) in Fig. 2 areutilized to denote locations throughout the compression system inthe following discussions.
Surge is a self-excited system instability, and the occurrence ofsurge is dependent upon both the local slope (Fig. 1) of the com-pressor characteristic and the ducting (Fig. 2) in which thecompressor is installed. Surge involves axisymmetric oscillationsof pressure and mass flow rate, which can be categorized as“mild” or “deep” depending on the degree of mass flow fluctua-tion. “Mild surge” represents the conditions where the annulus av-erage mass flow oscillates but remains in the forward direction atall times. Such oscillations are characterized by the Helmholtzfrequency
fH ¼ap
2p
ffiffiffiffiffiffiffiffiffiffiffiAC
VpLC
s(1)
Fig. 1 Compressor characteristic exhibiting progressive stall
Contributed by the International Gas Turbine Institute (IGTI) of ASME forpublication in the JOURNAL OF TURBOMACHINERY. Manuscript received January 15,2016; final manuscript received February 29, 2016; published online May 10, 2016.Editor: Kenneth C. Hall.
Journal of Turbomachinery NOVEMBER 2016, Vol. 138 / 111002-1Copyright VC 2016 by ASME
Downloaded From: http://turbomachinery.asmedigitalcollection.asme.org/ on 05/10/2016 Terms of Use: http://www.asme.org/about-asme/terms-of-use
of the compression system [3], where ap is the speed of sound inthe plenum, Vp is the volume of compressed air, AC is the equiva-lent cross-sectional compressor duct area (inducer eye area), andLC is the equivalent length of the duct. If the mass flow oscilla-tions are severe and the mean flow reverses its direction duringpart of the cycle, the compressor has entered “deep surge” whichcan be detrimental to both the turbocharger and engine. The domi-nant deep surge frequency is below the Helmholtz resonance ofthe compression system. One manifestation of surge is discretelow frequency sound peaks.
Zero-dimensional (lumped parameter) models have been devel-oped to predict the surge behavior of both axial [4] and centrifugal[5] compression systems with reasonable accuracy. These modelsformulated a set of nonlinear equations to estimate the systemdynamics for the compression system configuration in Fig. 2.Greitzer’s approach [4] has been used extensively in literature toestimate the operating point for surge inception and the subse-quent oscillations. This analysis has revealed a dimensionlessnumber defined by
B ¼ U
2ap
ffiffiffiffiffiffiffiffiffiffiffiVp
ACLC
r(2)
where U is the impeller blade tip speed. Greitzer has suggestedthat, above a critical value of B, surge becomes the instabilitymode encountered. Hence, the onset of surge is a function of theimpeller blade tip Mach number as well as the geometry of thecompression system. The stall/surge boundary in Greitzer’s workwas measured and predicted to occur at B values around 0.8 [6]and 0.7 [5], respectively. Such specific values, however, cannot begeneralized to all compressors. For example, measurements dem-onstrating the occurrence of both mild and deep surge in a centrif-ugal compression system with B¼ 0.38 were recently presentedby Uhlenhake et al. [7]. This recent study confirmed that reducingB allowed the compressor to operate free of deep surge at lowermass flows, however, a low B did not guarantee that the compres-sion system would operate surge-free when the compressor massflow was further decreased. Hansen et al. [8] demonstrated thatGreitzer’s model could be extended to centrifugal compressors.The approach was further advanced by Fink [2] to include theshaft speed dynamics for a surging centrifugal compressor as anintegral part of the cycle. A method for implementing the fore-going lumped model into a zero-dimensional engine simulationcode has been outlined by Theotokatos and Kyrtatos [9]. Theysimulated the mild and deep surge experimental operating condi-tions presented by Fink et al. [3], providing reasonable agreementwith measurements. An unsteady, 1D, time-domain approach wasused by Dehner et al. [10] to simulate the mild surge experimentalresults presented by Fink [2,3], providing good agreement.
Fink [2,3] studied a turbocharger for diesel applications. Thecompressor was radial with 20 main blades (no splitters) andutilized a vaneless diffuser. The impeller had a tip diameter of12.8 cm, a rotational inertia of 0.001 kg�m2, and was designed tooperate at rotational speeds up to N¼ 70,000 rpm (70 krpm). Theexperimentally determined compressor characteristics were
presented as total-to-total pressure ratio PRc,tt versus correctedmass flow rate _mc;cor at constant, corrected rotational speeds of 25,33, 39, 45, 48, and 51 krpm for both a large and small B compres-sion system, as shown in Fig. 3. The rotational speed is correctedfor total compressor inlet temperature T02 as
Ncor ¼Nffiffiffiffiffiffiffiffiffiffiffiffiffiffiffiffi
T02=Tref
p (3)
where Tref¼ 298 K, the standard reference temperature. Thecompressor mass flow rate _mc is corrected for T02 and total com-pressor inlet pressure p02 as
_mc;cor ¼ _mc
ffiffiffiffiffiffiffiffiffiffiffiffiffiffiffiffiT02=Tref
pp02=pref
(4)
where pref¼ 100 kPa, the standard reference pressure. Fink’s largeB system was designed with a large plenum (208 L) such thatB¼ 2.74 at N¼ 48 krpm and surge was the instability modeencountered at low mass flow rates. When the compressor massflow rate was reduced at N¼ 48 krpm, the large B system enteredmild surge as the slope of the characteristic became positive anddeep surge was initiated as the flow rate was further decreased.The “Large B Surge Line,” in Fig. 3, designates the mild/deepsurge boundary for this system. While operating in deep surge at
Fig. 2 Large B compression system of Fink [2]
Fig. 3 Fink’s small (red symbols) and large (blue symbols) Bcompressor characteristics
111002-2 / Vol. 138, NOVEMBER 2016 Transactions of the ASME
Downloaded From: http://turbomachinery.asmedigitalcollection.asme.org/ on 05/10/2016 Terms of Use: http://www.asme.org/about-asme/terms-of-use

the border with mild surge, the compressor surge cycles consist offour distinct flow phases, including quiet (stable), instabilitygrowth (mild surge), blowdown (flow reversal), and recovery. Asthe time-averaged compressor flow rate was further reduced (byreducing the throttle flow area) the quiet period was eliminatedfrom the deep surge cycles and the duration of the instabilitygrowth phase decreased.
The small B compression system minimized the volume ofcompressed air by eliminating the plenum and placed the throttlevalve just downstream of the compressor exit, giving B¼ 0.25 (atN¼ 48 krpm). This small B system was capable of operating with-out deep surge [3] at mass flow rates significantly lower than thatof the large B system, as shown in Fig. 3. To the right of the LargeB Surge Line, the characteristics are identical, indicating that thecompressor characteristics are independent of the compressionsystem ducting (a property of the compressor alone), yet thecoupled compression system (compressor, ducting, and throttle)dictates the stable portion of the map available for use (location ofthe surge line).
Mild surge simulation results were presented by Dehner et al.[10], which showed good agreement with the experimental resultsof Fink [2,3], in terms of time-averaged operating pointalong with the amplitude and frequency of oscillations. The studydeveloped a compressor map preprocessor to extrapolate andinterpolate the compressor data to cover the entire forward flowoperating region. This map was input to a 1D model of Fink’slarge B compression system ducting in order to provide the neces-sary compressor performance information. Incorporating the surgeprediction capability into 1D code allowed many of the simplify-ing assumptions of the lumped analyses to be eliminated, andimproved the agreement of simulations with experiments. In addi-tion, a detailed analysis of the fluctuating pressure, temperature,and mass flow rate was provided at key compression systemlocations.
The objective of the present study is to reproduce the unsteadydeep surge physics observed experimentally by Fink [2,3], using a1D time-domain approach. The large B compression systemducting from the turbocharger test bench of Fink is modeled usinga commercially available engine simulation code [11]. A sche-matic of the compression system geometry is shown in Fig. 2. Thesteady-state compressor data (recall Fig. 3) is preprocessed usinga MATLAB script and incorporated into the model as a text filewhich provides the compressor performance information. Thisinvestigation focuses on predicting the compressor deep surgeflow phases (quiet, instability growth, blowdown, and recovery)along with the amplitude and frequency of the resultingoscillations.
Following this introduction, Sec. 2 describes the compressormap and the 1D compression system model. Simulation resultsfrom the present study are then compared with the experimentalobservations of Fink [2] in Sec. 3. Section 4 provides insight intothe factors contributing to the occurrence of the unusual quiet andinstability growth deep surge flow phases exhibited by this com-pression system. Finally, concluding remarks are presented inSec. 5.
2 Compression System Model
The compression system surge was modeled by incorporating anumber of significant modifications to the compressor characteri-zation of a commercially available, quasi 1D engine simulationcode [11]. The ducting (compressor inlet, compressor outlet, ple-num, and throttle ducts) geometry of the large B turbochargerbench compression system is defined in the model by connectingstraight, circular cross section pipes with the exact dimensions ofthe experimental setup [2]. These ducts are discretized into controlvolumes which are 40 mm in length, and the code solves the non-linear balance equations of mass, momentum, and energy in thetime domain for each cell. The upstream opening of the compres-sor inlet duct and the downstream opening of the throttle duct are
connected to identical temperature and pressure boundary condi-tions of 298 K and 1 bar, respectively. The throttle (valve) restric-tion is modeled as a circular orifice, and the diameter is adjustedto change the compressor operating point. Section 3 comparespredictions to experimental deep surge data at four different com-pressor operating points, and a change in orifice (throttle)diameter is the primary factor among the provided predictionresults (except when explicitly stated in Sec. 3.4). Identical to theexperimental method of Fink [2], the turbine drive torque of themodel was also reduced for the shorter duration (1.22 and 0.68 s)deep surge cycles, in order to maintain a constant time-averagedrotational speed.
The compressor portion of the model consists of a 0D table(actuator disk) providing the steady-state compressor perform-ance, along with two additional ducts representative of the keygeometrical features of the compressor. The first of these“equivalent compressor geometry” ducts represents the geometryof the compressor from the inlet duct connection to the impelleroutlet, and it is positioned between the compressor inlet duct andthe actuator disk. The second duct, positioned between the actua-tor disk and the compressor outlet duct, represents the geometryof the diffuser and volute. Both equivalent compressor geometryducts are straight with circular cross sections, and their dimen-sions (diameter and length) are defined to preserve the length ofthe mean flow path and volume of the compressor. By includingthe key geometrical dimensions (length and volume) of the com-pressor, the predictions are improved during unsteady operationbecause the distance for pressure wave propagation and volumefor mass storage are preserved.
The actuator disk portion of the compressor model is based onthe steady-state performance data (recall Fig. 3) from both thesmall and large B systems of Fink. A compressor map preproces-sor [10,12,13] was developed to extrapolate constant, correctedspeed experimental data to choke (PR¼ 1), zero mass flow rate,reverse flow, and to zero speed. The positively sloped portion ofthe compressor constant speed lines is critical to properly predictcompression system surge, and this region is well defined by theextended low-flow range experimental data from the small B com-pression system. This low-flow data was extrapolated to zeromass flow rate by utilizing the radial equilibrium theory andassuming an isentropic process [9] to approximate the pressureratio as
PR0 ¼ CPR 1þ c� 1
2cRT2
x2 r22 � r2
1
� �� � cc�1
(5)
where CPR is a constant multiplier, c is the ratio of specific heats,R is the gas constant for air, T2 is the compressor inlet tempera-ture, x is the angular velocity of the impeller, r2 is the radius ofthe exducer tip, and
r1 ¼
ffiffiffiffiffiffiffiffiffiffiffiffiffiffiffiffiffiffir2
1;t þ r21;h
2
s(6)
is the mean geometric radius of the impeller eye, which dividesthe impeller eye area into two sections of equal area, with r1,t andr1,h being the radii of the inducer tip and hub, respectively. For thepresent study, a CPR value slightly larger than unity was appliedto PR0 in Eq. (5) to better match the experimental data, as shownin Fig. 4. This multiplier was 1.04 for the lowest speed (25 krpm)and 1.09 for the highest compressor speed (51 krpm). The pres-sure ratio versus flow rate characteristics were estimated in thereverse flow operating region by a quadratic function [7], which isdefined such that it is continuous with the forward flow data withzero slope at the intercept ( _m ¼ 0). Additional information regard-ing extrapolation and interpolation within the forward flow regionof the compressor was previously provided [10], so the remainderof the present description will primarily focus on steady-statecompressor performance during flow reversal.
Journal of Turbomachinery NOVEMBER 2016, Vol. 138 / 111002-3
Downloaded From: http://turbomachinery.asmedigitalcollection.asme.org/ on 05/10/2016 Terms of Use: http://www.asme.org/about-asme/terms-of-use

The compressor efficiency and power are used interchangeablyto define the temperature change through the compressor and therate of shaft work, since adiabatic operation is assumed for thecompressor. During forward flow, the more familiar isentropicefficiency is utilized, as shown in Fig. 4, and compressor power ispreferred within the reverse flow region, as shown in Fig. 5, sincethe standard definition of efficiency becomes negative (eventhough the compressor is still doing work on the air). The reverseflow compressor power is approximated from the forward flownondimensional torque
Cc ¼sc
q0Acr2U2¼
_mccpT02
xgc;tt
PRc�1c
c;tt � 1
� �q0Acr2U2
(7)
where sc is the torque driving the compressor, q0 is the density ofair at ambient conditions, cp is specific heat of air at constant pres-sure, T02 is the total inlet temperature, and gc,tt is the total-to-totalisentropic efficiency of the compressor. When the nondimensionaltorque is plotted against compressor flow coefficient (nondimen-sional mass flow rate)
/c ¼Cx;2
U¼ _mc
q2ACU(8)
the data at all rotational speeds nearly collapses on a single curve,where Cx,2 and q2 are the axial velocity and density at thecompressor inlet, respectively. The Cc versus /c data provides aconvenient means for extrapolating compressor isentropic effi-ciency to zero mass flow rate by applying a quadratic fit that inter-sects the intercept (/c¼ 0) at Cc¼ 0, and the nondimensionaltorque during reverse flow is estimated from the forward fits as afraction (0.16 here) of the mirror image over /c¼ 0 (refer toRef. [13] for further details).
In order to incorporate nonzero compressor power during flowreversal, the current study applies a power to the turbochargershaft. The magnitude of the applied power is determined as afunction of the corrected mass flow rate and pressure ratio bymeans of a lookup table utilizing data from the reverse flow por-tion of Fig. 5. The energy which is transferred from the impellerto the air during reverse flow is accounted for as a source term,which is applied to the energy conservation equation for the firstcontrol volume in the equivalent compressor exit duct neighboringthe compressor (refer to Ref. [12] for additional details).
After the preprocessor extrapolates the experimental data tocover the entire forward and reverse flow operating range, it inter-polates the data at intermediate rotational speeds and writes theinformation to a file with the correct format to be used directly bythe 0D compressor object (actuator disk) of the engine simulationcode.
3 Deep Surge Simulation Results
The simulations in the current study are aimed at reproducingthe experimental deep surge observations from Fink’s [2,3] largeB compression system. Fink presents his experimental surgeresults at a time-averaged, corrected rotational speed of 48 krpm(Mat,0¼ 0.92). During mild surge, the /c data fluctuates about atime mean value of 0.23 with an amplitude of 20% of the meanflow, and the dominant frequency of oscillations is reported as7.3 Hz. Starting at this mild surge operating point, a slight reduc-tion in flow rate produced deep surge with a cycle period ofTDS¼ 3.6 s, including quiet, instability growth, blowdown, andrecovery flow phases, as shown in Fig. 6. The flow coefficient inFig. 6 is based on velocity measurements from a hotwire anemom-eter, which is insensitive to flow direction. In order to distinguishbetween forward and reverse flow, Fink applied a mass balance tothe plenum volume to estimate the compressor mass flow rate andtherefore flow coefficient. The flow coefficient derived from theplenum mass balance in Fig. 6 confirms that the flow is indeedreversed during the blowdown phase. Fink provided results fromthe plenum mass balance to differentiate the flow direction in thetime domain only for the TDS¼ 3.6 s case in Fig. 6, making it thesingle reverse flow experimental result in the time domain to com-pare with predictions. A simulated /c from the present study, withTDS¼ 3.6 s, is presented in Fig. 7 and exhibits a reasonable agree-ment with the experimental results in Fig. 6. The minimum /c ispredicted as �0.158, which appears to agree closely with that esti-mated by applying the plenum mass balance to measurements.During the recovery phase, the maximum /c is predicted to reach0.383, which lies between the hotwire and plenum mass balancevalues from the measurement. During the quiet and instabilitygrowth phases, the estimated compressor flow coefficient from theplenum mass balance is nearly identical to that obtained from thehotwire velocity measurement, as shown in Fig. 6. However, themaximum hotwire measurement during the recovery phase islower than the plenum mass balance estimation.
The experimental observations of Fink [2] demonstrated thatTDS decreased and the flat “quiet” period in Fig. 6 was eliminatedas the throttle flow area (rate) was further reduced. He presentedthree deep surge operating points with TDS¼ 3.0, 1.24, and 0.70 s,including time-resolved fluctuations of /c along with two addi-tional nondimensional parameters (impeller exit tip Mach NumberMat,0 and plenum isentropic head coefficient wp). The plenumisentropic head coefficient is defined as
Fig. 4 Map of Fink’s [2] compressor used for the model
Fig. 5 Power absorbed by the compressor of Fink [2]
111002-4 / Vol. 138, NOVEMBER 2016 Transactions of the ASME
Downloaded From: http://turbomachinery.asmedigitalcollection.asme.org/ on 05/10/2016 Terms of Use: http://www.asme.org/about-asme/terms-of-use

Fig. 7 Predicted compressor flow coefficient with TDS 5 3.6 s
Fig. 8 Deep surge experimental data of Fink [2] with TDS 5 3.0 s
Fig. 6 Compressor flow coefficient calculated from the hotwire velocity measurement andplenum mass balance with TDS 5 3.6 s, from Fink [2]
Journal of Turbomachinery NOVEMBER 2016, Vol. 138 / 111002-5
Downloaded From: http://turbomachinery.asmedigitalcollection.asme.org/ on 05/10/2016 Terms of Use: http://www.asme.org/about-asme/terms-of-use

wp ¼P c�1ð Þ=c
p � 1
c� 1ð ÞMa2t;0
(9)
where
Pp ¼p05
p0
(10)
is the nondimensional plenum pressure, p05 being the total pres-sure in the plenum and p0 the pressure at ambient conditions, and
Mat;0 ¼U
a0
(11)
is the impeller exit tip Mach number, with a0 being the speed ofsound at ambient conditions. The 1D model will be used next tosimulate each of these operating conditions for comparison withexperimental observations.
3.1 Deep Surge With TDS 5 3.0 s. Starting at the TDS¼ 3.6 soperating point (Fig. 6), a slight decrease in throttle area reducesTDS to 3.0 s with a time-averaged flow coefficient �/c ¼ 0:225, asshown in Fig. 8. There are also four regions of flow in the 3.0 sdeep surge cycle. The “quiet” region in /c occurs between points1 and 2, where Mat,0 is increasing and /c is decreasing slightly asthe compression system approaches the stable/mild surge bound-ary (stability limit). After the compressor stability limit is crossedat point 2, the compressor enters the “instability growth” phaseand operates in mild surge with a frequency of approximately 7Hz. The mild surge oscillations are also observable (to a lesserextent) in the Mat,0 and wp traces. The mild surge fluctuationscontinue to grow until the beginning of the “blowdown” phase atpoint 3, where the flow reverses. Once again, the flow coefficientin Fig. 8 is based on the velocity measurements from the hotwireanemometer, but a corresponding plenum mass balance analysisis not provided by Fink. Since the flow is reversed during theblowdown period and the velocity measurement was transparentto the flow direction, the maximum /c during this phase (atpoint 4) in fact represents the minimum value. During the
Fig. 9 Deep surge prediction with TDS 5 3.0 s
Fig. 10 Experimental time-resolved large B compressor datawith TDS 5 3.0 s and small B time-averaged data of Fink et al. [3]
Fig. 11 Predicted time-resolved large B nondimensional com-pressor and plenum operating points with TDS 5 3.0 s alongwith small B data of Fink et al. [3]
111002-6 / Vol. 138, NOVEMBER 2016 Transactions of the ASME
Downloaded From: http://turbomachinery.asmedigitalcollection.asme.org/ on 05/10/2016 Terms of Use: http://www.asme.org/about-asme/terms-of-use

blowdown period, Mat,0 increases at a faster rate due to the lowerreverse flow compressor power, and wp decreases rapidly due toflow exiting the plenum through both the compressor and thethrottle valve. At point 5, the flow accelerates rapidly back to theforward direction during the “recovery” period, then /c reaches amaximum value at point 6. Next, /c decreases and wp increases asthe operating point moves toward the quiet period (point 1) andthe cycle is repeated. The corresponding simulation results fromthe present study are presented in Fig. 9, with the horizontal andvertical axes maintained equal to those in Fig. 8 for ease of com-parison. The numbering convention used to separate the flowphases in Fig. 9 is identical to that in Fig. 8, where the numberedlocations designate the boundaries between flow phases for thefigure in which they appear.
A decrease in the throttle diameter by 0.12 mm (0.84% flowarea reduction) is the sole difference between the predictions inFigs. 7 and 9, resulting in a decrease in TDS from 3.6 to 3.0 s. Thepredicted nondimensional parameters in Fig. 9 compare closelywith the measurements of Fink [2] in Fig. 8. The simulation con-tains the four phases (quiet, instability growth, blowdown, andrecovery) of compressor flow coefficient behavior as observedexperimentally. However, the length of the instability growthperiod (between points 2 and 3) and the maximum amplitude ofthe secondary Helmholtz resonator oscillations are smaller inpredictions relative to the measurements. The predicted TDS repro-duces 3.0 s of the experiment. The simulated Mat,0 and wp alsoappear to nearly replicate the corresponding experimentalobservations.
The time-resolved nondimensional compressor operating pointsfrom the experimental observations of Fink (recall Fig. 8) along
with the time-averaged small B data are shown in terms of wc ver-sus /c in Fig. 10, where the numbered operating points correspondto those in Fig. 8. The compressor flow coefficient /c in Fig. 10was estimated from the plenum mass balance. Fink used the non-dimensional plenum pressure Pp to estimate the nondimensionalcompressor pressure by applying the momentum balance
Pc ¼ Pp þ1
p0
L
A
C
d _mc
dt(12)
to the equivalent compressor duct, in order to account for the iner-tia. He then used Pc from Eq. (12) to estimate the compressorisentropic head coefficient as
wc ¼P c�1ð Þ=c
c � 1
c� 1ð ÞMa2t;0
(13)
depicted in Fig. 10. The corresponding predicted operating points(recall Fig. 9) for both the compressor and plenum along with thetime-averaged small B data of Fink are shown in Fig. 11, wherethe numbered operating points coincide with those in Fig. 9. Themass flow rate and pressure are spatially distributed in the predic-tions, allowing /c to be calculated by substituting the compressormass flow rate in Eq. (8) and wc to be calculated by substitutingthe nondimensional compressor pressure
Pc ¼p03
p0
(14)
into Eq. (13), p03 being the total pressure at the compressor exit.The operating points in Figs. 10 and 11 have uniformly spacedtime intervals of 3.2 ms, making, for example, the rate of changeof /c and w clearly visible. During the beginning of the blowdownphase, between points 3 and 4 (3 ! 4), the simulated transitionfrom forward to reverse flow appears to occur at a faster rate thanthe measurement. Due to the extremely fast transitions betweenthe forward and reverse flow characteristics (3 ! 4) in Fig. 11,the predicted plenum head coefficient is nearly unchanged duringthese times. The predicted nondimensional compressor operatingpoints in Fig. 11 agree reasonably well with the estimation fromthe measurements of Fink [2] in Fig. 10.
In addition, animations of the nondimensional compressor oper-ating points in this work are available online [14], where a bluecircle is utilized to depict time-resolved changes. These anima-tions are for two complete surge cycles, but the playback speedhas been reduced by a factor of ten (3.0 s surge cycle animatedover 30 s) to improve the ability to visualize the deep surge phe-nomenon. The animations clearly demonstrate the rate at whichthe compressor operation moves through the different flow phases,especially for the TDS¼ 3.0 s case that spends a majority of thecycle in the quiet (stable) phase near the peak head coefficient.
Fig. 12 Predicted time-resolved large B compressor and ple-num operating points with TDS 5 3.0 s along with the small Bdata of Fink [2]
Fig. 13 Predicted pce–pp with TDS 5 3.0 s
Fig. 14 Predicted, corrected compressor mass flow rate withTDS 5 3.0 s
Journal of Turbomachinery NOVEMBER 2016, Vol. 138 / 111002-7
Downloaded From: http://turbomachinery.asmedigitalcollection.asme.org/ on 05/10/2016 Terms of Use: http://www.asme.org/about-asme/terms-of-use

The compression system operating points in the w versus /c
space provide a useful (collapsed) view of flow and pressure fluc-tuations, while the details of rotational speed oscillations becomeimplicit. These speed fluctuations are clearly observable, however,when the deep surge cycles are viewed in the more familiar pres-sure ratio versus corrected mass flow rate space. Such predictedðPRtt versus _mc;corÞ compressor and plenum operating points areshown in Fig. 12 along with the small B compressor characteris-tics of Fink. The uniform 3.2 ms interval between operating pointshas been maintained to make the rate of change clearly visible. Amajority of the cycle is spent on the steady-state forward (6! 2)and reverse (4 ! 5) flow characteristics, while operating awayfrom the characteristics during a portion of the instability growthphase [10] along with the fast transitions from forward to reverseflow (3! 4) and reverse to forward flow (5! 6).
The four phases of operation are clearly observable in Fig. 12.The quiet period (1 ! 2) begins at the peak of the 45 krpm(Mat,0¼ 0.86) characteristic and continues until the rotationalspeed approaches 48 krpm (Mat,0¼ 0.92), which is also evident inFig. 9. The compressor moves through this region of the deep
surge cycle at a slow rate relative to the other phases. Instabilitygrowth begins at point 2 as the speed approaches 48 krpm withmild surge oscillations similar to that by Dehner et al. [10]. Dur-ing the blowdown phase, the flow quickly decelerates from point3 until it reverses and reaches a minimum value of �0.24 kg/s atpoint 4. As the compressor moves from points 4 to 5 along thereverse flow characteristic, the pressure ratio decreases and theflow rate increases. At point 5, the flow rate quickly transitionsback to the forward direction, reaching the maximum value of0.56 kg/s at point 6. The pressure ratio is nearly unchanged duringthis transition because the compressor moves through this regionat a rather fast rate. At point 6, the predicted power absorbed bythe compressor is nearly 47 kW, causing the rotational speed todecrease as the operating point moves toward the beginning of thequiet period (point 1). During this deep surge cycle, the predictedcompressor speed fluctuates between 45.1 and 49.4 krpm with apeak-to-peak amplitude of 4.3 krpm (9.1% of the mean).
Animations of the predicted compressor operating points in thePRc,tt versus _mc;cor space are also available [14]. These animationsare for two complete surge cycles, and the playback speed hasbeen reduced by a factor of 10. For the TDS¼ 3.0 s case, therelatively slow increase in rotational speed (and therefore pressureratio) during the quiet phase is clearly visible in the animation.
The difference (pce� pp) between the predicted pressures at thecompressor exit pce and in the plenum pp, as shown in Fig. 13(corresponding to t¼ 3.4–4.4 s in Fig. 9), represents the net pres-sure force acting on the air in the compressor exit duct. The greenvertical lines in Figs. 13 and 14 indicate the maximum mass flow
Fig. 16 Deep surge prediction with TDS 5 1.22 s
Fig. 18 Predicted time-resolved large B compressor and ple-num operating points with TDS 5 1.22 s along with the small Bdata of Fink [2]
Fig. 17 Predicted time-resolved large B nondimensional com-pressor and plenum operating points with TDS 5 1.22 s alongwith small B data of Fink et al. [3]
Fig. 15 Deep surge experimental data of Fink [2] withTDS 5 1.24 s
111002-8 / Vol. 138, NOVEMBER 2016 Transactions of the ASME
Downloaded From: http://turbomachinery.asmedigitalcollection.asme.org/ on 05/10/2016 Terms of Use: http://www.asme.org/about-asme/terms-of-use
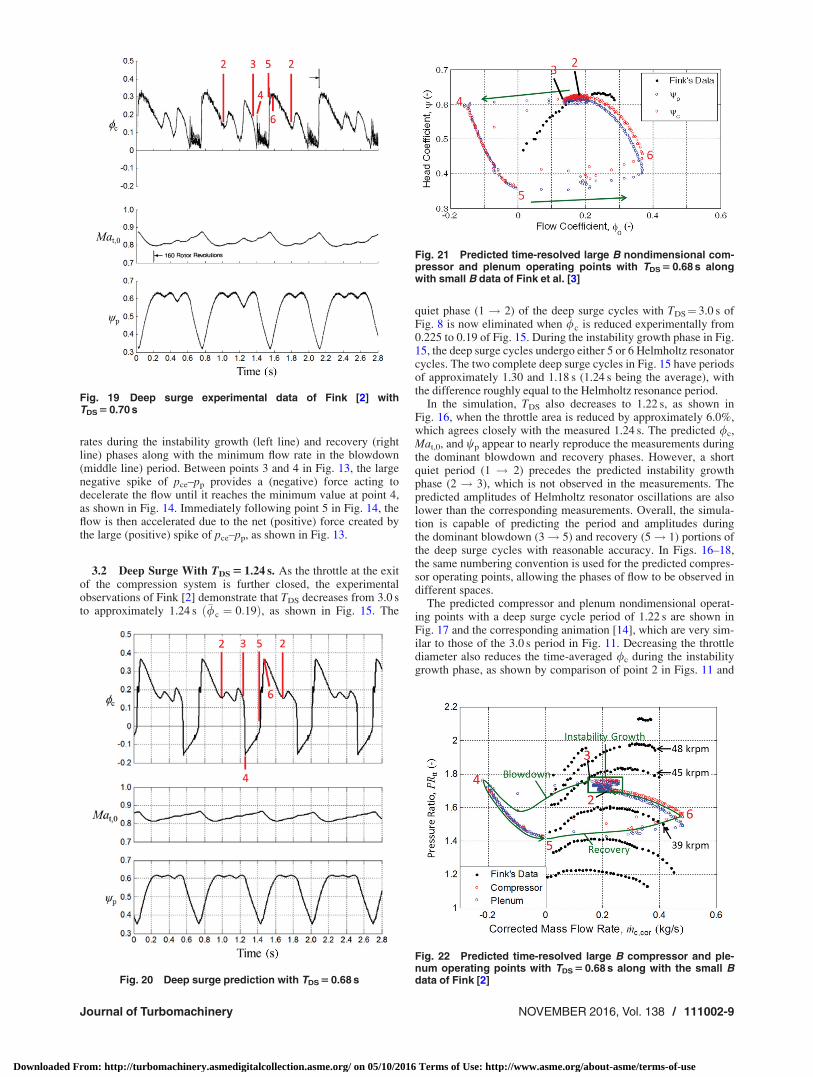
rates during the instability growth (left line) and recovery (rightline) phases along with the minimum flow rate in the blowdown(middle line) period. Between points 3 and 4 in Fig. 13, the largenegative spike of pce–pp provides a (negative) force acting todecelerate the flow until it reaches the minimum value at point 4,as shown in Fig. 14. Immediately following point 5 in Fig. 14, theflow is then accelerated due to the net (positive) force created bythe large (positive) spike of pce–pp, as shown in Fig. 13.
3.2 Deep Surge With TDS 5 1.24 s. As the throttle at the exitof the compression system is further closed, the experimentalobservations of Fink [2] demonstrate that TDS decreases from 3.0 sto approximately 1.24 s ð�/c ¼ 0:19Þ, as shown in Fig. 15. The
quiet phase (1 ! 2) of the deep surge cycles with TDS¼ 3.0 s ofFig. 8 is now eliminated when �/c is reduced experimentally from0.225 to 0.19 of Fig. 15. During the instability growth phase in Fig.15, the deep surge cycles undergo either 5 or 6 Helmholtz resonatorcycles. The two complete deep surge cycles in Fig. 15 have periodsof approximately 1.30 and 1.18 s (1.24 s being the average), withthe difference roughly equal to the Helmholtz resonance period.
In the simulation, TDS also decreases to 1.22 s, as shown inFig. 16, when the throttle area is reduced by approximately 6.0%,which agrees closely with the measured 1.24 s. The predicted /c,Mat,0, and wp appear to nearly reproduce the measurements duringthe dominant blowdown and recovery phases. However, a shortquiet period (1 ! 2) precedes the predicted instability growthphase (2 ! 3), which is not observed in the measurements. Thepredicted amplitudes of Helmholtz resonator oscillations are alsolower than the corresponding measurements. Overall, the simula-tion is capable of predicting the period and amplitudes duringthe dominant blowdown (3! 5) and recovery (5! 1) portions ofthe deep surge cycles with reasonable accuracy. In Figs. 16–18,the same numbering convention is used for the predicted compres-sor operating points, allowing the phases of flow to be observed indifferent spaces.
The predicted compressor and plenum nondimensional operat-ing points with a deep surge cycle period of 1.22 s are shown inFig. 17 and the corresponding animation [14], which are very sim-ilar to those of the 3.0 s period in Fig. 11. Decreasing the throttlediameter also reduces the time-averaged /c during the instabilitygrowth phase, as shown by comparison of point 2 in Figs. 11 and
Fig. 19 Deep surge experimental data of Fink [2] withTDS 5 0.70 s
Fig. 20 Deep surge prediction with TDS 5 0.68 s
Fig. 21 Predicted time-resolved large B nondimensional com-pressor and plenum operating points with TDS 5 0.68 s alongwith small B data of Fink et al. [3]
Fig. 22 Predicted time-resolved large B compressor and ple-num operating points with TDS 5 0.68 s along with the small Bdata of Fink [2]
Journal of Turbomachinery NOVEMBER 2016, Vol. 138 / 111002-9
Downloaded From: http://turbomachinery.asmedigitalcollection.asme.org/ on 05/10/2016 Terms of Use: http://www.asme.org/about-asme/terms-of-use
17. This trend is consistent with the corresponding observations ofFink [2], where �/c decreased from 0.225 to 0.19 with a reductionin the throttle flow area.
The predicted ðPRtt versus _mc;corÞ compressor and plenum oper-ating points along with the small B compressor characteristics ofFink are shown in Fig. 18 and the corresponding animation [14].Once again, a majority of the cycle is spent on the steady-stateforward (6 ! 2) and reverse (4 ! 5) flow characteristics.The compressor operates away from the characteristics during aportion of the instability growth phase (2 ! 3) and the smallfraction of time required to transition from forward to reverseflow (3! 4) and reverse to forward flow (5! 6). The four phasesof operation are clearly observable in Fig. 18. The quiet period(1 ! 2) of the 1.22 s deep surge cycle is shorter in duration andoccurs at lower pressure ratios and rotational speeds than that ofthe 3.0 s period in Fig. 12. Instability growth begins (point 2) asthe speed approaches 45 krpm and continues until it reaches 46krpm (point 3). Next, the flow quickly reverses in the blowdownphase until it reaches a minimum value of �0.23 kg/s at point 4.As the compressor operating point moves along the reverse flowcharacteristic to point 5, the pressure ratio decreases and the flowrate increases. Then, the flow rate quickly transitions back to theforward direction, reaching the maximum value of 0.52 kg/s atpoint 6. At point 6, the predicted power absorbed by the compres-sor is nearly 41 kW, causing the rotational speed to decrease asthe operating point moves toward the beginning of the quietperiod (point 1). The predicted compressor speed fluctuatesbetween 43.9 and 47.5 krpm with a peak-to-peak amplitude of3.7 krpm (8.1% of the mean).
3.3 Deep Surge With TDS 5 0.70 s. Experimental observa-tions of Fink [2] demonstrated that an even further decrease inthrottle area reduced TDS to approximately 0.70 s ð�/c ¼ 0:16Þ, asshown in Fig. 19. The number of Helmholtz resonator periodsduring the instability growth phase is one or two (varies cycle-to-cycle). Starting at the predicted TDS¼ 1.22 s case of Sec. 3.2, an8.2% reduction in throttle area is accompanied by a decrease toTDS¼ 0.68 s, as shown in Fig. 20, which agrees closely with themeasurement. A quiet period does not occur in the prediction orthe measurement, as shown in Figs. 19 and 20. The simulatednumber of Helmholtz resonator oscillations, during the instabilitygrowth period, is one or two, which reproduces the experimentalobservation of Fink [2], while the predicted amplitudes of theHelmholtz resonator oscillations are lower than the correspondingmeasurements. Overall, the simulation is capable of predicting thedeep surge cycles with reasonable accuracy.
The predicted compressor and plenum nondimensional operat-ing points with TDS¼ 0.68 s are shown in Fig. 21 and the
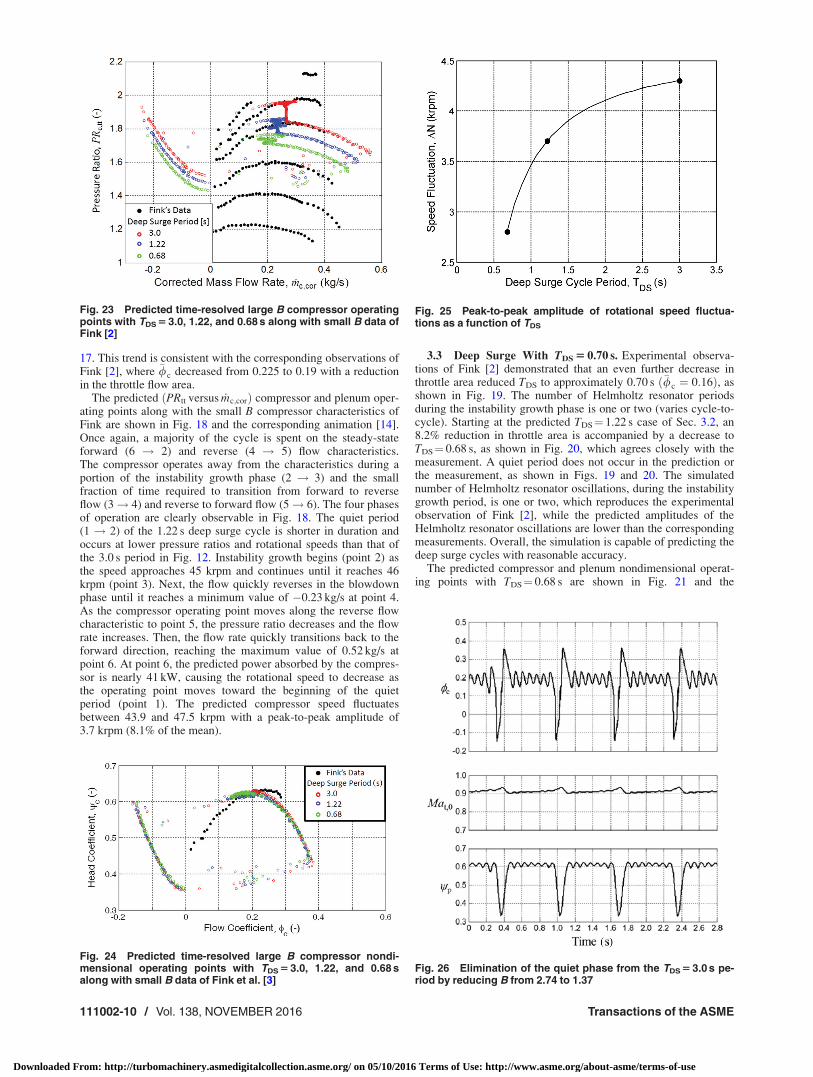
Fig. 23 Predicted time-resolved large B compressor operatingpoints with TDS 5 3.0, 1.22, and 0.68 s along with small B data ofFink [2]
Fig. 24 Predicted time-resolved large B compressor nondi-mensional operating points with TDS 5 3.0, 1.22, and 0.68 salong with small B data of Fink et al. [3]
Fig. 25 Peak-to-peak amplitude of rotational speed fluctua-tions as a function of TDS
Fig. 26 Elimination of the quiet phase from the TDS 5 3.0 s pe-riod by reducing B from 2.74 to 1.37
111002-10 / Vol. 138, NOVEMBER 2016 Transactions of the ASME
Downloaded From: http://turbomachinery.asmedigitalcollection.asme.org/ on 05/10/2016 Terms of Use: http://www.asme.org/about-asme/terms-of-use

corresponding animation [14], which are very similar to thosewith TDS¼ 3.0 and 1.22 s periods in Figs. 11 and 17, respectively.Figures 20–22 use the same numbering convention for the pre-dicted compressor operating points, allowing the phases of flow tobe observed in different spaces.
The predicted ðPRtt versus _mc;corÞ compressor and plenum oper-ating points are shown in Fig. 22 and the corresponding animation[14], along with the small B compressor characteristics of Fink.The instability growth, blowdown, and recovery phases of opera-tion are clearly observable in Fig. 22, while the quiet period iseliminated.
Once again, majority of the cycle is spent on the steady-stateforward (6 ! 2) and reverse (4 ! 5) flow characteristics, whileoperating away from the characteristics during a portion of theinstability growth phase (2! 3) along with the small fractions oftime required to transition from forward to reverse flow (3 ! 4)and reverse to forward flow (5 ! 6). Instability growth begins(point 2) as the speed approaches 42.6 krpm and continues untilthe speed reaches 43.8 krpm at point 3. Next, the flow quicklyreverses in the blowdown phase until it reaches a minimum valueof �0.21 kg/s at point 4. As the compressor operating point movesalong the reverse flow characteristic to point 5, the pressure ratiodecreases and the flow rate increases. Then, the flow quickly tran-sitions back to the forward direction, reaching the maximum valueof 0.48 kg/s at point 6. At point 6, the predicted power absorbedby the compressor is nearly 35 kW, causing the rotational speed todecrease as the operating point moves toward the beginning of theinstability growth period (point 2). The predicted compressorspeed fluctuates between 42.2 and 45.0 krpm with a peak-to-peakamplitude of 2.8 krpm (6.4% of the mean).
3.4 Additional Observations. When the deep surge cyclesare viewed in the PRc;tt versus _mc;cor plane, the time-resolved“surge loops” are noticeably different for each operating point, asshown in Fig. 23. A decrease in the throttle diameter shifts thepressure ratios and rotational speeds to lower values. Furthermore,the maximum _mc;cor decreases and the minimum increases slightlyas the duration of the deep surge cycle is reduced. It is interesting
to note that, despite these differences in the PRc;tt versus _mc;cor
plane, the time-resolved surge loops in the nondimensional wc
versus /c plane are nearly identical for all three deep surgepredictions, as illustrated in Fig. 24.
The quiet and instability growth phases exhibited by Fink’scompression system have not been observed during deep surgecycles in numerous other studies [5–7,12,13,15,16]. Fink’s ratherlarge plenum (208 L) required substantial periods of time to emptyand fill during the blowdown and recovery flow phases. During aportion (4 ! 5) of the blowdown phase, the compressor operateson the reverse flow characteristic while the plenum pressuredecreases. The compressor consumes little power in this operatingregion, causing the rotational speed to increase. When the flowrecovers back to the forward direction, the compressor must oper-ate at high mass flow rates while the plenum pressure increases.Here, the compressor consumes a significant amount of power,resulting in a large reduction in speed. This unusually large speedreduction is responsible for the occurrence of the quiet and insta-bility growth flow phases, as will be illustrated next.
During the recovery phase of the predicted TDS¼ 3.0 s deepsurge cycle (recall Fig. 12), the compressor rotational speeddecreases by approximately 4 krpm. At the end of the recoveryphase (point 1), the speed is nearly 3 krpm below that at the onsetof instability growth (point 2), allowing the compression systemto operate in a stable mode as the speed increases at a relativelyslow rate. As the throttle flow rate of the TDS¼ 3.0 s case wasreduced computationally, the quiet phase was nearly eliminatedfrom the deep surge cycles, therefore decreasing TDS to 1.22 s.The quiet period is nearly eliminated due to the lower amplitudeof rotational speed fluctuations DN of the TDS¼ 1.22 s case rela-tive to that when TDS¼ 3.0 s, as shown in Fig. 25. The smaller DNplaces the compressor operating point closer to the stability limit(point 2) of the system at the end of the recovery phase (point 1).The quiet phase is eliminated and the duration of the instabilitygrowth phase decreases when TDS is further reduced to 0.68 s, dueto the significantly lower DN for this case.
4 Occurrence of Quiet and Instability Growth
Flow Phases
In order to illustrate the influence of plenum volume on DN(and therefore the occurrence of the quiet and instability growthphases), the plenum volume of the TDS¼ 3.0 s deep surge cyclewas reduced computationally. When the plenum volume isreduced from 208 to 52 L (B from 2.74 to 1.37), the quiet phase iseliminated, as shown in Fig. 26 (contrast with Fig. 9). The reduc-tion in volume is accompanied by a decrease in DN from 4.3 to1.66 krpm. A further reduction of plenum volume to 7.9 L (B to0.53) eliminates both the quiet and instability growth phases, asshown in Fig. 27. This larger volume reduction decreases DN to0.52 krpm. The deep surge cycles in Fig. 27 are comprised of onlyblowdown and recovery phases, which may be more typical forreasonably sized plenum volumes in vehicle applications.
The computations also illustrate that the quiet and instabilitygrowth deep surge cycle flow phases disappear when the rota-tional inertia is increased to a rather large value (DN is decreased),which is consistent with the conclusion that large speed fluctua-tions contribute to the occurrence of these phases.
5 Conclusions
The current study demonstrated the ability to predict centrifugalcompression system deep surge physics using a 1D time domainengine simulation code. A number of significant modificationswere incorporated into the code to improve the compressor char-acterization, including low and reverse flow performance, reverseflow compressor power, and compressor equivalent geometry.Prediction results from the present 1D model improve agreementwith experimental data relative to previous 0D models, due toelimination of many of the simplifying assumptions.
Fig. 27 Elimination of both the quiet and instability growthphases from the TDS 5 3.0 s period by reducing B from 2.74 to0.53
Journal of Turbomachinery NOVEMBER 2016, Vol. 138 / 111002-11
Downloaded From: http://turbomachinery.asmedigitalcollection.asme.org/ on 05/10/2016 Terms of Use: http://www.asme.org/about-asme/terms-of-use

The deep surge simulations from the present study captured thedistinct flow phases evident in the experimental results of Fink. Inaddition, the predicted deep surge cycle periods along with thedominant amplitudes during the blowdown and recovery phases,showed good agreement with measurements. During the instabil-ity growth phase, the deep surge predictions slightly underesti-mated the amplitudes of fluctuations, while the frequency andnumber of Helmholtz resonator oscillations provided reasonableagreement with measurements. All of the predicted deep surgecycles are nearly identical in the wc versus /c space, while notice-able differences are observed in the PRc versus _mc;cor space.
In order to demonstrate that the unusual quiet and instabilitygrowth flow phases result from large amplitude speed fluctuations,computational simulations from the present study were also com-pleted with a substantially reduced plenum volume and increasedrotational inertia.
Nomenclature
a ¼ speed of soundA ¼ cross-sectional areaB ¼ nondimensional Greitzer number
Cx ¼ axial velocityfH ¼ Helmholtz resonator frequency
L; l ¼ length_m ¼ mass flow rate
Mat;0 ¼ Mach number of impeller tipN ¼ turbocharger shaft rotational speedp ¼ pressureP ¼ power
PR ¼ pressure ratiot ¼ time
T ¼ temperatureTDS ¼ period of deep surge cycle
U ¼ velocity of the impeller tipV ¼ volume
Greek Symbols
c ¼ ratio of specific heatsD ¼ change in parameterg ¼ isentropic efficiencyP ¼ nondimensional pressureq ¼ density/ ¼ flow coefficientw ¼ isentropic head coefficient
Subscripts
c ¼ compressorC ¼ equivalent compressor ductce ¼ compressor exit
cor ¼ correctedp ¼ plenum
ref ¼ referencets ¼ total-to-statictt ¼ total-to-total0 ¼ ambient; total property
1� 8 ¼ location
References[1] Cumpsty, N. A., 1989, Compressor Aerodynamics, Krieger, Malabar, FL.[2] Fink, D. A., 1988, “Surge Dynamics and Unsteady Flow Phenomena in Centrif-
ugal Compressors,” Ph.D. thesis, Department of Aeronautics and Astronautics,Massachusetts Institute of Technology, Cambridge, MA.
[3] Fink, D. A., Cumpsty, N. A., and Greitzer, E. M., 1992, “Surge Dynamics in aFree-Spool Centrifugal Compressor System,” ASME J. Turbomach., 114(2),pp. 321–332.
[4] Greitzer, E. M., 1976, “Surge and Rotating Stall in Axial Flow Compressors,Part I: Theoretical Compression System Model,” ASME J. Eng. Power, 98(2),pp. 190–197.
[5] Yano, T., and Nagata, B., 1971, “A Study on Surging Phenomena in DieselEngine Air-Charging System,” Jpn. Soc. Mech. Eng., 14(70), pp. 364–376.
[6] Greitzer, E. M., 1976, “Surge and Rotating Stall in Axial Flow Compressors,Part II: Experimental Results and Comparison With Theory,” ASME J. Eng.Power, 98(2), pp. 199–217.
[7] Uhlenhake, G., Selamet, A., Fogarty, K., Tallio, K., and Keller, P., 2011,“Development of an Experimental Facility to Characterize Performance, Surge,and Acoustics in Turbochargers,” SAE Paper No. 2011-01-1644.
[8] Hansen, K. E., Jorgensen, P., and Larsen, P. S., 1981, “Experimental and Theo-retical Study of Surge in a Small Centrifugal Compressor,” ASME J. FluidsEng., 103(3), pp. 391–395.
[9] Theotokatos, G., and Kyrtatos, N. P., 2001, “Diesel Engine Transient OperationWith Turbocharger Compressor Surging,” SAE Paper No. 2001-01-1241.
[10] Dehner, R., Selamet, A., Keller, P., and Becker, M., 2010, “Simulation of MildSurge in a Turbocharger Compression System,” SAE J. Engines, 3(2), pp.197–212.
[11] Gamma Technologies, 2009, “GT-Power (Version 7.0),” Gamma Technologies,Westmont, IL.
[12] Dehner, R., Selamet, A., Keller, P., and Becker, M., 2011, “Prediction of Surgein a Turbocharger Compression System vs. Measurements,” SAE J. Engines,4(2), pp. 2181–2192.
[13] Dehner, R., 2011, “Simulation of Surge in Turbocharger CompressionSystems,” M.S. thesis, Department of Mechanical Engineering, The Ohio StateUniversity, Columbus, OH.
[14] Selamet, A., 2016, “Deep Surge Animations,” http://engine.osu.edu[15] Galindo, J., Serrano, J. R., Climent, H., and Tiseria, A., 2008, “Experiments
and Modeling of Surge in Small Centrifugal Compressor for AutomotiveEngines,” Exp. Therm. Fluid Sci., 32(3), pp. 818–826.
[16] Emmons, H. W., Pearson, C. E., and Grant, H. P., 1955, “Compressor Surgeand Stall Propagation,” Trans. ASME, 77(4), pp. 455–469.
111002-12 / Vol. 138, NOVEMBER 2016 Transactions of the ASME
Downloaded From: http://turbomachinery.asmedigitalcollection.asme.org/ on 05/10/2016 Terms of Use: http://www.asme.org/about-asme/terms-of-use