simulation experiment of tsr promotes cracking of coal
TRANSCRIPT

Research ArticleSimulation Experiment of TSR Promotes Cracking of CoalGeneration H2S
Qigen Deng ,1,2,3 Yinsheng Du ,1 Yanjie Yang ,1 and Fajun Zhao 1,2
1School of Safety Science and Engineering, Henan Polytechnic University, Jiaozuo 454003, China2State Key Laboratory Cultivation Base for Gas Geology and Gas Control (Henan Polytechnic University), Jiaozuo 454003, China3Collaborative Innovation Center of Coal Safety Production of Henan Province, Jiaozuo 454003, China
Correspondence should be addressed to Qigen Deng; [email protected]
Received 8 October 2020; Revised 3 January 2021; Accepted 28 March 2021; Published 3 May 2021
Academic Editor: Guozhong Hu
Copyright © 2021 Qigen Deng et al. This is an open access article distributed under the Creative Commons Attribution License,which permits unrestricted use, distribution, and reproduction in any medium, provided the original work is properly cited.
Thermochemical sulfate reduction (TSR) is one of the main contributors to the formation of hydrogen sulfide (H2S) in coal seamstrata. Four reaction systems (coal, coal+water, coal+water and MgSO4, and coal+water and MgSO4 and AlCl3) were selected andsimulated from 250°C to 600°C with eight temperature steps using a high-temperature and high-pressure reaction device, and theevolution characteristics of the gaseous products of hydrocarbons (methane, C2-5) and nonhydrocarbon gases (CO2, H2, and H2S)were studied. Thermal simulation experiments showed that the TSR led to the reduction of heavy hydrocarbons, and the presenceof salts accelerated the evolution of hydrocarbons; SO4
2-, Al3+, and Mg2+ had a certain promoting effect on the TSR, whichincreased the total amount of alkane gas, H2S, and CO2 production. Improving the salinity of the reaction system can promotethe occurrence of TSR, and water plays a key role in hydrocarbon generation evolution and the TSR.
1. Introduction
Abnormal emission and casualty accidents caused by theenrichment of hydrogen sulfide (H2S) in coal mines occurfrequently domestically and internationally. High-sulfur nat-ural gas reservoirs (volume percentage of H2S greater than5%) are widely distributed around the world, and all areclosely related to the distribution of sulfate reservoirs. Previ-ous studies have shown that thermochemical sulfate reduc-tion (TSR) is one of the main ways to form hydrogensulfide in oil and gas reservoirs and coal seam strata [1, 2].The simulation research of scholars domestically and inter-nationally about the thermochemical reduction reaction aremostly concentrated in the field of oil and natural gas, anda large number of cracking and thermal simulation experi-ments have been carried out [3–6]. TSR research has beencarried out for more than 30 years, involving oil and gas geol-ogy, mineralogy, geochemistry, experimental geology, andmany other fields, and TSR initiation mechanism, produc-tion products, influencing factors, isotope fractionation,reaction mechanism, discriminatory markers, limit tempera-ture, and kinetic characteristics have been studied [7–10].
However, there are still few experimental studies on the sim-ulation of thermochemical reduction of coal and sulfate toproduce hydrogen sulfide-containing gas. Based on the previ-ous studies, this study adopts the method of high tempera-ture and high pressure where Mad is the air-dried moistureand Ad is the ash dry and thermal simulation experimentsunder various media conditions in a closed system. The tem-perature of hydrocarbon formation under geological condi-tions is about 70~200°C, and the temperature of hydrogensulfide formed by TSR is 120~200°C. In order to acceleratethe reaction, the study chooses a higher temperature andconducts TSR thermal simulation experiments on coal inorder to provide theoretical guidance on the evolution andformation mechanism of hydrogen sulfide gas in coal-seriesstrata.
2. Samples and Experimental Methods
2.1. Experimental Samples. An anthracite fresh coal sampleused in this experiment was selected from the no. 15 coalseam in a coal mine of Mountain Fenghuang, southernQinshui Basin, Shanxi Province, China, where the H2S is
HindawiGeofluidsVolume 2021, Article ID 6613252, 8 pageshttps://doi.org/10.1155/2021/6613252

abnormally enriched, and the parameters of the samples weremeasured. The industrial analysis, elemental analysis, andsulfur composition are shown in Table 1. After the coal sam-ple was crushed, it was sieved out with the particle size of 80-150μm in the constant temperature vacuum drying oven at50°C to make a dry sample of 8000 g as the experimental coalsample, and the sieved sample was divided into 8 portions;each portion of 1000 g was stored in a dry bottle and injectedwith nitrogen and sealed for use.
Mad is the air-dried moisture, Ad is the dry ash, Vdaf is thedry ash-free volatile, St,d is the dry basis total sulfur, So,d is thedry basis organic sulfur, and Sp,d is the dry basis pyretic sul-fur. The coal of sample no. 15 is mostly black and powdery,and a small part is massive. It is a semibright briquette withmirrored coal ribbon and silk carbon lens. It has a thin-medium strip structure and occasionally white calcite anddispersed, nodular, and film-shaped pyrite.
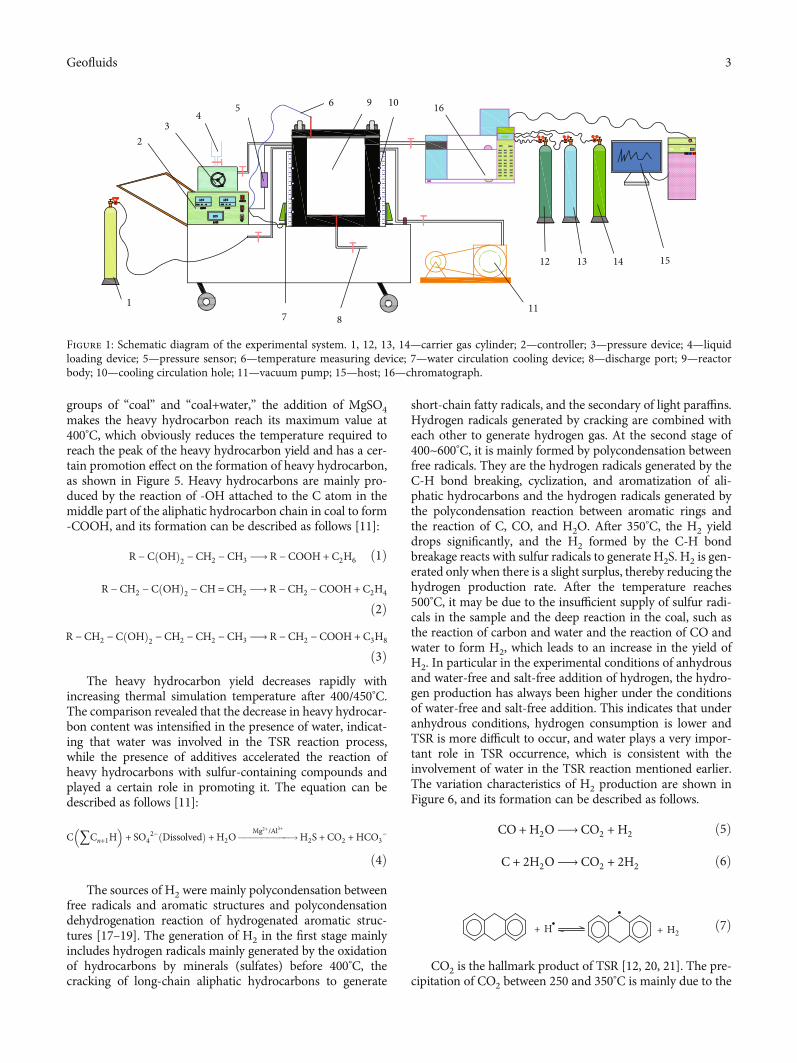
2.2. Experimental Method. The experimental device mainlyconsists of a reactor, control device, degassing device, loadingdevice, and gas collection and analysis device. The systemdiagram is shown in Figure 1 [11]. The maximum tempera-ture control of the system is 650°C, and the accuracy is±1°C. The maximum pressure control is 25.0MPa, and theaccuracy is ±0.5MPa. During the experiment, the quartz tubecontaining 1000 ± 0:1 g of the experimental samples was suc-cessively put into the kettle. After connecting all air circuitsand temperature sensors of the equipment and detectingthe air tightness of each air circuit, the vacuum degasses theentire system. After degassing, different media were injectedinto the quartz tube in the reactor from the loading deviceaccording to the experimental scheme. Into the quartz tubein the reaction kettle, 300mL of an ion aqueous solution witha molar concentration of 1.0mol/L of mineral aqueous solu-tion containing additives was injected. The initial pressure inthe kettle is set to 5.0MPa, and the final pressure of the reac-tion system is between 12.0 and 20.0MPa. The reaction isheated at a heating rate of 20°C/h, simulating gaseous prod-ucts at 8 temperature points of 250°C, 300°C, 350°C, 400°C,450°C, 500°C, 550°C, and 600°C, and these were analyzed.The heating time for each simulation experiment stage was24 hours. At the end of each experimental stage, the gaseousproducts in the reactor were collected using a special samplerfor hydrogen sulfide and a Tedlar gas sample bag. Using a gaschromatograph, the gaseous products of hydrocarbon gases(methane, heavy hydrocarbons) and nonhydrocarbon gases(CO2, H2, and H2S) were measured.
3. Experimental Results and Discussion
The coal sample used in this experiment can be regarded as atypical porous medium. Its fine particle size and its con-nected internal channels allow the gas to flow smoothlythrough its surface and inside, and it is also a place for heattransfer and physical and chemical reactions. The gaseousproduct test results of hydrocarbon gas (CH4, C2~5) and non-hydrocarbon gas (CO2, H2, and H2S) are shown in Table 2.
Coal is a complex polymer compound with condensedaromatic nuclei derived from lignin as the main body, con-
nected by various bridges and carrying various types of fattyand nonfatty functional groups [12]. The coal pyrolysis pro-cess begins with the breaking of the fatty carbon-fatty carbonbond (Cal-Cal), and at about 500~600
°C, the aliphatic carbon-hydrogen bond (Cal-H) is broken. The aromatic carbo-n=aromatic carbon bond (Car=Car) on the aromatic ring isvery difficult to break during pyrolysis due to its very stablestructure. The oxygen-containing structures and other het-erocyclic structures in coal break at 400-700°C. Fat carbon-sulfur bridge bond (Cal-S) fracture temperature is usuallylower than that of Cal-Cal, and Cal-S bond cleavage promotesfree radical formation. In the early stage of thermal evolutionat low temperature, the gas adsorbed in the pores of the coaland the weak bonds in the coal structure are broken, and thegases such as CH4, CO2, and N2 are removed. As the thermalsimulation temperature further increases, the weakest bridgebonds in coal, such as ether bonds, thioether bonds, disul-fides, aromatics, and fatty side chains, begin to break downand decompose. Oxygen-containing functional groups incoal will also be cracked, showing that fatty methyl groupsare shed to form CH4 and H2, carbonyl groups are crackedto form CO, and the fatty bridge bond (-CH2-CH2-) is bro-ken and sulfide (sulfur radical) is combined to form H2S.The reaction can generate CH4, C2H6, C2H4, and H2O, CO,CO2, and H2S, and other gases, as shown in Figure 2 [13].
Hydrocarbon and nonhydrocarbon gaseous productchanges are characterized in Figures 3–8. The generation ofCH4 is related to 5 aspects [14–16]: (1) adsorption of CH4in coal pores by thermal desorption, (2) fat side chain break-age on the coal surface, (3) pyrolysis of methylene bridgebonds in coal main structure, (4) pyrolysis of oxidized aro-matic ring structure, and (5) broken fatty side chain in thearomatic structure. In the first stage, 250°C, the desorptionof CH4 adsorbed in coal pores happened. The second stageis 300~450°C, mainly formed by the breaking of aryl, alkyl,and ether bonds. The third stage 450/500~550°C, from rela-tively stable chemical bond cleavage, for example, the alkylon the side chain of aromatic compounds breaks to formlow molecular alkanes such as CH4. After 550
°C in the fourthstage, it was mainly the polycondensation between aromaticrings to form a condensed ring aromatic structure, whichreleases CH4. With the addition of water and additives, theyield of methane and total gas is higher, which is expressedas “coal+water and MgSO4 and AlCl3” > “coal+water andMgSO4” > “coal+water” > “coal.” Comparison of the gasyield results showed that the presence of water and additivesled to a significant increase in the total gas yield and methanegas yield, as shown in Figures 3 and 4.
Heavy hydrocarbons are dominated by C2H6, and theiroutput increases first and then decreases as the temperatureof the simulated experiment increases. Compared with the
Table 1: Experimental sample parameter determination numericalvalue.
Industrialanalysis (%)
Elementalanalysis (%)
Sulfurcomposition (%)
Mad Ad Vdaf C H N O St,d So,d Sp,d1.12 24.27 7.15 88.47 3.19 0.35 3.15 3.44 0.82 2.62
2 Geofluids
groups of “coal” and “coal+water,” the addition of MgSO4makes the heavy hydrocarbon reach its maximum value at400°C, which obviously reduces the temperature required toreach the peak of the heavy hydrocarbon yield and has a cer-tain promotion effect on the formation of heavy hydrocarbon,as shown in Figure 5. Heavy hydrocarbons are mainly pro-duced by the reaction of -OH attached to the C atom in themiddle part of the aliphatic hydrocarbon chain in coal to form-COOH, and its formation can be described as follows [11]:
R − C OHð Þ2 − CH2 − CH3 ⟶ R − COOH+C2H6 ð1Þ
R − CH2 − C OHð Þ2 − CH= CH2 ⟶ R − CH2 − COOH+C2H4
ð2ÞR − CH2 − C OHð Þ2 − CH2 − CH2 − CH3 ⟶ R − CH2 − COOH+C3H8
ð3ÞThe heavy hydrocarbon yield decreases rapidly with
increasing thermal simulation temperature after 400/450°C.The comparison revealed that the decrease in heavy hydrocar-bon content was intensified in the presence of water, indicat-ing that water was involved in the TSR reaction process,while the presence of additives accelerated the reaction ofheavy hydrocarbons with sulfur-containing compounds andplayed a certain role in promoting it. The equation can bedescribed as follows [11]:
C 〠Cn+1H� �
+ SO42− Dissolvedð Þ + H2O ���������!Mg2+/Al3+
H2S + CO2 + HCO3−
ð4Þ
The sources of H2 were mainly polycondensation betweenfree radicals and aromatic structures and polycondensationdehydrogenation reaction of hydrogenated aromatic struc-tures [17–19]. The generation of H2 in the first stage mainlyincludes hydrogen radicals mainly generated by the oxidationof hydrocarbons by minerals (sulfates) before 400°C, thecracking of long-chain aliphatic hydrocarbons to generate
short-chain fatty radicals, and the secondary of light paraffins.Hydrogen radicals generated by cracking are combined witheach other to generate hydrogen gas. At the second stage of400~600°C, it is mainly formed by polycondensation betweenfree radicals. They are the hydrogen radicals generated by theC-H bond breaking, cyclization, and aromatization of ali-phatic hydrocarbons and the hydrogen radicals generated bythe polycondensation reaction between aromatic rings andthe reaction of C, CO, and H2O. After 350
°C, the H2 yielddrops significantly, and the H2 formed by the C-H bondbreakage reacts with sulfur radicals to generate H2S. H2 is gen-erated only when there is a slight surplus, thereby reducing thehydrogen production rate. After the temperature reaches500°C, it may be due to the insufficient supply of sulfur radi-cals in the sample and the deep reaction in the coal, such asthe reaction of carbon and water and the reaction of CO andwater to form H2, which leads to an increase in the yield ofH2. In particular in the experimental conditions of anhydrousand water-free and salt-free addition of hydrogen, the hydro-gen production has always been higher under the conditionsof water-free and salt-free addition. This indicates that underanhydrous conditions, hydrogen consumption is lower andTSR is more difficult to occur, and water plays a very impor-tant role in TSR occurrence, which is consistent with theinvolvement of water in the TSR reaction mentioned earlier.The variation characteristics of H2 production are shown inFigure 6, and its formation can be described as follows.
CO +H2O⟶ CO2 + H2 ð5Þ
C + 2H2O⟶ CO2 + 2H2 ð6Þ
+ H + H2ð7Þ
CO2 is the hallmark product of TSR [12, 20, 21]. The pre-cipitation of CO2 between 250 and 350°C is mainly due to the
1
2
87
34
5 9
11
12 13 14 15
16106
Figure 1: Schematic diagram of the experimental system. 1, 12, 13, 14—carrier gas cylinder; 2—controller; 3—pressure device; 4—liquidloading device; 5—pressure sensor; 6—temperature measuring device; 7—water circulation cooling device; 8—discharge port; 9—reactorbody; 10—cooling circulation hole; 11—vacuum pump; 15—host; 16—chromatograph.
3Geofluids

Table 2: Test results of gaseous products.
Media type Temperature (°C) CH4 (mL/g) C2~5 (mL/g) CO2 (mL/g) H2 (mL/g) H2S (mL/g)
Coal
250 12.436 1.306 6.127 1.369 0.002
300 13.758 1.432 7.264 1.410 0.006
350 15.845 2.069 8.655 1.479 0.008
400 18.828 2.845 9.655 1.319 0.013
450 21.184 3.616 9.909 1.056 0.017
500 22.621 3.855 10.073 0.871 0.016
550 22.969 2.375 9.964 0.892 0.015
600 23.128 0.986 9.627 1.012 0.009
Coal+deionized water
250 12.714 1.085 6.300 1.502 0.003
300 14.941 1.416 8.182 1.519 0.008
350 17.168 2.305 10.045 1.561 0.019
400 20.625 3.077 10.545 1.641 0.035
450 25.282 3.582 9.609 1.716 0.067
500 27.247 2.537 9.991 1.748 0.072
550 26.984 1.333 10.573 1.605 0.047
600 26.387 0.393 10.095 1.487 0.023
Coal+deionized water+MgSO4
250 13.288 1.143 6.380 1.430 0.004
300 15.276 1.519 7.871 1.677 0.019
350 17.722 2.645 10.468 1.704 0.062
400 20.245 4.096 10.068 1.017 0.123
450 27.157 2.984 9.151 0.530 0.165
500 29.068 1.869 10.018 0.406 0.149
550 29.456 1.016 10.287 0.419 0.102
600 29.600 0.085 10.393 0.569 0.061
Coal+deionized water+MgSO4+0.02mol AlCl3
250 13.765 1.109 6.585 1.372 0.004
300 16.377 1.654 7.922 1.528 0.029
350 19.066 3.281 9.467 1.597 0.099
400 23.293 4.734 9.167 0.774 0.215
450 30.099 3.811 8.806 0.417 0.276
500 31.845 2.214 10.243 0.343 0.298
550 32.132 0.842 10.815 0.364 0.230
600 32.213 0.061 10.875 0.606 0.158
Raw lignite
Dehydration reaction Degassing reaction
Dry lignite
CO2N2
O
H
O
OH
OH
O
CO
...O
O
O
O
O
O
O
...
<150 C <200 C<300 C >300 C >500 C
COH2
CO2CH4
...H2SCO2
H2
H2OH2O CH4
Figure 2: Reaction pathways for the briquette pyrolysis.
4 Geofluids

200 250 300 350 400 450 500 550 600 650
Yiel
ds o
f tot
al g
as (m
L/g)
Temperature ( C)
24
20
28
32
36
40
44
48
CoalCoal & waterCoal & water & MgSO4Coal & water & MgSO4 & AlCl3
Figure 3: Variation characteristics of total gas.
1214161820222426283032
CH4 (
mL/
g)
200 250 300 350 400 450 500 550 600 650Temperature ( C)
CoalCoal & waterCoal & water & MgSO4Coal & water & MgSO4 & AlCl3
Figure 4: Variation characteristics of methane production.
0
1
2
3
4
5
C 2~5
(mL/
g)
200 250 300 350 400 450 500 550 600 650Temperature ( C)
CoalCoal & waterCoal & water & MgSO4Coal & water & MgSO4 & AlCl3
Figure 5: Variation characteristics of heavy hydrocarbon.
0.0
0.3
0.6
0.9
1.2
1.5
1.8
H2 (
mL/
g)
200 250 300 350 400 450 500 550 600 650Temperature ( C)
CoalCoal & waterCoal & water & MgSO4Coal & water & MgSO4 & AlCl3
Figure 6: Variation characteristics of H2 production.
5
6
7
8
9
10
11
CO2 (
mL/
g)
200 250 300 350 400 450 500 550 600 650Temperature ( C)
CoalCoal & waterCoal & water & MgSO4Coal & water & MgSO4 & AlCl3
Figure 7: Variation characteristics of CO2 production.
0.00
0.04
0.08
0.12
0.16
0.20
0.24
0.28
0.32
H2S
(mL/
g)
200 250 300 350 400 450 500 550 600 650Temperature ( C)
CoalCoal & waterCoal & water & MgSO4Coal & water & MgSO4 & AlCl3
Figure 8: Variation characteristics of H2S production.
5Geofluids
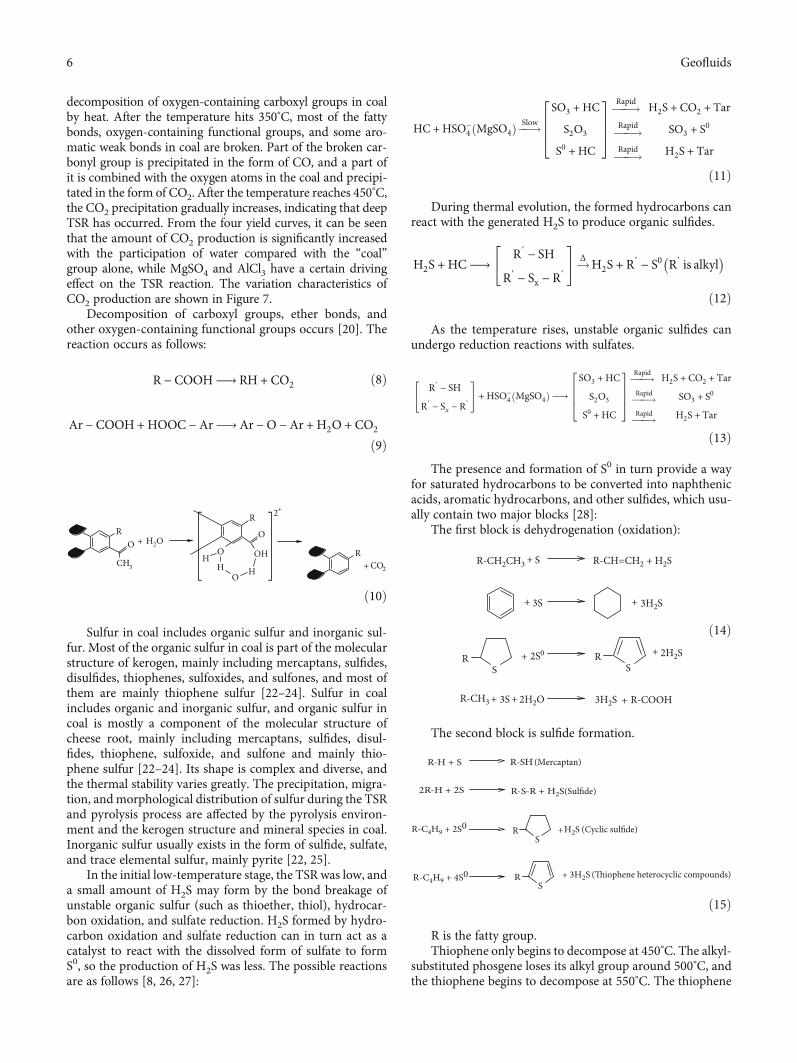
decomposition of oxygen-containing carboxyl groups in coalby heat. After the temperature hits 350°C, most of the fattybonds, oxygen-containing functional groups, and some aro-matic weak bonds in coal are broken. Part of the broken car-bonyl group is precipitated in the form of CO, and a part ofit is combined with the oxygen atoms in the coal and precipi-tated in the form of CO2. After the temperature reaches 450°C,the CO2 precipitation gradually increases, indicating that deepTSR has occurred. From the four yield curves, it can be seenthat the amount of CO2 production is significantly increasedwith the participation of water compared with the “coal”group alone, while MgSO4 and AlCl3 have a certain drivingeffect on the TSR reaction. The variation characteristics ofCO2 production are shown in Figure 7.
Decomposition of carboxyl groups, ether bonds, andother oxygen-containing functional groups occurs [20]. Thereaction occurs as follows:
R − COOH⟶ RH + CO2 ð8Þ
Ar − COOH +HOOC −Ar⟶Ar −O −Ar + H2O + CO2
ð9Þ
OR
CH
+ H2OO
R
OH
OH
O
HH
2+
3
R+ CO2
ð10Þ
Sulfur in coal includes organic sulfur and inorganic sul-fur. Most of the organic sulfur in coal is part of the molecularstructure of kerogen, mainly including mercaptans, sulfides,disulfides, thiophenes, sulfoxides, and sulfones, and most ofthem are mainly thiophene sulfur [22–24]. Sulfur in coalincludes organic and inorganic sulfur, and organic sulfur incoal is mostly a component of the molecular structure ofcheese root, mainly including mercaptans, sulfides, disul-fides, thiophene, sulfoxide, and sulfone and mainly thio-phene sulfur [22–24]. Its shape is complex and diverse, andthe thermal stability varies greatly. The precipitation, migra-tion, andmorphological distribution of sulfur during the TSRand pyrolysis process are affected by the pyrolysis environ-ment and the kerogen structure and mineral species in coal.Inorganic sulfur usually exists in the form of sulfide, sulfate,and trace elemental sulfur, mainly pyrite [22, 25].
In the initial low-temperature stage, the TSR was low, anda small amount of H2S may form by the bond breakage ofunstable organic sulfur (such as thioether, thiol), hydrocar-bon oxidation, and sulfate reduction. H2S formed by hydro-carbon oxidation and sulfate reduction can in turn act as acatalyst to react with the dissolved form of sulfate to formS0, so the production of H2S was less. The possible reactionsare as follows [8, 26, 27]:
HC +HSO−4 MgSO4ð Þ ��!Slow
SO3 + HC
S2O3
S0 + HC
2664
3775���!Rapid
���!Rapid
���!Rapid
H2S + CO2 + Tar
SO3 + S0
H2S + Tar
ð11Þ
During thermal evolution, the formed hydrocarbons canreact with the generated H2S to produce organic sulfides.
H2S + HC⟶R’ − SH
R’ − Sx − R’
" #!Δ H2S + R’ − S0 R’ is alkyl
� �ð12Þ
As the temperature rises, unstable organic sulfides canundergo reduction reactions with sulfates.
R’ − SH
R’ − Sx − R’
" #+HSO−
4 MgSO4ð Þ⟶SO3 + HC
S2O3
S0 + HC
2664
3775���!Rapid
���!Rapid
���!Rapid
H2S + CO2 + Tar
SO3 + S0
H2S + Tar
ð13Þ
The presence and formation of S0 in turn provide a wayfor saturated hydrocarbons to be converted into naphthenicacids, aromatic hydrocarbons, and other sulfides, which usu-ally contain two major blocks [28]:
The first block is dehydrogenation (oxidation):
R-CH2CH3 + S R-CH=CH2 + H2S
+ 3S 3H2S+
+ 2S0 + 2H2SRS
RS
R-CH3 + 3S + 2H2O 3H2S + R-COOH
ð14Þ
The second block is sulfide formation.
R-H + S R-SH (Mercaptan)
2R-H + 2S R-S-R + H2S(Sulfide)
RS
+H2S (Cyclic sulfide)
RS
3H2S+R-C4H9 + 4S0
R-C4H9 + 2S0
(Thiophene heterocyclic compounds)
ð15Þ
R is the fatty group.Thiophene only begins to decompose at 450°C. The alkyl-
substituted phosgene loses its alkyl group around 500°C, andthe thiophene begins to decompose at 550°C. The thiophene
6 Geofluids

ring is stable, and decomposition begins only after at 800°C[29, 30]. The pyrolysis products of thiophene are usuallysome small-molecule compounds, such as sulfur, carbon,hydrogen sulfide, and acetylene. Under a hydrogen-richatmosphere, these compounds react as follows [11, 31, 32]:
SC=C-C=C + H2S
H2S
H2S
C4H10 + H2S
S+
S+
H2
H2
H2
H2 H2
C2H5 C3H7
S+
ð16Þ
Thiophene compounds can be generated by the reactionof sulfur or H2S with organic matter, or pyrite with organicmolecules similar to ethylene, and salts such as bauxite andmagnesium sulfate may promote the reaction.
+ 2SAl2O3, MgSO4
S R+ H2S
RC2H4ð17Þ
The sulfur in this experimental sample is mainly organicsulfur. The peak of H2S precipitation reaches its maximum at450~500°C, which obviously belongs to the form of sulfide.Subsequently, hydrogen sulfide is mainly formed by pyriteand thiophene sulfur, and FeS2 can be reduced to FeS andH2S at about 500°C. Structures such as aliphatic hydrocar-bons and hydrogenated aromatic hydrocarbons in coal gen-erate internal hydrogen radicals with hydrogen supplycapability during the thermochemical reduction reaction,which promotes the reduction and decomposition of pyrite.The comparison of the hydrogen sulfide gas yield shows thatthe maximum yield of H2S in the “coal+water and MgSO4”system is 2.5 times higher than the maximum yield of H2Sin the “coal+water” system and 8.5 times higher than themaximum yield of H2S in the “coal” system. This shows thatthe addition of MgSO4 intensified the TSR reaction and pro-moted the production of H2S gas. The variation characteris-tics of H2S production are shown in Figure 8.
Water plays an important role as a solvent, reactant, andreaction carrier in aqueous thermal simulation reactions. TheH element in the water is added to the coal sample under thesynergistic effect of free radicals and ion effects, or ionexchange occurs with the minerals in the coal; it changesthe environment of hydrothermal reaction to promote thecleavage of weak chemical bonds in the coal structure. Inthe process, it will also replace the oxygen-containing func-tional groups in the coal, so that the oxygen-containing func-tional groups decompose to form small-molecule gases andpolar substances remaining in the water. It can also exchangewith the hydrogen in coal and transfer in the coal structure.At the same time, the hydrogen and oxygen elements in thewater may also be replaced by hydrogen atoms on the ben-
zene ring under the synergistic effect of free radicals and ioniceffects to form phenols.
4. Conclusion
The results of thermal simulation experiments showed thatTSR promoted the cracking of coal, which led to an increasein the production of hydrogen sulfide and methane and adecrease in the production of heavy hydrocarbons. Thepresence of salts accelerates the evolution of hydrocarbonformation, and SO4
2-, Al3+, and Mg2+ contributed greatlyto the TSR, resulting in an increase in the total amount ofalkane gas and the production of H2S and CO2. Improvingthe salinity of the reaction system can promote the develop-ment of TSR.
In the thermal simulation system of coal, water is actuallya hydrogen donor, providing some protonic hydrogen to sta-bilize the unstable intermediate material and accompanyingthe generation of H2. In terms of gas production, the partic-ipation of water provides an additional source of hydrogenfor the TSR reaction to produce gas, which accelerates thereaction and promotes gas production. Water media play animportant role in the evolution of hydrocarbon generation.
Data Availability
The data used to support the findings of this study are avail-able from the corresponding author upon request.
Conflicts of Interest
The authors declare that they have no conflicts of interest.
Acknowledgments
This work was supported by the National Natural ScienceFoundation of China under grant no. 51774116, the trainingplan of young backbone teachers in colleges and universitiesof Henan Province under grant no. 2019GGJS052, and theFundamental Research Funds for the Universities of HenanProvince under grant no. NSFRF200327.
References
[1] M. Liu, Q. Deng, and F. Zhao, “Origin of hydrogen sulfide incoal seams in China,” Safety Science, vol. 50, no. 4, pp. 1031–1038, 2012.
[2] H. G.Machel, “Bacterial and thermochemical sulfate reductionin diagenetic settings – old and new insights,” SedimentaryGeology, vol. 140, no. 1-2, pp. 143–175, 2001.
[3] M. M. Cross, D. A. C. Manning, S. H. Bottrell, and R. H. Wor-den, “Thermochemical sulphate reduction (TSR): experimen-tal determination of reaction kinetics and implications of theobserved reaction rates for petroleum reservoirs,” OrganicGeochemistry, vol. 35, no. 4, pp. 393–404, 2004.
[4] X. Wang, Q. Ma, H. Chaojie, and R. Lin, “Study on formationmechanism of H2S by thermochemical sulfate reduction ofthiolane and magnesium sulphate,” Journal of China Univer-sity of Petroleum (Edition of Natural Science), vol. 44, no. 1,pp. 156–162, 2020.
7Geofluids

[5] R. H. Worden, W. J. Carrigan, and P. J. Jones, “Origin of H2Sin Khuff reservoirs by thermochemical sulfate reduction: evi-dence from fluid inclusions,” Saudi Aramco Journal of Tech-nology, vol. 1, pp. 42–52, 2004.
[6] K. Ding, S. Li, C. Yue, and N.-N. Zhong, “Simulation experi-ments on thermochemical sulfate reduction using naturalgas,” Journal of Fuel Chemistry & Technology, vol. 35, no. 4,pp. 401–406, 2007.
[7] C. Cai, Y. Tang, K. Li, K. Jiang, C. Jiang, and Q. Xiao, “Relativereactivity of saturated hydrocarbons during thermochemicalsulfate reduction,” Fuel, vol. 253, pp. 106–113, 2019.
[8] T. Zhang, G. S. Ellis, C. C. Walters, S. R. Kelemen, K.-s. Wang,and Y. Tang, “Geochemical signatures of thermochemical sul-fate reduction in controlled hydrous pyrolysis experiments,”Organic Geochemistry, vol. 39, no. 3, pp. 308–328, 2008.
[9] S. Zhang, H. Huang, J. Su, M. Liu, X. Wang, and J. Hu, “Geo-chemistry of Paleozoic marine petroleum from the TarimBasin, NW China: part 5. Effect of maturation, TSR and mix-ing on the occurrence and distribution of alkyldibenzothio-phenes,” Organic Geochemistry, vol. 86, pp. 5–18, 2015.
[10] B. C. Biehl, L. Reuning, J. Schoenherr, V. Lüders, and P. A.Kulka, “Impacts of hydrothermal dolomitization and ther-mochemical sulfate reduction on secondary porosity creationin deeply buried carbonates: a case study from the LowerSaxony Basin, Northwest Germany,” American Associationof Petroleum Geologists Bulletin, vol. 100, no. 4, pp. 597–621, 2016.
[11] Q. Deng, J. Yin, T. Zhang, and H.Wang, “Gas-producing char-acteristics of coals containing hydrogen sulfide by the thermo-chemical sulfate reduction,” Thermal Science, vol. 24, no. 4,pp. 2475–2483, 2020.
[12] W. Liu and X. Yongchang, “A two-stage model of carbon iso-topic fractionation in coal-gas,” Geochimica, vol. 4, pp. 359–366, 1999.
[13] S. Cui and W. Lv, “Effect of polyvinyl alcohol on pyrolysis ofbriquette,” Journal of Sichuan University (Natural Science Edi-tion), vol. 54, no. 6, pp. 1269–1274, 2017.
[14] Q. Deng, X. Wu, and Y. Wang, “Experimental study on ther-mochemical sulfate reduction reaction with coal,” Coal Con-version, vol. 42, no. 6, pp. 70–76, 2019.
[15] Q. Xiao, A. Amrani, Y. Sun et al., “The effects of selected min-erals on laboratory simulated thermochemical sulfate reduc-tion,” Organic Geochemistry, vol. 122, pp. 41–51, 2018.
[16] K. Li, S. C. George, C. Cai et al., “Fluid inclusion and stable iso-topic studies of thermochemical sulfate reduction: UpperPermian and Lower Triassic gasfields, northeast SichuanBasin, China,” Geochimica et Cosmochimica Acta, vol. 246,pp. 86–108, 2019.
[17] G. S. Ellis, W. Said-Ahmad, P. G. Lillis, L. Shawar, andA. Amrani, “Effects of thermal maturation and thermochemi-cal sulfate reduction on compound-specific sulfur isotopiccompositions of organosulfur compounds in Phosphoria oilsfrom the Bighorn Basin, USA,” Organic Geochemistry,vol. 103, pp. 63–78, 2017.
[18] M. Sośnicka and V. Lüders, “Fluid inclusion evidence for low-temperature thermochemical sulfate reduction (TSR) of drycoal gas in Upper Permian carbonate reservoirs (Zechstein,Ca2) in the North German Basin,” Chemical Geology,vol. 534, no. 20, p. 119453, 2020.
[19] M. A. Alrowaie, A. M. Jubb, A. Schimmelmann, M. Mastalerz,and L. M. Pratt, “Hydrous heating experiments at 130°C yield
insights into the occurrence of hydrogen sulfide and lightalkanes in natural gas reservoirs,” Organic Geochemistry,vol. 137, p. 103901, 2019.
[20] S. Yuan, G. S. Ellis, I. M. Chou, and R. C. Burruss, “Experimen-tal investigation on thermochemical sulfate reduction in thepresence of 1-pentanethiol at 200 and 250°C: implications forin situ TSR processes occurring in some MVT deposits,” OreGeology Reviews, vol. 91, pp. 57–65, 2017.
[21] D. Morad, F. H. Nader, S. Morad et al., “Limited thermochem-ical sulfate reduction in hot, anhydritic, sour gas carbonate res-ervoirs: the Upper Jurassic Arab Formation, United ArabEmirates,” Marine and Petroleum Geology, vol. 106, pp. 30–41, 2019.
[22] W. Li, Y. Tang, Q. Zhao, and Q. Wei, “Sulfur and nitrogen inthe high-sulfur coals of the Late Paleozoic from China,” Fuel,vol. 155, pp. 115–121, 2015.
[23] C. Chen-Lin, “Sulfur in coals: a review of geochemistry andorigins,” International Journal of Coal Geology, vol. 100,pp. 1–13, 2012.
[24] L. Gonsalvesh, S. P. Marinov, M. Stefanova, R. Carleer, andJ. Yperman, “Organic sulphur alterations in biodesulphurizedlow rank coals,” Fuel, vol. 97, pp. 489–503, 2012.
[25] S. Phillips, R. M. Bustin, and L. E. Lowe, “Earthquake-inducedflooding of a tropical coastal peat swamp: a modern analoguefor high-sulfur coals?,” Geology, vol. 22, no. 10, pp. 929–932,1994.
[26] P. Pirzadeh, S. Raval, and R. A. Marriott, “On the fate ofhydraulic fracturing fluid additives: thermochemical sulfatereduction reaction of sodium dodecyl sulfate,” Organic Geo-chemistry, vol. 83-84, pp. 94–100, 2015.
[27] G. Zhu, Y. Zhang, Z. Zhang et al., “High abundance ofalkylated diamondoids, thiadiamondoids and thioaromaticsin recently discovered sulfur-rich LS2 condensate in theTarim Basin,” Organic Geochemistry, vol. 123, pp. 136–143, 2018.
[28] B. Zheng, G. Ten, J. Zhang, G. Renxiang, and L. Wenhui, “Ori-gin of H2S from TSR and TDR reactions in oil/gas reservoirs inthe Feixianguan Formation the northeastern Sichuan Basin,”Oil & Gas Geology, vol. 31, no. 6, pp. 847–856, 2010.
[29] O. H. Ardakani, A. Chappaz, H. Sanei, and B. Mayer, “Effect ofthermal maturity on remobilization of molybdenum in blackshales,” Earth and Planetary Science Letters, vol. 449,pp. 311–320, 2016.
[30] C. Yue, S. Li, and H. Song, “Impact of TSR experimental sim-ulation using two crude oils on the formation of sulfur com-pounds,” Journal of Analytical and Applied Pyrolysis,vol. 109, pp. 304–310, 2014.
[31] J. Aali and O. Rahmani, “H2S–origin in South Pars gas fieldfrom Persian Gulf, Iran,” Journal of Petroleum Science andEngineering, vol. 86-87, pp. 217–224, 2012.
[32] P. Mougin, V. Lamoureux-Var, A. Bariteau, and A. Y. Huc,“Thermodynamic of thermochemical sulphate reduction,”Journal of Petroleum Science & Engineering, vol. 58, no. 3-4,pp. 413–427, 2007.
8 Geofluids