simulation and analysis of injection moulding and rapid - theseus
TRANSCRIPT

Bimo Murti
Simulation and analysis of injection moulding
and rapid prototyping
Bimo Murti
Degree Thesis
Industrial Management
20XX

2
DEGREE THESIS
Arcada
Degree Programme: Industrial Management
Identification number: 2753
Author: Bimo Murti
Title: Simulation and analysis of Injection Moulding product and
rapid prototyping
Supervisor (Arcada): Mathew Vihtonen
Commissioned by:
Abstract:
Injection Moulding is the one of the most common methods in producing plastic products
for many purposes ranging from a daily product to high-tech equipments. This thesis
studies the possibility of incorporating the Injection Moulding simulation software into
the mould design process in order to analyze the product, foresee the possible defects,
and optimize the design to achieve the maximum outcome of the products with minimum
cycle time in each production cycle. The Autodesk MoldFlow Plastic Insight will be ap-
plied as the analysis tool for the particular chosen product „Trolley Opener‟. In the analy-
sis, it will define the behaviour of plastic material starting from the filling phase until the
end of the cooling phase in the injection process. The final result shows that by doing the
analyses with the simulation software, it opens the possibility of having four cavity de-
signs of „Trolley Opener‟ in one mould plate of the size 156 x 156 mm. The author con-
cludes that by having the option of four cavity designs, it increases the optimization of
the mould design process, and increases the efficiency of time and material saving during
the production process.
Keywords: Injection moulding. Mould design. Product design. Trolley
opener. Moldflow simulation. Optimization.
Number of pages: 74
Language: English
Date of acceptance: 21 September 2010

3
Acknowledgement
Given this opportunity to express my gratitude, I‟d like to begin with my supervisor,
Mathew Vihtonen, who has been giving me huge supports, helps, ideas and advices dur-
ing my Thesis writing process. That follows with my gratitude to my examiner, Marko
Voho, for his valuable, knowledgeable and useful feedback for the Thesis. I‟d as well
like to express my big appreciation to the lecturers in Arcada, Henry Ericsson, Mariann
Holmberg, Erland Nyroth, Badal Durbo, for all the knowledge and life experience that
they have shared to me during my educational time in Arcada.
I‟d like to dedicate this Thesis work to my parents, who have never stopped showering
me with their pray, love and support all the way from Indonesia.
I‟d like to say thank you to Christian Stöhr, who has been very kind sharing his exten-
sive knowledge and help during my Thesis work. I‟d also like to hugely thank all the
good friends in Arcada that I‟m lucky enough to have, Paul Fletcher, Farzan Yazdani,
Kanya Anindita Effendy, Cuong Nguyen, for all the good times they have spent with me
and I hope it will still continue from this moment.
Last but not least, I‟d like to express my gratitude to Simo-Pekka Toivonen, with whom
I‟ve spent little time of friendship but a lot of moment of brotherhood since the begin-
ning of my stay in Finland.

4
TABLE OF CONTENTS
1 Introduction ............................................................................................................... 9
1.1 Background .................................................................................................... 9
1.2 Objective ...................................................................................................... 10
2 Literature Review .................................................................................................... 11
2.1 Injection Mould ............................................................................................ 11
2.2 The Process .................................................................................................. 12
2.3 Injection Moulding Machine Components ................................................... 13
2.3.1 Screw ........................................................................................................ 13
2.3.2 Barrel ........................................................................................................ 15
2.3.3 Heat Control ............................................................................................. 15
2.3.4 Nozzle ....................................................................................................... 15
2.3.5 Clamping system ...................................................................................... 17
2.4 Clamping Force ............................................................................................ 18
2.4.1 ENGEL CC 90 .......................................................................................... 21
2.5 Possible issues from production process ...................................................... 22
2.6 Mould ........................................................................................................... 24
2.7 Types of Mould for Injection Moulding ...................................................... 27
2.8 Gate .............................................................................................................. 28
2.9 Runners......................................................................................................... 29
2.10 Runner layout ............................................................................................... 31
2.11 Sprue............................................................................................................. 31
2.12 Venting ......................................................................................................... 32
2.13 Cooling channels .......................................................................................... 33
3 Method .................................................................................................................... 34
3.1 Product Design ............................................................................................. 34
3.2 Analysis of Injection Moulding Product ...................................................... 35
3.3 Meshing ........................................................................................................ 37
3.3.1 MidPlane Mesh ......................................................................................... 37
3.3.2 Dual Domain analysis technology ............................................................ 37
3.3.3 3D analysis technology ............................................................................. 38
3.4 Mesh Steps ................................................................................................... 38

5
3.5 Mesh Analysis .............................................................................................. 39
3.6 Mesh Error Fixing ........................................................................................ 41
3.7 Max Aspect Ratio – Manual Fixing ............................................................. 42
3.8 Gate Analysis Location ................................................................................ 44
3.9 Fill Analysis ................................................................................................. 46
3.10 Fill Analysis on 3D Mesh............................................................................. 49
3.11 Fill+Pack Analysis on 3D Mesh .................................................................. 52
3.12 Fill + Pack + Cool + Warp Analysis on 3D Mesh ....................................... 53
3.13 Two Cavity Design Analyses ....................................................................... 55
3.14 Runner Comparison...................................................................................... 58
3.14.1 Runner Type ............................................................................................. 58
3.14.2 Runner Layout .......................................................................................... 60
3.15 Three Cavity Design Analyses ..................................................................... 61
3.16 Four cavity design analysis .......................................................................... 63
3.17 Rapid Prototyping of the Mould .................................................................. 64
4 Study Results ........................................................................................................... 68
5 Conclusion ............................................................................................................... 71
6 Discussions .............................................................................................................. 72
7 References ............................................................................................................... 73

6
List of Figures
Figure 1. Injection Moulding Cycle ............................................................................... 12
Figure 2. Injection Moulding machine ........................................................................... 13
Figure 3. Screw illustration for L/D ratio ...................................................................... 14
Figure 4. The sections of the screw. ............................................................................... 14
Figure 5. Types of nozzle misalignment. ........................................................................ 16
Figure 6. Toggle clamping mechanical system. ............................................................. 17
Figure 7. Hydraulic clamping system............................................................................. 18
Figure 8. Chart of Mean Effective Pressure................................................................... 19
Figure 9. Typical mould used in Injection Moulding process] ...................................... 26
Figure 10 Types of Mould, left to right: Multi, single and family cavity mould ............ 27
Figure 11. Types of gates ............................................................................................... 28
Figure 12. Trapezoidal Runner ...................................................................................... 29
Figure 13. Full Circular Runner .................................................................................... 29
Figure 14. Half Circular Runner .................................................................................... 29
Figure 15. Mod Trapezoidal Runner .............................................................................. 29
Figure 16. Balance Runner system ................................................................................. 32
Figure 17. Imbalance Runner system ............................................................................. 32
Figure 18. Guidelines for cooling channels dimension .................................................. 33
Figure 19 Guidelines for Figure 18. .............................................................................. 33
Figure 20. Cooling channels position. ........................................................................... 34
Figure 21. The ‘Trolley Opener’ product design ........................................................... 35
Figure 22. Mesh Statistics for analysis .......................................................................... 39
Figure 23. Aspect ratio illustration ................................................................................ 40
Figure 24. Results of Aspect Ratio Diagnostics ............................................................. 43
Figure 25. Gate Analysis (Top view) .............................................................................. 45
Figure 26. Gate Analysis (3D View) .............................................................................. 45
Figure 27. Flow Resistance Indicator – Top View ......................................................... 46
Figure 28. Fill Time - Fill Analysis (2D) ....................................................................... 48
Figure 29. Weld lines – Fill Analysis (2D) ..................................................................... 48
Figure 30. Mesh Statistics before conversion to 3D Mesh ............................................. 50
Figure 31. Density – Fill Analysis 3D ............................................................................ 51

7
Figure 32. Volumetric Shrinkage – Fill Analysis 3D ..................................................... 51
Figure 33. Density - Fill + Pack Analysis 3D ................................................................ 52
Figure 34. Volumetric Shrinkage - Fill + Pack Analysis 3D ......................................... 52
Figure 35. Gate Location A ............................................................................................ 56
Figure 36. Gate Location B ............................................................................................ 56
Figure 37. Gate Location C ............................................................................................ 56
Figure 38. Weld Lines on gate location A ...................................................................... 56
Figure 39. Weld line on gate location B ......................................................................... 56
Figure 40. Weld line on gate location C ........................................................................ 57
Figure 41. Straight type runner ...................................................................................... 60
Figure 42. ‘V’ type runner .............................................................................................. 60
Figure 43. Design for 3 cavities ..................................................................................... 62
Figure 44. Design for 4 cavities ..................................................................................... 63
Figure 45. MasterCAM tool path of Trolley Opener...................................................... 65
Figure 46. Tool speed settings ........................................................................................ 66
Figure 47. MasterCAM tool verification ........................................................................ 67
Figure 48. Dimension of the mould plate ....................................................................... 67
Figure 49. Sprue Bushing design ................................................................................... 68
Figure 50. Mould Prototype for Trolley Opener (Top View) ......................................... 70
Figure 51. Mould Prototype for Trolley Opener ............................................................ 70

8
List of Tables
Table 1. Viscosity factors of plastics. ............................................................................. 19
Table 2. ENGEL CC 90 Machine Specification ............................................................. 21
Table 3. Possible issue in Injection Moulding process. ................................................. 22
Table 4. Processing Guideline for PP ............................................................................ 24
Table 5. Max aspect ratio for different analysis. ............................................................ 40
Table 6. Fill Analysis result (2D) ................................................................................... 47
Table 7. Fill Analysis Result for 3D ............................................................................... 51
Table 8. Results for Fill + Pack Analysis 3D ................................................................. 53
Table 9. Cooling Channels requirement for Cool + Warp analysis .............................. 53
Table 10. Results of Fill + Pack + Cool + Warp Analysis ........................................... 54
Table 11. Comparison for different location of Gate ..................................................... 56
Table 12. Comparison for different types of runners ..................................................... 59
Table 13. Comparison of different layout of runner ....................................................... 61
Table 14. Sprue Bushing dimension detail ..................................................................... 68
Table 15. Overall comparison of different cavity option ............................................... 69

9
1 INTRODUCTION
1.1 Background
In today plastic industry, the mergers and acquisitions continue to be the order of the
day in the plastics supply chain. There also continues to be a slow-but-steady shift in
supply to Asia, as it becomes the largest regional market for plastics consumption, and
also to the Middle East, as consumption there rises but, more significantly, as oil suppli-
ers there view plastics as a prime opportunity to diversify their downstream product
lines.
If there is one long-term constant in this industry, it is that the price of plastics derived
from petrochemicals will rise. Though many market watchers predict there will be sig-
nificant overcapacity in upcoming years, to date there has been no sign of that on plas-
tics prices. All the more reason to ensure a processor “makes every pellet count” by
maximizing the efficiency of his process. This includes both ensuring the machinery
and process are optimized, as well as knowing as much as possible about the materials
purchased and those that offer possible lower-cost options. Canon Communication [18].
Injection Moulding is one of the common methods to do the mass-production of plastic
product. With 32% of the plastic in the world are processed by injection moulding, IMR
[17], the mould design for injection moulding has become a very critical aspect to
achieve the optimum use of a mould plate. In this time and situation, Injection Moulding
simulation software is the right tool to be incorporated in the mould design process. It is
what helps the mould designer and mould maker to get the maximum output of a mould
plate for a particular product design.
Autodesk Moldflow Plastic Insight is an in-depth process simulation tools to predict and
eliminate potential manufacturing problems and optimize part design, mould design and
the moulding process itself. There are over nineteen distinct modules that can be used to
simulate nine unique moulding processes, by which thermoplastic injection moulding is
one of them. Moldflow [11]. In this thesis study, the author will introduce the use of the

10
Moldflow software to optimize the mould design process and foresee possible issue in
production process.
1.2 Objective
There are several objectives for the purpose of this thesis;
1. To analyze the behaviour of Thermoplastic material during the production cycle
from the filling phase until the ejection phase
2. To foresee the possible problem for a product design; and therefore able to op-
timize the design in the mould design process
3. To achieve the minimum production cycle time
4. To construct a rapid prototyping of the mould cavity design into a standard alu-
minium mould plate

11
2 LITERATURE REVIEW
2.1 Injection Mould
One of the most common processing methods to produce plastic products is the Injec-
tion Moulding. Its method has shaped the world of engineering plastic products nowa-
days. The variety of products it is able to produce ranges from simple products like
combs and DVD casings to complex engineering products such as automotive
dashboard and hardware parts of an aircraft. The list of its product is endless. So does
the application. The product of Injection Moulding is being used almost in every field of
our daily life, such as logistics, construction, automotives, household appliances, etc.
The Injection Moulding machine was first patented in 1872 in the United States. It did
not seem to be very successful, however, seeing not so many breakthrough events were
made which involved the use of the machines in the following years. Progress was made
along the way, although it seemed to be slow. The important improvement that was
made over the years was to find ways to generate higher pressure and having a greater
clamping force. It was not until late 1930 that the Injection Moulding method is widely
used in its capacity to produce variety of mass-produced products due to the demands
the World War II created. And it is around the same time that the hydraulics operated
machine is introduced which enable the machine to produce a higher pressure and
greater clamping force, ultimately resulting in the higher quality of finished products.
Still some improvements were made during that era including the introduction of the
screw system which enables the machine to properly heat and mix the material before it
gets injected, and allowing the colour and other additives to be added before the injec-
tion process. Crawford [1]. The Injection Moulding offers lots of advantages as a mass-
production method including the high and fast production rates, less expensive labour
cost, and minimum scrap losses.
12
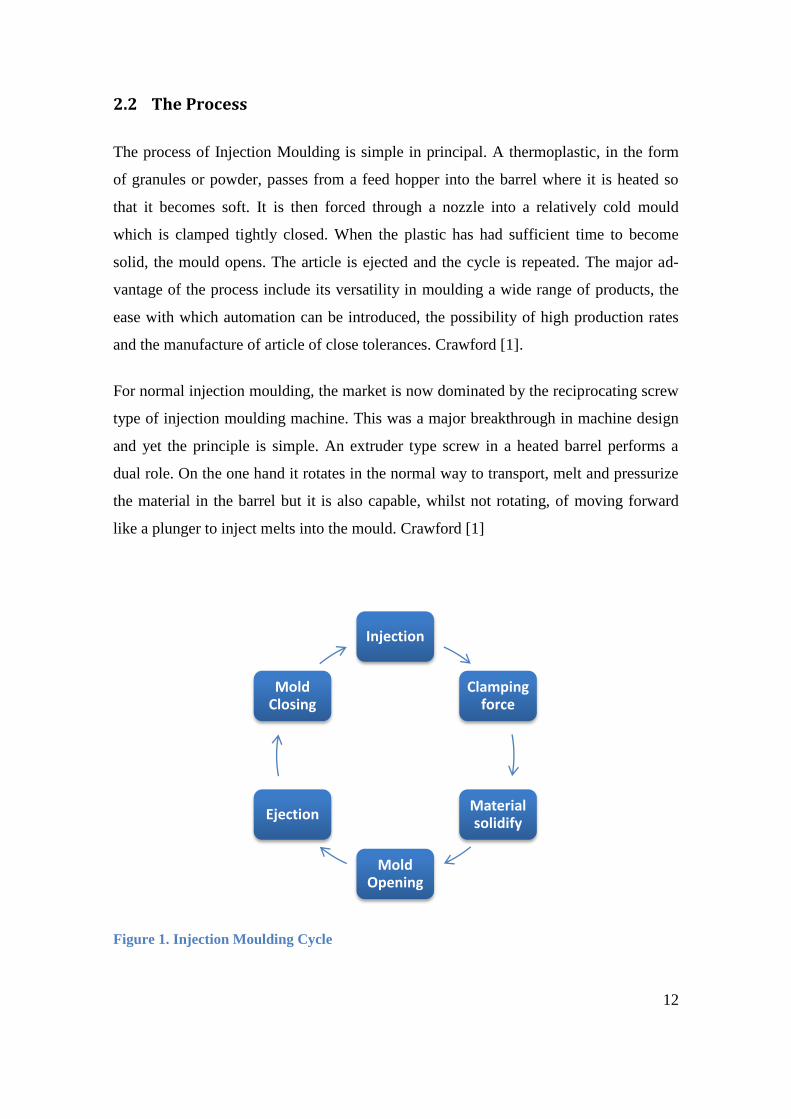
2.2 The Process
The process of Injection Moulding is simple in principal. A thermoplastic, in the form
of granules or powder, passes from a feed hopper into the barrel where it is heated so
that it becomes soft. It is then forced through a nozzle into a relatively cold mould
which is clamped tightly closed. When the plastic has had sufficient time to become
solid, the mould opens. The article is ejected and the cycle is repeated. The major ad-
vantage of the process include its versatility in moulding a wide range of products, the
ease with which automation can be introduced, the possibility of high production rates
and the manufacture of article of close tolerances. Crawford [1].
For normal injection moulding, the market is now dominated by the reciprocating screw
type of injection moulding machine. This was a major breakthrough in machine design
and yet the principle is simple. An extruder type screw in a heated barrel performs a
dual role. On the one hand it rotates in the normal way to transport, melt and pressurize
the material in the barrel but it is also capable, whilst not rotating, of moving forward
like a plunger to inject melts into the mould. Crawford [1]
Figure 1. Injection Moulding Cycle
Injection
Clamping force
Material solidify
Mold Opening
Ejection
Mold Closing

13
2.3 Injection Moulding Machine Components
2.3.1 Screw
The screw used in the nowadays injection moulding machine is what offers the effi-
ciency and simplicity of the method. The injection screw is able to perform several tasks
in the moulding cycle. While it rotates, it is able to melts, pressurizes, and conveys the
plastic material from the rear end of the barrel to the tip of the nozzle. And whilst the
screw is not rotating, it is also capable of moving forward like a plunger to perform the
injection of the molten plastic into the mould. Crawford [1].
Figure 2. Injection Moulding machine. [Scribd (2,p.3)].
The screw in injection moulding is commonly designed that its size increases gradually
to let better mixing, melting, and homogenization of the plastic materials. The screw
design is divided into three parts. The first part is the feed section where the material
will go after entering the barrel. In the feed section most of the material will still be pel-
lets. Then as the screw rotates, they are conveyed to the next section which is the transi-
tion section. In the transition section, the solid pellets will start to be melting down and

14
pressurized. Once all the plastic material is successfully molten, they will be conveyed
to the third section which is the metering section. In here the molten material will be
accurately deposited with the appropriate viscosity and temperature to do the injection.
Scribd [2].
The size of the screw is commonly addressed by its L/D ratio which typically will be 15
to 20, and by its compression ratio which is usually 2.5:1 to 4:1. Crawford [1]. L/D ratio
is defined by the ratio of the defined length to the diameter of the screw. The figure be-
low shows the draft of the screw.
Figure 3. Screw illustration for L/D ratio. [Womer (3,p.1)]
Therefore the L/D ratio will be:
(eq.1)
The compression ratio is defined as the ratio of the feed depth (hf) to the metering depth
(hm) of the screw. The higher the compression ratio, the greater the resulting shear heat
imparted to the material, and the greater the heat uniformity of the melt. Womer [3].
Figure 4. The sections of the screw. [Womer (3,p.3)]
Example given will be a 60 mm diameter screw with the feed depth (hf) of 9 mm and a
metering depth (hm) of 3mm. Then the compression ratio will be calculated as such:

15
2.3.2 Barrel
The plastic material will enter the barrel once it is fed to the feed hopper. The barrel
consists of cooling water channel, heater bands, screw and thermocouple whose func-
tion is to note the temperature in each section of the barrel. The time it takes for the
plastic material from entering the barrel to the nozzle is called the residence time. Craw-
ford [1].
2.3.3 Heat Control
In the injection moulding machine, the heats are produced by electric heater bands that
surround the barrel. The machine requires a specific size and power output electric
heater in order to maintain the stability and the success of the heating process. It is also
one of the tricky things about replacing the heaters when one of them is no longer func-
tioning. In most cases it will be easy to replace the heater band within the same size that
fits in to the machine, regardless of having different power output. This action could
lead to the instability of the heating process and process control problems later. Hence
the thermocouples or RTDs are normally used to control and detect the barrel tempera-
ture which could maintain the correct power output. Mucio [5].
2.3.4 Nozzle
The nozzle is located in the end of the barrel. It provides the means by which the melt
can leave the barrel and enter the mould. It is also a region where the melt can be heated
both by friction and conduction from a heater band before entering the relatively cold
channels in the mould. Contact with the mould causes heat transfer from the nozzle and
in cases where it is excessive it is advisable to withdraw the nozzle from the mould dur-
ing the screw-back part in the moulding cycle. Otherwise the plastic may freeze-off in
the nozzle. Crawford [1].
A steel insert in an injection mould which contains the sprue hole and has a seat for the
injection cylinder nozzle. Answer [4]. The injection unit of the nozzle is located against
16
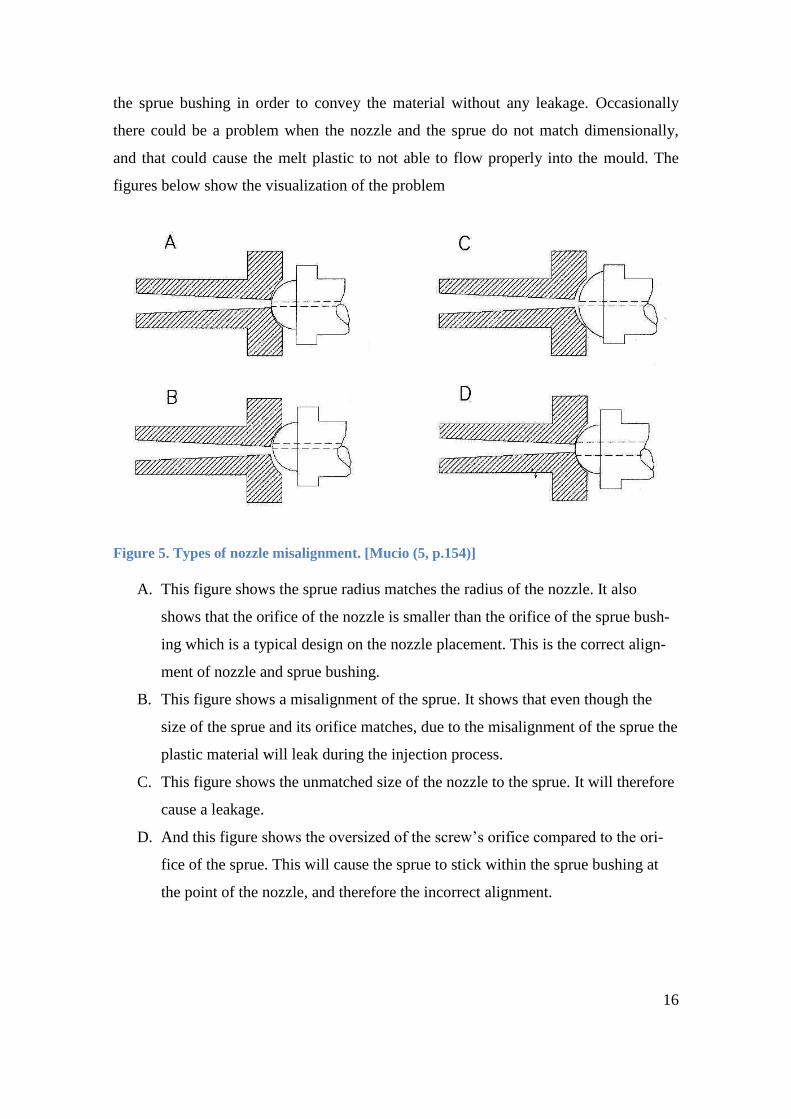
the sprue bushing in order to convey the material without any leakage. Occasionally
there could be a problem when the nozzle and the sprue do not match dimensionally,
and that could cause the melt plastic to not able to flow properly into the mould. The
figures below show the visualization of the problem
Figure 5. Types of nozzle misalignment. [Mucio (5, p.154)]
A. This figure shows the sprue radius matches the radius of the nozzle. It also
shows that the orifice of the nozzle is smaller than the orifice of the sprue bush-
ing which is a typical design on the nozzle placement. This is the correct align-
ment of nozzle and sprue bushing.
B. This figure shows a misalignment of the sprue. It shows that even though the
size of the sprue and its orifice matches, due to the misalignment of the sprue the
plastic material will leak during the injection process.
C. This figure shows the unmatched size of the nozzle to the sprue. It will therefore
cause a leakage.
D. And this figure shows the oversized of the screw‟s orifice compared to the ori-
fice of the sprue. This will cause the sprue to stick within the sprue bushing at
the point of the nozzle, and therefore the incorrect alignment.

17
2.3.5 Clamping system
Clamping system is necessary to have a solely purpose, which is to keep the mould
tightly closed under sufficient pressure to let the molten plastic fill in the cavity without
leaking during the injection process. The system to do the required clamping could use
either a hydraulic, mechanical (toggle), or both.
The toggle clamping system clamps the mould using a mechanical advantage developed
through series of linkages. As the linkages are forced into a straight or closed position
by the action of a hydraulic cylinder on a crosshead, the tie bars strain or stretch, and
clamping forces are developed. The advantages of the toggle system are their fast mo-
tion, low oil flow requirement, and positive clamping action with no pressure loss. The
disadvantage is they allow the processor little or no control over tonnage variation, and
frequent maintenance is necessary. Mucio [5].
Figure 6. Toggle clamping mechanical system. [Mucio (5, p.159)]
On the other hand, the hydraulic clamping system has made great inroads into the plas-
tic moulding machine sector over the past decade. Hydraulic system has been around
from 100 years, and the current design integrates several features to improve efficiency
and reliability. In the hydraulic clamping system, it uses oil as part of the system to
move the hydraulic cylinders and pushing the moving platen with the required clamp
force. It pushes the mould to close and the clamping force can be adjusted to avoid any
leakage. Some advantages found in this system are that they have simple design, allow

18
the processor to adjust the force, and require less maintenance due to fewer moving
parts. The disadvantages of the system are the variations in the system pressure, depend-
ing on the oil viscosity, and inefficiency due to the large volumes of oil moved. Mucio
[5].
Figure 7. Hydraulic clamping system. [Mucio (5, p.160)]
2.4 Clamping Force
It is the amount of force required to keep the mould closed whilst the injection process
is ongoing without letting any leakage of the molten material happen during the process.
It is generally affected by several factors such as the mould size, the mould type, thick-
ness of wall mould, viscosity factor of the plastic material and the projected area of the
mould cavity.
The relationship between the projected mould area and the clamp requirement is a very
essential aspect of the whole injection moulding cycle. It is necessary for the mould
maker to be able to estimate what clamping force will be needed. Before setting up a
mould in the machine it is always worthwhile to check that there is sufficient clamping
force in the machine. Practical experience suggests that the clamping pressure over the
projected area should be between 10 and 50 MN/m2. Crawford [1]
The clamping force depends on the geometry of the cavity. In particular the flow ratio
(flow length/channel lateral dimension) is important. Figure 8 shows the typical varia-
tion of Mean Effective Pressure for different thickness and flow ratio. To calculate

19
clamp force, simply multiply the appropriate Mean Effective Pressure by the projected
area of the moulding. The data used for the figure 8 is typical for easy flow material
such as Polypropylene, Polyethylene and Polystyrene. In practical it is prudent to in-
crease the value by 10-20% due to uncertainties associated with different mould cases.
Crawford [1].
Figure 8. Chart of Mean Effective Pressure. [Crawford (1, p.295)]
For plastic other than easy flow material referred to above, it would be normal to apply
a factor to allow for higher viscosity. Typical viscosity factors can be seen from figure
below.
Table 1. Viscosity factors of plastics. [Crawford (1, p.295)]
Material Viscosity Factor
Polyethylene, Polystyrene, Polypropylene 1
Nylon 66 1.2 – 1.4
ABS 1.3 – 1.4
Acrylic 1.5 – 1.7
PVC 1.6 – 1.8
Polycarbonate 1.7 – 2.0

20
There are several ways to calculate the clamping force; formulas are available on the
mould design book, plastic guide book, online clamp force calculator, and simulation
software. In today‟s mould design industry it is common to calculate the clamp force
using an injection moulding simulation software, i.e. Autodesk Moldflow. However, it
is always prudent to understand the basic principle of how to make an estimation of the
clamping force of a selected design.
The example shown below is the method from the work of Crawford (1998) in calculat-
ing Clamp Force in the mould industry.
Example 1
The mould produces four cups shaped ABS moulding. The depth of the cups is 60mm,
the diameter is 90mm and the wall thickness is 1.0 mm. The distance from the sprue to
the cavity is 40 mm and the runner diameter is 6mm. The maximum flow length from
the gate to the end of melt flow path is 150 mm. Calculate the clamp force necessary on
the moulding machine.
Calculation
Knowing all the data above, one can use several tables referenced to the work of Craw-
ford (1998), such as Mean Effective Pressure and Viscosity chart. With the wall thick-
ness of 1 mm, then the ratio of flow path to the wall thickness is 150/1 = 150. Figure 8
show that the Mean Effective Pressure with 150 flow ratio and 1 mm wall thickness is
75 MN/m2. If 15% extra value is incorporated for uncertainties factor and the viscosity
factor for ABS is applied, then the Mean Effective Pressure will be 75 x 1.15 x 1.4 =
120 MN/m2.
For each cup cavity, the projected area will be:
Therefore the clamp force for each cavity will be:

21
The runner also plays role in adding the clamp force, and the projected area of the run-
ner is:
Therefore the clamp force for the runner is:
(eq.2)
So in total, the entire clamp force for 4 cup cavities and the runner system is:
2.4.1 ENGEL CC 90
For this study, the findings of the clamp force in the final result will be compared to the
capacity of the clamping force provided by the ENGEL Injection Moulding Machine
CC 90 which is located in the Arcada Plastic Lab. The purpose of this comparison is to
find if the particular Injection Moulding machine will be able to provide the required
clamping force for the final design of the mould.
The ENGEL CC 90 has the specific data shown in table 2 below, referenced from the
web page of the Arcada Plastic Lab Manager, Erland Nyroth [14].
Table 2. ENGEL CC 90 Machine Specification
ENGEL CC 90 specification Value
Clamp Force 500 kN
Opening Distance 330 mm
Pushing Distance 100 mm
Mounting Plate 460 x 310 mm
Pumping Force 15 kW
Oil Quantity 130 litre
22
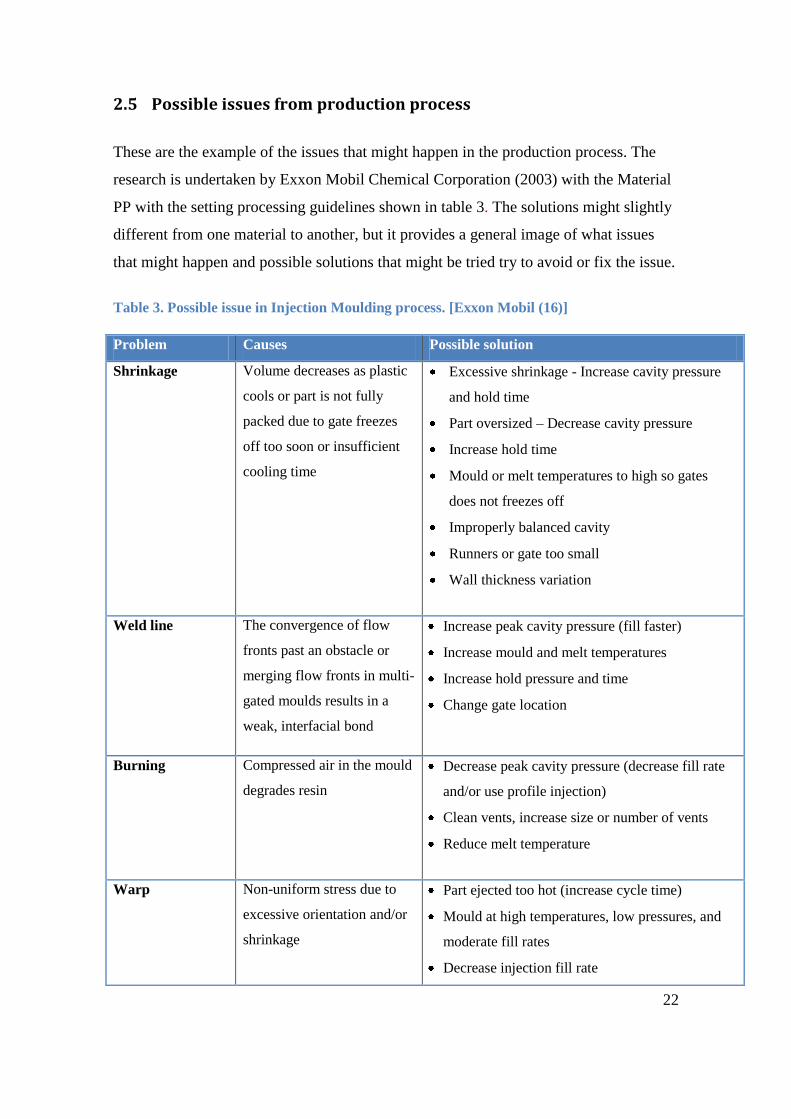
2.5 Possible issues from production process
These are the example of the issues that might happen in the production process. The
research is undertaken by Exxon Mobil Chemical Corporation (2003) with the Material
PP with the setting processing guidelines shown in table 3. The solutions might slightly
different from one material to another, but it provides a general image of what issues
that might happen and possible solutions that might be tried try to avoid or fix the issue.
Table 3. Possible issue in Injection Moulding process. [Exxon Mobil (16)]
Problem Causes Possible solution
Shrinkage Volume decreases as plastic
cools or part is not fully
packed due to gate freezes
off too soon or insufficient
cooling time
Excessive shrinkage - Increase cavity pressure
and hold time
Part oversized – Decrease cavity pressure
Increase hold time
Mould or melt temperatures to high so gates
does not freezes off
Improperly balanced cavity
Runners or gate too small
Wall thickness variation
Weld line The convergence of flow
fronts past an obstacle or
merging flow fronts in multi-
gated moulds results in a
weak, interfacial bond
Increase peak cavity pressure (fill faster)
Increase mould and melt temperatures
Increase hold pressure and time
Change gate location
Burning Compressed air in the mould
degrades resin
Decrease peak cavity pressure (decrease fill rate
and/or use profile injection)
Clean vents, increase size or number of vents
Reduce melt temperature
Warp Non-uniform stress due to
excessive orientation and/or
shrinkage
Part ejected too hot (increase cycle time)
Mould at high temperatures, low pressures, and
moderate fill rates
Decrease injection fill rate

23
Improperly balanced core and cavity temperature
Moulded in stress due to low stock temperature
and cold mould
Minimize hot spots in mould
Improperly balanced multiple gates
Flow too long, insufficient gates
Change gate location
Poor Appearance
(Flow marks, low
gloss, rough sur-
face, jetting, or-
ange peel, etc.)
Flow front slips-sticks on-
mould surface, jets, or pul-
sates
Increase cavity pressure
Fill speed and/or packing time too low
Increase melt and/or mould temperature
Mould temperature non-uniform or too low
Dirty mould surface (clean and/or polish)
Increase venting
Improper gate location or design
Sticking in Mould Over packing, excessive
shrinkage, tool design causes
physical attachment to the
core or cavity
Over packing, injection pressure too high
Under packing, excessive shrinkage
Improperly balanced mould temperatures (colder
on movable half)
Reduce cycle time (sticking on cores)
Increase cycle time (sticking in cavities)
Insufficient ejector pins
Remove undercuts
Increase draft angles
24
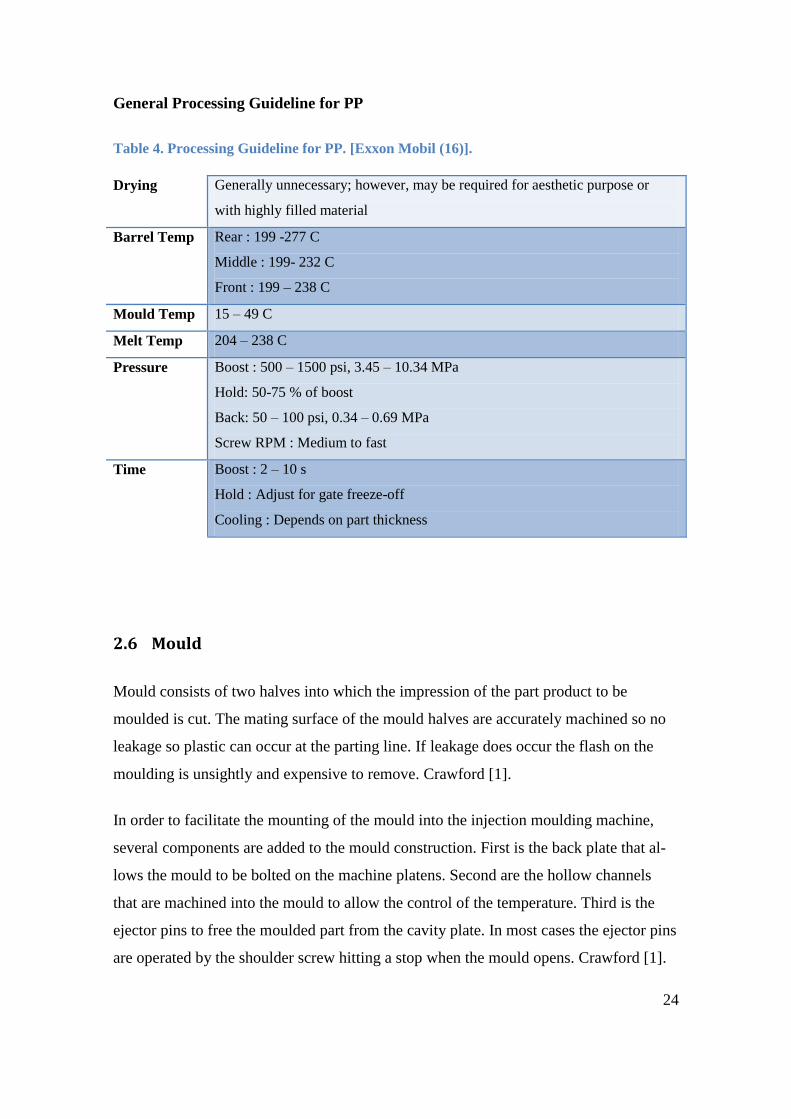
General Processing Guideline for PP
Table 4. Processing Guideline for PP. [Exxon Mobil (16)].
Drying Generally unnecessary; however, may be required for aesthetic purpose or
with highly filled material
Barrel Temp Rear : 199 -277 C
Middle : 199- 232 C
Front : 199 – 238 C
Mould Temp 15 – 49 C
Melt Temp 204 – 238 C
Pressure Boost : 500 – 1500 psi, 3.45 – 10.34 MPa
Hold: 50-75 % of boost
Back: 50 – 100 psi, 0.34 – 0.69 MPa
Screw RPM : Medium to fast
Time Boost : 2 – 10 s
Hold : Adjust for gate freeze-off
Cooling : Depends on part thickness
2.6 Mould
Mould consists of two halves into which the impression of the part product to be
moulded is cut. The mating surface of the mould halves are accurately machined so no
leakage so plastic can occur at the parting line. If leakage does occur the flash on the
moulding is unsightly and expensive to remove. Crawford [1].
In order to facilitate the mounting of the mould into the injection moulding machine,
several components are added to the mould construction. First is the back plate that al-
lows the mould to be bolted on the machine platens. Second are the hollow channels
that are machined into the mould to allow the control of the temperature. Third is the
ejector pins to free the moulded part from the cavity plate. In most cases the ejector pins
are operated by the shoulder screw hitting a stop when the mould opens. Crawford [1].

25
Sprue is the feed opening provided in injection moulding between the nozzle and cavity
or runner system. It is designed to deliver the melt thermoplastic material from the noz-
zle of the injection moulding machine into the mould as an entrance point. Once the
plastic material arrives inside the mould, it will follow the path onto the cavity through
the runner system. In the case of multi cavity mould, runner is the channel that connects
the sprue with the gate for transferring the melt to the cavities. Before the plastic mate-
rial enters the mould cavity, it will pass the section called Gate. Gate is an orifice
through which the melt enters the mould cavity. DRM [6].
The manufacturing of injection mould requires a high precision engineering manufac-
turing skill to get a very close tolerance. A typical mould can consist of (i) the cavity
and the core and (ii) the remainder of the mould, often referred to bolster. The latter is
more straightforward because conventional machine tools can be typically used to prod-
uct it. However, the cavity and the core may be quite complex is shape so often they
require special techniques. These can include casting, electro-deposition, hobbing, pres-
sure casting, spark erosion, and automatic NC machining. Crawford [1]. Figure 9 shows
the typical illustration of mould used in the injection mould method.

26
Figure 9. Typical mould used in Injection Moulding process. [Crawford (1, p.286)]
Moulds are typically manufactured from hardened steel, pre-hardened steel, aluminium,
and/or beryllium-copper alloy. The choice of material to build a mould from is primarily
one of economics; in general, steel moulds cost more to construct, but their longer life-
span will offset the higher initial cost over a higher number of parts made before wear-
ing out. Pre-hardened steel moulds are less wear-resistant and are used for lower volume
requirements or larger components. Hardened steel moulds are by far the superior in
terms of wear resistance and lifespan. Aluminium moulds can cost substantially less,
and, when designed and machined with modern computerized equipment, can be eco-
nomical for moulding tens or even hundreds of thousands of parts. Rosato [7].
27
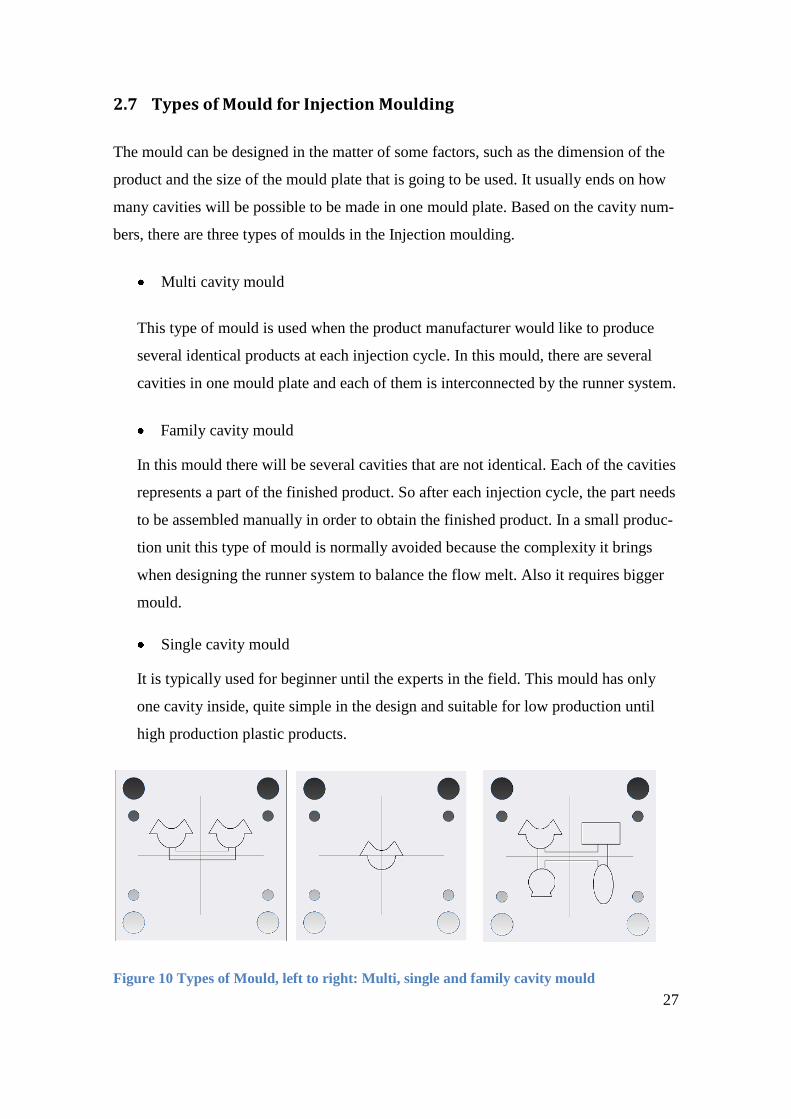
2.7 Types of Mould for Injection Moulding
The mould can be designed in the matter of some factors, such as the dimension of the
product and the size of the mould plate that is going to be used. It usually ends on how
many cavities will be possible to be made in one mould plate. Based on the cavity num-
bers, there are three types of moulds in the Injection moulding.
Multi cavity mould
This type of mould is used when the product manufacturer would like to produce
several identical products at each injection cycle. In this mould, there are several
cavities in one mould plate and each of them is interconnected by the runner system.
Family cavity mould
In this mould there will be several cavities that are not identical. Each of the cavities
represents a part of the finished product. So after each injection cycle, the part needs
to be assembled manually in order to obtain the finished product. In a small produc-
tion unit this type of mould is normally avoided because the complexity it brings
when designing the runner system to balance the flow melt. Also it requires bigger
mould.
Single cavity mould
It is typically used for beginner until the experts in the field. This mould has only
one cavity inside, quite simple in the design and suitable for low production until
high production plastic products.
Figure 10 Types of Mould, left to right: Multi, single and family cavity mould

28
2.8 Gate
Gate is an orifice through which the melt enters the mould cavity [6]. It has several
functions. First it provides a convenient weak link by which the moulding can be broken
off from the runner system. In some cases, the degating may be automatic when the
mould opens. The gate also acts like a valve that it allows molten plastic to fill the
mould but being small it usually freezes off first. The cavity is thus sealed off from the
runner system which prevents material being sucked out of the cavity during screw-
back. As a general rule, small gates are preferable because no fishing is required if the
moulding is separated cleanly from the runner. So for the initial trials on a mould gates
are made as small as possible and are only opened up if there is mould filling problem.
Crawford [1].
There are some examples of gate design in figures 11. Sprue gates are used when the
sprue bush can feed directly into the mould cavity as, for example, a single cavity
mould. Pin gates are particularly successful because they cause high shear rates which
reduce the viscosity of the plastic and so the mould fills more easily. The side gate is the
most common type of gate and is a simple rectangular section feeding into the side of
the cavity. A particular attraction of this type of gate is that mould filling can be im-
proved by increasing the width of the gate but the freeze time is unaffected because the
depth is unchanged. Crawford [1].
Figure 11. Types of gates. [Crawford (1, p.287)]
The location of the gate is of great importance for the properties and appearance of the
finished part. The melt should fill the cavity quickly and evenly. For gate design the fol-
lowing points should be considered:
Locate the gate at the thickest section

29
Note gate marks for aesthetic reason
Avoid jetting by modifying gate dimension or position
Balance flow path to ensure uniform filling and packing
Prevent weld lines or direct to less critical section
Place for ease of degating [9]
A distinction can be made between centre type of gate, such as sprue gate and pin gate,
and edge type of gate, such as side gate. Centre gated parts show a radical flow of the
melt. This type of gate is particularly good from symmetrical parts such as cup shaped
product, because it will assure more uniform distribution of material, temperatures,
packing, and better orientation effects it gives very predictable results. On the other
hand, linear flow and cross flow properties often differ. In flat parts, this can induce ad-
ditional stress and results in warpage and uneven shrinkage. DSM [9].
Because of their simplicity and ease of manufacture, edge gates are the most commonly
used. These work well for a wide variety of parts that are injection moulded. Long nar-
row product parts typically use edge gates at or near one end in order to reduce war-
page. DSM [9].
2.9 Runners
The runner system is a manifold for distribution of thermoplastic melt from the machine
nozzle to the cavities. The sprue bushing and runners should be as short as possible to
ensure limited pressure drop. Figure 12 -16 illustrates different type of runner system,
which is trapezoidal, full circular, half circular, and modified trapezoidal.
Figure 12. Trape-
zoidal Runner
Figure 13. Full Cir-
cular Runner
Figure 14. Half Cir-
cular Runner
Figure 15. Mod Trape-
zoidal Runner

30
The comparison for this chapter will be able to help one determining which the most
suitable runner type is. The criteria for the runner to be considered as a good runner sys-
tem are:
1. Deliver the melt to the cavities
2. Have the balance filling in multi cavities
3. Minimum scrap
4. Eject easily
5. Maximize efficiency in energy consumption
6. Control the filling/packing/cycle time
From the four types of runners shown above, each of them has their own advantages and
disadvantages. A full-circular runner is considered as the most ideal runner design be-
cause it ensures more balance melt flow and cooling. The disadvantage of it is that the
machining requires to be done in both cavities; therefore it requires much higher preci-
sion in the machining because it is very essential to have the runner design accurately
matched in both cavities. Otherwise, the defects in the runners will appear and it will
affect the efficiency of the runner as well as destroying to the mould plate. Due to the
high precision that is required on making this type of runners, it usually affects the
mould price to be more expensive than other types.
On the other hand, Half-Circular runner has the advantages of only having to be ma-
chined in one mould plate, but it has an additional advantage that it provides the least
scrap amongst other types. That is mainly the reason of having the half-circular runner
type. Because even though that runner type does not provide the maximum cross section
area, but as long as the runner system is able to deliver its task as a medium for the
thermoplastic to fill the cavity perfectly, and simultaneously giving a significant amount
of material saving during the production cycle, it should not be such an issue in the pro-
duction process.
The Trapezoidal and the modified trapezoidal are the improvement design from the
original square runner type. With the square runner type, an issue that always happens is
that it does not come off easy. That is why a 10o angle is incorporated in the design and
it creates the trapezoidal runner design. The modified rounded off trapezoidal design

31
incorporates the desire to also have a circular shape. Both of them have the advantages
of provides the maximum cross section area while only need to be machined on a single
mould plate.
2.10 Runner layout
When designing runner layout, there are two main considerations. The runner length
should always be kept to a minimum to reduce pressure losses, and the runner system
should be balanced. The layout of the runner system will depend upon the following
factors:
The number of part impressions
Shape of the components
The type of mould ( two plate mould or three plate mould)
The type of gate
Runner balancing means that the distance the plastic material travels from the sprue to
the gate should be the same for each moulding. This system ensures that all the part im-
pressions will fill uniformly and without interruption providing the gate design are iden-
tical. However, it is not always practicable to have a balanced runner system particu-
larly when it applies to mould which incorporates a large number of differently shaped
part impressions. In these types of cases, the balance filling can be achieved by varying
the gate dimension on each cavity; this is called balance gating. Voho [10]. Figure 16
and 17 are the example of the balance and imbalanced runner system.
2.11 Sprue
Sprue is the channel along with the molten plastic first enters the mould. It delivers the
melt from the nozzle to the runner system. The sprue is incorporated in a hardened steel
bush which has a seat designed to provide a good seal with the nozzle. Since it is impor-
tant that the sprue is pulled out when the mould opens it is tapered with certain angle
and there is a sprue pulling device mounted directly opposite the sprue entry. Like the

32
runner system, the sprue is ultimately a waste so it should not be made excessively long.
Crawford [1].
Figure 16. Balance Runner system. [DSM
(9, p.28)]
Figure 17. Imbalance Runner system. [DSM
(9, p.27)]
2.12 Venting
Before the plastic melt is injected, the cavity in the closed mould contains air. When the
melt enters the mould, if the air cannot escape it become compressed. At worst this may
affect the mould filling, but in any case the sudden compression of the air causes con-
siderable heating. This may be sufficient to bum the plastic and the mould surface at
local hot spots. To lighten this problem, vents are machined into the mating surfaces of
the mould to allow the air to escape. The vent channel must be small so that molten
plastic will not flow along it and cause unsightly flash on the moulded article. Typically
a vent is about 0.025 mm deep and several millimetres wide. Away from the cavity the
depth of the vent can be increased so that there is minimum resistance to the flow of the
gases out of the mould. Crawford [1].

33
2.13 Cooling channels
For efficient moulding, the temperature of the mould should be controlled and this is
normally done by passing a fluid through a suitably arranged channel in the mould. The
rate at which the moulding cools affects the total cycle time as well as the surface finish,
tolerances, distortion and internal stresses of the moulded article. High mould tempera-
tures improve surface gloss and tend to eliminate voids. However, the possibility of
flashing is increased and sink marks are likely to occur. If the mould temperature is too
low then the material may freeze in the cavity before it is filled. In most cases the mould
temperatures used are a compromise based on experience. Crawford [1].
On the economical side, fast cooling is necessary to obtain the beneficial economical
production rates. And uniform cooling is necessary for product quality. In general, the
cooling channels is typically drilled or milled. Rough inner surface of the channels pro-
vides better hat exchange because it enhances the turbulent flow of coolant. Channels
have to be placed close to the mould cavity surface with equal centre distance in be-
tween. DSM [9]. Figure 18, 19, and 20 gives guidelines on the cooling channels diame-
ter and position regarding to the part impression.
Figure 18. Guidelines for cooling channels dimension. [DSM (9,p.40)]
Figure 19 Guidelines for Figure 18. [DSM (9,p.40)]

34
Figure 20. Cooling channels position. [DSM (9,p.40)]
3 METHOD
In this chapter the method to analyze the product design with Injection Moulding simu-
lation software will be discussed. This analysis functions as a preliminary guide in the
process of mould design, and can be used to help determining numbers of things in the
design such as the gate location, the number of cooling channels, the number of cavities,
and so on. The analysis that will be done in this study is Gate Analysis, Fill analysis,
Fill + Pack analysis, and Fill + Pack + Cool + Warp analysis. The Fill analysis will be
done in Dual Domain mode, whereas the continuation of the analyses series will be
done in 3D Mode.
3.1 Product Design
For this study, the product design has been evolving through a lot of phases from the
beginning of the INNOPLAST summer project in Arcada during the summer of 2008
until the research process of this thesis study. The design started with the intention of
developing a simple and locally manufacture-able plastic product for Arcada during the
summer period as an ordinary souvenir for the upcoming students in the autumn term.
The design has moved and changed through several phases with many factors taken into
consideration, the aesthetic aspect, the comfortable daily use, the suitable thickness, ma-
terial selection, and so on.

35
The product itself is the combination of 2 daily products that are typically used and
owned by most people in Finland as an individual product, which are the bottle opener
and the trolley coin for the supermarket. The Arcada logo is incorporated in the design
with the means of having the ability to incorporate a logo or a symbol on the trolley
coin in 0.5mm thickness. The current chosen design of the part product is shown on
figure 21.
Figure 21. The ‘Trolley Opener’ product design
3.2 Analysis of Injection Moulding Product
The simulation of the injection moulding process is an important part preliminary to
mould designing and manufacturing phase. It is a very crucial phase to understand how
the part design will affect the finished product and to foresee all the issue that might
happen during and post manufacturing process. It also helps as a guideline in determin-
ing or knowing certain process settings in the injection moulding machine before the
production begin, i.e. the cooling time and the melt temperature. It also gives the possi-
bility for the user to experiment to see if there is a possibility to make the moulding cy-

36
cle more effective and less time-consuming, i.e. by trying out different runner design to
get more effective fill time.
As mentioned earlier, the Autodesk Moldflow Plastic Insight is the necessary tool that I
going to be used for the experiment. It is the software that provides comprehensive se-
ries of definitive tools for simulating, analyzing, optimizing, and validating plastics part
and mould designs. Moldflow [11]. Some of the things that can be achieved during the
experiment of the Moldflow Software are:
The most suitable gate location for the product design
The most efficient design type of the runners
The efficient cooling time
The occurrence of possible weld lines
The maximum possible amount of cavities in the mould plate
The clamp force needed for certain cavities in the mould plate
The effects of cooling channels in relation to the time needed for the part prod-
uct to reach the ejection temperature
The possible occurrence of warpage and shrinkage
There are many other analyses that will be shown which can influence certain decision
of the design of the mould and the product itself. The purpose is solely to make the
mould design more efficient and get the maximum outcome of a mould plate.
Without the use of analysis software, most of the conventional mould designers will
have to use the rule of thumb which increases the risk of having a less-high quality fin-
ished product. It can also reduce the age cycle of the mould and the final product itself.
Many times the mould will have to be treated in such extreme settings only for it to
manufacture the mediocre quality of the plastic part. By doing lots of „Trial and error‟
method, the mould designer might end up having lots of troubleshooting in the produc-
tion process. This can really consume the time needed for manufacturing and it can be
avoided significantly by using the mould flow analysis in the preliminary stage. More-
over, the cost of the mould for Injection Moulding process can be quite high in compari-
son to other mass-production method, i.e. an extrusion dye. Therefore, by having the

37
ability to maximize the use of the mould plate, it can significantly save huge amount
additional cost in mould manufacturing.
The design that is used when importing in Moldflow Software is in the “Initial Graphics
Exchange Specification” (IGES) format, which is the data format that allows the digital
exchange amongst the Computer Aided Design (CAD) users. Once the product design
has been imported to Moldflow Software, the first step to do is to do the meshing of the
product design.
3.3 Meshing
Meshing is the collection of grids, edges and faces that constructs or represents the
shape of polyhedral object in the 3D graphic software. It is an important part in doing
analyses in Moldflow Software because good meshing will result in a good accuracy of
the analysis. The meshing consists of triangular elements, and nodes which are located
in each corner if the element. The elements provide the basis of analysis for the mould-
ing flow front calculation. There are 3 types of meshing technology that can be used,
and it relates quite much with of the type of the product design.
3.3.1 MidPlane Mesh
This mesh consists of triangular elements that form a two dimensional representation of
the part, through its centre. Every moulding process is supported by the Midplane mesh.
In general, the more mesh elements that represents the product design, the more detailed
the results will be, and the more time required for analysis. Midplane mesh is most suit-
able for a thin-wall product design, averagely below 2 mm.
3.3.2 Dual Domain analysis technology
This type of mesh is considered as a surface mesh along with Midplane type. It provides
the basis for the Dual Domain analysis, and it contains of a mixture of different types
including regions with traditional Midplane elements and surface shell elements. This
mesh type is appropriate when there are many thin regions in the part design.

38
In this study, the analysis will first be done in the Dual Domain and then converted to
3D Mesh. The reason is because Dual Domain does not require too much time to do the
analysis and it is faster to get a prediction result of the design. The 3D mesh type always
requires a good dual-domain mode as a starting point. Even if the analysis is pointed
straight to 3D Mesh, it will still calculate the analysis in Dual-Domain mesh type first.
The Trolley Opener product has a regional thickness of 3mm and therefore it is good to
analyze it first in Dual Domain and after that continues to the 3D analysis.
3.3.3 3D analysis technology
This type of mesh takes more consideration in the mesh calculation and the amount of
nodes and elements. It works well for a solid body because it gives a true 3D representa-
tion of the product design. It does not make the assumptions that are made for Mid
Plane or Dual Domain analysis. Hence it always requires additional time in the analysis.
The density of the mesh is the number of elements per unit area. A 3D mesh is appro-
priate for thick, complicated shaped models, while Midplane and Dual Domain meshes
are more applicable for thin-walled, shell-like parts. Moldflow [12].
3.4 Mesh Steps
1. When importing the part, make sure the option Dual Domain is chosen.‟
2. After importing the product part in IGES format, right click the option Create
Mesh in the study tasks pane and click Generate Mesh.
3. It is always advisable to accept the default Global Edge Length as an initial es-
timate. However, it always possible to cut down the length down to ½ of the ini-
tial value which will result of finer mesh and might give better result, but there is
a point where the additional mesh density has no marked increase in the value of
the analysis results but has generated significantly increased computational time.
4. Click Mesh Now.

39
3.5 Mesh Analysis
It is common for the meshing product design to have certain faults. They need to be
fixed in order to improve the mesh quality; therefore gives better analysis result. Once
the mesh is done, it is necessary to check the mesh statistics to see the general quality of
the mesh. This can be done by right-click the option Dual Domain Mesh in the study
tasks pane and click the Mesh Statistics option. It is shown in the figure 22.
Figure 22. Mesh Statistics for analysis
The first analysis about the mesh is the Connectivity Region. It represents how the re-
gion is connected as a whole design. It should always be connected and represented as
one region, therefore if the value is more than two it means that there is a disconnected
region somewhere in the design.
The second analysis will be the Edge Details; it is where the surface edge is checked. In
the Dual Domain and 3D, the Free Edges has to be zero; meaning that all the edges in
the elements is connected. A Manifold Edge is a mesh edge that has two elements at-
tached to it. This is the only edge type that is allowed not to be a zero in a Dual Domain
mesh. A Non-Manifold Edge means the edge that has more than two elements attached

40
to it. This is not acceptable in the Dual Domain; therefore the value has to be zero as
well.
Elements not oriented value has to be zero in the statistics, meaning all the elements
should be oriented in the mesh for assuring the proper data handling in the analysis and
computational process.
Intersections Details shows how the shared surfaces are reported. Elements intersec-
tions, overlapping elements, and duplicate beams are not allowed in the analysis.
Therefore all values should be zero.
Surface angle aspect ratio shows the ratio size of the geometry of each element. The
aspect ratio of an element is the ratio of the longest side to the height perpendicular to
that side (X / Y in the following figure). The red dot located on each corner of the trian-
gular element is called node.
Figure 23. Aspect ratio illustration. [Moldflow (12)]
The ideal aspect ratio for different types of analysis is:
Table 5. Max aspect ratio for different analysis. [Moldflow (12)]
Analysis Type Max Aspect Ratio
Midplane/Dual Domain 6:1
Midplane/Dual Domain—noncritical areas 20:1
Tetra elements 50:1
Dual Domain mesh before conversion to 3D 20:1
Cool and Warp analysis 6:1
Aspect Ratio is an important part when analyzing the mesh because it could cause sig-
nificant differences in the result of analysis performance with a good aspect ratio. In the
case of high aspect ratio, it will be a typical issue to have a slower analysis running and
less precise result due to the factor that the end node of the high aspect ratio element
will give a higher resistance factor to the flow front calculation. And the more they oc-

41
cur, the less precise the result will be. So it is best to avoid it from the very beginning,
or fix them if any.
The Match Percentage section is the percentage of how the mesh is valued as a whole
design representative. Mesh matching is a measure of how elements on one surface cor-
respond with elements on the opposite surface. It is an important measurement for de-
termining the correct part thickness and fibre orientation prediction. Its value should
typically be higher than 85% and is only applicable for Dual Domain mesh. In the statis-
tics report on figure 22, the match percentage is shown to be 95,9% which is a very high
and good percentage for analysis.
After looking at these factors, the meshing can be concluded as a quite satisfactory and
ready to be further analyzed in the dual domain. The study will also do the Cool and
Warp analyses which require the Max Aspect Ratio to be maximum 6:1. On that reason
it will be best to already lower the aspect ratio from the beginning so the analysis can be
run more precise, smoothly and to avoid any time-consuming meshing fixing between
one analysis and another. The steps of fixing the errors in the mesh will be discussed in
the next subject.
3.6 Mesh Error Fixing
There are many faults that can happen in the mesh statistics. It is very common to have
a faults or defects on the mesh, such as free edges, element overlaps, elements not ori-
ented, too high aspect ratio, and so on, due to the file conversion between one design
software to another. Most of those faults can be fixed automatically with the Mesh Re-
pair Wizard. The types of faults that are typically fixed with Mesh Repair Wizard are
free edges, overlapped elements, holes, and elements not oriented. The aspect ratio can
also be fixed with that method if there are not too many of them. But quite often that
method can only fix some of the high aspect ratio elements and unable to fix the rest.
When that happens, that is the time to manually fix the aspect ratio.

42
3.7 Max Aspect Ratio – Manual Fixing
One of the most typical causes when having a bad meshing is a high aspect ratio. It is an
important issue because the aspect ratio has a relation with the quality and accuracy for
the analysis result. It affects to the calculation of the flow front, hence the results of the
analyses. The better the aspect ratio of the element is, the more accurate the analyses
results are. Therefore, this chapter will show how to fix the aspect ratio so it can give
the most out of the analysis that will be performed.
When the part design has a shell-like type of product with the thickness of 3mm or
more, it is always good to check the analysis in the dual domain first, and then con-
verted to 3D mesh. If the Cool and Warp analysis are going to be done later, it requires
the maximum aspect ratio to be 6:1. Since it is going to be done sooner or later, it is al-
ways suggested to already improve the mesh from the beginning to have a low aspect
ratio in order to avoid any mesh fixing between analyses. So the purpose of this chapter
is to manually lower the max aspect ratio to 6:1.
The case presented below will show the method to manually fix the aspect ratio to a
recommended level which is below 6. There are several ways that can be done when
fixing the high aspect ratio element, e.g. insert nodes and merging nodes. On the exam-
ple on figure 22, the statistics shows the maximum aspect ratio of 18:1. If Fill + Pack
analysis is the furthest the user would like to apply to the design, then it is a fine case.
However, if the user is planning to apply the Cool and Warp analysis as well, then the
aspect ratio has to be lowered down to maximum 6.
Aspect Ratio Diagnostic is the tool needed to know the exact location of the high as-
pect ratio elements. It can be found on the Tools tab just next to the Tasks tab in the
Study Tasks pane. From there, click the Mesh Diagnostics, and Aspect Ratio Diag-
nostics.

43
Figure 24. Results of Aspect Ratio Diagnostics
On figure 24, it shows the location of the high aspect ratio elements in the design. In
order to fix them manually, there are several methods that can be done.
Swap Edge is a method used to change the direction of 2 elements that has different
aspect ratio to make it evenly distributed. The method is to click the high aspect ratio
element and then click the normal aspect ratio element next to it to make the two ele-
ments swap edge and balance the ratio.
Insert Node is the method to insert a node in between nodes to sub divides the long tri-
angular element and stabilizes the aspect ratio. After clicking the option Insert nodes
under the Tools tab, click the first node on one end of the longest line followed by the
second node on the other end of the line. The new node will then be inserted between
the longest lines of the triangular elements and will balance the aspect ratio.
Moving Node is the method to change the ratio of the particular triangular element by
moving a node of the triangular elements. It is imperative to know the axis of where the
node will be moved, and which direction the node should be moved in order to make the
aspect ratio more reasonable. Depending on the case, that can be done by either reduc-
ing the length in the longest part of the element, or by adding the height from the top
node of the triangle and move it in upward direction.

44
Merge node is the process of merging two nodes into one and eliminate an element in
order to change the size of the high aspect ratio element to a more reasonable ratio.
3.8 Gate Analysis Location
When the meshing quality has been improved, then it is a proper time to start doing the
analysis first in Dual Domain mesh mode. In Moldflow software, there are several
analyses that can be done to foresee the issue that might happen in the production and
the post-production phase of the product. It can help to determine some of the settings
for the machine and to experiment with it, and it can also be a guideline of how the
manufacturing process will run. However, it is necessary to know that sometimes the
issues that happens with the product is unavoidable due to the certain features of the de-
sign, and as a mould designer, it is necessary to have know-how knowledge to find the
alternative solution to the issues without affecting too much in the cost management or
time consumption.
In this study, the design has been evolving and improving in quite many series of ver-
sion. And each time the new version is made, the similar series set of analyses are run to
see the result and to see if there are any improvement or changing happen between one
series and another. With the intention of gaining deeper knowledge in the Moldflow
analysis software, this study will only show the latest versions and the analyses set ap-
plied to it.
Gate analysis is the type of analysis that can be done instantly, and it is a good start to
begin the analyses series in the product design. The purpose of the analysis is to explore
the most suitable gate location for the product design and to see the alternatives from
best to fair until the worst location for the gate in relation of the flow resistance during
the moulding cycle. In this case, the analysis is done in a single cavity product and is a
guideline to take into consideration in the next phase of mould design process. The re-
sult is shown in figure 25 and 26.

45
Figure 25. Gate Analysis (Top view)
Figure 26. Gate Analysis (3D View)
From the option Gating Suitability, it is shown variety of location that is possible for
the gate. The analysis represents the most optimum gate location based on the minimi-
zation of flow resistance. It rates the variety of possible gate location on the product;
blue area represents the best gate location, green area represents the fair gate location,
and worst ones are represented by the red area.
From figure 25, the best one occurs on the right and left side of the opener part, and it
goes down until just before the product ends. The middle part of the product also shows
a blue area meaning that it is also a good place to locate the gate in a 1 cavity mould.
Figure 26 also shows the analysis from the side view of the product, showing that the
blue area is also represented there. It is a good fact because it opens the possibility of
doing the side gating in the design; meaning that it opens a possibility to have a two
cavity design with the same gate location.
The other analysis set to look at is the Flow Resistance Indicator which indicates the
resistance of the flow front from the gates. Figure 27 shows the example of given a gate
in the right side of the product (top view), and the highest flow resistance, represented
in red, happens to be in the exact opposite of the given gate location. That is because the
molten thermoplastic material will be split up after the injection point due to the hole in

46
the opener design, and then meets again on the opposite side of the bottle opener. By the
time the polymer meets again, the resistance has got higher during the process.
Figure 27. Flow Resistance Indicator – Top View
The Gate analysis always gives suggestion of what the best gate location to be, but as a
mould designer, is always good to also look at factors other than minimum flow resis-
tance before the final decision of the gate location. Prior experience and experiment on
the design will also help to determine where the most suitable gate location for our
product is. Several factors that might affect the decision of gate location are Fill Time,
Clamp Force, and Weld Lines. After the Gate analysis has been applied, it is recom-
mended to try several gate options in the Fill Analysis to know the most suitable gate
location for the product.
3.9 Fill Analysis
The Fill Analysis is an important start of the analysis sequence in the Moldflow soft-
ware. This analysis provides the behaviour of the thermoplastic material in the mould
cavity during the filling phase. This analysis will calculate the flow front from the injec-
tion location; therefore an injection(s) location needs to be selected before running this

47
analysis. The analysis will continue running until the velocity/pressure (V/P) switch-
over point is reached.
When running the fill analysis in Dual-Domain mode, there are several results that one
can take into consideration. These things could give a prediction of how the manufactur-
ing process might run, how certain settings in the production cycle might be, and if it
would bring any issue in the visual or structural performance of the product. This analy-
sis can also help in determining if the gate location that has been chosen is the most
suitable for the product. Things in the results list that one needs to take into considera-
tion in this analysis are:
1. Fill Time
2. Pressure
3. Clamp Force
4. Weld Lines
In this analysis, the injection location will be located right in the middle of the product,
see figure 28. This analysis is provided with the assumption that the product is designed
as a single cavity mould; therefore located in the middle of the mould plate. The table 5
shows the result of the fill analysis of the product design.
Table 6. Fill Analysis result (2D)
Result Dual Domain Mode
Fill Time 0.7524 s
Pressure 1.45 MPa
Clamp Force 0.125 tonne
Pressure at Injection Location 1.5 MPa

48
Figure 28. Fill Time - Fill Analysis (2D)
Figure 29. Weld lines – Fill Analysis (2D)
Table 5 shows the fill time to be 0.75 s with merely 1.5 MPa Pressure and 0.125 tonne
clamp force. This might seem like a small number of results but this analysis is still a
preliminary prediction of the analysis series, also it predicts the injection cycle only in
the filling phase. Later on there will be series of analyses applied, which are the Fill +
Pack analysis and Fill + Pack + Cool + Warp analysis on 3D mesh mode; the result
might evolve and change consequently. As an early stage of prediction, the analysis has
already predicted a very noticeable mark of weld lines occurs on the product part on
figure 29.
Weld lines is quite an important factor to consider in the post-production cycle as it
might affect not just the visual appearance of the product but also the structural part. In
this case, the weld lines happen to be in the place where the molten plastic material
meets after being separated in the opener part. This issue is most likely to happen due to
the design of the bottle opener which splits the molten flow front on one side and makes
it meet again on the opposite side. Weld lines is also seen on the key chain part as a
mark of where the flow front meets again.
This issue seems to be unavoidable as the fact that weld lines will mostly happen when
the flow front splits and then meets together again which typically happen in the design
that has holes or more than 1 injection location. As with this design case, the weld lines
happens because the design of the bottle opener part which splits the melt flow on one

49
end and meets on the other end. The important thing to know about weld lines that it is
an unavoidable issue due to the design part but it certainly is moveable to a less critical
section of the product depends on the gate location.
When the weld line is unavoidable due to the design part, the alternative solution is to
direct it to the less critical part of the design. This can normally be done by injecting the
thermoplastic material in different location so that it meets and form the weld line in the
different location, or changing the regional wall thickness to set up a different fill time
so the thermoplastic material will meet on slightly different location as well. Other
things that might help to improve the quality of the weld line are to change the process
settings such as to increase the melt and mould temperature to allow the molten thermo-
plastic flow front to interfuse more.
Additionally, the weld lines analysis is only provided in the Dual-Domain Analysis,
therefore when making consideration about gate location or part thickness, it is best to
do it while still on the Dual-Domain mode. This will be done in later chapter when the
mould cavity is set to be 2 parts.
3.10 Fill Analysis on 3D Mesh
After looking over the result in the Fill analysis in Dual-Domain mode, it gives us the
big picture of how the process settings and production cycle will run. As mentioned ear-
lier, the Dual-Domain analysis is just an early prediction of several process settings and
to check if the mesh quality is high enough to be converted to 3D in order to give more
precise results. In conversion to 3D, it is recommended to check the mesh quality by
having the Mesh Statistics and see if the Aspect Ratio has reached to max 6 and high
enough Match Percentage, which are suggested to be more than 90%. The figure 30
shows the good example of mesh statistics before the conversion to 3D mode is made.

50
Figure 30. Mesh Statistics before conversion to 3D Mesh
The results in 3D Fill analysis will give better approximation of results in the real prac-
tical case. Accompanied by more advanced flow front calculation, 3D Mesh provides
several results in Fill Analysis which we could not get in the Dual-Domain Mesh. These
results listed are:
1. Density
2. Viscosity
3. Volumetric Shrinkage
4. Polymer Fill Region
5. Flow Rate
From these lists, volumetric shrinkage is quite an important part to check into. It gives
us a general descriptive of the possibility of shrinkage in the product part. Localized ar-
eas of high shrinkage can result in internal voids or sink marks when the part cools. The
shrinkage value should also be uniform throughout the part to ensure the good structural
and visual integrity of the part. Normally it can be seen in the Fill + Pack + Cool +

51
Warp Analysis. Avoid negative shrinkage on ribs if any as this can cause ejection prob-
lems.
Polymer Fill Region is an important part to take a closer look as well due to its analysis
that shows which elements are filled adequately during the filling phase. Table 6 shows
some of the important results generated by the Fill Analysis in 3D Mesh.
Table 7. Fill Analysis Result for 3D
Fill Analysis Result 3D Mode Dual Domain Mode
Fill Time 0.51 s 0.7524 s
Pressure 3.257 MPa 1.45 MPa
Clamp Force 0.4 tonne 0.125 tonne
Pressure at Injection location 3.4 MPa 1.5 MPa
Figure 31. Density – Fill Analysis 3D
Figure 32. Volumetric Shrinkage – Fill
Analysis 3D
Table 6 shows the fill time in 3D Mode is 0.51 s along with increase in pressure to be
3.327 MPa. The volumetric shrinkage in figure 32 is noted to be appearing mostly in the
key chain area, which is around 10%. The density can be seen on figure 31 that it is not
distributed evenly; the upper parts of the product are denser than the lower parts.
Meanwhile the polymer fill region shows a good result that the part is perfectly filled
with a quite small pressure and clamp force. These results are going to be compared

52
when the analyses series continue which are the Fill + Pack Analysis, and Fill+ Pack +
Cool + Warp Analysis.
3.11 Fill+Pack Analysis on 3D Mesh
A Fill + Pack analysis predicts the polymer flow inside the mould in the filling and also
the packing phase. The results generated in the Fill +Pack analysis is the generally the
same with the Fill analysis. It is typically used to more accurately predict the behaviour
of the thermoplastic material on the post-filling phase. The two figures below will show
the improvement of the behaviour of the thermoplastic material in the Filling and Pack-
ing phase of the moulding cycle.
Figure 33. Density - Fill + Pack Analysis 3D
Figure 34. Volumetric Shrinkage - Fill + Pack
Analysis 3D
The table 7 shows the result generated in the Fill + Pack analysis, the continuation of
the Fill Analysis in Dual Domain mode. It shows that most of the results are quite simi-
lar in numbers. However, when one takes a closer look on some of the analyses images
such as figure 33 and 34; it shows that even though the density and volumetric shrink-

53
age have the similar value than the previous analysis, but the thermoplastic material is
more evenly distributed after the Packing phase. It shows that in this phase of injection,
the thermoplastic material behaviour has become more stable and getting ready for cool-
ing time. The density of the product is evenly distributed, and the volumetric shrinkage
shows more uniformity and it helps to achieve the dimensional stability of the product.
Table 8. Results for Fill + Pack Analysis 3D
Result Fill+Pack Fill (3D) Fill (Dual Domain)
Fill Time 0.51 s 0.51 s 0.7524 s
Pressure at Injection Location 3.3 MPa 3.4 MPa 1.5 MPa
Clamp Force 0.4 tonne 0.4 tonne 0.125 tonne
Pressure 3.257 MPa 3.257 MPa 1.45 MPa
Volumetric Shrinkage 9.343 % 9.343 % -
Density 1.713 g/cm3 1.713 g/cm3 -
3.12 Fill + Pack + Cool + Warp Analysis on 3D Mesh
This analysis is the complete series of the analyses that can predict the behaviour of the
thermoplastic material starting in the cavity filling phase, packing phase, cooling phase
and post-cooling phase to see the possible warpage in the part product. Due to the use of
cooling phase as part of this analyses, it therefore requires to have a cooling channels
installed within the product design. The cooling channels are facilitated with the Cool-
ing Circuit Wizard. The cooling circuit used for this analysis has requirements shown
in table 8 below.
Table 9. Cooling Channels requirement for Cool + Warp analysis
Cooling Channel Requirement Dimension (mm)
Cooling Channel Diameter 10
Distance in respect to the Part Product 15
Number of channels 2
Distance between channels 30
Extension distance beyond the part product 40

54
Table 9 below shows the comparison between series of analyses that are used in the
same product design as a single cavity. As the final analysis, the Fill + Pack + Cool +
Warp analysis is the one that should be used as guideline as it calculates flow front pre-
diction of the moulding cycle starting from the filling phase until the post production of
possible warpage. It gives more information and more accurate prediction compared to
the previous three analyses done. However, the first three analyses are also beneficial to
be done because it shows how the thermoplastic behaviour changes in different phases
of injection cycle.
These results can be interpreted in many different ways, there is no right or wrong in the
analysis result. It is always a benefit to know how the simulation of injection moulding
can help to foresee the possible issues in the production cycle and also to get the infor-
mation as much as possible about the behaviour of the thermoplastic material during the
moulding cycle. It can affect how we calculate the production time, what machine to be
used for the particular mould plate, how heavy the part product might be and so on.
Table 10. Results of Fill + Pack + Cool + Warp Analysis
Result for 1 Cavity design Fill + Pack + Cool + Warp
Fill + Pack Fill Fill (2D)
Fill Time 0.5113 s 0.51 s 0.51 s 0.7524 s
Pressure 3.364 MPa 3.257 MPa 3.257 MPa 1.45 MPa
Clamp Force 0.4 tonne 0.4 tonne 0.4 tonne 0.125 tonne
Pressure at Injection Lo-cation
3.5 MPa 3.3 MPa 3.4 MPa 1.5 MPa
Volumetric Shrinkage 9.339 % 9.343 % 9.343 % -
Density 1.730 g/cm3 1.713 g/cm3 1.713 g/cm3 -
Time to reach ejection Temp
5.302 s - - 4.257 s
Mould Temperature 34.35 C - - -
Part Temperature 31.53 C - - -
Percentage Frozen layer 100 % - - -
Circuit Coolant Tempera-ture
25 – 25.06 C - - -
Deflection 0.2001 mm - - -

55
3.13 Two Cavity Design Analyses
The series of analyses in previous chapter are meant to provide a general image of how
the production cycle will run in a single cavity mould. This chapter will apply the simi-
lar type of analyses but with two cavities design. The result could then be compared to
the single cavity analyses and it could be used to determine if having two cavities mould
will give more efficient production time, and more benefits in terms of the quality
against the possible structural and visual issues.
For the two cavity design, the runner system is a necessity to connect the 2 part prod-
ucts. This is a quite an important part of this study chapter because the runner could af-
fect the balance of the melt flow, the melt temperature of the thermoplastic material, and
also the pressure drop at the injection point. Sprue and gate are part of the whole runner
system. One should take into consideration regarding the type, size, diameter, and the
length of the whole runner system because the runner system will become waste at the
end of the production cycle. It is always good to minimize the waste of the product by
optimizing the runner length and diameter. This can be done by doing the comparison
between runner types and analyze which one gives the most optimum cycle time.
Before we are doing the comparison of the runner types, it is necessary to first deter-
mine the most suitable gate location for the part product. In determining the most suit-
able gate location for our part product, one should take a look some factors that might
affect the decision, such as fill time, clamp force, pressure and weld lines.
The analysis will be done in Fill analysis in Dual Domain mode to show the comparison
of fill time, clamp force, pressure and weld lines between three different gate locations
in the part product. As seen in the earlier chapter Gate Analysis, the side part of the
product is shown to be a good area for the gate, making it possible to have a side gate in
this particular case. The table 10 shows the comparison of fill time, clamp force and
pressure from three different gate locations. And figure 35 – 37 shows different gate
locations and figure 38 - 40 shows the weld lines position for the three different gates,
respectively.

56
Figure 35. Gate Location A
Figure 36. Gate Location B
Figure 37. Gate Location C
Table 11. Comparison for different location of Gate
Figure A Figure B Figure C
Fill Time 0.7483 s 0.7524 s 0.7520 s
Clamp Force 0.08 tonne 0.09 tonne 0.07 tonne
Pressure 1.448 MPa 1.822 MPa 1.536 MPa
Figure 38. Weld Lines on gate location A
Figure 39. Weld line on gate location B

57
Figure 40. Weld line on gate location C
Based on figure 38 – 40, the most visible weld lines appear in the exact opposite of the
injection point, meaning that it is the point where the molten flow material will meet
after being split in the opener hole. Weld lines is an important factor because it is an is-
sue that could affect not only the visual issues but also the structural and strength issues
of the part product. Especially with having the design that contains quite big hole in the
opener part and key chain part, weld lines are most likely be the issue in determining the
gate location. In addition, the weld lines will play an important role because the part de-
sign requires maximum strength on the bottle opener part, and much less strength on the
trolley coin side.
Having a weld lines in the position of figure 38 and 40 is very risky considering the fact
that it might affect the strength of the bottle opener part. The bottle opener part is a very
crucial location because it requires maximum strength when opening the bottle cap, par-
ticularly on the right and left side of the part product. In addition to that, the cross sec-
tion area of the right and left side of the opener is not as wide as the upper part of the
product; meaning that having a weld line in the small cross section area increases the
risk of that area to break faster compare to having a weld lines in the wide cross section
area. The weld line that appears in figure 39 is pointed towards less critical part of the
product design. The cross section area of where the weld line appears is also wider than
the right and left side of the bottle opener; therefore any force that is applied to this area
will be spread more evenly. The location of the weld line in figure 39 gives an impor-

58
tant benefit because the pressure that is applied towards the trolley coin part is much
less than the bottle opener part; making it a safer location to have weld lines.
Based on the Gate Location analysis in earlier chapter, the injection point in figure 36
still appears as blue and going towards green colour; meaning that the location is still
considered as a good injection location. It shows that gate location B in figure 36 is the
most suitable gate location for our part product.
3.14 Runner Comparison
In this chapter, the comparison will be made between four types of runners. The purpose
of this comparison is to see if there is any time efficiency that can be achieved by com-
paring different type of runners. The measurement analysis will be set to four results,
which are the fill time, time to reach ejection temperature, clamp force and deflection.
As generally known, the runner system plays an important role in the manufacturing as
well because it affects the balance of melt flow, the pressure drop and the cooling time.
It is a necessary to have a balance runner system in order to ensure the balanced melt
flow and to avoid different filling time between cavities which can lead to over pack
and jetting.
3.14.1 Runner Type
The four types of runners that are going to be compared in this analysis are trapezoidal,
modified trapezoidal, half-circular, and full-circular. In this chapter, the runner has been
designed to fit the mould plate with the size of 156 x 156 mm; hence it will have a 5
mm diameter and 18 mm length to each cavity. The comparison is intended to deter-
mine which type of runners provides the most efficient cycle time in the production
process.
The runner types are designed in the Solid Edge as a part of the whole product. After
that it will be imported to Moldflow and it will be analyzed with the Fill Analysis in
Dual-Domain to get the comparison data.

59
The table 11 shows the comparison data that were achieved in the Fill Analysis. This
study comes with the consideration that these four runner types will deliver the thermo-
plastic material perfectly to the cavity. So the key aspect to be compared in this chapter
is related to the time efficiency and deflection.
Table 12. Comparison for different types of runners
Runners Type Fill Time Time to Reach Ejection Temp Deflection
Modified Trapezoidal 0.5465 s 7.132 s 0.5605 mm
Trapezoidal 0.5450 s 6.840 s 0.5234 mm
Full-Circular 0.5462 s 6.386 s 0.4588 mm
Half-Circular 0.5493 s 5.299 s 0.4546 mm
Table 11 shows that the half and full circular type of runners are the two best options for
being a runner system of the „Trolley Opener‟ product. It gives quite reasonably fill
time, and the Deflection is lower compared to the two types of trapezoidal. Time to
reach ejection temperature is also very efficient compared to other two. When one takes
a closer look to the machining process of half-circular and full-circular runners, some
factors that need to be taken into consideration are the manufacturing process of the
runners system and cooling channels it needs.
A full-circular runner is considered as the most ideal runner design because it ensures
more balance melt flow and cooling. In this type of runner system the machining will
take more time and higher precision due to the requirement of having to machine the
runner on both plates. If the alignment between runner coordination in both plates is not
perfectly match, it will require a significant extra time and cost to fix the flaw and it will
lead to a defect in the final product part. It can also affect the age cycle of the mould
plate itself. Due to this high precision that is required on making this type of runners, it
usually affects the mould price to be more expensive than other types. The mass of the
runners will also increase as part of the product weight; therefore leads to higher energy
waste in plasticizing. The cooling also plays role since it takes more time to cool down
larger runners.

60
On the other hand, the Half-circular runner has a lower surface area which means less
weight added to the product weight. The efficiency in manufacturing time will be higher
since it requires machining in one cavity plate only; reducing the risk of having the run-
ners misaligned in both plates. In the cooling point of view, it can be seen from the table
11 that it takes shorter time in the cooling phase due to smaller size. Providing the re-
sults that all the four types of runner system does its task to perfectly deliver the ther-
moplastic material to the cavity, in this case the half-circular channel will be the most
suitable option for the particular „Trolley Opener‟ product.
3.14.2 Runner Layout
The runner layout plays an important role in the pressure drop. There is a high possibil-
ity to have a significant pressure drop if the runner design involves a sharp angle or
sudden transition from big diameter runner to small diameter gate. The more pressure
drop occurs in the melt flow, the lower the pressure will be when the thermoplastic ma-
terial enters the cavity. Hence it may lead to longer filling time, increase the chance of
weld lines or in some cases may even lead to unfilled cavities. It is very essential to
keep the runner layout balanced and dimensionally stable. The 2 figures below shows
the illustration of having a straight type runner as a typical solution for 2 cavity mould,
and the „V‟ type runner as an alternative solution.
Figure 41. Straight type runner
Figure 42. ‘V’ type runner

61
The „V‟ type runner in figure 42 illustrates a better design than straight type runner be-
cause it provides more dimensional stability in the design by having the gate located in
a parallel position as the runner does. In a straight type runner in figure 41, the gate is
attached with 45o angle to the position of the runner. This position increases the possi-
bility of having pressure drop during the start of filling phase because the thermoplastic
flow will hit the runner wall first and then enters the cavity. By having the gate located
in a parallel position like in figure 42, it ensures that the pressure is still high when the
thermoplastic material enters the cavity.
The second advantage of the runner system in figure 42 is that it opens a possibility to
have more cavities than figure 41. With this runner type, it opens the possibility to de-
sign the cavities up until four cavities in a mould plate with the size of 156 x 156 mm.
With the runner type in figure 41, the maximum amount of cavities incorporated in the
mould plate is only three. So by using the „V‟ runner type, one can see if the possibili-
ties of having four cavities in the mould plate can bring more advantage in the produc-
tion cycle.
Table 13. Comparison of different layout of runner
Analysis Straight Line V type
Fill Time 0.8052 s 0.9560 s
Pressure at Injection Location 16 MPa 12 MPa
Time to reach ejection Temp 6.913 s 6.916 s
Pressure 16.01 MPa 11.52 MPa
Clamp Force 3.3 tonne 2.4 tonne
3.15 Three Cavity Design Analyses
Previous sections have discussed the possibilities of having two cavities instead of a
single cavity. In this section we will see the experiment of having three of cavities in-
stead of two. Having a multi cavities mould will relate quite much to the efficiency of
time which results in the efficiency of cost in production process. In general, it is always

62
good economical reason to, if possible, have a multi cavities mould in the mould pro-
duction because it will increase the speed of production, increase the efficiency of time,
and the possibility to achieve faster breakeven point.
One of the most important things, as mentioned in the earlier chapter as well, in having
the multi cavities mould is to have a stable and similar length and cross-section of the
runner system. The purpose is to achieve the balanced melt flow, avoid differences in
the pressure drop between cavities and distribute the material with the same fill time for
each cavity; therefore result to a high quality finished product. The design of the runner
system for this 3 cavity design can be seen on the figure 43, where each runner has a
equivalent length of 17,5 mm to each cavities.
Figure 43. Design for 3 cavities

63
3.16 Four cavity design analysis
As previously mentioned in the chapter of the Runner Layout, the four cavity design of
the „Trolley Opener‟ product is possible to be drawn in the mould plate with the size of
156 x 156 mm. The solution for it is to have the „V‟ runner type so that the design will
fit to the mould plate. The figure 44 shows the design for four cavities.
Figure 44. Design for 4 cavities
The Clamp force for the 4 cavity design is an important aspect to look at. Because as
can be seen earlier in the chapter 2.4.1, the injection moulding machine that is going to
be used in the manufacturing of this product will be able to provide the clamp force of
max 500 kN, which is equivalent of roughly 50 tonnes. As mentioned earlier, it is pru-
dent to always cross-check the clamp force either with manual calculation or simulation
software to double-check that the Injection Moulding machine will be able to provide
such force. So in this chapter the calculation of clamp force for 4 cavity designs will be
provided with the method of Crawford (1998), as similarly shown in the example 1 in
the chapter 2.4.
64
For the 4 cavity design, the flow path from the sprue to the end of the cavity is 92 mm.
Wall thickness is 3 mm, and the total area of the 4 cavity design is noted to be 4823,33
mm2, which is equal to 4.823 x 10
-3 m
2.
The data in figure 8 and table 1 in page 18 can be used as a reference for this method of
calculation to find the Mean Effective Pressure and Viscosity factor. With the wall
thickness of 3 mm, then the ratio of flow ratio path to the wall thickness is 92/3 = ~31.
Figure 8 show that the Mean Effective Pressure is 12 MN/m2. If 15% extra value is in-
corporated for uncertainties factor and the viscosity factor for Nylon 66 is applied, then
the Mean Effective Pressure will be 12 x 1.15 x 1.4 = 19.32 MN/m2.
So in total, the entire clamp force for 4 cavities design will be:
In chapter 4, the result table will also show the predicted clamp force analysed by the
MoldFlow simulation software in which the result from the software can be compared if
it has the similar result with the manual calculation above.
3.17 Rapid Prototyping of the Mould
Rapid prototyping is the method of manufacturing the prototype of the mould used for
injection moulding in the rapid way to illustrate in practical how the cavity of the prod-
uct will fit to the mould plate. The material Polywood will be used in this experiment
with the reason that the hardness of the material is not very high in comparison to other
material such as Aluminium; meaning that in Polywood, the machining can be done in a
much faster feed rate without the risk of breaking the tool and can saving a significant
amount of time. For the machining process, the HAAS Automatic Milling Machine will
be used to mill the product in the polywood material mould plate.
In this study, the rapid prototyping will be done with the software of MasterCAM, in
which the design will be imported from Solid Edge in the extension file of IGES. Once

65
imported, the pocket tool path functions needs to be used for milling the product as seen
on figure 45.
Figure 45. MasterCAM tool path of Trolley Opener
As seen on figure 45 above, the tools that are used for the machining are chosen based
on the available tools in the Arcada Plastic Laboratory. Nyroth [14]. There are two tools
chosen in this machining, which are the 4mm flat End mill and the 2mm flat End mill.
The 4 mm flat end mill is used to machine the all 4 cavity of the product, the holes on
the corners for locking mechanism of the mould plate, and the runner system. The 2 mm
flat end mill is needed to machine the bottom part of the „Trolley Opener‟ product be-
cause the 4 mm tool does not fit to mill the part around the key chain. However, there
are certain limitations applied to this machining. One example is the inability to manu-
facture the gate due to its small size of 1 mm, and 1 mm flat end mill is necessary to
create the gate in which it is not available currently in the tools list.
For the setting of the speed of the machining, it can be seen from figure 46 below. It
shows that feed rate can be set as high as 400 and spindle speed to be 2500. With this
setting, it takes approximately 30 minutes to manufacture the mould in the polywood

66
material which can be considered as a very fast way to produce a mould prototype for
injection moulding.
Figure 46. Tool speed settings
The figure 47 shows the verification of the tool path in the MasterCAM for the 4 cavity
design. The figure 48 shows the dimension of the mould plate referenced from HASCO
K-Catalogue [19] and illustrates how the 4 cavities design fit into the mould plate with
the size of 156 x 156 mm. The mould plate of size 156 x 156 mm is used in this study
due to its availability in Arcada Plastic Lab.

67
Figure 47. MasterCAM tool verification
Figure 48. Dimension of the mould plate

68
4 STUDY RESULTS
This chapter will show the overall comparison results having four scenario cases of a
single cavity design until four cavities design. In this comparison the part product will
be connected with the „V‟ type of runners of 5mm diameter and 17,5mm length, with
the half-circular type. The addition feature in this chapter is the attached sprue which is
designed based on the HASCO Z-Catalogue product [13]. The sprue is to have a 1.3o
taper angle with the start diameter of 3.5mm. The requirement of the sprue bushing is
shown on table 13.
Figure 49. Sprue Bushing design [HASCO (13)]
Table 14. Sprue Bushing dimension detail [HASCO (13)]
Order No. d2
[mm]
l
[mm]
d1
[mm]
Sr
[mm]
k
[mm]
d3
[mm]
Material No.
Z 51 /18X 36/3,5 18 36 3,5 - 18 38 68063
The results of this results table can be used to see if there is an optimization process in
having 4 cavities design in comparison to 1, 2, or 3 cavity(s) design. By knowing all the
important factors such as clamp force, cooling time, filling time, and so on, one can
make a better prediction on how the mould is going to be designed, and how much time
along with plastic material can be saved during the production process. Furthermore,
figure 49 shows the image of the mould prototype after the machining is done. It is
made with the polywood material mould plate and has the thickness of 23 mm.

69
Table 15. Overall comparison of different cavity option
Analysis 1 Cavity 2 Cavity 3 Cavity 4 Cavity
Fill Time 0.6175 s 0.6225 s 0.6229 0.6231 s
Pressure at In-
jection Location
8 MPa 26 MPa 28 MPa 31 MPa
Clamp Force 0.8 tonne 5 tonne 7.5 tonne 11 tonne
Density 1.731 g/cm3 1.736 g/cm
3 1.736 g/cm
3 1.736 g/cm
3
Pressure 8.138 MPa 26.02 MPa 27.33 MPa 30.7 MPa
Polymer Fill
Region
100 % 100% 100% 100%
Circuit coolant
temp
25 - 25.07 C 25 – 25.11 C 25 – 25.15 C 25 - 25.19 C
Circuit Flow
Rate
4.23 l/min 4.23 l/min 4.23 l/min 4.23 l/min
Time to reach
Ejection temp
8.119 s 8.751 s 8.972 s 9.605 s
Percentage fro-
zen layer
100% 100% 100% 100%
Deflection 0.2441 mm 0.6610 mm 0.7333 mm 0.5844 mm

70
Figure 50. Mould Prototype for Trolley Opener (Top View)
Figure 51. Mould Prototype for Trolley Opener

71
5 CONCLUSION
This chapter shows the conclusion that can be drawn from the table 14, in which can be
preliminary guidelines for the mould designer, mould maker, and the project manager.
The conclusions drawn are:
1. The gate analysis helps to define the most suitable gate for the product; it does
not necessarily have to be the best gate location but it has to be the most opti-
mum use for the particular product. Because of the gate analysis, the optimiza-
tion of the product to have a four cavities design is possible to be explored.
2. The filling time and the cooling time of a four cavity design does not increase to
four times longer than having a single cavity. So the cycle time for four cavities
design is the most optimum and efficient to be used in the production process.
3. The clamp force of four cavities is noted to be 11 tonnes which is equivalent to
roughly 107 kN; meaning that the Injection moulding machine ENGEL CC 90
will be able to provide the sufficient clamp force for the production process
4. The results obtained in the Moldflow analyses are done with the material set to
be PA66, which are Polyamid material with 60% glass fibre filled. PA66 is the
material chosen for the „Trolley Opener‟ during the Arcada‟s INNOPLAST pro-
ject in 2008.
5. The rapid prototyping of the mould plate was successfully produced in the end
of the study. With the use of MasterCAM and HAAS Milling machine, it opens
the possibility to manufacture the mould plate as a real example of the mould
design for four cavities.

72
6 DISCUSSIONS
For the mould maker and mould designer, the result of this study has shown how the
Moldflow software has been able to assists to get the most optimum design out of a part
product, and how to predict the future issue that might appear so it can either be solved
if possible or find the alternative solution for it. It also helps to provide guidelines as
well as additional point of view to look at rather than just solely counting on past ex-
perience. As for the project manager, this result can be used to pre-calculate the produc-
tion process in order to achieve faster break-even point. The use of Moldflow software
saves a significant amount of time in the mould design process, mould manufacturing
process, and production process.
Within this thesis study, there are still certain numbers of things that might be done dif-
ferently or maybe in a more detail process. Example given is that in this Thesis study,
the whole runner system including the gate and the sprue is pre-designed in Solid Edge
and imported afterwards. By designing it manually in Moldflow software, the more pre-
cise result might be achieved. Material analysis is also something lacks in this Thesis
study. It could be more informative if there is a comparison between certain plastic ma-
terials to see which one is the most suitable for the particular product.
Nevertheless, this Thesis study is intended to be the stepping stone for incorporating
more the use of Injection Moulding simulation software in the product design, mould
design, and product development that involves the use of injection moulding process.
The future research that might be done following this study is the experiment in produc-
tion process with the injection moulding machine for the product „Trolley Opener‟, and
also the comparison of data between the simulation software and the real practical case
of production process.

73
7 REFERENCES
1. Crawford, R., 1998. Plastic Engineering, 3rd
ed. Oxford: Butterworth – Heine-
mann
2. Scribd, 2010, Introduction to Thermoforming. [pdf]. Available at:
http://www.scribd.com /doc/36426840/26974689-Introduction-to-
Thermoforming [Accessed 4 September 2010]
3. Womer, T, 2010, Basic screw geometry : Things your screw designer does not
tell [pdf]. Available through: Xaloy inc website http://www.xaloy.com/pdf/
ThingsYourScrewDesigner2.pdf [Accessed 5 September 2010]
4. Answer Corporation, 2010. Sprue bushing. [online] Available at:
<http://www.answers.com /topic/sprue-bushing> [Accessed 5 September 2010]
5. Edward.A.Mucio. 1994. Plastic Processing Technology. USA. ASM Interna-
tional
6. DRM Associates, 2007. Injection Moulding Glossary. [online] Available at:
<http://www.npd-solutions.com/injectmouldglos.html> [Accessed 5 September
2010]
7. Rosato, D.V. Rosato, M.G. & Rosato, D.V., 2000. Concise Encyclopedia of
Plastics. Springer: Kluwer Academic Publishers
8. Wikimedia Foundation, Inc, 2010. Injection Moulding. [online] Available at:
<http://en.wikipedia.org/wiki/Injection_moulding> [Accessed 28 August 2010]
9. DSM Engineering Plastic, 2005, Design Guide. [PDF] USA: DSM Engineering
Plastic. Available at:
http://www.dsm.com/en_US/downloads/dep/designbroch05USweb.pdf [Ac-
cessed 10 August 2010]
10. Voho, M., 2010. Feed System, PT-2-007 Mould Design. [online via internal
VLE] Arcada University of Applied Science. Available through Blackboard
Learning System [Accessed 4 September 2010]
11. Moldflow Corporation, 2004. Moldflow Plastic Insight . [online] Framingham:
Moldflow Corporation. Available at
<http://www.moldflow.com/stp/pdf/eng/MPI5_B_E.pdf> [Accessed 4 Septem-
ber 2010]

74
12. Moldflow Plastic Insight, 2010. Moldflow Tutorial. [Software tutorial] Mold-
flow Corporation
13. HASCO Hasenclever GmbH + Co KG, 2010. Sprue Bushing Z51. [online]
Available at: <http://www.hasco.com/gb/content/view/full/16950> [Accessed 28
August 2010]
14. Nyroth, E. 2010. List of installed tools_14 [MS Word document], Arcada Uni-
versity of Applied Science. Available at: <https://people.arcada.fi/~nyrothe/>
[Accessed 31 August 2010]
15. Rees, H., 2001. Understanding Injection Mould Design. Munich: Hanser Pub-
lishers
16. Exxon Mobil Corporation, 2003. Polypropylene: Injection Moulding problems
& solutions. [pdf] Houston: Exxon Mobil Corporation. Available at
<http://www.scribd.com/doc/6200927/ Injection-Moulding-Problems-and-
Solutions> . [Accessed 4 September 2010]
17. IMR Org, 2010. Worldwide Plastic Injection Moulding Machine and Material
Resource for Plastics Engineers. [online] Available at: <http://www.injection-
moulding-resource.org> [Accessed 6 September 2010]
18. Canon Communication LLC, 2008. Modern Plastic Encyclopedia 2008. [pdf]
Los Angeles: Canon Communication LLC. Available at:
<http://www.modernplasticsworldwide-digital.com/mmpw/
2008encyclopedia/#pg1> [Accessed 6 September 2010]
19. HASCO Hasenclever GmbH + Co KG, 2010. Standards K Catalogue. [online]
Available at: <http://www.hasco.com/gb/content/download/20004/665058/
file/K_Katalog%20komp%20DGBF%2009.pdf> [Accessed 2 September 2010]